Stress-Testing States 2018 - Economy.com
←
→
Page content transcription
If your browser does not render page correctly, please read the page content below
ANALYSIS                    Stress-Testing States 2018
                            Introduction
Prepared by
                            It has been almost a decade since the Great Recession, and many are rightfully beginning to
Dan White                   look ahead to the next economic downturn. Recessions and their place in the business cycle
Daniel.White@moodys.com
Director                    are an accepted fact of life in any organization, especially government. Therefore, preparing for
                            recessions is an equally inescapable concept, with potentially devastating consequences for
Todd Metcalfe
                            those who treat it as an afterthought. To help state governments better prepare themselves
Todd.Metcalfe@moodys.com
Economist                   for the next recession, Moody’s Analytics has taken to performing annual stress tests on
                            their budgets. This paper will serve as an update to our 2017 state stress-testing exercise,
Sarah Crane
Sarah.Crane@moodys.com      estimating the amount of fiscal stress likely to be applied to state budgets under different
Economist                   recession scenarios and comparing that stress to the amount of money states have set aside
                            in reserve. This year’s exercise also expands the scope of stress-testing by including a look at
Contact Us                  how economic stress translates to public pensions.
Email
help@economy.com
U.S./Canada
+1.866.275.3266
EMEA
+44.20.7772.5454 (London)
+420.224.222.929 (Prague)
Asia/Pacific
+852.3551.3077
All Others
+1.610.235.5299
Web
www.economy.com
www.moodysanalytics.com
MOODY’S ANALYTICS

Stress-Testing States 2018
BY DAN WHITE, TODD METCALFE AND SARAH CRANE

I
    t has been almost a decade since the Great Recession, and many are rightfully beginning to look ahead to the
    next economic downturn. Recessions and their place in the business cycle are an accepted fact of life in any
    organization, especially government. Therefore, preparing for recessions is an equally inescapable concept,
with potentially devastating consequences for those who treat it as an afterthought. To help state governments
better prepare themselves for the next recession, Moody’s Analytics has taken to performing annual stress tests
on their budgets. This paper will serve as an update to our 2017 state stress-testing exercise, estimating the
amount of fiscal stress likely to be applied to state budgets under different recession scenarios and comparing
that stress to the amount of money states have set aside in reserve. This year’s exercise also expands the scope of
stress-testing by including a look at how economic stress translates to public pensions.

    Though this paper has a specific focus on                                                            No example is more instructive to that
states, most of the findings could apply just
                                                   Stress-Test Findings                             end than the Great Recession, which stands
as easily to cities, counties, and other local       »»   23 states have the funds they need        out for its singular impact on state budgets
governments. Focusing on states, though, is               for the next recession                    even when controlling for its historic sever-
key because their budgets not only experience        »»   10 states have most of the funds          ity. Almost every state was forced to take
some of the largest changes during a business             they need for the next recession          extraordinary fiscal action by raising rev-
cycle, but also because local government fiscal      »»   17 states have significantly fewer        enues or cutting spending during and after
conditions depend in large part on the amount             funds than they need for the next         the Great Recession. Many did both. In the
of aid and support they receive from states.              recession                                 five fiscal years immediately following the
    The overall results of the 2018 exercise                                                        start of the Great Recession, state and local
relative to a year ago are unmistakably posi-                                                       governments shed almost 750,000 work-
tive. State governments as a whole have           actly what happens to state budgets when          ers. Though this undoubtedly cut waste and
never been more prepared for a downturn;          they go through a recession. Breaking down        increased efficiency in many governments
23 have the amount of cash on hand they           the mechanics of a state budget during an         across the country, it also was a painful and
would need to weather a moderate recession        economic downturn is a relatively simple          disruptive change to many parts of the econ-
without having to raise taxes or cut spend-       process. As the economy worsens, demand           omy. The loss of so many mid-wage jobs
ing. However, the gap between the haves           for services goes up while revenue collec-        over so short a time is a big reason that the
and have-nots has widened, with 17 states         tions used to pay for those services fall. What   Great Recession was followed by the not-so-
now significantly unprepared for even a small     makes state and local governments unique          great recovery (see Chart 1). Research shows
downturn. This will result in some painful        in relation to the federal government is that     that extraordinary fiscal actions can harm re-
decision-making in those states in the next       their budgets are ultimately a zero-sum           gional and national economic recoveries, dif-
few years and will undoubtedly hold certain       game. Unlike the federal government, mu-          ferentiating performance relative to that of
states back in terms of economic perfor-          nicipal governments have no explicit way of       neighbors.1 Even a decade later, despite a na-
mance relative to their peers.                    issuing debt to pay for operations. Therefore,    tional unemployment rate of less than 4%,
                                                  their decisions are much more constrained         state and local government payrolls have not
This time really was different                    during a downturn and are often limited to
   To put the results of our 2018 stress tests    those focused on immediate survival as op-        1   Dan White, “A Tale of Two Recessions: The Influence of
                                                                                                        State Fiscal Actions on Regional Recoveries,” Moody’s Ana-
into context, it is helpful to look back at ex-   posed to economic policy.                             lytics Regional Financial Review (October 2011).

1     September 2018
MOODY’S ANALYTICS

Chart 1: The Jobs Difference                                                  employment did                    sion than during previous downturns because
                                                                              not peak nation-                  that spending has consistently grown at
 Employment, Dec 2007=100
                                                                              ally until August of              a much faster rate than the revenues that
 115
                                                                              that year, despite                states use to fund the program (see Chart
             Low-wage Mid-wage High-wage
 110                                                                          the fact that the                 3). By regularly outpacing revenues, the
                                                                              Great Recession                   zero-sum nature of state budgets has made
 105                                                                          was already in its                Medicaid a much larger portion of total state
                                                                              ninth month. At                   spending over time. Therefore, an increase
 100
                                                                              the outset of fiscal              of a few percentage points from one year to
  95                                                                          2009, beginning                   the next has a much larger impact on overall
                                                                              in July 2008 for                  budget flexibility than it has in the past.
  90                                                                          most states, many
       00 01 02 03 04 05 06 07 08 09 10 11 12 13 14 15 16 17 18                                                        Lesson 2: Recessions affect revenues
                                                                              legislatures were
 Sources: BLS, Moody’s Analytics
                                                                              enacting large bud-                      differently than they used to.
                                                   Presentation Title, Date 1 get increases, and                    Although Medicaid will play a larger role
recovered to prerecession levels, plateauing     some were even giving rebates to taxpayers                     in state budgets throughout the business
around 260,000 jobs below the previous           from what they thought were large sur-                         cycle, the lion’s share of recessionary state
peak. On a per capita basis, there are actually pluses. Though the recession had been in full                   fiscal effects will still come by way of de-
fewer state and local government employees swing for the better part of a year, many did                        creased tax revenues. However, the degree
today than at any time since the late 1980s.     not realize that something was genuinely                       to which that revenue will decline because
It is clear that this time really was different, wrong until the financial crisis hit a fever                   of a recession is not always as clear-cut as it
but how?                                         pitch that September with the collapse of                      might seem. The underlying relationship be-
     In previous research we identified three    Lehman Bros.                                                   tween state tax revenues and the economy
important lessons states need to have                Meanwhile, there was at least one person                   has changed considerably, and tax revenues
learned coming out of the Great Recession.       in nearly every state who knew, or should                      have become much more sensitive to fluc-
                                                 have known, that we had entered a recession                    tuations in the business cycle (see Chart 4).2
     Lesson 1: Recessions affect both            far earlier: the state Medicaid director. State                As an example of the gradual impact that
     revenues and spending.                      Medicaid enrollment jumped significantly                       changes in state tax policy have had, before
     The most recognizable sign of a recession   beginning in the first half of 2008 as the                     the 2001 recession, combined U.S. state tax
for most observers is a decline in tax revenue number of unemployed Americans began to                          revenues had never experienced an outright
collections. However, it is not necessarily the rise in earnest (see Chart 2). To those looking                 year-over-year decline. Such growing volatil-
first state budget indicator to set off reces-   for the signs, this indicated that things were                 ity is primarily the result of two long-term
sion alarm bells.                                not all right in the world of state fiscal policy              trends in state tax policy.
     For evidence, look back to the summer of almost a full nine months before state taxes
2008. State fiscal conditions were extremely began their first year-over-year declines.
                                                                                                                2      Dan White, “Falling Behind: State Tax Revenues and the
healthy in most cases, and states were still     Increased Medicaid spending was more of a                             Economy,” Moody’s Analytics Regional Financial Review
hiring workers. Indeed, state government         problem for states during the Great Reces-                            (October 2013).

Chart 2: Revenues and Spending                                                       Chart 3: Unsustainable Medicaid Path
% change yr ago                                                                      State and local governments, 1965Q1=100
    30                                                                               12,000
                                   Government social benefit payments                               Social benefit payments to individuals
    25                             State tax revenues                                10,000         (predominantly Medicaid)
    20                                                                                              Revenues
                                                                                      8,000
    15
    10                                                                                6,000
    5
                                                                                      4,000
    0
                                                                                      2,000
    -5
-10                                                                                        0
         05    06     07      08   09    10      11         12           13                    65   70     75       80       85     90      95      00        05        10          15
Sources: BEA, Moody’s Analytics                                                      Sources: BEA, Moody’s Analytics

                                                      Presentation Title, Date   2                                                                       Presentation Title, Date        3

2        September 2018
MOODY’S ANALYTICS

Chart 4: Revenues Are Stressing More                                         failure. Even under   marginally higher line of defense against
                                                                             the best of circum-   the recession. However, many states had
 State tax revenue, % change
                                                                             stances the most      no such flexibility, which limited their abil-
  20
                                                                             seasoned profes-      ity to react outside of budget cuts and tax
  15                                                                         sional forecaster     hikes. What is more, some of those states
  10                                                                         will not be able to   that did have sizable reserves had trouble
                                                                             consistently and      using them because of vagaries about what
   5                                                                         routinely predict     the fund balances were intended for. In
   0                                                                         the precise timing    these instances, policy debates about the
                                                                             and severity of       true intention of the reserves were often
  -5
                                                                             every oncoming        lengthy enough to delay the use of funds
 -10                                                                         recession. Nev-       until economic and fiscal conditions had
      50 55 60 65 70 75 80 85 90 95 00 05 10                                 ertheless, policy-    worsened considerably.
 Sources: Census Bureau, Moody’s Analytics
                                                                             makers must make           To properly prepare for the next recession,
                                                  Presentation Title, Date 4 major decisions       it is vital for states to formulate specifically tar-
    First, states are relying more heavily on   with the best available information. Though        geted reserve levels with intentionally crafted
increasingly progressive personal income tax    the risk of forecast error can never be elimi-     policy goals in mind. A well-crafted reserve
structures. Personal income tax revenues are    nated, it can be mitigated through proper          policy, fiscal flexibility, and careful planning are
much more volatile than sales taxes because     preparation and flexibility. This prepara-         still the best ways to protect a state’s budget
they are linked explicitly to personal income   tion can provide a government the fiscal           and economy in times of economic distress.
and not personal consumption, which proves resilience to help its economy thrive when              This, of course, raises one additional question:
much more stable over time. What is more,       others are struggling. If state policymakers       How much should a state put away in its rainy-
as part of more explicit tax reforms taking     are constantly in emergency mode, moving           day reserve to truly be prepared?
place largely over the past two decades,        from one crisis to the next, they will have             There is not always an easy answer.
states have exacerbated that volatility by      neither the time nor resources to focus on         Planning for the next recession involves
moving to more progressive personal income the longer-term investments necessary to                the difficult balancing act of putting away
tax structures targeting their highest earners. help their economies outcompete. These             enough money to avoid having to make a
More volatility is often an unintended side     include investments in education, infra-           major fiscal correction without stunting the
effect of that progressivity. By states putting structure and energy policies that help to         pace of economic growth by underfunding
more of their eggs in one basket, tax bases     keep a state ahead of the curve as it relates      investments in important public programs
have become more dependent on a smaller         to the 21st century economy. Without such          and services.
number of taxpayers with extremely volatile     investment, states can fall behind in terms             The tool that can make that balancing act
incomes, manifesting higher highs and lower     of competitiveness.                                more manageable is stress-testing.
lows for tax collections.                           One characteristic of the financial crisis
    The second reason that state revenues       that stands out most was the degree to             Stress-testing
have grown more volatile relates to distor-     which state and local governments were                 In the wake of the Great Recession, the
tions introduced through the growing use of     generally underprepared for any downturn,          private sector has become acutely aware
economically targeted tax incentives. These     let alone one the size of the Great Recession.     of the necessity of planning for economic
incentives can generate faster economic         This lack of preparation left some policymak-      downturns. Indeed, the U.S. government
growth but can also mean that some of           ers budgeting without a net at the absolute        and financial regulators in some cases have
the fastest growing pieces of an economy        worst time and has prevented them from             moved to require the private sector, specifi-
are growing tax-free. Additionally, these       being more proactive with their policy deci-       cally banks, to publicly stress-test for a rainy
incentives are often not tracked closely.       sions even a decade later.                         day. These same principles can be redirected
This decouples tax collections from underly-        At the start of fiscal 2008 the median         to government with the aim of protecting
ing measures of economic growth and can         rainy-day fund balance of states was ap-           budgets and the economy.
make life extremely difficult for economists    proximately 5% of general fund expendi-                Moody’s Analytics pioneered the concept
and revenue estimators trying to project        tures, which proved wholly inadequate to           of stress-testing the public sector several
revenue collections.                            offset the full brunt of the Great Recession.      years ago, after our first study found that a
                                                It should be noted that total state bal-           typical state would need a dedicated rainy-
    Lesson 3: Preparedness is key.              ances were higher, at just more than 8%            day reserve fund of approximately 8.5% of
    Past performance is not always a good       of general fund expenditures, giving those         general fund revenues to survive one year of
indicator of future success or, in this case,   states with adequate financial flexibility a       recessionary effects without cutting spend-

3     September 2018
MOODY’S ANALYTICS

ing or raising revenues.3 However, the out-                  recession scenarios          Chart 5: Alternative Scenarios
come of that paper was limited by the fact                   used in this stress test     U.S. Real GDP, prerecession peak=100
that it modeled the effects of a hypothetical                are assumed to begin         103
recession on state governments as a whole                    almost immediately.                        Moderate scenario
                                                                                          102           Severe scenario
to determine the outcome for an “average”                    The moderate re-                           Great Recession
                                                                                          101
state over one year.                                         cession scenario is
                                                                                          100
    Subsequent research and the experience                   roughly in line with
                                                                                           99
of Moody’s Analytics working with individual                 what economists
                                                                                           98
states and local governments have high-                      would characterize as
lighted the fact that the “average” state does               a “normal” recession,         97
not exist, and that a wide degree of variation               if such a thing exists,       96
can exist from one to another, especially in                 while the severe sce-         95
                                                                                              Yr 1                        Yr 2                   Yr 3
terms of revenue impacts. Also, a recession                  nario would be more
                                                                                          Sources: BEA, Moody’s Analytics
typically affects state budgets for at least                 in line with the losses
two years. To address those variations, in                   experienced during the                                                                 Presentation Title, Date 5

2017 Moody’s Analytics performed a full fis-                 Great Recession (see Chart 5). To perform               programs and discretionary needs such as
cal stress test on all 50 states individually                the stress tests, we had to make certain                education, by injecting more detailed spend-
over two fiscal years for a more accurate                    simplifying assumptions.                                ing data into the process.
representation of their potential recession-                     First, state balanced-budget requirements                Third, pension contributions are stressed
ary needs. This paper provides an update                     were assumed to hold true. State and local              as part of this exercise, but they are not
to those stress tests and expands the scope                  governments, in general, are not permit-                included in the final measure of fiscal shock
slightly to include a look at how economic                   ted to issue long-term debt for operations.             for purposes of determining a state’s over-
stress translates to public pensions as well.                There are some practical ways around this,              all preparedness. They are excluded from
    The mechanics of stress-testing are                      particularly with regard to public pensions             the fiscal shock measure because pension
relatively simple and depend on the use of                   and other post-employment benefits, but for contributions are not strictly mandatory in
alternative economic scenarios. As part of                   the purposes of this exercise, we assume that the same sense as Medicaid. States can, and
its monthly forecasting process, Moody’s                     state spending habits are constrained by the            often do, forgo making full contributions
Analytics generates 10 alternative economic                  amount of revenue collected.                            to their pension funds during times of eco-
scenarios to accompany the U.S. and re-                          Second, the levers used to stress state             nomic stress. However, following last year’s
gional baseline forecasts. These scenarios are               budgets were limited to changes in general              stress-testing exercise, significant interest
designed to capture the most pressing fore-                  fund revenues and Medicaid spending. As                 about the potential impact on public pen-
cast risks facing the economy today, varying                 revenues decline during a recession, subna-             sions convinced us that their inclusion as an
widely from an oil price shock all the way                   tional governments have less to spend, even             add-on to this exercise was important. What
to another major recession. These monthly                    as there is more demand for government                  is more, not fully funding pension contribu-
scenarios are estimated at the national, state               services. To avoid having to drastically cut            tions is a dangerous practice that can lead to
and metro-area level, and custom scenarios                   spending or raise taxes, governments would              out-of-control unfunded pension and other
can be generated at the county level, giving                 need to hold in reserve at least enough funds post-employment liabilities and has been an
policymakers the ability to stress-test fiscal               to make up for declines in revenue and meet             important contributor to many of the coun-
assumptions with increasing granularity.                     higher demands for services. These services             try’s worst fiscal situations.
    For this year’s exercise we again selected               obviously extend beyond Medicaid. Funding                    Fourth, the baselines with which these
two recession scenarios, one moderate and                    demands for other general fund programs                 alternative estimates are compared differ
one severe, to give us as broad a range of                   would also increase, along with programs                slightly from our previous work. In 2017,
downside options as possible. Before describ-                that typically fall outside the state general           Medicaid spending was compared with
ing these scenarios, it should be made clear                 fund such as unemployment insurance.                    its dynamic baseline forecast. However,
that Moody’s Analytics does not project a re-                However, these programs pale in compari-                because the Moody’s Analytics baseline in
cession to begin this year in its baseline fore-             son with the scope of Medicaid in terms of              2018 already includes a significant slow-
cast. Though another recession is inevitable,                their state general fund impact. Therefore,             down in economic growth toward the end
the odds of it beginning within the current                  the recessionary effects estimated on the               of the two-year stress-testing window, it
fiscal year are low. Nevertheless, each of the               spending side of the ledger in this exercise            proved inadequate for true stress-testing
                                                             should be considered a lower bound. More                purposes. As a result, the alternative fore-
3    Dan White, “Stress-Testing State and Local Reserves,”   precise spending effects could be estimated             casts for Medicaid and pensions in this pa-
     Moody’s Analytics Regional Financial Review (August
     2014).                                                  by individual states, both for social services          per will be compared with the “optimistic”

4      September 2018
MOODY’S ANALYTICS Moody’s Analytics scenario. The “optimistic” measures of un- Chart 6: All States Affected Differently scenario assumes stable economic growth derlying economic Fiscal shock from moderate recession, % of est. 2018 revenues through the entire two-year stress-testing growth, specifically window, putting it more in line with the the number of unem- 2017 baseline used for comparison purposes ployed people in the and making it a more effective baseline economy, to future Total sum of to judge overall levels of fiscal stress. As levels of Medicaid states=11 in 2017, alternative scenarios for revenues enrollment. Those will be judged compared with the underly- enrollment numbers ing rate of inflation. However, the forecast are then augmented
MOODY’S ANALYTICS

Table 1: Stress-Test Results - Moderate Recession Scenario
                               Tax revenue shortfall           Medicaid spending increase        Combined fiscal shock
                                      %                $ mil             %               $ mil          %                $ mil
Sum of states                     -9.0%       $(75,057.40)            2.1%         $17,492.11      -11.1%        $(92,549.51)
Alabama                           -9.5%           $(801.82)           2.0%            $172.17      -11.6%            $(973.98)
Alaska                           -45.6%         $(1,065.61)           0.7%             $17.29      -46.3%          $(1,082.91)
Arizona                          -10.9%         $(1,062.51)           2.2%            $210.55      -13.1%          $(1,273.05)
Arkansas                          -6.3%           $(342.55)           1.3%             $69.29       -7.6%            $(411.84)
California                        -8.9%       $(11,319.31)            2.5%          $3,159.27      -11.4%        $(14,478.59)
Colorado                          -8.9%         $(1,028.79)           4.1%            $479.26      -13.0%          $(1,508.04)
Connecticut                       -6.3%         $(1,168.64)           0.9%            $165.62       -7.2%          $(1,334.26)
Delaware                          -6.0%           $(253.44)           1.3%             $55.25       -7.3%            $(308.69)
Florida                           -9.1%         $(2,905.20)           4.0%          $1,265.08      -13.1%          $(4,170.28)
Georgia                           -9.0%         $(2,145.84)           0.9%            $210.57       -9.9%          $(2,356.41)
Hawaii                            -8.9%           $(666.38)           1.1%             $78.86       -9.9%            $(745.24)
Idaho                            -12.5%           $(453.27)           1.6%             $59.37      -14.2%            $(512.64)
Illinois                          -9.3%         $(3,350.62)           2.0%            $731.61      -11.4%          $(4,082.22)
Indiana                           -6.8%         $(1,059.77)           2.0%            $305.00       -8.7%          $(1,364.78)
Iowa                              -7.6%           $(549.88)           1.6%            $112.74       -9.1%            $(662.63)
Kansas                            -8.3%           $(562.83)           1.5%            $104.45       -9.8%            $(667.28)
Kentucky                          -7.2%           $(778.29)           1.6%            $174.53       -8.8%            $(952.82)
Louisiana                        -20.4%         $(1,954.35)           1.3%            $128.47      -21.7%          $(2,082.82)
Maine                             -7.7%           $(271.15)           2.2%             $78.49      -10.0%            $(349.64)
Maryland                          -7.1%         $(1,212.29)           1.6%            $280.74       -8.8%          $(1,493.03)
Massachusetts                     -5.7%         $(2,441.00)           1.1%            $487.22       -6.8%          $(2,928.22)
Michigan                         -10.8%         $(1,054.72)           4.7%            $458.14      -15.4%          $(1,512.86)
Minnesota                         -8.7%         $(1,891.00)           2.1%            $457.81      -10.8%          $(2,348.81)
Mississippi                       -9.1%           $(508.73)           1.3%             $70.72      -10.3%            $(579.46)
Missouri                          -9.6%           $(886.47)           4.3%            $394.49      -13.9%          $(1,280.96)
Montana                          -11.1%           $(255.42)           0.6%             $13.96      -11.7%            $(269.38)
Nebraska                          -6.4%           $(286.07)           1.3%             $57.87       -7.6%            $(343.94)
Nevada                            -9.2%           $(360.90)           2.0%             $78.24      -11.2%            $(439.13)
New Hampshire                     -8.7%           $(132.74)           3.6%             $54.85      -12.3%            $(187.59)
New Jersey                       -11.9%         $(4,174.24)           0.9%            $323.73      -12.8%          $(4,497.98)
New Mexico                        -7.6%           $(482.25)           0.8%             $48.76       -8.4%            $(531.00)
New York                         -10.2%         $(7,301.52)           1.8%          $1,263.31      -12.0%          $(8,564.83)
North Carolina                    -5.1%         $(1,170.64)           2.0%            $473.47       -7.1%          $(1,644.11)
North Dakota                     -22.0%           $(392.31)           1.0%             $17.15      -23.0%            $(409.46)
Ohio                              -7.5%         $(2,406.44)           4.4%          $1,434.01      -11.9%          $(3,840.45)
Oklahoma                         -15.2%           $(992.05)           2.8%            $182.96      -18.1%          $(1,175.02)
Oregon                            -5.1%           $(496.68)           2.3%            $218.97       -7.4%            $(715.65)
Pennsylvania                      -5.4%         $(1,892.19)           1.9%            $658.60       -7.3%          $(2,550.79)
Rhode Island                      -6.5%           $(251.03)           1.8%             $67.51       -8.3%            $(318.54)
South Carolina                   -11.3%           $(899.38)           2.4%            $192.67      -13.7%          $(1,092.05)
South Dakota                      -5.6%             $(87.23)          1.6%             $24.79       -7.1%            $(112.01)
Tennessee                         -6.6%           $(940.20)           2.3%            $328.51       -8.9%          $(1,268.72)
Texas                            -12.9%         $(7,065.61)           1.5%            $814.90      -14.4%          $(7,880.51)
Utah                              -9.9%           $(663.71)           1.9%            $124.78      -11.7%            $(788.49)
Vermont                           -9.2%           $(144.90)           2.6%             $40.70      -11.8%            $(185.60)
Virginia                          -7.4%         $(1,507.15)           2.5%            $511.89      -10.0%          $(2,019.03)
Washington                        -7.4%         $(1,581.26)           1.6%            $346.12       -9.0%          $(1,927.39)
West Virginia                     -6.8%           $(289.23)           1.2%             $50.00       -8.0%            $(339.22)
Wisconsin                         -9.2%         $(1,485.51)           2.6%            $415.13      -11.8%          $(1,900.64)
Wyoming                           -5.7%             $(64.28)          2.0%             $22.24       -7.7%             $(86.52)
Source: Moody’s Analytics

6     September 2018
MOODY’S ANALYTICS
Table 2: Stress-Test Results - Severe Recession Scenario
Tax revenue shortfall Medicaid spending increase Combined fiscal shock
% $ mil % $ mil % $ mil
Sum of states -15.0% $(125,874.77) 2.8% $23,245.80 -17.8% $(149,120.57)
Alabama -14.6% $(1,232.82) 2.7% $226.16 -17.3% $(1,458.98)
Alaska -64.0% $(1,495.51) 1.0% $24.42 -65.0% $(1,519.94)
Arizona -16.1% $(1,563.36) 2.9% $282.86 -19.0% $(1,846.22)
Arkansas -7.7% $(417.28) 1.8% $96.91 -9.4% $(514.19)
California -15.1% $(19,268.30) 3.3% $4,199.17 -18.4% $(23,467.48)
Colorado -15.7% $(1,822.04) 5.3% $618.97 -21.0% $(2,441.01)
Connecticut -12.0% $(2,224.71) 1.2% $227.93 -13.3% $(2,452.64)
Delaware -12.6% $(534.99) 1.7% $74.13 -14.4% $(609.12)
Florida -16.6% $(5,277.78) 5.1% $1,629.68 -21.7% $(6,907.45)
Georgia -14.8% $(3,511.69) 1.2% $285.07 -16.0% $(3,796.77)
Hawaii -14.7% $(1,100.33) 1.4% $104.10 -16.0% $(1,204.43)
Idaho -20.7% $(747.16) 2.2% $79.21 -22.9% $(826.38)
Illinois -16.2% $(5,805.01) 2.7% $976.79 -18.9% $(6,781.80)
Indiana -13.6% $(2,126.58) 2.5% $398.04 -16.1% $(2,524.62)
Iowa -13.6% $(987.58) 2.1% $152.00 -15.7% $(1,139.59)
Kansas -14.9% $(1,018.21) 2.0% $139.63 -17.0% $(1,157.85)
Kentucky -13.3% $(1,436.71) 2.1% $232.68 -15.4% $(1,669.39)
Louisiana -31.8% $(3,049.96) 1.8% $175.58 -33.6% $(3,225.54)
Maine -12.6% $(441.26) 3.1% $107.07 -15.6% $(548.33)
Maryland -11.9% $(2,038.14) 2.2% $380.58 -14.2% $(2,418.73)
Massachusetts -10.7% $(4,591.13) 1.5% $655.85 -12.2% $(5,246.97)
Michigan -16.2% $(1,588.11) 6.1% $599.87 -22.3% $(2,187.99)
Minnesota -14.6% $(3,185.15) 2.7% $596.99 -17.4% $(3,782.14)
Mississippi -13.8% $(771.41) 1.7% $97.26 -15.5% $(868.67)
Missouri -16.2% $(1,488.21) 5.7% $522.94 -21.9% $(2,011.15)
Montana -17.7% $(405.50) 0.9% $19.63 -18.5% $(425.13)
Nebraska -11.5% $(516.35) 1.7% $78.47 -13.2% $(594.82)
Nevada -16.7% $(655.48) 2.7% $103.80 -19.4% $(759.28)
New Hampshire -14.1% $(214.70) 4.9% $73.92 -19.0% $(288.62)
New Jersey -16.9% $(5,951.46) 1.2% $436.95 -18.1% $(6,388.41)
New Mexico -12.6% $(797.50) 1.1% $67.50 -13.7% $(865.00)
New York -14.7% $(10,519.43) 2.4% $1,716.06 -17.1% $(12,235.49)
North Carolina -9.6% $(2,226.98) 2.7% $615.49 -12.3% $(2,842.47)
North Dakota -32.3% $(575.72) 1.4% $24.05 -33.7% $(599.77)
Ohio -14.6% $(4,704.49) 5.9% $1,893.33 -20.4% $(6,597.82)
Oklahoma -21.4% $(1,394.60) 3.7% $242.34 -25.1% $(1,636.95)
Oregon -11.7% $(1,133.01) 3.0% $287.65 -14.7% $(1,420.66)
Pennsylvania -10.5% $(3,660.93) 2.6% $897.36 -13.1% $(4,558.29)
Rhode Island -10.8% $(415.04) 2.4% $91.42 -13.1% $(506.45)
South Carolina -17.2% $(1,364.26) 3.2% $252.77 -20.3% $(1,617.03)
South Dakota -9.6% $(150.23) 2.1% $33.12 -11.7% $(183.35)
Tennessee -12.1% $(1,735.78) 3.0% $433.33 -15.2% $(2,169.11)
Texas -21.5% $(11,759.14) 2.0% $1,099.05 -23.6% $(12,858.18)
Utah -15.5% $(1,043.20) 2.4% $159.26 -17.9% $(1,202.46)
Vermont -13.4% $(211.12) 3.5% $54.79 -16.9% $(265.91)
Virginia -12.0% $(2,435.52) 3.4% $679.19 -15.4% $(3,114.71)
Washington -14.4% $(3,087.96) 2.1% $459.82 -16.5% $(3,547.78)
West Virginia -14.8% $(625.41) 1.6% $68.06 -16.4% $(693.47)
Wisconsin -14.7% $(2,375.15) 3.4% $544.95 -18.1% $(2,920.10)
Wyoming -17.2% $(192.39) 2.6% $29.57 -19.8% $(221.97)
Source: Moody’s Analytics
7 September 2018MOODY’S ANALYTICS
Chart 7: Pushing the Envelope Chart 8: More States Ready for Recession
Duration of business cycle expansion, mo, state fiscal yr Difference between actual and necessary total balances, ppts
140
FY2020 FY2019 History
120
100
80
Post-WWII avg
60
40
20 5
45 48 53 58 61 70 75 80 82 91 01 09
Sources: NBER, Moody’s Analytics Sources: National Assn. of State Budget Officers, Moody’s Analytics
Presentation Title, Date 7 Presentation Title, Date 8
the more noncyclical industries of healthcare Measuring preparedness for a moderate downturn. Leading the way
and education. With the amount of potential fiscal shock once again are commodity states Wyoming,
Variations in state fiscal stress from high- remaining relatively unchanged from last Alaska and West Virginia, which are used to
er Medicaid spending were also significant, year’s stress-testing exercise, the real ques- budgeting under uncertain circumstances
though some general patterns did again tion to be answered by the 2018 update is: (see Chart 8). What was most encouraging,
emerge similar to those observed in 2017. Are states any more prepared than they were however, was the improvement of several
The simulated Medicaid shock to states was a year ago? A year on from last year’s exer- states not traditionally dependent on com-
again less than generally experienced during cise the U.S. economy is nearing a high note modities, including South Carolina, Iowa
the Great Recession at least in part because (see Chart 7). The national unemployment and especially California, which has almost
of changes stemming from the Affordable rate is at a 20-year low, and GDP is growing doubled its preparedness level from last year.
Care Act. As of the publishing of this paper, at its fastest pace in years. The bad news is The bad news is that this improvement
32 states and the District of Columbia had that this means we are likely one year closer is not uniform. While the number of states
opted in to the Medicaid expansion provi- to the next recession. The Moody’s Analytics fully prepared for a moderate recession has
sions of the ACA. By taking on these addi- baseline forecast puts the highest odds of increased from 2017, so has the number of
tional enrollees, these states have increased the next recession in mid-2020, which would states that are significantly unprepared. At
their long-term liabilities, and as a result have the biggest impact on most states’ least 17 are more than 5 percentage points
Medicaid will continue to make up an even fiscal 2021 budgets. The fiscal 2021 budget away from the reserves they need to survive
larger share of their general fund budgets. season is not all that far away, and for some even a moderate recession, up from 15 in
However, an interesting side effect of these biennial states is already here, making reces- 2017. What is worse, the difference between
increased liabilities is less volatility as it re- sion preparations all the more urgent. the states that are fully prepared and those
lates to the business cycle. Fortunately, this year’s exercise was not that are not is growing wider. Of the ap-
Because a larger proportion of their all doom and gloom. The overall results of proximately $78 billion in total balances
populations are already enrolled in Medic- this test relative to 2017 were unmistakably that states were estimated to have on hand
aid, states have fewer citizens left over to positive, but like all good economic stories at the end of fiscal 2018, more than $60
be caught up in the ebb and flow of enroll- there is always some bad news to go with billion, or 77%, were concentrated in those
ment changes from the business cycle. This the good. top 23 states. Some among those least-
is evident when comparing the forecasts for First the good. State governments as a prepared would need to either raise taxes
states that have opted into the Medicaid whole are much better prepared for a reces- or cut spending by upward of 10% of their
expansion and those that have not. Opt-in sion in 2018 than they were in 2008. Indeed, entire budget if a recession were to impact
states are likely to see baseline Medicaid overall state balances have risen to all-time their state this fiscal year. Such a necessity
spending grow faster over the long run, but highs, meaning that states are better pre- would carry major economic implications
they also see less volatility during changes pared than ever for a downturn. A full 23 for their respective recoveries, likely creat-
in the business cycle. This will keep Medicaid states are within 1 percentage point of the ing enough fiscal drag to cause those state
growing as a share of overall state spending reserves they need to weather a moderate economies to underperform for some time.
for the foreseeable future but also keep re- recession this fiscal year (see Tables 3 and 4). The typical state will emerge from the next
cessionary shocks muted compared with the That represents marked improvement from a recession with a fiscal drag of as much as
Great Recession. year ago, when only 16 states were prepared 0.25% of gross state product, but Chart 9
8 September 2018MOODY’S ANALYTICS
Table 3: State Preparedness - Moderate Recession Scenario
% of estimated fiscal 2018 revenues
Fiscal shock Rainy-day Total
Rainy-day balances* Total balances* moderate recession surplus/shortfall** surplus/shortfall**
Wyoming 137.2% 137.2% -7.7% 129.5% 129.5%
Alaska 101.0% 101.0% -46.3% 54.6% 54.6%
West Virginia 17.0% 23.8% -8.0% 9.0% 15.8%
Oregon 9.7% 16.8% -7.4% 2.3% 9.4%
Hawaii 4.3% 17.7% -9.9% -5.7% 7.7%
Delaware 5.5% 12.8% -7.3% -1.8% 5.5%
Washington 6.3% 14.1% -9.0% -2.6% 5.2%
Texas 19.2% 19.4% -14.4% 4.7% 5.0%
Nebraska 7.4% 10.7% -7.6% -0.3% 3.1%
North Carolina 7.9% 10.1% -7.1% 0.8% 3.0%
South Dakota 10.1% 10.1% -7.1% 2.9% 2.9%
Idaho 10.9% 16.8% -14.2% -3.3% 2.6%
Indiana 9.2% 11.0% -8.7% 0.4% 2.3%
New Mexico 9.8% 9.8% -8.4% 1.4% 1.4%
Nevada 4.3% 12.4% -11.2% -6.9% 1.2%
New York 2.5% 12.8% -12.0% -9.5% 0.8%
Georgia 9.7% 10.4% -9.9% -0.2% 0.5%
Alabama 9.4% 11.7% -11.6% -2.2% 0.1%
South Carolina 6.4% 13.6% -13.7% -7.3% -0.1%
Tennessee 5.6% 8.7% -8.9% -3.3% -0.2%
Minnesota 9.2% 10.6% -10.8% -1.6% -0.2%
Iowa 8.6% 8.7% -9.1% -0.5% -0.5%
California 9.9% 10.8% -11.4% -1.5% -0.6%
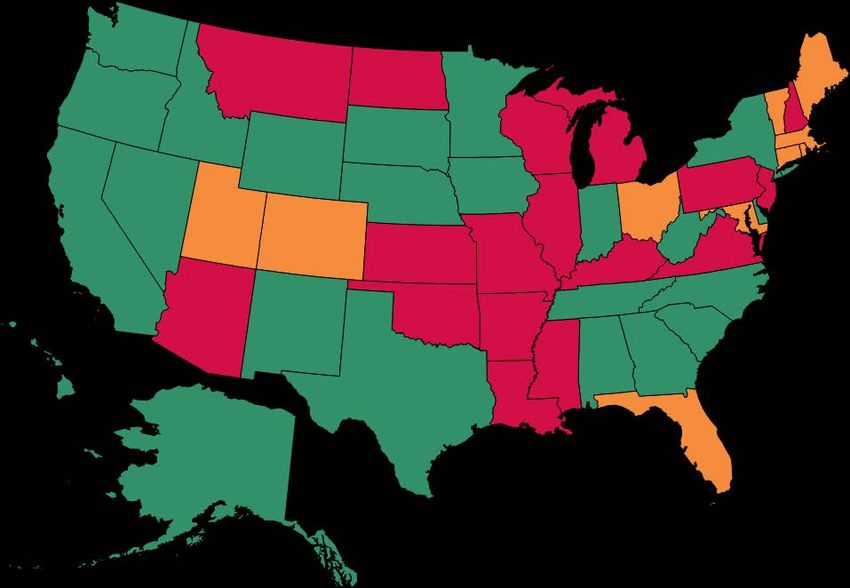
Sum of states 6.7% 9.3% -11.1% -4.3% -1.7%
Maine 6.0% 8.2% -10.0% -4.0% -1.8%
Connecticut 4.7% 4.7% -7.2% -2.5% -2.5%
Maryland 5.0% 6.2% -8.8% -3.7% -2.5%
Colorado 10.1% 10.1% -13.0% -2.9% -2.9%
Rhode Island 5.1% 5.1% -8.3% -3.2% -3.2%
Utah 7.6% 8.4% -11.7% -4.2% -3.3%
Massachusetts 3.2% 3.4% -6.8% -3.6% -3.5%
Vermont 7.9% 7.9% -11.8% -3.8% -3.8%
Ohio 6.3% 7.9% -11.9% -5.6% -4.0%
Florida 4.5% 8.8% -13.1% -8.7% -4.4%
Arkansas 2.3% 2.3% -7.6% -5.2% -5.2%
Michigan 9.1% 10.2% -15.4% -6.4% -5.3%
Mississippi 4.9% 4.9% -10.3% -5.4% -5.4%
New Hampshire 6.6% 6.6% -12.3% -5.8% -5.7%
Kansas 0.0% 3.9% -9.8% -9.8% -5.9%
Wisconsin 1.8% 5.2% -11.8% -10.0% -6.6%
Pennsylvania 0.0% 0.1% -7.3% -7.3% -7.2%
Illinois 0.0% 3.8% -11.4% -11.3% -7.6%
Arizona 4.8% 5.2% -13.1% -8.3% -7.9%
Missouri 3.3% 6.0% -13.9% -10.6% -8.0%
Virginia 1.4% 1.4% -10.0% -8.6% -8.5%
Kentucky 0.1% 0.1% -8.8% -8.7% -8.7%
Montana 0.0% 2.5% -11.7% -11.7% -9.2%
New Jersey 0.0% 2.1% -12.8% -12.8% -10.7%
North Dakota 4.1% 7.9% -23.0% -18.9% -15.1%
Oklahoma 1.4% 2.7% -18.1% -16.6% -15.3%
Louisiana 3.3% 6.1% -21.7% -18.4% -15.6%
* Rainy-day and total balances are estimated as of the end of fiscal 2018 by NASBO members. All numbers are shown as a % of fiscal 2018 general fund revenues also estimated by
NASBO members.
** The estimated shortfalls refer to the amount of fiscal shock that would not be covered by actual reserves under a moderate recession scenario. A negative percentage means
a state would not be able to make up for the entire fiscal shock associated with a moderate recession.
Source: Moody’s Analytics
9 September 2018MOODY’S ANALYTICS
Table 4: State Preparedness - Severe Recession Scenario
% of estimated fiscal 2018 revenues
Fiscal shock Rainy-day Total
Rainy-day balances* Total balances* moderate recession surplus/shortfall** surplus/shortfall**
Wyoming 137.2% 137.2% -19.8% 117.4% 117.4%
Alaska 101.0% 101.0% -65.0% 35.9% 35.9%
West Virginia 17.0% 23.8% -16.4% 0.6% 7.4%
Oregon 9.7% 16.8% -14.7% -5.0% 2.1%
Hawaii 4.3% 17.7% -16.0% -11.8% 1.6%
Delaware 5.5% 12.8% -14.4% -8.9% -1.6%
South Dakota 10.1% 10.1% -11.7% -1.6% -1.6%
North Carolina 7.9% 10.1% -12.3% -4.3% -2.2%
Washington 6.3% 14.1% -16.5% -10.2% -2.4%
Nebraska 7.4% 10.7% -13.2% -5.8% -2.5%
New Mexico 9.8% 9.8% -13.7% -3.9% -3.9%
Texas 19.2% 19.4% -23.6% -4.4% -4.1%
New York 2.5% 12.8% -17.1% -14.6% -4.3%
Indiana 9.2% 11.0% -16.1% -7.0% -5.1%
Georgia 9.7% 10.4% -16.0% -6.3% -5.6%
Alabama 9.4% 11.7% -17.3% -8.0% -5.7%
Idaho 10.9% 16.8% -22.9% -12.0% -6.0%
Tennessee 5.6% 8.7% -15.2% -9.6% -6.5%
South Carolina 6.4% 13.6% -20.3% -13.9% -6.7%
Minnesota 9.2% 10.6% -17.4% -8.2% -6.8%
Nevada 4.3% 12.4% -19.4% -15.1% -7.0%
Iowa 8.6% 8.7% -15.7% -7.1% -7.1%
Arkansas 2.3% 2.3% -9.4% -7.1% -7.1%
Maine 6.0% 8.2% -15.6% -9.6% -7.5%
California 9.9% 10.8% -18.4% -8.5% -7.6%
Maryland 5.0% 6.2% -14.2% -9.1% -7.9%
Rhode Island 5.1% 5.1% -13.1% -8.1% -8.1%
Sum of states 6.7% 9.3% -17.8% -11.1% -8.5%
Connecticut 4.7% 4.7% -13.3% -8.5% -8.5%
Massachusetts 3.2% 3.4% -12.2% -9.0% -8.8%
Vermont 7.9% 7.9% -16.9% -8.9% -8.9%
Utah 7.6% 8.4% -17.9% -10.4% -9.5%
Mississippi 4.9% 4.9% -15.5% -10.6% -10.6%
Colorado 10.1% 10.1% -21.0% -11.0% -11.0%
Michigan 9.1% 10.2% -22.3% -13.3% -12.2%
New Hampshire 6.6% 6.6% -19.0% -12.4% -12.3%
Ohio 6.3% 7.9% -20.4% -14.1% -12.6%
Wisconsin 1.8% 5.2% -18.1% -16.3% -12.9%
Florida 4.5% 8.8% -21.7% -17.3% -13.0%
Pennsylvania 0.0% 0.1% -13.1% -13.1% -13.0%
Kansas 0.0% 3.9% -17.0% -17.0% -13.1%
Arizona 4.8% 5.2% -19.0% -14.2% -13.8%
Virginia 1.4% 1.4% -15.4% -14.0% -14.0%
Illinois 0.0% 3.8% -18.9% -18.9% -15.1%
Kentucky 0.1% 0.1% -15.4% -15.3% -15.3%
Missouri 3.3% 6.0% -21.9% -18.6% -15.9%
Montana 0.0% 2.5% -18.5% -18.5% -16.0%
New Jersey 0.0% 2.1% -18.1% -18.1% -16.1%
Oklahoma 1.4% 2.7% -25.1% -23.7% -22.4%
North Dakota 4.1% 7.9% -33.7% -29.6% -25.8%
Louisiana 3.3% 6.1% -33.6% -30.3% -27.5%
* Rainy-day and total balances are estimated as of the end of fiscal 2018 by NASBO members. All numbers are shown as a % of fiscal 2018 general fund revenues also estimated by
NASBO members.
** The estimated shortfalls refer to the amount of fiscal shock that would not be covered by actual reserves under a moderate recession scenario. A negative percentage means
a state would not be able to make up for the entire fiscal shock associated with a moderate recession.
Source: Moody’s Analytics
10 September 2018MOODY’S ANALYTICS
Chart 9: Material Economic Implications of topping off Putting money away for a rainy day is a
Rainy-day fund shortfall* as a % of GSP
its reserves from great accomplishment, but it is also only part
the peak of the of the battle. Fund balances alone are not
*Difference business cycle as enough to ward off the effects of a recession.
between actual
and necessary many states are Research shows that in addition to having
rainy-day in a position to do adequate balances, among other things, the
balances under today, North Da- purpose of the funds being used for reserves
moderate
recession kota is rebuilding should be explicit to prevent some of the
its reserves from indecision that can cost states valuable time
No shortfall the ground up as during a recession.5 During the Great Reces-
0.5 begins to set in. those funds late, if at all, while policymakers
At the top of debated the funds’ true purpose. As a result,
Sources: BEA, National Assn. of State Budget Officers, Moody’s Analytics
the list, several several state rainy-day funds were marginal-
Presentation Title, Date 9 states stand out ized during one of the largest downpours in
shows that some individual states may face for the manner in which they have built up American history.
substantially more. their reserves. Though total state balances Last, during a recession it is unlikely that
are enough in 23 states to weather a moder- state policymakers will wish to rely entirely
Beyond preparedness ate recession, things look considerably less on reserves, and they will seek to implement
Before jumping too quickly to conclusions rosy when we look strictly at those balances at least some spending cuts, if not revenue
about certain states, it is important to quali- that are explicitly designated as “rainy-day” increases as well. Therefore, at least some of
fy some of these results to provide the clear- reserves. This is a designation that can carry a the recessionary liabilities calculated in this
est picture possible of state preparedness big distinction. Fund balances are not always stress-testing exercise will be covered by mi-
levels. Though there are clearly some stand- equivalent to available reserves, as they can nor fiscal changes from policymakers. Thus, a
outs, both good and bad, in these results, often be obligated for other uses and are not state need not have its entire liability covered
many of the laggards are not in nearly as bad explicitly set aside for fiscal emergencies. within its reserves to be able to reasonably
a shape as these numbers might lead one to NASBO estimates in its most recent Fiscal weather a recession’s effects on its budget
believe. Similarly, some of the top perform- Survey of the States that less than three- and economy. This ultimately boils down to
ers are not nearly as well off as they might quarters of total state balances are actually a policy choice and risk assessment from the
seem by looking strictly at these results. designated as reserves. appropriate policymakers in each state, which
At the bottom of the list, several natural The rest are simply excess fund balances again underlines the need for individual states
resources states stand out as curiosities, that have accumulated either because of to perform these types of evaluations on their
given that they have traditionally been revenues exceeding budgeted targets or own and design the best recession plan for
among the best prepared for a downturn. spending coming in below expectations on a their needs and risk appetites.
However, it is important to remember that onetime basis. This difference is even more
not every state is simultaneously in the same stark in a handful of states, including those What about pensions?
part of the business cycle. North Dakota, for that might show up as being among the Among the questions that we receive
example, has historically been a standout for most prepared. Hawaii, for example, is pro- most often with respect to state budgets and
its levels of preparedness, especially follow- jected to finish fiscal 2018 with the largest recessions is how changes in the business
ing the historic oil boom that took place dur- total balances of any non-natural resource cycle can affect state pension funds. Given the
ing and after the Great Recession. In 2014, state. With cash on hand at more than 17% troubling situations to be found in too many
North Dakota had some of the healthiest of its revenues, the state has almost twice as state pension funds today, this is an important
reserve levels of any state, a fortunate thing, much to get through a moderate recession question to ask. However, the answer is not
given that oil prices cratered that year. The as it would need. However, if you limit those necessarily pertinent to the idea of recession-
state has been using those reserves to battle balances only to what has been explicitly set ary preparedness for two main reasons. First,
its recession with great relative success for aside for a rainy day, Hawaii’s reserve levels because of the way that pension accounting
almost four years now. Few states could fall to just more than 4% of its budget, not works, any stress arising from a downturn in
have survived such a downturn with so few nearly enough to weather the next down- the economy is generally borne out over a
spending cuts and revenue enhancements as turn. This indicates that Hawaii was not so number of years. This helps to prevent large
North Dakota has over the past few years. much prepared going into fiscal 2019 as it
As a result, however, the state is in a situa- was fortunate to have had a onetime wind- 5 Emily Raimes, et al., “Fiscal Stress Test: Ability to Withstand
Next Recession Depends on Reserves, Flexibility,” Moody’s
tion very different from other states. Instead fall in revenue. Investors Service: Sector In-Depth (April 21, 2016).
11 September 2018MOODY’S ANALYTICS
Chart 10: Pensions Matter for Some States mediate economic a longer time, limiting their impact on the
Increased ADC* due to moderate recession, % of FY2018 revenue
alarm, their implica- near-term ADC.
tions for the long- However, though the impact on most
term fiscal health of states was relatively small, a handful of
a state, especially states did see significant stress on their ADC
those whose pension as a result of even a moderate recession.
*Actuarially defined plans are already Illinois and Kentucky would incur the larg-
contribution
most stressed, est effects because of their already-sizable
are still important pension debts and large baseline ADCs as aMOODY’S ANALYTICS
ing them unavailable in an emergency. Anec- investment decisions as opposed to day-to- ness, on the other hand, can lend stability to
dotally, we have evidence that at least some day funding challenges and therefore should a struggling economy and help conditions
states with larger than expected fiscal 2018 be viewed as best practices among states. recover more quickly. These preparations can
surpluses have begun to explicitly designate For those states that performed poorly in be a difficult balancing act, however, neces-
more of that money as rainy-day reserves. this year’s test, one takeaway is most clear. sitating as much objective care and precision
Therefore, we are hopeful that when NASBO Every little bit helps. Although it may be too as possible in such an imprecise discipline as
next releases fund balance estimates this late to get reserves up to the level necessary budget forecasting.
fall, states will look even better than they to fully weather the effects of the next reces- To sufficiently protect their budgets and
do today. sion, every dollar that can be put away in the their economies from increased volatility and
Second, having a plan is just as important meantime is a dollar that will not have to fiscal drag, state and local government poli-
as having a fund. Many states have adequate be raised via taxes or spending cuts in a few cymakers should be investing in their budget
reserve funds for the first time in years; how- years. What is more, the economic impact processes and making stress-testing a higher
ever, most have not yet put together a plan of putting that dollar aside today when the priority. At the very least, states and local
for what to do with them when the business economy is red hot will be much less painful governments should be reviewing their re-
cycle does eventually turn. The importance than trying to pull it out of the economy at serve policies and checking on their adequacy
of being purposeful with rainy-day reserves the height of the next recession. It is never following such a tumultuous fiscal period
and developing a plan before it starts to rain too late to provide your state at least some as the past decade. At best, policymakers
cannot be overstressed. It is encouraging to cushion from the difficult decisions set to should be diligently implementing statutory
see more state governments such as Utah take place during the next downturn. reserve guidelines based on such reviews and
implementing their own stress-testing exer- How policymakers prepare for these working to expand reserve levels while bud-
cises as a part of their normal budget proce- eventualities matters a great deal in the pace get conditions are still improving. Continua-
dures. Over the long run these types of prac- of economic recovery. Unpreparedness can tion of current policies in a number of states
tices allow policymakers to better maximize lead to disruptive decisions to drastically cut risks a repeat of the lackluster recovery that
their state’s long-term economic outlook by spending or raise revenues just at the time followed the Great Recession and is not con-
focusing more on forward-looking policy and the economy can least afford it. Prepared- ducive to long-term economic growth.
13 September 2018MOODY’S ANALYTICS About the Authors Dan White is the director of government consulting and public finance research at Moody’s Analytics in West Chester PA. In this role he oversees economic research with an emphasis on fiscal policy and municipal market impacts. In addition to public finance and fiscal policy, Dan has per- formed research on a broad range of other subjects including healthcare, energy economics, and regional economic development. Dan regularly presents to clients, confer- ences, and policymakers of all levels. He has been featured in a number of print, radio and televised media outlets ranging from Bloomberg Television to the Wall Street Journal, and also writes regular editorial pieces for a number of online and print publications. His most recent research has focused on public policy responses to the Great Recession and ways to better prepare federal and subnational fiscal conditions for changes in the business cycle. This has included developing new ways to incorporate the use of stress testing and alternative economic scenarios into the public budgeting process in order to better protect governments against cyclical economic risk. Dan also works directly with a number of governments and policymakers in an advisory role and teaches classes in economics and public finance as an adjunct professor at Villanova University. Before joining Moody’s Analytics, Dan worked as a financial economist for the State of New Mexico, where he forecast revenues and analyzed a wide range of policy issues concentrated around economic development, public investment and debt management. Dan holds an MA in economics as well as undergraduate degrees in finance and international business from New Mexico State University. Todd Metcalfe is an economist at Moody’s Analytics. He performs data analysis for forecasting municipal bond performance and works on state and local government fiscal issues. Before joining Moody’s Analytics, Todd worked for the Regional Economic Studies Institute at Towson University as a senior economist. There he analyzed the impact of various policies on Maryland’s economy. Todd holds a PhD in Social Science from Syracuse University, where his dissertation focused on analyzing the impacts of state level environmental policy. He also earned an MS in Agricultural and Applied Economics from Virginia Tech, and a BA in Economics from the University of Maryland. Sarah Crane is an economist at Moody’s Analytics. She covers several state and regional economies, including Illinois and its major metro areas, in addition to editing the Midwest Regional Financial Review and numerous other publications. Sarah also works on state and local government fiscal issues and works closely with a number of governments and other organizations in a consulting role. She earned a master’s degree in economics from American University and has a bachelor’s degree in communica- tions from Boston University.
MOODY’S ANALYTICS

                                            About Moody’s Analytics
Moody’s Analytics provides financial intelligence and analytical tools supporting our clients’ growth, efficiency
and risk management objectives. The combination of our unparalleled expertise in risk, expansive information
resources, and innovative application of technology helps today’s business leaders confidently navigate an
evolving marketplace. We are recognized for our industry-leading solutions, comprising research, data, software
and professional services, assembled to deliver a seamless customer experience. Thousands of organizations
worldwide have made us their trusted partner because of our uncompromising commitment to quality, client
service, and integrity.

Concise and timely economic research by Moody’s Analytics supports firms and policymakers in strategic planning, product
and sales forecasting, credit risk and sensitivity management, and investment research. Our economic research publications
provide in-depth analysis of the global economy, including the U.S. and all of its state and metropolitan areas, all European
countries and their subnational areas, Asia, and the Americas. We track and forecast economic growth and cover specialized
topics such as labor markets, housing, consumer spending and credit, output and income, mortgage activity, demographics,
central bank behavior, and prices. We also provide real-time monitoring of macroeconomic indicators and analysis on timely
topics such as monetary policy and sovereign risk. Our clients include multinational corporations, governments at all levels,
central banks, financial regulators, retailers, mutual funds, financial institutions, utilities, residential and commercial real
estate firms, insurance companies, and professional investors.

Moody’s Analytics added the economic forecasting firm Economy.com to its portfolio in 2005. This unit is based in West Chester
PA, a suburb of Philadelphia, with offices in London, Prague and Sydney. More information is available at www.economy.com.

Moody’s Analytics is a subsidiary of Moody’s Corporation (NYSE: MCO). Further information is available at
www.moodysanalytics.com.

DISCLAIMER: Moody’s Analytics, a unit of Moody’s Corporation, provides economic analysis, credit risk data and insight,
as well as risk management solutions. Research authored by Moody’s Analytics does not reflect the opinions of Moody’s
Investors Service, the credit rating agency. To avoid confusion, please use the full company name “Moody’s Analytics”, when
citing views from Moody’s Analytics.

                                          About Moody’s Corporation
Moody’s Analytics is a subsidiary of Moody’s Corporation (NYSE: MCO). MCO reported revenue of $4.2 billion in 2017,
employs approximately 11,900 people worldwide and maintains a presence in 41 countries. Further information about
Moody’s Analytics is available at www.moodysanalytics.com.
© 2018 Moody’s Corporation, Moody’s Investors Service, Inc., Moody’s Analytics, Inc. and/or their licensors and affiliates (collectively, “MOODY’S”). All rights reserved. CREDIT RATINGS ISSUED BY MOODY’S INVESTORS SERVICE, INC. AND ITS RATINGS AFFILIATES (“MIS”) ARE MOODY’S CURRENT OPIN- IONS OF THE RELATIVE FUTURE CREDIT RISK OF ENTITIES, CREDIT COMMITMENTS, OR DEBT OR DEBT-LIKE SECURITIES, AND MOODY’S PUBLICATIONS MAY INCLUDE MOODY’S CURRENT OPINIONS OF THE RELATIVE FUTURE CREDIT RISK OF ENTITIES, CREDIT COMMIT- MENTS, OR DEBT OR DEBT-LIKE SECURITIES. MOODY’S DEFINES CREDIT RISK AS THE RISK THAT AN ENTITY MAY NOT MEET ITS CONTRAC- TUAL, FINANCIAL OBLIGATIONS AS THEY COME DUE AND ANY ESTIMATED FINANCIAL LOSS IN THE EVENT OF DEFAULT. CREDIT RATINGS DO NOT ADDRESS ANY OTHER RISK, INCLUDING BUT NOT LIMITED TO: LIQUIDITY RISK, MARKET VALUE RISK, OR PRICE VOLATILITY. CREDIT RATINGS AND MOODY’S OPINIONS INCLUDED IN MOODY’S PUBLICATIONS ARE NOT STATEMENTS OF CURRENT OR HISTORICAL FACT. MOODY’S PUBLICATIONS MAY ALSO INCLUDE QUANTITATIVE MODEL-BASED ESTIMATES OF CREDIT RISK AND RELATED OPINIONS OR COMMENTARY PUBLISHED BY MOODY’S ANALYTICS, INC. CREDIT RATINGS AND MOODY’S PUBLICATIONS DO NOT CONSTITUTE OR PROVIDE INVESTMENT OR FINANCIAL ADVICE, AND CREDIT RATINGS AND MOODY’S PUBLICATIONS ARE NOT AND DO NOT PROVIDE RECOMMENDATIONS TO PURCHASE, SELL, OR HOLD PARTICULAR SECURITIES. NEITHER CREDIT RATINGS NOR MOODY’S PUBLICATIONS COMMENT ON THE SUITABILITY OF AN INVESTMENT FOR ANY PARTICULAR INVESTOR. MOODY’S ISSUES ITS CREDIT RATINGS AND PUB- LISHES MOODY’S PUBLICATIONS WITH THE EXPECTATION AND UNDERSTANDING THAT EACH INVESTOR WILL, WITH DUE CARE, MAKE ITS OWN STUDY AND EVALUATION OF EACH SECURITY THAT IS UNDER CONSIDERATION FOR PURCHASE, HOLDING, OR SALE. MOODY’S CREDIT RATINGS AND MOODY’S PUBLICATIONS ARE NOT INTENDED FOR USE BY RETAIL INVESTORS AND IT WOULD BE RECKLESS AND INAPPROPRIATE FOR RETAIL INVESTORS TO USE MOODY’S CREDIT RATINGS OR MOODY’S PUBLICATIONS WHEN MAKING AN INVESTMENT DECISION. IF IN DOUBT YOU SHOULD CONTACT YOUR FINANCIAL OR OTHER PROFESSIONAL ADVISER. ALL INFORMATION CONTAINED HEREIN IS PROTECTED BY LAW, INCLUDING BUT NOT LIMITED TO, COPYRIGHT LAW, AND NONE OF SUCH IN- FORMATION MAY BE COPIED OR OTHERWISE REPRODUCED, REPACKAGED, FURTHER TRANSMITTED, TRANSFERRED, DISSEMINATED, REDISTRIB- UTED OR RESOLD, OR STORED FOR SUBSEQUENT USE FOR ANY SUCH PURPOSE, IN WHOLE OR IN PART, IN ANY FORM OR MANNER OR BY ANY MEANS WHATSOEVER, BY ANY PERSON WITHOUT MOODY’S PRIOR WRITTEN CONSENT. All information contained herein is obtained by MOODY’S from sources believed by it to be accurate and reliable. Because of the possibility of human or mechanical error as well as other factors, however, all information contained herein is provided “AS IS” without warranty of any kind. MOODY’S adopts all necessary measures so that the information it uses in assigning a credit rating is of sufficient quality and from sources MOODY’S considers to be reliable including, when appropriate, independent third-party sources. However, MOODY’S is not an auditor and cannot in every instance indepen- dently verify or validate information received in the rating process or in preparing the Moody’s publications. To the extent permitted by law, MOODY’S and its directors, officers, employees, agents, representatives, licensors and suppliers disclaim liability to any person or entity for any indirect, special, consequential, or incidental losses or damages whatsoever arising from or in connection with the information contained herein or the use of or inability to use any such information, even if MOODY’S or any of its directors, officers, employees, agents, representatives, licensors or suppliers is advised in advance of the possibility of such losses or damages, including but not limited to: (a) any loss of present or prospective profits or (b) any loss or damage arising where the relevant financial instrument is not the subject of a particular credit rating assigned by MOODY’S. To the extent permitted by law, MOODY’S and its directors, officers, employees, agents, representatives, licensors and suppliers disclaim liability for any direct or compensatory losses or damages caused to any person or entity, including but not limited to by any negligence (but excluding fraud, will- ful misconduct or any other type of liability that, for the avoidance of doubt, by law cannot be excluded) on the part of, or any contingency within or beyond the control of, MOODY’S or any of its directors, officers, employees, agents, representatives, licensors or suppliers, arising from or in connection with the information contained herein or the use of or inability to use any such information. NO WARRANTY, EXPRESS OR IMPLIED, AS TO THE ACCURACY, TIMELINESS, COMPLETENESS, MERCHANTABILITY OR FITNESS FOR ANY PARTICULAR PURPOSE OF ANY SUCH RATING OR OTHER OPINION OR INFORMATION IS GIVEN OR MADE BY MOODY’S IN ANY FORM OR MANNER WHATSO- EVER. Moody’s Investors Service, Inc., a wholly-owned credit rating agency subsidiary of Moody’s Corporation (“MCO”), hereby discloses that most issuers of debt securities (including corporate and municipal bonds, debentures, notes and commercial paper) and preferred stock rated by Moody’s Investors Service, Inc. have, prior to assignment of any rating, agreed to pay to Moody’s Investors Service, Inc. for appraisal and rating services rendered by it fees ranging from $1,500 to approximately $2,500,000. MCO and MIS also maintain policies and procedures to address the independence of MIS’s ratings and rating processes. Information regarding certain affiliations that may exist between directors of MCO and rated entities, and between entities who hold ratings from MIS and have also publicly reported to the SEC an ownership interest in MCO of more than 5%, is posted annually at www.moodys. com under the heading “Investor Relations — Corporate Governance — Director and Shareholder Affiliation Policy.” Additional terms for Australia only: Any publication into Australia of this document is pursuant to the Australian Financial Services License of MOODY’S affiliate, Moody’s Investors Service Pty Limited ABN 61 003 399 657AFSL 336969 and/or Moody’s Analytics Australia Pty Ltd ABN 94 105 136 972 AFSL 383569 (as applicable). This document is intended to be provided only to “wholesale clients” within the meaning of section 761G of the Corpora- tions Act 2001. By continuing to access this document from within Australia, you represent to MOODY’S that you are, or are accessing the document as a representative of, a “wholesale client” and that neither you nor the entity you represent will directly or indirectly disseminate this document or its contents to “retail clients” within the meaning of section 761G of the Corporations Act 2001. MOODY’S credit rating is an opinion as to the creditwor- thiness of a debt obligation of the issuer, not on the equity securities of the issuer or any form of security that is available to retail investors. It would be reckless and inappropriate for retail investors to use MOODY’S credit ratings or publications when making an investment decision. If in doubt you should contact your financial or other professional adviser. Additional terms for Japan only: Moody’s Japan K.K. (“MJKK”) is a wholly-owned credit rating agency subsidiary of Moody’s Group Japan G.K., which is wholly-owned by Moody’s Overseas Holdings Inc., a wholly-owned subsidiary of MCO. Moody’s SF Japan K.K. (“MSFJ”) is a wholly-owned credit rating agency subsidiary of MJKK. MSFJ is not a Nationally Recognized Statistical Rating Organization (“NRSRO”). Therefore, credit ratings assigned by MSFJ are Non-NRSRO Credit Ratings. Non-NRSRO Credit Ratings are assigned by an entity that is not a NRSRO and, consequently, the rated obligation will not qualify for certain types of treatment under U.S. laws. MJKK and MSFJ are credit rating agencies registered with the Japan Financial Services Agency and their registration numbers are FSA Commissioner (Ratings) No. 2 and 3 respectively. MJKK or MSFJ (as applicable) hereby disclose that most issuers of debt securities (including corporate and municipal bonds, debentures, notes and commercial paper) and preferred stock rated by MJKK or MSFJ (as applicable) have, prior to assignment of any rating, agreed to pay to MJKK or MSFJ (as applicable) for appraisal and rating services rendered by it fees ranging from JPY200,000 to approximately JPY350,000,000. MJKK and MSFJ also maintain policies and procedures to address Japanese regulatory requirements.
You can also read