First in Freedom Index - February 2015
←
→
Page content transcription
If your browser does not render page correctly, please read the page content below

1

First in Freedom Index
               February 2015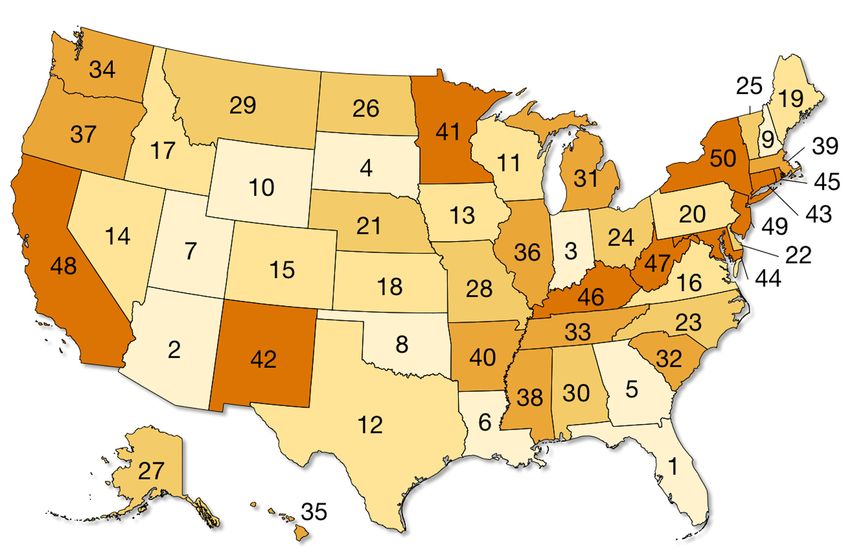
2
First in Freedom Index
Contents
3 Key Facts
4 First in Freedom Index
5 First Steps on a Journey
6 Philosophy Grounded in Empirical Study
8 Figure 1: Findings on Links Between State/Local Tax Policies and Economic
Performance
9 Figure 2: Findings on Links Between State/Local Spending and Economic
Performance
10 Figure 3: Findings on Links Between School Reform Variables and Student
Outcomes
The Manifest Benefits of Freedom
12 Understanding the First in Freedom Index
13 How States Rank in Freedom
14 Figure 4: Overall Freedom Ranking
15 Figure 5: Fiscal Freedom Ranking
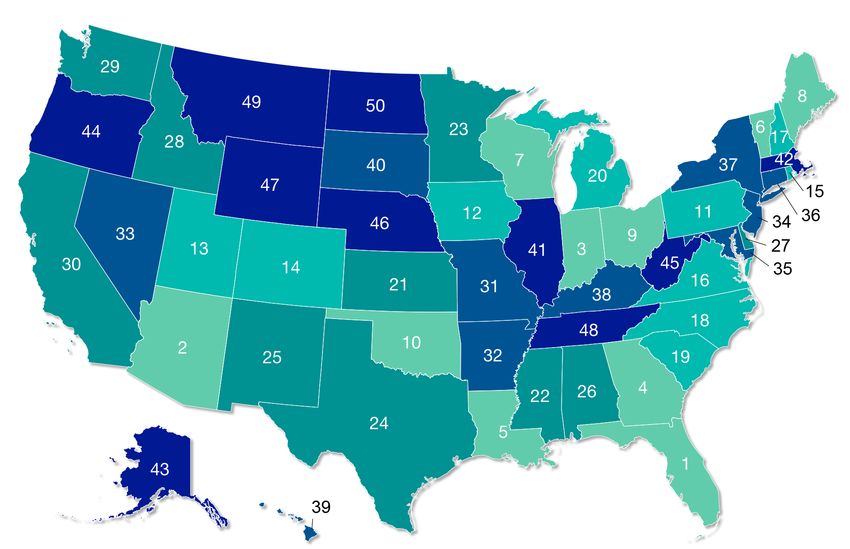
16 Figure 6: Educational Freedom Ranking
Red States, Blue States, and Freedom
17 Figure 7: Regulatory Freedom Ranking
18 Figure 8: Health Care Freedom Ranking
First in Freedom Rankings and Other Indicators
19 Conclusion
21 Endnotes
22 Appendix: Methodology
The cover image is a Charotte statue of Captain James Jack, who reportedly delivered the Mecklenburg Resolves to the
Continental Congress in Philadelphia in 1775.
The views expressed in this report are solely those of the author and do not necessarily reflect those of the staff or board of the
John Locke Foundation. For more information, call 919-828-3876 or visit www.JohnLocke.org.
©2015 by the John Locke Foundation.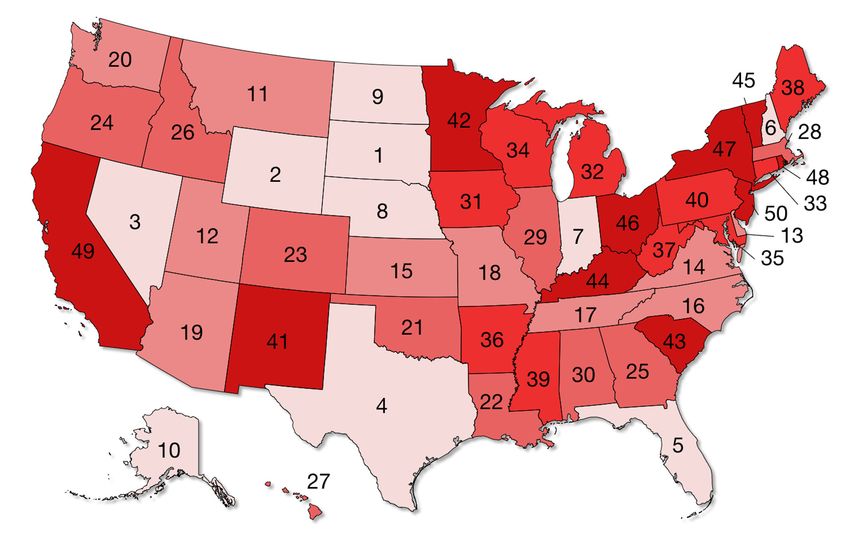
3

Key Facts

•   Overall, North Carolina ranks 23rd in the nation and 5th among the 12
    states of the Southeast. Florida holds the #1 slot on the FFI, followed by
    Arizona, Indiana, South Dakota, and Georgia.

•   The least-free state is New York, which is joined in the bottom five by New
    Jersey, California, West Virginia, and Kentucky.

•   North Carolina’s best showing is fiscal policy. Before the 2013 tax reform,
    North Carolina ranked among the worst states in the nation in tax climate.
    North Carolina now ranks 16th in the nation in fiscal freedom and 3rd in
    the Southeast, behind only Florida and Virginia.

•   On educational freedom, North Carolina ranks 18th in the nation and 5th
    in the Southeast. Strong protections for homeschooling were helpful here,
    as was the passage of opportunity scholarships in 2013. But North Carolina
    ranks below the national average in public school choice.

•   When it comes to regulatory freedom, our state ranks 36th in the nation
    and 8th out of the 12 Southeastern states. Although North Carolina’s right-
    to-work law, absence of state-level minimum wages, and recent tort reforms
    have been helpful, our state has relatively weak protections against eminent
    domain abuse and relatively strict occupational-licensing laws.

•   The state’s worst showing is in health care freedom, where North Carolina
    ranks 46th in the nation and dead last in the Southeast. The main culprits
    are our poor rankings on certificate-of-need laws and state benefit mandates
    on private health plans.

•   If North Carolina completely abolished its certificate-of-need regulations,
    our ranking on health care freedom would rise to 25th and our overall FFI
    ranking would rise to 16th.

•   Adopting the strong land-use and property-rights protections of neighboring
    South Carolina would raise North Carolina’s regulatory freedom ranking to
    16th and our overall FFI ranking to 19th.

•   If North Carolina matched Colorado in public-school choice, our educational
    freedom ranking would rise to 13th and our overall FFI ranking to 15th.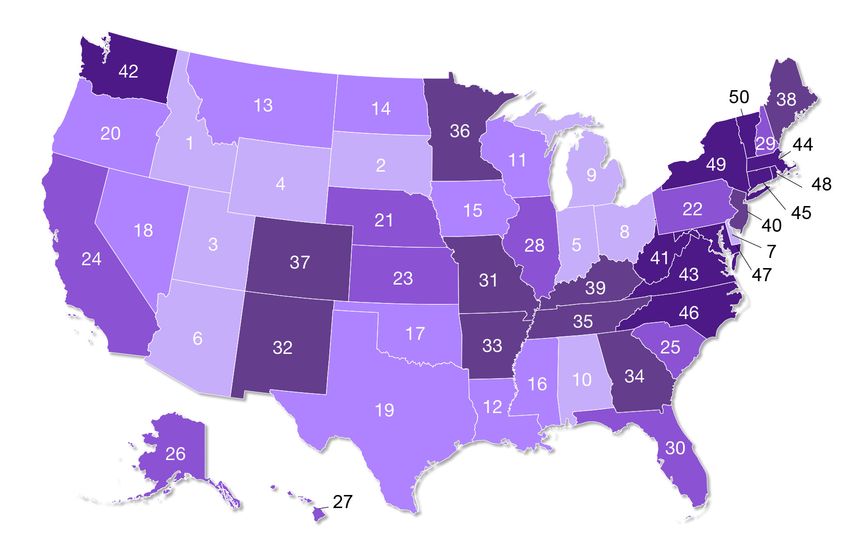
4

    D
            uring the 2014 legislative session, the North Carolina General Assembly
            dealt with a range of consequential and controversial issues. So it’s
            understandable why one change in state policy drew little press or
    public attention: starting in mid-2015, North Carolina motorists will be able to
    choose an alternative to the current “First in Flight” license plate to adorn their
    cars and trucks. The new plate will bear the motto “First in Freedom” and an
    image symbolizing North Carolina’s key role in the American Revolution.

    The phrase speaks to an old and venerable tradition of North Carolinians
    standing up for liberty. In May 1775, a group of Mecklenburg County leaders
    met in Charlotte to fashion a response to escalating tensions between the
    American colonies and the government of King George III. As they gathered
    for the meeting, news arrived in town of the battles of Lexington and Concord
    a month earlier in Massachusetts. Worried and angered, the Mecklenburg
    leaders decided to set up their own institutions of government. In a document
    later published as the Mecklenburg Resolves, they stated that British military
    action had resulted in the colonies entering “a state of actual rebellion” and
    that “all laws and commissions confirmed by or derived from the authority
    of the King and Parliament are annulled and vacated, and the former civil
    constitution of these colonies for the present wholly suspended.” Some believe
    that the Mecklenburg committee went further still, issuing a formal Declaration
    of Independence on May 20, the first of its kind in America. But even if the
    Mecklenburg Resolves was the only document approved by the delegates, it was
    still a startling and courageous act of resistance against tyrannical government
    and deserves the veneration still evident on the state flag and state seal of North
    Carolina.

    The revolutionary fervor was hardly limited to Mecklenburg. Political leaders
    in counties and towns across North Carolina expressed their resolve to fight
    for liberty over the subsequent months. By April 1776, they met as the Fourth
    Provincial Congress in Halifax to decide what North Carolina’s position should
    be at the upcoming Continental Congress in Philadelphia. Three of the leaders
    of Mecklenburg’s May 1775 action of defiance – Robert Irwin, John Phifer, and
    John McKnitt Alexander – were members of that Fourth Provincial Congress.
    In the resulting Halifax Resolves, the assembled state leaders decided to instruct
    the North Carolina delegation in Philadelphia to pursue formal independence
    from Britain – the first such decision in America. The date of the Halifax
    Resolves, April 12, is the other date honored on the North Carolina seal and
    flag.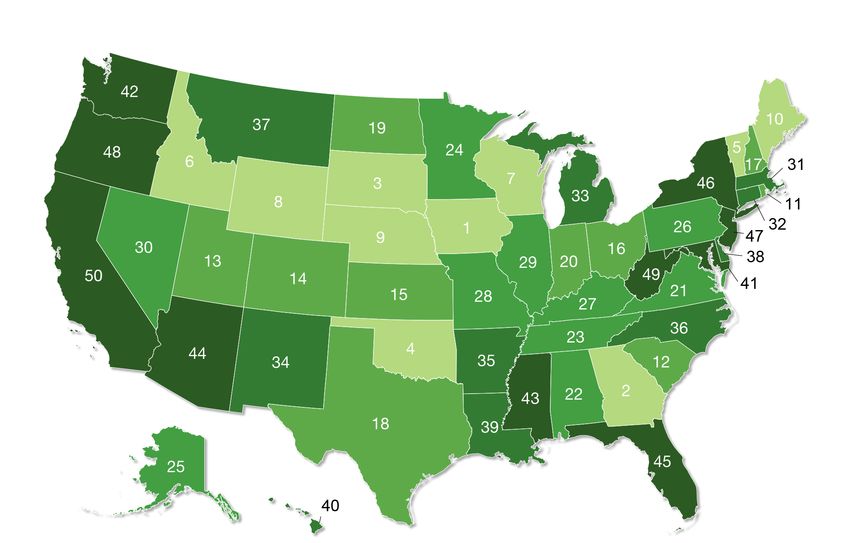
5

Based on these events of 1775 and 1776, there is a good case to be made that
the future Tar Heel State led the way on American independence. But that was
more than two centuries ago. The challenges facing our economy, our families,
our liberty, and our tradition of constitutional government are serious and
immediate. Again, it is time to act. At the John Locke Foundation, we believe
it is time for North Carolina to reclaim its heritage and resume its leadership in
the cause of liberty. It is time for our state to become “First in Freedom” once
more.

First Steps on a Journey
The past four years have brought dramatic changes in North Carolina public
policy. Conservatives committed to the principles of free enterprise and limited
government have risen to political power in the General Assembly, the executive
branch, and more than half of the state’s 100 counties. They’ve reduced and
restructured North Carolina’s taxes. They’ve reformed its byzantine regulatory
process. They’ve embraced the concepts of competition, private investment,
and consumer choice in public services such as education and transportation.

These dramatic changes certainly haven’t gone unnoticed. Both in North
Carolina and across the country, the state’s surprising successes in conservative
reform have drawn an unsurprising set of critics: liberal politicians, labor
unions and other special interests that thrive on government largesse, left-
wing grantmakers and the activists they fund, campus radicals (ranging
from the tenured to the teen-aged), and media commentators whose rising
resentment seems inversely proportionate to their declining fortunes and
dwindling influence. For the most part, however, these critics haven’t really
engaged North Carolina’s new conservative leaders in substantive discussion
about philosophical ideas or empirical research. Instead, they have rallied,
protested, launched personal attacks, and attempted to defeat the conservatives
in elections. In a free society, they have every right to choose such tactics, of
course. But one unfortunate consequence is that North Carolina’s recent wave
of free-market reforms is now thought of primarily as a political struggle rather
than a public-policy debate.

For a quarter of a century, the John Locke Foundation has committed itself
to facilitating and participating in substantive policy debate. We agree with
North Carolina native Richard Weaver’s famous observation that “ideas have
consequences.” JLF is devoted to exploring challenging ideas, expanding the
public’s knowledge about policy issues, and applying the findings of rigorous
6

    research to bear on practical problems of state and local government. Ours has
    always been a long-term plan. We envision a North Carolina of responsible
    citizens, strong families, and successful communities committed to individual
    liberty and limited, constitutional government. To transform this vision into
    reality, JLF employs research, journalism, and outreach programs to transform
    North Carolina government by applying the principles of competition,
    innovation, personal freedom, and personal responsibility.

    As we have pursued our mission over 25 years, we have often been critical of
    North Carolina’s existing public policies. But we have always accompanied
    these criticisms with specific, practical alternatives. Even when non-
    conservatives held the reins of power in the state, we persisted in making our
    case for reform — and sometimes we succeeded. Bipartisan majorities in the
    General Assembly created charter schools and reduced income taxes during
    the 1990s, for example. Democratic governors adopted budget efficiencies
    and reorganized state agencies in ways recommended by JLF. Counties and
    municipalities contracted out public services and strengthened user-pay
    financing for government-run enterprises.

    Contrary to the claims of our critics, we do not reflexively oppose all government
    programs. JLF recognizes the critical importance of core public services in
    making North Carolina a safer, more prosperous, and more attractive place
    to live. What we really seek is a better balance between the public sector and
    private institutions of family, faith, community, and enterprise. Over the past
    four years, conservative leaders have sought to restore that balance. For the
    most part, we have agreed with the difficult decisions they’ve made. Now, as
    JLF enters its next quarter century of work, we hope to inspire current and
    future leaders of our state to go farther, to go bolder. We believe the long-term
    goal should be to make North Carolina the freest state in America. And we
    believe that measuring incremental progress toward that goal is both feasible
    and necessary.

    Philosophy Grounded in Empirical Study
    That’s why we have produced this report. To make our state First in Freedom
    will require further reductions and reforms in taxes, particularly those affecting
    savings and investment. It will require further reductions in government
    spending, particularly in income-transfer programs, and further reforms of the
    state bureaucracy and budget process. It will require more changes to North
    Carolina’s regulatory system, including fewer restrictions on entrepreneurs
7

and professionals and greater legislative oversight of rulemaking. It will require
more choice and competition in the delivery of tax-funded education and
health care services.

These policies form a consistent governing philosophy of maximizing freedom.
They also reflect the findings of the latest scholarly research on state and local
government, which has established that places with smaller, less costly, less
monopolistic governments tend to experience higher rates of economic growth
and social progress. All other things being held equal, states with lower, less
punitive tax and regulatory burdens tend to attract more investment capital,
entrepreneurs, and highly productive professionals, resulting in more job
creation and higher income growth. All other things being equal, state education
systems that offer the greatest freedom to choose among district-run public
schools, chartered public schools, private schools, and home schools tend to
produce the highest test score gains, graduation rates, and post-graduation
outcomes. All other things being equal, states that allow the broadest choice
and competition in the delivery of medical services and health plans tend to
have both lower costs and healthier citizens.

The research backing up these statements has been discussed at great length in
previous publications. Readers may wish to start with two books published by
JLF: Our Best Foot Forward (2012), which analyzed the recent history of North
Carolina’s economy and presented an investment-based plan for rejuvenating it,
and First in Freedom (2013), which provided dozens of specific recommendations
made by JLF policy analysts for the new McCrory administration and General
Assembly.

In 2014, JLF updated its analysis with two Spotlight briefing papers that
summarized the findings of a large body of peer-reviewed studies published
in scholarly journals during the past 25 years. The initial paper, “Lower Taxes,
Higher Growth: Scholarly Research Reveals Economic Benefits of Fiscal
Restraint,” was released in April 2014.1 It synthesized the findings of 681 studies
published in peer-reviewed academic or professional journals since 1990. Each
study examined at least one relationship between a state or local policy and
a measure of economic performance such as total employment, job creation,
income growth, population growth, or business starts. Many of the studies
contained multiple input and output variables, so as a whole they produced
nearly 1,400 empirical findings about economic growth policy at the state and
local level.
8
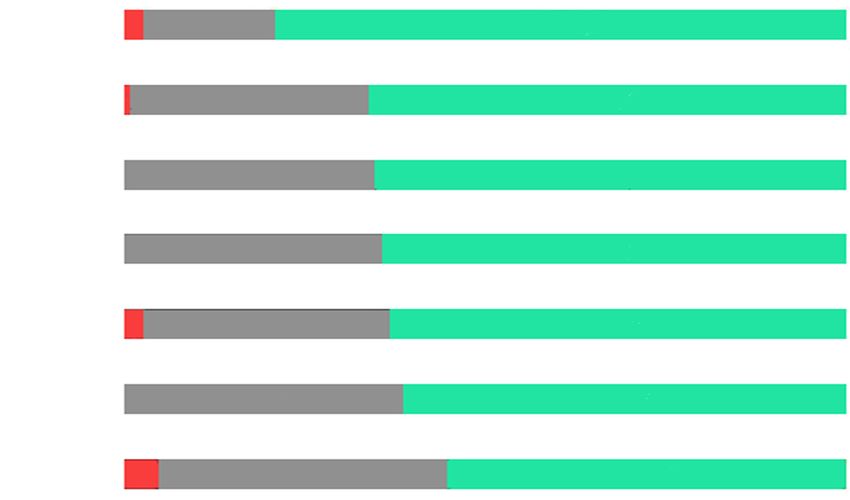
Figure 1: Findings on Links Between State/Local Tax Policies and Economic Performance
Negative Mixed/Insignificant Positive
Targeted Tax Incentives
4% 69% 27%
(55 Studies)
Property Taxes
61% 35% 4%
(54 Studies)
Overall Tax Burden
63% 35% 3%
(115 Studies)
Sales/Excise Taxes
65% 30% 5%
(43 Studies)
Corporate/Business Taxes
67% 24% 9%
(82 Studies)
Income Taxes
67% 26% 7%
(83 Studies)
Marginal Tax Rates
70% 25% 5%
(40 Studies)
The main findings on fiscal policy are summarized in Figures 1 and 2. In the case
of tax policy, most forms of state and local taxation have statistically significant
and negative associations with economic growth. That is, the lower the tax, the
better off the economy is, all other things being equal. The main exceptions are
targeted tax incentives such as per-job tax credits and enterprise zones. States
and localities that reduce their tax burdens in this selective fashion do not
appear to experience net economic benefits. The April report also examined
studies of state and local regulatory policies such as occupational licensing,
permitting, zoning and housing codes, minimum wages, and emissions caps.
In 68 percent of the 160 peer-reviewed studies on the subject, higher levels of
regulation were associated with lower rates of economic growth.
On the spending side of the equation, only government expenditures on public
safety have a consistent positive association with economic growth in most
studies (58 percent). For other categories of spending, the relationships are mixed
or statistically insignificant. And for expenditures on transfer programs such
as Medicaid and cash assistance, the relationship is statistically significant but
negative in 68 percent of the studies. These studies don’t tell us that education,
transportation, and other state programs are valueless, of course. What they
tell us is that there is no strong correlation between how much governments
spend and the quality of the services produced. States with lower-than-average
expenditures can produce better-than-average services. And high-expenditure
states can feature awful services.9
Figure 2: Findings on Links Between State/Local Spending and Economic Performance
Negative Mixed/Insignificant Positive
Public Safety Spending 14% 28% 58%
(36 Studies)
Economic Development Spending 6% 50% 44%
(32 Studies)
Public Infrastructure Spending 9% 46% 44%
(106 Studies)
Public School Spending 14% 53% 33%
(86 Studies)
Higher Education Spending
17% 52% 31%
(29 Studies)
Overall Spending
36% 49% 15%
(61 Studies)
Public Assistance Spending
68% 29% 3%
(62 Studies)
A month after releasing the Spotlight on economic-growth research, JLF
published “Educational Freedom Works,” which offered a similar analysis of
scholarly research on school reforms.2 The report synthesized findings from
888 articles published in peer-reviewed journals or by the National Bureau of
Economic Research since 1990. These papers explored relationships between
educational inputs or policies (such as per-pupil expenditure, average teacher
salary, class size, performance pay, and school choice) and student outcomes
(such as test scores, dropout rates, and college attendance). The findings on
several high-profile school reforms are summarized in Figure 3.
JLF’s survey found 116 studies that explored the link between per-pupil spending
and student outcomes. Higher spending was associated with higher student
performance only 32 percent of the time, after adjusting for student background
and other factors mostly or entirely outside the control of schools. Similarly, of
the 90 studies examining the link between average teacher salaries and student
outcomes, 56 percent found mixed or statistically insignificant results. Weak or
nonexistent benefits were also found for other common policies such as paying
teachers on the basis of years of services or degrees held. Structural reforms of
the education system fared far better. The use of rigorous standardized testing
was associated with subsequent gains in student performance in 79 percent of
peer-reviewed studies. Outcome gains were also found for programs promoting
parental choice within district-run public schools (66 percent), private school
choice and competition (65 percent), school autonomy and decentralization
(64 percent), and charter schools (55 percent).10
Figure 3: Findings on Links Between School Reform Variables and Student Outcomes
Negative Mixed/Insignificant Positive
Independent, Rigorous Testing
(34 Studies) 18% 79%
Public School Choice/Competition
(73 Studies) 33% 66%
Private School Choice/Competition
(127 Studies) 35% 65%
School Autonomy/Decentralizaiton
(53 Studies) 36% 64%
Private School Effect
(230 Studies) 34% 63%
Perfomance Pay For Educators
(34 Studies) 39% 61%
Charter Schools
(77 Studies) 40% 55%
In a key respect, the two Spotlights offer complementary findings. According
to the economic-growth literature, states with highly educated populations —
measured in high school diplomas, college degrees, and average test scores
— tend to enjoy higher rates of economic growth. And according to the school-
reform literature, the more parental choice and competition there is, the higher
a state’s educational attainment is likely to be, all other things being equal.
Thus, policymakers can expect to boost their future economic growth when
they embrace educational freedom alongside fiscal and regulatory reform.
Similarly, there is a growing body of empirical research that links health care
freedom — greater choice for patients and competition among providers —
with less-expensive and more effective medical care. Because the health of
the population is also an explanatory factor in economic growth (the causal
arrows point in both directions), market-based health care reform is another
policy that is valuable on its own terms while also complementary to fiscal and
regulatory freedom as a strategy for true economic development.3
The Manifest Benefits of Freedom
It stands to reason that if individual variables such as marginal tax rates, the
regulatory burden, and parental choice affect economic and social outcomes,
then broad indexes of such variables would likely correlate with economic and
social outcomes, as well. When it comes to economic freedom — including both
fiscal and regulatory variables — we don’t have to guess at such a relationship.
In recent years, scholars have published dozens of studies probing the links11 between state scores on economic freedom indexes and state economic growth. In the vast majority of cases, the relationship has proven to be positive and significant. The Economic Freedom of North America (EFNA) Index produced by the Canada-based Fraser Institute is the most-studied measure of state-level economic freedom in the scholarly literature. A 2014 paper in the journal Contemporary Economic Policy, for example, used nearly three decades of state-by- state data for the EFNA Index and employment measures. “Our findings show a strong relationship between economic freedom and labor market outcomes,” the authors concluded, “with more economic freedom being associated with lower unemployment rates and higher labor force participation rates and employment-population ratios.”4 A 2011 paper in the European Journal of Political Economy also compared state scores on the EFNA Index to long-run trends in state economic growth, after adjusting for other factors. “There is a significant positive relationship between economic freedom and growth,” the authors found, demonstrating “the importance of constraining excessive government expenditure within the economy and minimizing the tax burden.”5 One possible mechanism for economic freedom boosting growth is making a state more attractive to out-of-state business executives, investors, professionals, and other job creators. In a 2007 Southern Economic Journal study, economist Nathan Ashby found that states ranking high on the EFNA Index tend to experience high rates of in-migration, which in turn confer broader economic benefits.6 The authors of a 2012 paper published in the International Journal of Economics and Finance focused on inflows of financial rather than human capital, finding that states ranking high on the EFNA Index tended to attract higher rates of foreign direct investment.7 Another potential causal mechanism is entrepreneurship. States with higher rates of successful business start-ups tend to outperform other states in job and income growth over time. A 2009 paper published in Small Business Economics is one of several studies showing a link between EFNA scores and entrepreneurship rates.8 While the Fraser Institute’s measure is the oldest and most often studied, scholars have recently begun using another economic-freedom index, from George Mason University’s Mercatus Center, to explore similar issues. One of the attractions of the Mercatus “Freedom in the 50 States” index is its broader set of variables regarding regulatory policy and personal freedom, including such matters as health insurance mandates, property rights, and parental choice in education. According to a 2013 study published in the American Journal of
12

     Entrepreneurship, states with high scores on the overall Mercatus index had
     higher rates of business starts. When the data were disaggregated, however,
     fiscal policy proved to be more important than the regulatory variables.9 A
     2010 paper in the Journal of Regional Analysis and Policy found that scoring high
     on the Mercatus index tended to predict higher migration into a state among
     people in their 20s and 30s.10

     Yet another index, from the Tax Foundation, ranks states according to the
     competitiveness of their tax codes. While focused solely on taxes, this State
     Business Tax Climate Index (SBTCI) also combines several different variables
     — and has also been the subject of empirical study. A 2007 study by scholars at the
     Brookings Institution, for example, used the Tax Foundation’s measure as one
     variable in a broader analysis of state growth rates. It found that states ranked
     high on the SBTCI tended to have higher rates of employment growth.11 In
     2013, the Journal of Regional Science published a comprehensive study of various
     state indexes. Comparing state rankings against growth in state employment,
     wages, and gross domestic product, the authors found “the strongest and most
     robust evidence” for the economic effects of rankings on two state indexes: the
     SBTCI and Fraser’s EFNA.12

     Overall, there have been 37 studies of economic freedom and state economic
     growth published in scholarly journals since 1990 (including several published
     after JLF’s original survey of the literature in early 2014), of which 29 found a
     positive, statistically significant relationship and eight found no link. Not a single
     study found that ranking high in economic freedom was associated with lower
     economic performance. Although more research would be welcome and the
     causal relationships among the variables are probably complex, the currently
     available evidence is strongly suggestive that freedom and economic growth
     are closely connected. If North Carolina policymakers want to maximize job
     creation, income growth, and economic opportunity for its citizens over the
     coming years and decades, they should place a higher priority on reducing the
     size and scope of government, promoting choice and competition in services
     such as health care and education, and protecting personal freedom from
     encroachment.

     Understanding the First in Freedom Index
     Another reasonable conclusion to draw from the body of research discussed
     above is that if North Carolina policymakers wish to compare the extent of
     our fiscal, regulatory, health care, and education reforms to those of competing
13 states, there is compelling empirical support for employing the measures produced by the Fraser Institute, the Mercatus Center, and the Tax Foundation. That’s why, in this report, JLF has used all or parts of all three indexes, along with other data, to produce our First in Freedom Index (FFI). The overall rank for each state is derived from scores in four different categories: fiscal freedom, educational freedom, regulatory freedom, and health care freedom. Each of those categories, in turn, is composed of state scores on several different variables. The methodology behind our FFI project is discussed extensively in the Appendix. To understand how North Carolina and other states fare in the index, however, it will be helpful to keep two things in mind. First, most of the following discussion centers on state rankings, not state scores. In some cases, differences in state rank may reflect only small differences in scores. In other cases, the scores may be so widely distributed that the real-world difference between ranking 10th and ranking 11th is substantial. Readers seeking more information about a specific ranking, category, or variable are encouraged to consult the Appendix or contact JLF. Second, while some of the datasets used in the index are updated every year, others are produced on a more occasional basis by government agencies, trade associations, think tanks, and other researchers. Thus a state’s ranking on the 2015 First in Freedom Index reflects data from multiple years. It is quite possible that the effects of enacting (or rescinding) public policies in 2013 or 2014 do not yet show up in the data employed by this index. This is an inevitable constraint for state-by-state indexes spanning many different areas of interest. Future versions of our index will serve to capture such effects. How States Rank in Freedom The results of the John Locke Foundation’s initial First in Freedom Index can be seen in Figure 4. Overall, North Carolina ranks 23rd in the nation and 5th among the 12 states that make up the U.S. Commerce Department’s Southeast region. Florida holds the #1 slot on the FFI, followed by Arizona, Indiana, South Dakota, and Georgia. The least-free state is New York, which is joined in the bottom five by New Jersey, California, West Virginia, and Kentucky. Among the four categories that make up JLF’s index — fiscal freedom, educational freedom, regulatory freedom, and health care freedom — North Carolina’s best showing is fiscal policy (see the map presented as Figure 5).
14
               Figure 4: Overall Freedom Rankings

     Here is a case where recent legislation has made a big difference. Half of the
     fiscal-freedom score is based on the Tax Foundation’s business tax climate
     index, which takes income, sales, businesses, property, and payroll taxes into
     consideration. Before the 2013 tax reform, North Carolina ranked among the
     worst states in the nation in tax climate. If the tax reform bill hadn’t passed,
     it is likely that North Carolina’s total ranking on fiscal freedom would have
     been close to the national average, at best, and among the worst in our region.
     Instead, North Carolina now ranks 16th in the nation in fiscal freedom and 3rd
     in the Southeast, behind only Florida and Virginia.

     On educational freedom (mapped as Figure 6), North Carolina also does fairly
     well with a ranking of 18th in the nation and 5th in the Southeast (behind
     Florida, Georgia, Louisiana, and Virginia). North Carolina’s strong protections
     for homeschooling (2nd in the nation) were helpful here, as was the passage of
     opportunity scholarships in 2013, which raised the state to 16th in the nation
     in private-school choice. But North Carolina ranks below the national average
     in public school choice. One reason is that most other states give families
     more ability to choose from among public schools in both their home and
     neighboring districts.

     When it comes to regulatory freedom (mapped as Figure 7), North Carolina
     has plenty of room for improvement. Our state ranks 36th in the nation and
     8th out of the 12 Southeastern states. Although North Carolina’s right-to-work
15
Figure 5: Fiscal Freedom Rankings
law, absence of state-level minimum wages, and recent tort reforms have been
helpful, our state has relatively weak protections against eminent domain
abuse and other encroachments on property rights (36th) and relatively strict
occupational-licensing laws (37th). We also rank poorly in regulatory policy
regarding auto insurance (50th) and homeowners insurance (39th).
The state’s worst showing is in health care freedom (Figure 8), where North
Carolina ranks 46th in the nation and dead last in the Southeast. The main
culprits are our poor rankings on certificate-of-need laws (48th), which restrict
choice and competition among hospitals and other medical providers, and
state benefit mandates on private health plans (33rd), which limit consumer
choice and drive up insurance premiums.
Again, keep in mind that some of the FFI variables, particularly those regarding
regulatory policy, have a lag time of several years. Some of the source data
come from 2012 or even earlier. So these measures have yet to be affected
by legislation that the North Carolina General Assembly (or other state
legislatures) may have enacted in 2013 or 2014. As JLF continues to produce
the FFI in future years, these policy changes may have the effect of moving
North Carolina up in the rankings even if the legislature pursues no additional
reforms. On the other hand, we may find that other states have already taken
steps over the past two years to move ahead of us on one or more freedom
rankings.16
Figure 6: Educational Freedom Rankings
Given this caveat, however, North Carolina policymakers can still use JLF’s
First in Freedom Index to draw important lessons and set policy priorities for the
2015 legislative session and beyond. According to our estimates, for example,
if North Carolina completely abolished its certificate-of-need regulations, as
13 other states already have, our ranking on health care freedom would rise
to 25th (from the current rank of 46th) and our overall FFI ranking would rise
to 16th (from the current rank of 23rd). Similarly, adopting the strong land-
use and property-rights protections of neighboring South Carolina would raise
North Carolina’s regulatory freedom ranking to 16th (from the current 36th)
and our overall FFI ranking to 19th.
Colorado has the nation’s least-restrictive licensing laws for citizens entering
new occupations. Emulating their approach would move North Carolina up
to 20th in regulatory freedom and 19th in overall FFI ranking. Colorado also
ranks high when it comes to public school choice, thanks to its strong charter-
school law, options for digital learning, and public-school enrollment policies
that favor parental preference over central-office student assignments. If North
Carolina matched Colorado in public-school choice, our educational freedom
ranking would rise to 13th (from the current 18th) and our overall FFI ranking
to 15th.17
Figure 7: Regulatory Freedom Rankings
Red States, Blue States, and Freedom
During the past several election cycles, it has become fashionable to identify Red
states, Blue states, and Purple states based on the partisan preferences of voters.
It turns out that these classifications of political culture may also have a bearing
on freedom-enhancing policies. Of the 10 states with the highest FFI rankings,
seven of them — Arizona, South Dakota, Georgia, Louisiana, Utah, Oklahoma,
and Wyoming — are deeply Red. That is, they have Republican-controlled
state governments, GOP majorities in their congressional delegations, two
Republican U.S. senators, and vote reliably Republican for president. At the
other end of the list, seven of the 10 states with the lowest FFI rankings are
either true Blue or lean Democratic: New York, New Jersey, California, Rhode
Island, Maryland, New Mexico, and Massachusetts.13
There are notable outliers in particular categories, however. Delaware is one
of only seven states in the country that are true Blue — having a Democratic-
controlled state government, Democratic majorities in the U.S. House,
two Democratic senators, and reliably Democratic votes for president. Yet
Delaware’s FFI ranking is 22nd, one step above our state’s rank. It scores
particularly high on fiscal freedom (13th) and health care freedom (7th). North
Carolina would do well to emulate Delaware’s approach to mandated benefits
on health insurance (3rd) and relatively low government spending as a share
of GDP (11th).18
Figure 8: Health Care Freedom Rankings
Two other true Blue states rank far higher than North Carolina does in a different
category, regulatory freedom. They are Vermont (5th) and Rhode Island
(12th). Vermont imposes some of the nation’s least-burdensome regulations
on utilities (1st) and insurance markets (2nd), while Rhode Island compares
favorably on occupational licensing (8th). Two Democratic-leaning Purple
states, New Hampshire (9th in overall FFI) and Pennsylvania (21st), also offer
instructive lessons for North Carolina. New Hampshire has one of the nation’s
best tax climates (7th). Pennsylvania scores well on property rights (5th) and
occupational licensing (10th).
FFI Rankings and Other Indicators
As discussed above, academic researchers have found statistically significant
relationships between the amount of freedom in a state and desired outcomes
such as economic growth or test score gains. Because the effects of state policies
often take many years to appear — as lower-taxed jurisdictions attract new
entrepreneurs, investors, and high-value professionals, for example, or school
competition leads to new and better educational options — the best studies use
lagged variables and other techniques to gauge the possible effects of public
policies.
For a newly constituted index such as FFI, then, it wouldn’t be valid to
compare state freedom rankings derived from, at most, four-year-old data
against economic or social trends that extend back much further in time. States19
ranking low in freedom in, say, 2004 might have changed their policies and
thus boosted their ranking by 2014. Furthermore, rigorous examination of
the potential relationships between state freedom and social outcomes would
require sophisticated regression equations to control for other causal factors
such as geography, climate, natural resources, or industrial mix.
Still, if readers want a preliminary snapshot of the issue, here are some
interesting comparisons:
• The 10 states with the highest FFI rankings have had a 2.3 percent annual
average growth rate in inflation-adjusted gross domestic product since 2011,
while the 10 states with the lowest FFI rankings have posted average annual
GDP growth rates of 1.5 percent.14
• The 10 states with the highest FFI rankings in educational freedom have
average National Assessment for Educational Progress (NAEP) scores for
low-income 4th-graders that are two points higher in reading and one point
higher in math than the average NAEP scores for low-income 4th-graders
in the 10 states with the lowest educational-freedom rankings.15
• The 10 states with the highest FFI rankings in health care freedom have
average health-care costs of $6,533 per person, according to the most recent
data from the Kaiser Family Foundation. The 10 states with the lowest
health care freedom have average health-care costs of $7,689 per person,
or 18 percent more than those of the 10 freest states.16
Again, these are just preliminary snapshots of statistical associations. They do
not necessarily constitute proof of a causal relationship. For example, perhaps
the leaders of states with fast-growing economies find it easier to build political
constituencies for tax cuts and regulatory relief. Growth might precede rather
than follow economic freedom, in other words. Moreover, the degree of
economic or personal freedom is never the only factor at play. Some states with
relatively low rankings on educational freedom might still produce higher-than-
average test scores due to other policies such as rigorous academic standards,
school autonomy, and financial rewards for high-performing teachers. To
address these concerns would require the use of sophisticated regression
analysis and lagged variables. The point here is simply that, at first glance,
JLF’s new First in Freedom rankings are certainly consistent with the findings
of scholarly research going back decades that indicate impressive economic
and social payoffs for states that embrace freedom as a policy priority.20
Conclusion
To say that North Carolina should be truly First in Freedom is not to say that the
state must reach that goal overnight. It will likely take years to build political
momentum for reform and work out the details of workable, sustainable policies
to advance fiscal, educational, regulatory, and health care freedom in our state.
North Carolinians are a practical and patient people as long as they have a clear
sense of where their leaders seek to take them. In other words, gradual steps are
fine as long as the long-term goal is both ambitious and consequential. It might
also be valuable for North Carolina policymakers to announce intermediate
goals — mileposts along the road to our ultimate destination, you might say. For
example, North Carolina currently ranks 16th in fiscal freedom. Making the top
10 would require us to pass Montana, Utah, Delaware, Virginia, and Kansas.
On educational freedom, North Carolina currently ranks 18th. Making that top
10 list would require us to pass Pennsylvania, Iowa, Utah, Colorado, Rhode
Island, Virginia, and New Hampshire. Having these intermediate goals in
mind could serve to sharpen the debate about the state’s policies and priorities.
Over the past four years, North Carolina has clearly been headed in the right
direction. Still, we have a long way to go. The journey won’t be an easy one.
There will be challenging obstacles and obstinate opponents. But the destination
will be worth it. As the ancient Athenian statesman Pericles put it: “Freedom is
the sure possession of those alone who have the courage to defend it.” In this
case, what we need are leaders who have the courage to reclaim it. Let’s make
North Carolina First in Freedom once more.21
Endnotes
1. John Hood, “Lower Taxes, Higher Growth: Scholarly Research Reveals Economic Benefits of
Fiscal Restraint,” Spotlight No. 452, John Locke Foundation, April 15, 2014.
2. John Hood and Terry Stoops, “Educational Freedom Works: Scholarly research shows gains
from school choice and competition,” Spotlight No. 454, John Locke Foundation, May 20,
2014.
3. Among the scholars who have demonstrated consistent links between health status and
economic growth is Harvard University’s Robert Barro. See, for example, Determinants of
Economic Growth: A Cross-Country Empirical Study, Cambridge, Mass.: The MIT Press, 1998.
4. Lauren Heller and Frank Stephenson, “Economic Freedom and Labor Market Conditions:
Evidence from the States,” Contemporary Economic Policy, Vol. 32, Issue 1, January 2014, p. 63.
5. Ryan A. Compton, Daniel C. Giedeman, and Gary A. Hoover, “Panel evidence on economic
freedom and growth in the United States,” European Journal of Political Economy, Vol. 27, 2011,
p. 433.
6. Nathan Ashby, “Economic Freedom and Migration Flows between U.S. States,” Southern
Economic Journal, Vol. 73, No. 3, January 2007, pp. 677-697.
7. Dennis Pearson, Dong Nyonna, and Kil-Joong Kim, “The Relationship Between Economic
Freedom, State Growth and Foreign Direct Investment in US States,” International Journal of
Economics and Finance, Vol. 4, No. 10, 2012, pp. 140-146.
8. Stephan J. Goetz and Anil Rupasingha, “Determinants of growth in non-farm proprietor
densities in the US, 1990–2000,” Small Business Economics, Vol. 32, Issue 4, April 2009, pp.
425-438.
9. Joshua Hall, Boris Nikolaev, John Pulito, Benjamin VanMetre, “The Effect Of Personal And
Economic Freedom On Entrepreneurial Activity: Evidence From A New State Level Freedom
Index,” American Journal of Entrepreneurship, Issue 1, 2013, pp. 88-103.
10. Tate Watkins and Bruce Yandle, “Can Freedom and Knowledge Economy Indexes Explain
Go-Getter Migration Patterns?” Journal of Regional Analysis and Policy, Vol. 40, Issue 2, 2010,
pp.104-115.
11. Robert W. Crandall, William Lehr, and Robert Litan, “The Effects of Broadband Deployment
on Output and Employment: A Cross-sectional Analysis of U.S. Data,” Issues in Economic
Policy No. 6, The Brookings Institution, June 2007, brookings.edu/research/papers/2007/06/
labor-crandall.
12. Jed Kolko, David Newmark, and Marisol Cuellar Mejia, “What Do Business Climate Indexes
Teach Us About State Policy and Economic Growth,” Journal of Regional Science, Vol. 53, No. 2,
2013, p. 236. The authors look at the factors within each index, as well, finding that corporate
taxes and public-assistance spending had the most significant effects.
13. For more details on the Red state, Blue state, and Purple state classifications, see John Hood,
“I Got the Red Blues,” Gaston Gazette, November 17, 2014, p. 4A.
14. U.S. Department of Commerce, Bureau of Economic Analysis, date for real chained-weighted
GDP growth 2011-13, bea.gov/regional/index.htm.
15. U.S. Department of Education, Institute of Education Sciences, National Center for Education
Statistics, National Assessment of Educational Progress (NAEP), 2013 mathematics and
reading assessments, nces.ed.gov/nationsreportcard.
16. “Health Care Expenditures per Capita by State of Residence: 2009,” Kaiser Family Foundation,
kff.org/other/state-indicator/health-spending-per-capita.22
Appendix: Methodology
To construct the 2015 First in Freedom Index, researchers from the John Locke
Foundation selected, standardized, and weighted quantitative and qualitative data
from state, national, and international sources.
Overall, there are over 60 variables in four major public policy areas used to calculate
the 2015 First in Freedom Index.
• Fiscal Policy, including taxes and government spending is 50 percent;
• Education Policy, including public and private school choice is 20 percent;
• Regulatory Policy, including land use, occupational licensing, and tort reform is
20 percent; and
• Healthcare Policy, including health insurance is 10 percent.
Washington, D.C., U.S. territories, and related jurisdictions were not included due to
data limitations.
Variables and Calculations
A project of this type requires different types of data drawn from various sources.
Conventional numerical or quantitative data, such as expenditures or tax rates,
are relatively easy to compare among states. Letter grades, point systems, yes/no
(dichotomous) variables, range of condition (non-dichotomous) variables, and other
types of metrics presented various challenges.
To begin the process of standardizing variables of different types, all figures were
converted to positive values, excluding any negatives or zero. If a dichotomous
scale was used, they were all converted to 1s and 2s. For example, we converted
dichotomous variables related to local rent control laws by assigning a 2 to yes and
a 1 to no. Similarly, data that came in the form of grades were assigned a numerical
value – F=1; D=2; C=3; B=4; A=5. Point systems, non-dichotomous variables, and
other types were scored accordingly.
As the above suggests, all ranges of values were organized so that lower values always
represented “less freedom” and higher values represented “more freedom.” In cases
when the opposite was true, the values in the data set were inverted, while maintaining
the original ratios from state to state.
The mean or average was calculated for each variable and then divided into five (5/
mean of x1, x2,…x50) to obtain a scaling factor. The scaling factor produced by this
calculation was multiplied by each state’s original value (for that series of variables
only) to produce a raw score. Weights were then applied to these raw scores and were
ranked accordingly.23 Weighting and Ranking The variables within each category were not weighted equally. Rather, each category and its constituent variables were weighted based on the perceived impact it has on economic, educational, and personal freedom. Within each component are weighted sub-indexes to more precisely measure the impact of the law or policy on individual liberty. As with most weighting schemes, the decision to weight some variables more highly than others was a deliberate, albeit somewhat arbitrary, decision. There is no research consensus indicating that a list of attributes and policies, proportioned in a specified way, signify that one state is freer than others. Nevertheless, there are certain policies that most free-market advocates would agree advance freedom for individuals and families. A state with a truly free system of schools, for example, will provide the means to allow all parents to choose the school that best meets the needs of their children. These opportunities should extend to those families who choose private, as well as district and public charter, schools. After weighting each variable, the values were ranked from lowest (least free) to highest (most free). Values for multiple variables were summed for each subcategory, each policy area, and across all four policy areas. Fiscal Policy Fiscal Policy consists of four sub-variables: tax burden, consumption expenditures by government, subsidies, and social insurance payments. Each sub-variable is rated on a 10-point scale and then weighted at twenty-five percent, three, four, and three percent respectively. The total weighted score for all sub-variables are what constitute the overall fiscal ranking which encompasses thirty-five percent of the total First in Freedom Index. Tax Burden We chose to use the Tax Foundation’s State Business Tax Climate Index to measure tax burden, because it is an indicator of which states’ tax systems are the most hospitable to business and economic growth. While many economists will disagree on how individuals and businesses react to taxes, in 1956 Charles Tiebout suggested that if citizens were faced with an array of communities that offered different types or levels of public goods and services at different costs or tax levels, then all citizens would choose the community that best satisfied their particular demands, revealing their preferences by “voting with their feet.” This study along with many others shows overwhelming evidence that business and individual decisions are significantly impacted by tax rates. The tax rates included in the State Business Tax Climate Index are only levied at the state level, and thus are controlled and amended only through decisions by state lawmakers making it a significant portion of a state’s fiscal policy ranking.
24

                               Category and Variable Weights
     Variables and Subvariables                                            Weight
     Fiscal Policy                                                          50.0%
     Tax Burden                                                             25.0%
        Individual Income Tax                                                8.0%
        Sales Tax                                                            5.4%
        Corporate Tax                                                        5.2%
        Property Tax                                                         3.7%
        Unemployment Insurance Tax                                           2.8%
     General Consumption Expenditures by Government as a percentage of GDP   5.0%
     Transfers and Subsidies as a percentage of GDP                         10.0%
     Social Insurance Payments as a percentage of GDP                       10.0%
     Education Policy                                                       20.0%
     Private School Choice                                                   9.5%
        Voucher Law                                                          2.0%
        Voucher Students as share of school-age population                   1.0%
        Voucher Funds per school-age child                                   1.0%
        Tax Credit Law                                                       2.0%
        Tax Credit Students as share of school-age population                1.0%
        Tax Credit Funds per school-age child                                1.0%
        Education Savings Accounts                                           0.5%
        Private Share                                                        1.0%
     Public School Choice                                                    8.5%
        Digital Learning Now! Report Card                                    1.0%
        Charter School Law                                                   2.0%
        Charter School Share                                                 1.0%
        Voluntary Intradistrict Open Enrollment                              1.0%
        Mandatory Intradistrict Open Enrollment                              1.0%
        Voluntary Interdistrict Open Enrollment                              1.0%
        Mandatory Interdistrict Open Enrollment                              1.0%
        Expanding Teaching Pool                                              0.5%
     Home School                                                             2.0%
        Home School Share                                                    1.0%
        Home School Law                                                      1.0%
     Regulatory Policy                                                      20.0%
     Land Use                                                                7.0%
        Regulatory Takings                                                   0.3%
        Wharton Residential Land Use Regulation Index                        3.0%
        Local rent control                                                   3.5%
        Eminent domain reform                                                0.2%

     Note: Percentages may not sum to 100.0% due to rounding.
25 Labor Market 3.5% Minimum wage 0.5% Right-to-work 2.0% Workers’ compensation coverage regulations 0.3% Workers’ compensation funding regulations 0.3% Short-term disability insurance 0.1% Paid family leave insurance 0.1% Employer verification of legal residency 0.1% Smoker protection regulations 0.1% Utilities 1.5% Telecommunication deregulation 1.0% Cable legislation for state issued franchise companies 0.5% Occupations 3.5% Employment-weighted licensure 1.0% Summed fees for all occupations licensed 0.1% Summed education/experience requirements for all occupations licensed 1.0% Summed exam requirements for all occupations licensed 0.4% Nurse practioners independent practice 0.7% Member of Nurse licensure compact 0.1% Dental hygienists initiate treatment 0.1% Physician Assistants prescribe controlled substances 0.1% Tort 3.0% Freedom from tort abuse 3.0% Insurance Regulations 1.5% Member of interstate insurance product regulation compact 0.3% State rate filing requirements personal auto insurance 0.5% State rate filing requirements homeowners insurance 0.5% State insurance rate classification prohibitions 0.2% Health Care Policy 10% Age adjusted community rating, group 1.5% Tobacco adjusted, group 0.4% Age adjusted community rating, individual 0.5% Tobacco adjusted, individual 0.4% COBRA continuation 0.2% Group conversion coverage, small firms 0.2% Group conversion rating limits 0.2% Financial incentives to providers banned 0.2% Small group rate review 0.7% Individual rate review 0.5% Standing referrals mandated 0.2% Certificate of Need Laws 3.0% Heath insurance mandates index 2.0%
26

     While taxes are a significant portion of the fiscal component in the Index, they are not
     the sole indicator of freedom within the component. The Fraser Institute publishes,
     The Economic Freedom of North America, of which we incorporated variables from
     their size of government component. Fraser used two ratings, the subnational and
     the all-government because the index includes Canada. At the all-government level,
     the index captures the impact of restrictions on economic freedom by all levels of
     government (federal, state/provincial, and municipal/local). At the subnational level,
     it captures the impact of restrictions by state or provincial and local governments. We
     chose to use the subnational level because the First in Freedom Index is focused on
     state freedom variables and not federal.
     We chose to use the three variables from this component because we felt they were a
     good representation of government decisions that effect personal economic freedom.
     Below are the three sub-variables and how they are measured along with explanations
     of why they are good measures for freedom.
     General Consumption Expenditures by Government as a Percentage of GDP
     Weighted at three percent of the total fiscal index, government consumption and
     expenditures are measured as total expenditures minus transfers to persons, transfers
     to businesses, transfers to other governments, and interest on public debt. While
     government can fulfill useful roles in society by providing protection and public
     goods, there is a tendency for government to undertake unnecessary activities as
     it expands. Once government expands into the provision of private goods, goods
     that can be produced by private firms and individuals, it restricts consumer choice
     and, thus, economic freedom. In other words, government spending, independent
     of taxation, by itself reduces economic freedom once this spending exceeds what is
     necessary to provide a minimal level of protective and productive functions.
     Transfers and Subsidies as a Percentage of GDP
     Weighted at four percent of the total fiscal index, transfers and subsidies include
     transfers to persons and businesses such as welfare payments, grants, agricultural
     assistance, food-stamp payments, housing assistance, and so on. When the government
     taxes one person in order to give money to another, it separates individuals from the
     full benefits of their labor and reduces the real returns of such activity. These transfers
     represent the removal of property without providing a compensating benefit and are,
     thus, an infringement on economic freedom. Put another way, when governments
     take from one group in order to give to another, they are violating the same property
     rights they are supposed to protect.
     Social Insurance Payments as a Percentage of GDP
     Weighted at three percent, social insurance payments by Employment Insurance,
     Workers Compensation, and various pension plans are included in this component.
     When mandatory government programs replace private, voluntary arrangements for
     retirement, or disability insurance, economic freedom is diminished.
27 Fiscal Sources Scott Drenkard and Joseph Henchman, “2015 State Business Tax Climate Index,” Tax Foundation, 2014, taxfoundation.org/sites/taxfoundation.org/files/docs/ TaxFoundation_2015_SBTCI.pdf Dean Stansel, José Torra, and Fred McMahon, “Economic Freedom of North America 2014,” Fraser Institute, 2014, fraserinstitute.org. Education The Educational Freedom ranking includes 18 variables. Eight of the variables rank state spending and participation in private school choice programs, such as tax credit scholarships, vouchers, and Education Savings Accounts (ESA). Eight of the variables examine public school choice, including virtual schools, charter schools, open enrollment, and expanding the teaching pool. The final two variables rank states based on the percentage of school-aged children in home schools and legal restrictions to homeschooling. All variables represent the latest data available from their respective sources. Before we settled on the current methodology for First in Freedom’s education index, we consulted available indices of school choice and educational freedom. The excellent studies discussed below greatly informed the development of our index. While the fiscal and regulatory sections of First in Freedom rely heavily on the Mercatus Center’s “Freedom in the 50 States,” we believe that the Mercatus ranking relied too heavily on variables dealing with homeschool and private school regulations. The Mercatus ranking includes six homeschool variables (curriculum control, law, notification requirements, recordkeeping requirements, standardized testing, and teacher qualifications); four private school variables (approval required, teacher licensure, registration, and curriculum control); two variables related to compulsory attendance (schooling years and mandatory kindergarten); and one school choice variable (tax credit/deduction). Individually, these variables are sound indicators of educational freedom, but collectively, they fail to capture the full scope of educational options afforded to states’ school-age populations. In 2005, Andrew Coulson of the Cato Institute created the Market Reform Metric (MRM) that ranked the quality of school choice reforms and the size of the market for schooling. To that end, Coulson’s goal was to quantify “the predicted share of enrollment in the private sector, the predicted “marketness” (or market quality) of private schools that accept vouchers or subsidies from the state (if vouchers or subsidies are included in the proposal), and the predicted marketness of private schools that do not accept vouchers.” Regrettably, MRM never became a permanent component of Cato’s education policy work, but his thoughtful discussion of input variables and methodology was useful for establishing the parameters for First in Freedom.
You can also read