Do Viruses From Managed Honey Bees (Hymenoptera: Apidae) Endanger Wild Bees in Native Prairies?
←
→
Page content transcription
If your browser does not render page correctly, please read the page content below
Environmental Entomology, XX(XX), 2021, 1–12
                                                                                                                   doi: 10.1093/ee/nvaa181
Pollinator Ecology and Management                                                                                                Research

Do Viruses From Managed Honey Bees (Hymenoptera:
Apidae) Endanger Wild Bees in Native Prairies?
Zoe A. Pritchard,1,2,5, Harmen P. Hendriksma,2, Ashley L. St. Clair,2,3 David S. Stein,2

                                                                                                                                                                 Downloaded from https://academic.oup.com/ee/advance-article/doi/10.1093/ee/nvaa181/6119321 by guest on 25 January 2021
Adam G. Dolezal,4 Matthew E. O’Neal,3 and Amy L. Toth2,3

1
 Montana Entomology Collection, Montana State University, Marsh Labs, Room 50, 1911 West Lincoln St., Bozeman, MT 59717,
2
 Department of Ecology Evolution, and Organismal Biology, Iowa State University, 251 Bessey Hall, 2200 Osborne Dr., Ames,
IA 50011, 3Department of Entomology, Iowa State University, 1344 ATRB, 2213 Pammel Drive, Ames, IA 50011, 4Department of
Entomology, University of Illinois Urbana-Champaign, 505 S. Goodwin Avenue, Urbana, IL 61801, and 5Corresponding author, e-mail:
zoepritchard12@gmail.com

Subject Editor: Gloria DeGrandi-Hoffman

Received 5 July 2020; Editorial decision 8 December 2020

Abstract
Populations of wild and managed pollinators are declining in North America, and causes include increases in
disease pressure and decreases in flowering resources. Tallgrass prairies can provide floral resources for managed
honey bees (Hymenoptera: Apidae, Apis mellifera Linnaeus) and wild bees. Honey bees kept near prairies may
compete with wild bees for floral resources, and potentially transfer viral pathogens to wild bees. Measurements
of these potential interactions are lacking, especially in the context of native habitat conservation. To address this,
we assessed abundance and richness of wild bees in prairies with and without honey bee hives present, and the
potential spillover of several honey bee viruses to bumble bees (Hymenoptera: Apidae, Bombus Latrielle). We found
no indication that the presence of honey bee hives over 2 yr had a negative effect on population size of wild bee
taxa, though a potential longer-term effect remains unknown. All levels of viruses quantified in bumble bees were
lower than those observed in honey bees. Higher levels of deformed wing virus and Israeli acute paralysis virus
were found in Bombus griseocollis DeGeer (Hymenoptera: Apidae) collected at sites with hives than those without
hives. These data suggest that the presence of honey bees in tallgrass prairie could increase wild bee exposure to
viruses. Additional studies on cross-species transmission of viruses are needed to inform decisions regarding the
cohabitation of managed bees within habitat utilized by wild bees.

Key words: Bombus, pathogen spillover, tallgrass prairie, deformed wing virus, Israeli acute paralysis virus

Many wild pollinators, including several bumble bee (Hymenoptera:                         et al. 2017), and within and cross species transmission of pathogens
Apidae, Bombus Latrielle) species, are in decline from multiple                           from managed bumble bees (Williams and Osborne 2009, Cameron
stressors (Goulson et al. 2003, 2008, 2015; Potts et al. 2010;                            et al. 2011, Meeus et al. 2011, Graystock et al. 2015) and managed
Morales et al. 2013; Klein et al. 2017; Aizen et al. 2020; Soroye et al.                  honey bees (Williams and Osborne 2009, McMahon et al. 2015,
2020). For example, in North America, the abundance and range                             Alger et al. 2019).
of Bombus occidentalis Greene, Bombus pensylvanicus DeGeer,                                   The honey bee (Hymenoptera: Apidae, Apis mellifera Linneaus)
Bombus affinis Cresson, and Bombus terricola Kirby have declined                          is a managed eusocial insect, which is kept and managed in hives
during the last 20 yr (Cameron et al. 2011). These declines are most                      by beekeepers worldwide—including in areas where they are
notable in the Midwestern United States, with the state of Illinois                       non-native, such as North and South America. Honey bee colonies
experiencing declines in half of its bumble bee species in the last cen-                  are perennial superorganisms that contain up to 50,000 workers, a
tury (Grixti et al. 2009). Recently, B. affinis was listed as a critically                subset of which forage outside the hive and can interact with wild
endangered species due in part to a substantial range reduction in                        bees (Hymenoptera: Apoidea) (Seeley 1995). The vast majority of
the continental United States, and several other once common spe-                         wild bees are solitary species or live in smaller, annual colonies
cies are listed as vulnerable to similar declines (Hatfield et al. 2015).                 (Michener 2007). Honey bees are floral generalists and have been
Potential causes of bumble bee decline are global warming (Soroye                         documented visiting ~40,000 different plant species globally (Crane
et al. 2020), loss of habitat to urbanization and intensive agricul-                      1990). Honey bees often overlap with wild bees in the flowers they
ture (Colla and Packer 2008, Grixti et al. 2009), insecticides (Baron                     visit (Thorp et al. 1994, Thorp 1996). In the absence of honey bee

© The Author(s) 2021. Published by Oxford University Press on behalf of Entomological Society of America. All rights reserved.
For permissions, please e-mail: journals.permissions@oup.com.
                                                                                                                                                            1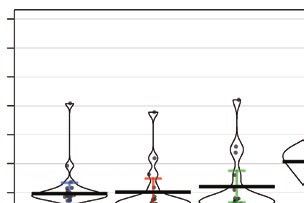
2                                                                                        Environmental Entomology, 2021, Vol. XX, No. XX

colonies, bumble bees were observed using a wider variety of flowers,      species from this region (Dolezal et al 2016). We predicted that the
suggesting resource competition (Pleasants 1981). This competition         presence of honey bee hives would increase wild bee exposure to
may be more acute in areas with limited floral resources, and floral       honey bee viruses, resulting in higher virus quantities in wild bees
resource availability has been linked to bee reproductive success          found foraging at prairies with apiaries. We hypothesized that man-
(Thomson and Page 2020). For example, Thomson showed reduced               aged honey bees in native habitats will negatively impact the wild
Bombus occidentalis reproductive success with closer proximity to          bee community due to competition for resources and viral transmis-
honey bee hives (Thomson 2004). However, there are few experi-             sion. To test our hypotheses, we placed honey bee hives at restored
mental studies that explain how wild bee communities respond to            tallgrass prairie sites in Iowa, assayed the wild bee community, and
the presence of multiple honey bee hives (but see Thomson 2004,            measured viral levels of DWV, IAPV, and LSV in two bumble bee
Alger et al. 2019), especially in the context of native, nonagricultural   species. We aimed to provide a more in-depth understanding of the
habitats. In a review of the impacts managed bees have on wild bees,       potential interaction between managed honey bees and wild bees in

                                                                                                                                                                Downloaded from https://academic.oup.com/ee/advance-article/doi/10.1093/ee/nvaa181/6119321 by guest on 25 January 2021
53% of 146 studies reported negative effects of managed bees on            the context of native habitat restoration.
wild bees (Mallinger et al. 2017). These emerging results suggest a
need for more information on direct impacts of managed honey bees
on wild bee communities and health.                                        Methods
    In addition to resource competition, honey bee colonies could          Site Selection and Honey Bee Hive Placement
pose a risk of pathogen transmission. The majority (70%) of                We selected seven prairie sites in the Chichaqua Bottoms Greenbelt
pathogen transmission studies have reported negative impacts of            (managed by Polk County Conservation) in Polk County (IA) during
managed bees on wild bees (Mallinger et al. 2017). Honey bee colony        the summer of 2017. Prairie sites were restorations composed of at
health is threatened by a variety of pathogens (VanEngelsdorp et al.       least 19.4 ha of prairie and were located between 1.1 and 33.71
2009, Wilfert et al. 2016, McMenamin and Flenniken 2018), includ-          km apart (Supp Table 1 and Supp Fig. 1 [online only]). To avoid
ing a suite of RNA viruses contributing to honey bee colony de-            foraging overlap of honey bee hives, and create independent sites,
clines globally. Black queen cell virus (BQCV), deformed wing virus        our minimum distance between prairie sites was based on an es-
(DWV), Israeli acute paralysis virus (IAPV), Lake Sinai virus (LSV),       timated average honey bee foraging distance in similar landscapes
and sac brood virus (SBV) are honey bee viruses that have been de-         (Couvillon et al. 2015, Carr-Markell et al. 2020). Four of the seven
tected in bumble bees and other wild bee genera (Li et al. 2011,           prairies received honey bee hives (hive (+)), while the remaining three
Peng et al. 2011, Fürst et al. 2014, Meeus 2014, Dolezal et al. 2016,      did not (hive (−)). The year 2017 was the first year that these sites
Parmentier et al. 2016, Radzevičiūtė et al 2017, Wang et al. 2018).        had honey bee hives present, based on conversations with the land
Because RNA viruses have high mutation rates and short generation          area manager (ALT, personal communication). At hive (−) sites, we
times, they can easily adapt to new host species (Drake and Holland        confirmed that there were no managed hives present within 1 km by
1999, Li et al 2014), and transmission is likely facilitated by foraging   checking the Iowa voluntary hive registry (https://driftwatch.org/)
for pollen and nectar on shared floral resources (Singh et al. 2010,       and through visual inspection of the surrounding region. During the
Goulson et al. 2015, Alger et al. 2019).                                   summer of 2018, we revisited the same seven prairie sites, and hive
    The viruses found in honey bees are potentially harmful to             treatments (i.e., hive (+) and hive (−) locations) were assigned to the
bumble bees. For example, DWV infected bumble bees can suffer              same prairies as in 2017. In 2018, we added four additional prairie
from wing deformations that impede their ability to fly (Genersch          sites; three at Chichaqua Bottoms and one in Story County, Iowa,
2006). Bombus terrestris Linnaeus injected or fed IAPV inocula ex-         for a total of 11 sites (6 hive(+) and 5 hive(−)). Pan trapping was
hibited increased mortality rates (Wang et al. 2018). However, the         conducted at the same six sites in 2017 and in 2018 for the wild bee
infectivity, prevalence, and health impacts of many honey bee viruses      community data, while hand netting was conducted at all sites (see
are unknown, and the directionality of virus transmission between          Supp Table 1 [online] for site use details).
bee species is not always certain (McMahon et al. 2015, Galbraith              At hive (+) sites, we placed four honey bee hives on a wooden
et al. 2018). Based on their prevalence, BQCV and DWV seem to              pallet located 20 m from the edge of the prairie (Fig. 1). We trans-
be linked to honey bees and ABPV and slow bee paralysis virus to           ported the hives to hive (+) prairies on 10 August 2017. In 2018,
bumble bees, but we still lack conclusive evidence to be sure of pri-
mary reservoir hosts (Fürst et al. 2014, McMahon et al. 2015).
    Honey bees and bumble bees are both in subfamily Apinae
(Bossert et al. 2019), can harbor some of the same viruses (Dolezal
et al. 2016, Alger et al. 2019), and share many floral resources that
are potential sites of pathogen transmission (Durrer and Schmid-
Hempel 1994, Graystock et al. 2015, Alger et al. 2019). For example,
IAPV transmission between honey bees and three common bumble
bee species (Bombus impatiens Cresson, Bombus vagans Smith, and
Bombus ternarius Say) occurred by shared flower visitations (Singh            20 m         60 m         30 m              30 m         60 m         20 m
et al. 2010). With a growing body of research on pathogen transmis-
                                                                                                                   20 m
sion within Apinae, the interactions between honey bees and bumble
bees deserve further exploration.
    Our goal was to understand the competition and health risks            Fig. 1. Placement of hives and trap stand transects at prairie sites in central
                                                                           Iowa during 2017 and 2018. Each cluster of circles represents one trap stand
associated with wild bees sharing habitat with honey bee hives. We
                                                                           containing one pan trap of each color: blue, white, and yellow. Trap stands were
studied this in the context of native prairie in Iowa because this
                                                                           placed in this orientation regardless of whether hives were present or not. At
habitat has been pinpointed as an area of major concern for bee            each pan trap collection, all bowls from each trap stand were combined resulting
health and conservation (Grixti et al. 2009, Koh et al. 2016) and          in one collection of bees per site per day. (For color version of this figure, see
honey bee viruses were previously detected in a variety of wild bee        online).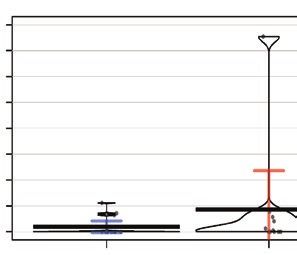
Environmental Entomology, 2021, Vol. XX, No. XX                                                                                               3

hives were moved to Lloyd Bailey, Engeldinger, and Kunze on 6 June         sample size, we sweep-netted additional bumble bees at each site
2018 (sites not involved in wild bee community pre/post hive-move          in late summer of 2017. An observer walked within the prairie for
comparisons) and to Barrer, Sandhill, and Darnell Holy Cross on 10         15 min, pausing the timer to collect bumble bees foraging on flowers.
August 2018. Prior to placement at the prairie, the hives were kept        Collections occurred between 9 am to 5 pm, during peak pollinator
within soybean fields (around Ames, IA). Throughout the summer,            activity on days when conditions are optimal for bee foraging ac-
we inspected hives using methods from Dolezal et al. (2019) as fol-        tivity (e.g., limited cloud cover, temperatures >19°C, low to no wind)
lows: every other week we checked colony weights, queen presence,          per previously established methods (Hines and Hendrix 2005). The
levels of Varroa destructor, and provided more hive space when             sweep net collection in 2017 took place across six dates from 30
needed. Mean monthly hive weights and mite counts are provided in          September to 12 October 2017. We focused on collecting the rela-
Supp Tables 2 and 3 (online only).                                         tively abundant male B. impatiens Cresson bees, since female bumble
    All prairie sites were embedded in a larger agricultural landscape.    bee workers had become relatively rare this late in the season. At

                                                                                                                                                    Downloaded from https://academic.oup.com/ee/advance-article/doi/10.1093/ee/nvaa181/6119321 by guest on 25 January 2021
In Iowa, approximately 85% of the landscape is in use as farm-             hive (+) sites, an ~100 worker honey bees were sampled from the
land, mainly for corn and soybean production (NASS-USDA 2017).             brood nest from each hive (due to their location in the brood nest,
Pesticides were not applied at our sites, but there is possibility of      these can be putatively assigned to the brood caring subcaste known
pesticide use in the adjacent landscape that we did not control for.       as ‘nurse bees’). The netted bumble bees and sampled nurse honey
Descriptions of the floral resources present at these sites are provided   bees were kept on ice for no more than 6 h, and then transferred to
in another paper (Zhang et al. in review), thus they are not included      a −80°C freezer before further processing (as in Dolezal et al. 2016).
here. That study gave no indication that floral resources differ sys-          In 2018, we increased our sampling effort of bumble bees for
tematically between honey bee and nonhoney bee sites.                      viral analysis by conducting targeted sweep netting as in 2017 start-
                                                                           ing on 20 July 2018 and ending 30 September 2018. This allowed us
Wild Bee Abundance and Taxon Richness                                      to collect not only female workers, but also multiple species which
To assess the abundance and richness of the wild bee community at          were abundantly foraging during that time. Additionally, this earlier
the hive (+) and hive (−) sites, we used pan traps (i.e., bee bowls) as    sampling time frame overlaps more with a period during which
modified by Gill and O’Neal (2015). Traps were 3.2 oz Solo brand           honey bees are known to actively forage in prairie landscapes (Carr-
cups painted either fluorescent blue, fluorescent yellow, or left white.   Markell et al. 2020), making it potentially more useful for detecting
This color combination attracts a robust community of bees (Droege         viral spillover. We collected B. impatiens and B. griseocollis worker
et al. 2010). We assembled three pan traps, one of each color, on a        (female) bumble bees at all sites approximately once per week, re-
stand at vegetation height (these are hereafter referred to as trap        sulting in six sample dates. We were especially interested in worker
stands). We placed trap stands on either end of a 60-m transect, with      bumble bees because they forage for both pollen and nectar, unlike
two transects within a prairie (Fig. 1). Each transect consisted of a      male bumble bees, and would therefore be more likely to be exposed
total of six trap stands, three on each end of the transect. We placed     to honey bee viruses transferred in the environment via floral re-
trap stands 10 m apart from each other and 20 m from the prairie           source sharing.
edge. Each transect was located 60 m apart. At hive (+) prairies, each         In 2018, we collected nurse honey bees from the brood nest of
transect was placed such that the nearest end of the transect was          hives at hive (+) sites, as in 2017. We additionally captured honey
30 m from the hives and the farthest end was 90 m from the hives           bee foragers from flowers at hive (+) sites by sweep-netting—since
(Fig. 1). This set up resulted in a total of 36 individual pan traps       they may potentially transfer viruses from their hives to other bee
placed in each prairie site.                                               species. Collected honey and bumble bees were stored as described
    We collected wild bees in pan traps once a week over a 7-wk            above. No threatened or endangered species were collected. Bumble
period in 2017 (26 July to 20 September 2017) and over a 6-wk              bee species caught at each site via netting are listed in Supp Table 5
period in 2018 (24 July to 27 September 2018). We set pan traps            (online only).
between 7 and 10 am by filling pan traps with 50 ml of 0.2% soapy
water solution. We collected the trap contents after 24 h. Each week       Virus Extraction and Quantification
we adjusted the pan traps on the stand such that traps were level          In 2017, we measured viral titers of DWV in male B. impatiens
with the flowering plants. At hive (+) sites, three collections occurred   (n = 53) and nurse honey bees (n = 21). In 2018, we measured DWV,
prior to the placement of honey bee hives (premove) and three col-         LSV, and IAPV in female B. griseocollis (n = 22), female B. impatiens
lections took place after the hives were placed (postmove).                (n = 16), as well as nurse honey bees (n = 20) and foraging honey
    We processed bees by washing and drying each specimen using            bees (n = 16). To extract RNA from all bee samples, we crushed an
methods developed by Droege (2015). After processing, bees were            individual whole bee body in Trizol, removed DNA contamination
pinned and identified utilizing keys developed by Michener et al.          with a DNAse treatment, and standardized to a constant RNA con-
(1994) and Ascher and Pickering (2017). We identified bees to spe-         centration. We detected viruses using real-time qRT-PCR methods
cies, excluding those belonging to genus Lasioglossum, Curtis which        (Sybr Green with a BioRad CFX-384 real-time quantitative PCR
were identified to subgenus. ‘Taxon richness’ is, therefore, defined as    machine) using previously published primers for deformed wing
total number of species or Lasioglossum subgenera. Supplementary           virus (DWV), Israeli acute paralysis virus (IAPV), and Lake Sinai
Table 4 (online only) lists bee taxa caught at each site through pan       virus (LSV) (see Supp Table 6 [online only]; Carrillo-Tripp et al.
trapping.                                                                  2016, Dolezal et al. 2016). Following the methods of Carrillo-Tripp
                                                                           et al. 2016, we estimated virus titers (genome equivalents/100 ng
Bumble bee and honey bee sampling for virus                                RNA) using a standard curve. The standard curve was based on a
analysis                                                                   known quantity of viral fragment RNA, previously generated based
Throughout the pan trap sampling in 2017, we occasionally cap-             on RT–PCR and cloning of each virus (Carrillo-Tripp et. al. 2016).
tured individual bumble bees, but we did not achieve capture rates         We then serially diluted the RNA (1:10) with molecular grade water
that provided sample sizes suitable for viral analysis. To increase        to create a range of viral titers. This standard curve allowed us to
4 Environmental Entomology, 2021, Vol. XX, No. XX
calculate genome equivalents (from the quantity of viral fragment the log-transformed data were used in the ANOVA test, otherwise,
RNA and viral reference sequence for each virus) for each sample the untransformed data were used. We compared overall wild bee
for each target virus, which were calculated on the Bio-Rad CFX abundance and taxon richness between hive (+) sites and hive (−)
software. On each qPCR plate, we ran two replicates of the standard sites using a mixed model analysis of variance (ANOVA) in SAS 9.4
curve, as well as molecular grade water samples as negative controls (PROC GLIMMIX). PROC GLIMMIX was used as it is capable of
alongside the samples. The qPCR program used 45 cycles. We exam- working with non-normal data. The statistical model used included
ined melting curves of qPCR products to ensure that target products main effects of hive presence and date, with location as a random
were amplified. Any curves that amplified nontarget products were variable, and a separate model was run for each year of the study. To
removed from analysis, as these could be due to primer dimerization compare the bee community between hive (+) and hive (−) sites, and
or other qPCR artifacts. We examined cycle threshold (Ct) values between premove and postmove dates, we conducted post hoc com-
of the samples and report these values for each qPCR run in Supp parisons of least squared means using a Tukey adjustment within
Downloaded from https://academic.oup.com/ee/advance-article/doi/10.1093/ee/nvaa181/6119321 by guest on 25 January 2021
Table 7 (online only). Although some samples had high Ct values, the model.
we included them as they showed target product amplification, and As we were interested in potential competitive effects of honey
prior research corroborates the validity of including data with high bees on closely related wild bees, we conducted separate analyses
Ct values (McCall et al. 2014). In 2017, we tested male B. impa- of abundance and taxon richness using the same SAS model as
tiens and hive-collected nurse honey bees for quantities of DWV. In above for the subset of wild bees in family Apidae as well as family
2018, we tested female B. impatiens, female B. griseocollis, honey Halictidae. We did not conduct separate analyses for bees in families
bee foragers, and hive-collected nurse honey bees for quantities of Colletidae or Megachilidae because of insufficient sample sizes for
DWV, IAPV, and LSV. bees within those families.
Previous studies set a conservative ‘virus detection threshold’ for To analyze viral quantities in bumble bees and honey bees, we
honey bees based on the technical limits of detection for each primer; averaged the viral estimated genome equivalent (titer) measurement
these limits were 4.92E + 02 viral genome equivalents for LSV and between the two qPCR replicates for each individual bee. In order
IAPV, and 4.92E + 03 viral genome equivalents for DWV (Carrillo- to be able to normalize the data through log transformation, we cal-
Tripp et al. 2016, Dolezal et al. 2016). We used the same primers and culated log10 (virus titer+1), which allowed us to retain zero values
standard curve procedure as Dolezal et al. (2016) to determine levels in the dataset. Zero values were defined as samples producing no
of viral genome equivalents in our samples. According to levels de- amplification in the qPCR. We used RStudio (RStudio Team 2019)
tected in previous papers, virus titers in the current study were gener- packages ‘nlme’ (Pinheiro et al. 2020) and ‘yarrr’ (Phillips 2017) to
ally very low, with many samples below the previously set threshold, analyze viral data with linear mixed models and to produce pirate
especially in bumble bee samples of IAPV and DWV. plots, showing raw data (points), descriptive statistics (lines), and
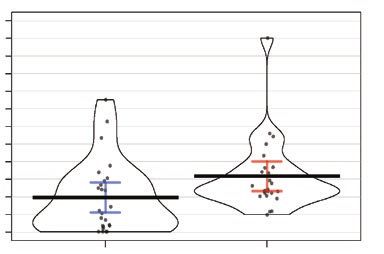
Although viral titers were generally low, we were interested to inferential statistics (intervals) (Figs. 6 and 7). We compared viral
further explore the full dataset, including samples below the pre- levels between honey bees and bumble bees, and within bumble bees
viously set conservative honey bee threshold, but still showing evi- at the two site types using ANOVA and Tukey post hoc analyses.
dence of amplification. We did this for two reasons: first, there was
still some variability among the titers and we wanted to investigate
whether this variation was meaningful (i.e., variation between site Results
types). Second, we wanted to explore these samples to include all Honey Bee Abundance
data to address possible low-level exposure to viruses that may have Pan traps can be used to provide rough assessments of honey bee
the potential to still be biologically relevant. To do this, we calculated abundance (St. Clair et al. 2020a); thus, we used this method to
titers based off of the curve for all samples that amplified, including validate that hive (+) sites had increased honey bee activity density
samples that were below the previously published threshold. compared to hive (−) sites. Over the two years we collected a total
of 69 honey bees in pan traps (15 in 2017 and 54 in 2018). In both
Statistical Analysis years, we observed an order of magnitude more honey bees in pan
To analyze the abundance and taxon richness of wild bees, we com- traps at hive (+) sites compared to hive (−) sites (13 vs 2 in 2017;
bined pan traps from both transects within a site at each date, re- 50 vs 4 in 2018, respectively). During 2017, we observed signifi-
sulting in one measure of bee abundance and taxon richness per site cantly more honey bees in traps in hive (+) sites compared to hive
per date. We defined abundance as the number of individual speci- (−) (F1,38 = 6.53; P = 0.02; Fig. 2A). Collections varied significantly
mens captured per site per date, and taxon richness as number of by date (i.e., pre- or postmove), with more bees captured postmove
bee species, or Lasioglossum subgenera, captured per site per date (F1,38 = 5.12; P = 0.03; Fig. 2A) but no interactions of hive presence
(as in Stein et al. 2020). We removed counts of honey bees from and hive move (F1,38 = 1.93; P = 0.17; Fig. 2A). Within the hive (+)
pan traps from the wild bee analysis because specimens caught were sites, there was significantly higher abundance of honey bees caught
likely from our hive treatments (St. Clair et al. 2020a). However, we postmove compared to premove (T38 = 2.58; P = 0.01; Fig. 2A),
separately compared honey bee abundance between site types to val- whereas there was no significant difference between dates in hive (−)
idate whether we achieved the desired effect of adding hives to the sites (T38 = 0.62; P = 0.54; Fig. 2A). At postmove dates, there were
selected prairies. significantly more honey bees captured at hive (+) sites than hive (−)
We checked for normality of each abundance or taxon richness sites (T38 = 3.01; P = 0.01; Fig. 2A) while there was no difference
response variable using PROC UNIVARIATE (Supp Table 8 [on- between site types at premove dates (T38 = 0.77; P = 0.44; Fig. 2A).
line only]). If response variables did not meet the assumptions of We observed the same pattern in 2018, i.e., a significant effect of
normality, we used a logarithmic transformation to improve nor- hive presence (F1,38 = 7.97; P = 0.01; Fig. 2B) with more honey bees
mality and ran the analysis with the log-transformed data. Some captured in hive (+) sites, a significant effect of date (F1,38 = 6.34;
log-transformed responses were still not normal (P < 0.05), so the P = 0.02; Fig. 2B) with more bees captured posthive move, and a
data distributions were visualized. If distributions were improved, significant interaction of hive* date (F1,38 = 5.4; P = 0.03; Fig. 2B).Environmental Entomology, 2021, Vol. XX, No. XX 5
Within the hive presence treatments, we observed significantly were significantly more honey bees captured in hive (+) sites (T38=
more honey bees at hive (+) sites postmove compared to premove 4.05; P < 0.01; Fig. 2B).
(T38 = 3.52; P < 0.01; Fig. 2B), whereas there was not a significant
difference between pre- and postmove for hive (−) sites (T38= 0.13;
P = 0.89; Fig. 2B). When comparing between hive presence treat- Wild Bee Abundance and Taxon Richness
ments we observed no significant difference between hive (+) and In 2017, we caught a total of 974 wild bees in pan traps, rep-
hive (-) premove (T38 = 0.32; P = 0.75; Fig. 2B), but postmove, there resenting at least 50 species. We trapped 565 specimens at sites
with honey bee hives, and 409 at sites without hives. Of these,
we identified 635 Halictidae (16 species or Lasioglossum sub-
A 1.4 2017 B 5
2018 genera), 272 Apidae (22 species), 47 Colletidae (3 species), and
1.2 20 Megachilidae (9 species). We identified 86 Bombus specimens
Downloaded from https://academic.oup.com/ee/advance-article/doi/10.1093/ee/nvaa181/6119321 by guest on 25 January 2021
4
bees /site/day
1 Mean honey
representing 8 different species. In 2018, we caught a total of 149
bees/site/day
Mean honey
0.8 3 wild bees in pan traps, representing at least 22 species. We trapped
* ‡ * ‡
0.6 2 79 specimens at hive (+) sites, and 70 from at (−) sites where hives
0.4
1 were absent. Of these wild bees, we identified 59 Halictidae (8 spe-
0.2
cies or Lasioglossum subgenera), 88 Apidae (13 species), and 2
0 0
Pre-move
PreMove Post-move
PostMove Pre-move
PreMove Post-move
PostMove Megachilidae (1 species). We identified 37 specimens of Bombus
Hive (+) Hive (-)
representing 4 species. Honey bees were excluded from all analyses
of wild bee abundance and taxon richness.
In 2017, the overall wild bee abundance varied signifi-
cantly with both hive presence and date (premove or postmove)
Fig. 2. Mean abundance of honey bees captured in pan traps per site per date
in 2017 (A) and 2018 (B) in prairies with (solid line) and without (dotted line) the
(F1,38 = 10.31; P < 0.01 for hive presence, F1,38 = 8.20; P = 0.01 for
presence of honey bee hives in central Iowa. Premove indicates collections hive date; Fig. 3A), with no significant interaction (F1,38 = 0.64;
made before hives were moved onto hive (+) sites and includes three dates P = 0.43; Fig. 3A). Postmove dates had significantly lower abun-
during 2017 and 2018. Postmove indicates collections made after hives were dance than premove dates in hive (−) sites, and slightly lower
moved onto hive (+) sites and includes three dates in 2017 and four dates abundance during postmove dates compared to postmove dates
in 2018. Results based on ANOVA and Tukey post hoc comparisons. Error
in hive (+) sites (T38 = 2.59; P = 0.01 for hive (−); T38 = 1.46;
bars represent one standard error of the mean. Asterisks signify significant
P = 0.15 for hive (+); Fig. 3A). Surprisingly, wild bee abundance
differences (P < 0.05) between pre- and postmove within a hive presence
treatment and the double cross indicates significant differences between at postmove dates was higher at hive (+) sites, but there was no
hive presence treatments at pre- and postmove time points. significant difference for premove dates (T38 = 3.06; P < 0.01 for
A B
2017 2017
Mean wild bee taxon
50
abundance/site/day
12
richness/site/day
Mean wild bee
40 10
30
8 ‡
6
20
10 * ‡ 4
2
0 0
PreMove Post-move
Pre-move PostMove Pre-move
PreMove Post-move
PostMove
C 2018 D 2018
6 4
abundance /site/day
Mean wild bee taxon
richness/site/day
5
Mean wild bee
3
4
3 2
2
1
1
0 0
PreMove Post-move
Pre-move PostMove Pre-move
PreMove Post-move
PostMove
Hive (+) Hive (-)
Fig. 3. Mean abundance of wild bees collected per site per date in 2017 (A) and 2018 (B) as well as mean taxon richness of wild bees collected in 2017 (C) and
2018 (D) in prairies with (solid line) and without (dotted line) the presence of honey bee hives in central Iowa. Premove indicates collections made before hives
were moved onto hive (+) sites and includes three dates during 2017 and 2018. Postmove indicates collections made after hives were moved onto hive (+) sites
and includes three dates in 2017 and four dates in 2018. Results based on ANOVA and Tukey post hoc comparisons. Error bars represent one standard error of the
mean. Asterisks signify significant differences (P < 0.05) between pre- and postmove within a hive presence treatment and the double cross indicates significant
differences between hive presence treatments at pre- and postmove time points.6 Environmental Entomology, 2021, Vol. XX, No. XX
postmove dates; T38 = 1.59; P = 0.12 for premove dates; Fig. 3A). only the postmove dates showed a significant difference between site
Taxon richness of the wild bee community significantly varied by types (T38 = 3.51; P < 0.01 at postmove dates; T38 = 1.79; P = 0.08
hive presence, but not by date nor the interaction of date and hive at premove dates; Fig. 4B).
presence in 2017 (F1,4.17 = 12.53; P = 0.02 for hive; F1,34 = 1.49; In 2018, Apidae abundance did not vary significantly by hive pres-
P = 0.23 for date; F1,34 = 0.75; P = 0.39 for interaction; Fig. 3B). ence, date, or the interaction between the two (F1,38 = 0.18; P = 0.67
Again, contrary to predictions, we observed a trend of higher for hive; F1,38 = 0.07; P = 0.7921 for date; F1,38 = 1.22; P = 0.277
taxon richness of bees collected in hive (+) sites compared to hive for interaction; Fig. 4C). Apidae taxon richness did not vary sig-
(−) sites (T17.77 = 1.78; P = 0.09 for premove dates; T11.35 = 3.37; nificantly by hive presence, date, nor the interaction (F1,38 = 0.06;
P < 0.01 for postmove dates; Fig. 3B). P = 0.81 for hive; F1,38 = 0.06; P = 0.81 for date; F1,38 = 1.71; P = 0.20
In 2018, wild bee abundance did not vary significantly by hive for interaction; Fig. 4D).
presence, date, nor an interaction between the two (F1,3.99 = 0.00;
Downloaded from https://academic.oup.com/ee/advance-article/doi/10.1093/ee/nvaa181/6119321 by guest on 25 January 2021
P = 0.98 for hive; F1,34.06 = 0.77; P = 0.39 for date; F1,34.06 = 0.22; Halictidae Only
P = 0.64 for interaction; Fig. 3C). Taxon richness of all wild bees Halictidae abundance in 2017 varied significantly by date, but not
in 2018 did not vary significantly by hive presence, date, nor their by hive presence or the interaction (F1,4.06 = 2.57; P = 0.18 for hive
interaction (F1,38 = 0.00; P = 0.98 for hive; F1,38 = 0.17; P = 0.68 presence; F1,34 = 24.13; P < 0.01 for date; F1,34 = 0.22; P = 0.64 for
for date; F1,38 = 0.01; P = 0.94 for interaction; Fig. 3D). interaction; Fig. 5A). There was strong evidence for more Halictidae
at premove dates compared to postmove dates in both hive (+) and
Apidae Only hive (-) sites (T34 = 3.14; P < 0.01 at hive (+); T34 = 3.80; P < 0.01 at
Apidae abundance in 2017 did not vary significantly by hive pres- hive (−) sites; Fig. 5A). There was no significant difference between
ence, date, nor their interaction (F1,4.08 = 4.96; P = 0.09 for hive site types at either premove or postmove dates. Halictidae taxon
presence; F1,34 = 0.04; P = 0.85 for date; F1,34 = 0.78; P = 0.38 for richness did not vary significantly by hive, date, nor interaction in
interaction). At postmove dates, Apidae abundance was higher at the model, but trended towards higher taxon richness at hive (+)
hive (+) sites compared to hive (−; T7.10 = 2.45; P = 0.04; Fig. 4A), sites and at premove dates in 2017 (F1,4.1 = 3.63; P = 0.13 for hive
which is in line with the results for all bees mentioned above. Apidae presence; F1,34 = 3.92; P = 0.06 for date; F1,34 = 0.07; P = 0.80 for
taxon richness in 2017 (Fig. 4B) varied significantly by hive pres- interaction; Fig. 5B).
ence (F1,38 = 13.35; P < 0.01) but not by date or the interaction In 2018, Halictidae abundance varied significantly by date, but
(F1,38 = 1.77; P = 0.19 and F1,38 = 0.90; P = 0.35, resp.). Hive (+) sites not by hive presence or the interaction between date and hive pres-
showed higher species richness at both pre- and postmove dates, but ence (F1,34.06 = 6.84; P = 0.01 for date; F1,4.01 = 0.02; P = 0.89 for
A 2017 B 2017
12 8
Mean Apidae taxon
abundance/site/day
richness/site/day
10
6
Mean Apidae
8
6 ‡ 4 ‡
4
2
2
0 0
T1
Pre-move T2
Post-move T1
Pre-move T2
Post-move
2018
C D 2018
4 2.5
abundance /site/day
Mean Apidae taxon
richness/site/day
3 2
Mean Apidae
1.5
2
1
1
0.5
0 0
Pre-move
PreMove Post-move
PostMove Pre-move
PreMove Post-move
PostMove
Hive (+) Hive (-)
Fig. 4. Mean abundance of Apidae collected per site per date in 2017 (A) and 2018 (B) as well as mean species richness of Apidae collected in 2017 (C) and
2018 (D) in prairies with (solid line) and without (dotted line) the presence of honey bee hives in central Iowa. Premove indicates collections made before hives
were moved onto hive (+) sites and includes three dates during 2017 and 2018. Postmove indicates collections made after hives were moved onto hive (+) sites
and includes three dates in 2017 and four dates in 2018. Results based on ANOVA and Tukey post hoc comparisons. Error bars represent one standard error of
the mean. Asterisks signify significant differences (P < 0.05) between premove and postmove within a hive presence treatment and the double cross indicates
significant differences between hive presence treatments at premove and postmove time points.Environmental Entomology, 2021, Vol. XX, No. XX 7
A 2017 B 2017
Mean Halictidae taxon
abundance/site/day
40 6
richness/site/day
Mean Halictidae
5
30
20
* 4
3
10 2
* 1
0
Pre-move Post-move 0
PreMove PostMove Pre-move Post-move
PreMove PostMove
Downloaded from https://academic.oup.com/ee/advance-article/doi/10.1093/ee/nvaa181/6119321 by guest on 25 January 2021
C 2018 D 2018
1.6
abundance/site/day
4
Mean Halictidae taxon
1.4
Mean Halictidae
richness/site/day
3 1.2
2
* 1
0.8
0.6
1 0.4
0.2
0 0
Pre-move
PreMove Post-move
PostMove Pre
Pre-move Post
Post-move
Hive (+) Hive (-)
Fig. 5. Mean abundance of Halictidae collected per site per date in 2017 (A) and 2018 (B) as well as mean taxon richness of Halictidae collected in 2017 (C) and
2018 (D) in prairies with (solid line) and without (dotted line) the presence of honey bee hives in central Iowa. Premove indicates collections made before hives
were moved onto hive (+) sites and includes three dates during 2017 and 2018. Postmove indicates collections made after hives were moved onto hive (+) sites
and includes three dates in 2017 and four dates in 2018. Results based on ANOVA and Tukey post hoc comparisons. Error bars represent one standard error of the
mean. Asterisks signify significant differences (P < 0.05) between pre- and postmove within a hive presence treatment and the double cross indicates significant
differences between hive presence treatments at pre- and postmove time points.
A. DWV B. LSV
C 9 B
10
Log Average Estimated
Log Average Estimated
8 7
Genome Equivalents
Genome Equivalents
A AB
B A
6
5
4
A A
3
2
0 1
B. griseocollis B. impatiens Forager Hive B. griseocollis B. impatiens Forager Hive
C. IAPV
4
Log Average Estimated
Genome Equivalents
3
2
1
0
B. griseocollis B. impatiens Forager Hive
Fig. 6. Log average estimated genome equivalents for the DWV (A), LSV (B), and IAPV (C) in 2018, compared between the two bumble bee species, honey bee
foragers, and nurse honey bees from the hive. Letters denote estimated genome equivalents significantly different from other bee categories (P < 0.05). In IAPV,
no category was significantly different from another. Significance determined with ANOVA and Tukey post hoc analysis. Full statistical report in Supp Table 9
(online only).8 Environmental Entomology, 2021, Vol. XX, No. XX
A. IAPV: B. griseocollis female 2018 B. DWV: B. griseocollis female 2018
1.2
* 2.4
Log Average Estimated
Genome Equivalents
Log Average Estimated
Genome Equivalents
2
1
1.6
0.8 1.2
0.8
0.4
0.4
0 0
Downloaded from https://academic.oup.com/ee/advance-article/doi/10.1093/ee/nvaa181/6119321 by guest on 25 January 2021
Hive (-) Hive(+) Hive (-) Hive(+)
C. DWV: B. impatiens male 2017
4.4
4
Log Average Estimated
Genome Equivalents
3.6
3.2
2.8
2.4
2
Hive (-) Hive(+)
Fig. 7. Viral levels of IAPV in Bombus griseocollis females (A), DWV in B. griseocollis females (B), and DWV in Bombus impatiens males (C) in bumble bees
caught at hive (+) sites compared to those from hive (−) sites. IAPV and DWV quantities were higher in B. griseocollis at hive(+) sites than hive(−) sites (P < 0.001,
P = 0.071, respectively, ANOVA), and DWV quantities were higher in male B. impatiens at hive(+) sites (P = 0.138, ANOVA). Full statistical report in Supp Table
10 (online only).
hive presence; F34.06 = 3.15; P = 0.09 for the interaction). At hive Supp Table 9 [online only]). For LSV, there was no difference be-
(−) sites, the premove dates had significantly higher abundance than tween hive honey bees and forager honey bees (P = 0.14; Fig. 6B;
postmove dates (T34.13 = 3.03; P < 0.01; Fig. 5C), but there was not Supp Table 9 [online only]). IAPV did not show any significant dif-
a significant difference at hive (+) sites. Halictidae taxon richness ferences between bee categories (Fig. 6C).
in 2018 did not vary significantly with hive presence, date, nor the We found strong evidence that IAPV titers were higher in female
interaction (Fig. 5D). B. griseocollis at hive (+) sites than hive (-) sites, and moderate evi-
dence that DWV quantities in B. griseocollis were higher at hive (+)
Viral Prevalence and Titers sites (P < 0.01, P = 0.07 respectively, Figure 7A and B; Supp Table 10
Prevalence [online only]). Male B. impatiens showed some evidence for higher
Consistent with previous research showing that wild bees can harbor DWV levels at hive (+) sites compared with hive (−) sites (P = 0.14,
honey bee viruses (Dolezal et al. 2016), we did detect all three viruses Fig. 7C, Supp Table 10 [online only]).
in bumble bees. Viral prevalence, or the number of bumble bees with
detectable viral levels above a previously established honey bee viral
presence threshold, was generally very low. No bumble bees had Discussion
IAPV over the prior threshold. DWV was detected over threshold This study presents data on the potential effects of honey bee hives
in 4% of B. impatiens male bumble bees in 2017, and 0% of female on wild bees in the context of a restored native prairie habitat in the
B. impatiens and B. griseocollis collected in 2018. However, LSV Midwestern United States. Many native plants found in prairies are
was found at higher prevalence, detected over threshold in 100% of highly attractive to both honey bees and wild bees (Tuell et al. 2008).
B. impatiens and 100% B. griseocollis females. Because we found Native prairies provide habitat for wild bees, including bumble bees,
mostly low titers in bumble bees, we next compared threshold-free and wild bee abundance responds positively to availability of floral
viral titers between honey bees and bumble bees, and then examined resources in prairie ecosystems (Hines and Hendrix 2005). In the
differences in titers between bumble bees at the two site types. state of Iowa, native prairie remnants have higher abundance and
diversity of floral resources than ruderal grasslands and are an im-
Viral Titers portant wild bee habitat (Kwaiser and Hendrix 2008). Since both
Both forager honey bees and hive-collected nurse honey bees had sig- wild bees and managed honey bees utilize prairie habitats, there is
nificantly higher DWV levels than B. griseocollis (P < 0.01; P < 0.01, potential for resource competition and the potential displacement of
respectively, Fig. 6A; Supp Table 9 [online only]) and B. impatiens wild bees, as well as the potential for transmission of viruses between
(P < 0.01; P < 0.01, respectively, Fig. 6A; Supp Table 9 [online only]) bee species.
in 2018. Nurse honey bees had higher DWV levels than foraging We used an experimental approach to examine this question, by
honey bees (P < 0.01; Fig. 6A; Supp Table 9 [online only]). For LSV, adding managed honey bee hives to multiple restored prairie sites
there were higher viral levels in hive honey bees than in both B. gri- in Iowa. We first verified that our experiment altered the amount
seocollis and B. impatiens (P = 0.01; P = 0.03 respectively; Fig. 6B; of honey bees present, noting more honey bees caught in pan trapsEnvironmental Entomology, 2021, Vol. XX, No. XX 9
from hive (+) sites compared to hive (−) sites, especially after hives relative abundance in pan traps more surprising. Several re-
were delivered to the prairies (i.e., posthive move, Fig. 2). This sug- searchers predict a possible inverse relationship between effect-
gests our treatment structure was effective in increasing honey bee iveness of pan traps and flower abundance (Roulston et al. 2007,
abundance and out of hive flight activity at sites where hives were Baum et al. 2011).
placed. However, we note that occasionally at hive (−) sites we col- 3) Additionally, it is also possible that, due to unintended random
lected honey bees in pan traps, particularly in the postmove period, variation in site quality, the sites with hives present had better
suggesting that honey bee foraging/flight activity in the environment floral resources than the sites without hives, leading to more
may increase during this part of the season. Indeed, honey bee hives abundant bees at those sites in 2017 collections. Variations in
experience a dearth of forage in central Iowa during this postmove floral resources across sites and years may also help to explain
period (Dolezal et al. 2019), and this has been previously associated why these trends were present in 2017 and absent in 2018.
with a spike in honey bees being captured in pan traps (St. Clair 4) One potential explanation for the lack of evidence of a competi-
Downloaded from https://academic.oup.com/ee/advance-article/doi/10.1093/ee/nvaa181/6119321 by guest on 25 January 2021
et al. 2020a). Several species of plants found in prairies bloom in tive effect in our study could be that resources were not limiting
the late summer and early fall, making this an attractive source of in the landscape. We did not measure nectar and pollen avail-
forage for honey bees (Zhang et al. in review). Alternatively, it is ability at our sites, and therefore cannot discuss if there were
possible that the honey bees captured at sites without hives may limiting resources in the environment. Additionally, we do not
have been foragers from our own hives kept at nearby sites for this have direct observations of any honey bees competing with wild
project, or from other unidentified managed or feral hives in the bees. Such data would be useful in future studies that address
surrounding landscape. Regardless, even though our hive (−) sites wild and managed bee competition.
showed some presence of honey bee foraging, our hive treatment 5) Last, the impact of honey bees on a wild bee community may not
clearly increased honey bee presence at hive (+) sites. be seen in the first 2 yr of study, and more years of sampling may
Beekeeping has been shown to reduce wild pollinator diversity be needed to see the effects. Further years would be especially
and alter plant-pollinator interactions in some pollination networks interesting, as we collected far fewer wild bees in 2018 com-
(Valido et al. 2019). For wild bee abundance and taxon richness, pared with 2017 and do not yet know if that will be an ongoing
we predicted that stress caused by competition and pathogens trend, or just an anomaly. Since bees obtain nutrition as larvae
from honey bees would correspond with overall lower abundance and overwinter as pupae, the provisions available in one summer,
and richness of wild bees. We further predicted this would be most when the female bees are foraging, determine the nutrition of
dramatic for closely related species in the family Apidae and less the next-generation of bees emerging. Increased competition and
so for more taxonomically distant species like those in the family pressure on wild bees could result in less provisioning for the
Halictidae. Contrary to our predictions, 2017 data revealed trends next generation, resulting in effects on their populations not seen
of more abundant and taxon-rich communities of wild bees in hive until future years.
(+) sites (Fig. 3A and B), as well as more abundant and taxon-rich
communities in the Apidae and Halictidae (Figs. 4 and 5A and B). Although our wild bee data did not provide evidence of a negative
However, we did not observe these trends in 2018 for the overall impact of honey bees on wild bee communities, it is still possible for
community nor family communities. We propose several possible ex- honey bees to transmit viral pathogens to wild bees without having
planations for these unexpected results. immediate negative effects on the community. To address the possi-
bility of viral transmission from managed honey bee hives to wild
1) Pan traps have limitations as a tool to understand the abundance bees, we used bumble bees as a focal genus to delve deeper into the
of native bee populations (Portman et al. 2020, St Clair et al. possible impact of honey bees on wild bees. Flowering plants in
2020b). These traps are effective at catching family Halictidae a prairie are a potential location for the transfer of parasites and
(Roulston et al. 2007, Grundel et al. 2011) but may be less ef- pathogens, including viruses. Viruses could be transferred through
fective at catching members of the Apidae, like bumble bees and shared floral resources when bumble bees and honey bees coexist
honey bees (Toler et al. 2005, Grundel et al. 2011), at least in in an ecosystem (Singh et al. 2010). Flowers have been highlighted
some regions, with the Midwest United States included (Gill as a potential medium for pollinator pathogen transfer by previous
and O’Neal 2015, Wheelock and O’Neal 2016, St. Clair et al. research (Durrer and Schmid-Hempel 1994, Graystock 2015).
2020b). Pan traps are estimated to capture only about half of Experimental studies have also demonstrated potential for bumble
all the species found in an area and are suggested to be paired bee and honey bee parasites to be transferred onto flowers by bee
with netting (Grundel et al. 2011) or reconsidered for their use in host species, then spread between flowers by other pollinator species
bee population studies (Portman et al. 2020). The relative abun- (Graystock et al. 2015).
dance of different species caught in pan traps is not a completely Virus transmission is shaped by many factors, not all of which
accurate picture of the bee community. Pan traps measure activi- were explored in this study. Plant-pollinator networks can shape
ty-density of bees in an area (St. Clair et al. 2020a and b), not the pathogen dynamics in a community: for example, landscape sim-
full range of abundance and taxon richness present. plification can reduce bee pathogen loads in a common bumble
2) Increased Apidae abundance in pan traps could signify a dearth bee species due to dietary shifts (Figueroa et al. 2020). Bee parasite
of resources in the surrounding habitat (St. Clair et al. 2020b). loads on flowers and in bees are also known to fluctuate across a
Pan traps are presumed to be attractive because of their appear- season depending on bee diversity and bee and flower abundance
ance as a potential floral resource. If the surrounding prairie (Graystock et al. 2020), presenting an interesting potential future
did not have adequate resources, or resources were utilized by direction for bee pathogen work. Our data corroborate the evi-
the abundant managed honey bees, foraging wild bees might dence that co-visitations of flowers in native habitat could help
be more likely to be attracted to pan traps, being unsuccessful vector viruses amongst bee species, but we do not have direct
in finding real flowers to forage upon. This may be especially transmission evidence from flowers. Research has demonstrated
pronounced for bumble bees, as they are large-bodied and some that BQCV and DWV are more prevalent in bumble bees caught
of the least likely bees to be caught in pan traps, making their in sites with honey bee hives present, compared to sites further10 Environmental Entomology, 2021, Vol. XX, No. XX
from hives (Alger et al. 2019). Our results show that, in some in- Dolezal et al. 2016). It is also uncertain if our study fully represented
stances, bumble bees at sites where hives were placed had higher the virus levels present in the bee community. There is the possibility
viral quantities than when no hives were present (Fig. 7). However, that the bumble bees most affected by honey bee viruses were not
viral levels in bumble bees were very low overall, and many were caught in our sampling because they were unable to fly and not seen
below the previously established limit of detection. The levels we by samplers. Future studies should aim to study bumble bees with
detected in these individuals may thus only represent exposure to confirmed, high level and symptomatic infections in order to better
honey bee viruses, not necessarily sickness or infection (overt virus understand the range and effects of the level of virus present. New
infection symptoms were not apparent in any collected bees; ZAP, technology will also be key in future studies; Galbraith et al. (2018),
personal observation). It is still unclear if and how the bumble bee for example, utilized metagenomics to screen honey bees and other
population would be impacted by these low viral levels. More re- bee species for many viruses simultaneously.
search in this area is needed to determine whether viral exposure Understanding how managed honey bees interact with wild bees,
Downloaded from https://academic.oup.com/ee/advance-article/doi/10.1093/ee/nvaa181/6119321 by guest on 25 January 2021
may be a concern for wild bee conservation when placing honey like bumble bees, is important to the study of pollinator health, as
bee hives in native habitat. there is concern that shared diseases could be contributing to native
This study did not sequence the qPCR products of the virus amp- bee declines. If keeping honey bees on prairies leads to higher disease
lified from wild and managed bees. Such sequencing data can reveal levels in wild bees, land managers interested in bee conservation
if the variants of viruses are shared among cohabitants. For example, might choose other locations for raising honey bee hives. The use of
evidence of viral communities being shared between managed and native flower plantings and habitat have been proposed as a strategy
wild bees was observed by tracking DWV variants in populations of to provide forage for both wild and managed pollinators (Vilsack
Bombus terrestris and managed honey bees (Fürst et al. 2014). As et al. 2016, Dolezal et al. 2019), but given shared flower usage, it is
the number of viruses tracked in wild bee populations continues to unclear whether doing so in areas in which pollinators are actively
increase, future work tracking variants in DWV and other pathogens managed will also increase pathogen pressure on native species. This
will be useful for determining virus community sharing and direc- study provides an important early step in understanding managed
tional pathogen transfer. and wild bee pathogen interactions in native prairie habitat; how-
Honey bee viruses are often associated with mites, but research ever, additional studies are still needed for a broader understanding
indicates that oral transmission is also possible. For example, of pollinator health in the Great Plains in order to best inform land
bumble bees have been observed with the characteristic crumpled management decisions that can impact bee health and conservation.
wings which are indicative of a DWV infection but showed no pres-
ence of the V. destructor mites, suggesting possible oral transmission
of DWV (Genersch et al. 2006). This also suggests that DWV infec- Supplementary Data
tion causes crumpled wings in bumble bees as well as honey bees. Supplementary data are available at Environmental
In our study, none of our collected bumble bees were observed to Entomology online.
have crumpled wings, even though 100% of the 2017 bumble bees
collected and 41.02% of those in 2018 had levels greater than zero
of the virus present. It is possible that bees with crumpled wings are Acknowledgments
less likely to be caught by researchers because they may be too mal- This work was supported by USDA NIFA 2017-68004-26326 (to ALT, AGD,
formed to fly from the nest and would therefore create a bias in col- MEO) and the Iowa State University Honors Program Grant (to ZAP). We
lecting more healthy bees. The fact that we observed very low-level would like to thank Cindy Hildebrand, and Doug Sheeley, Natural Resources
viral quantities, and a lack of obvious symptoms such as crumpled Supervisor at Chichaqua Bottoms Greenbelt, for access to sites. Maria Cline
wings, could indicate that bees came into contact with the virus as helped with collection of bumble bees. Amy Geffre assisted in the qPCR pro-
adults (as deformed wings stem from infection during development), cess. Fernando Miguez provided statistical guidance, and Jing Zhang and
which would align with the hive placement late in the season. It Greta Linse provided statistical guidance and code for viral analysis in RStudio.
Statistical methods and analysis on viral data reported in this publication
would be valuable to track viral infections and symptoms over a
were suggested and reviewed by Statistical Consulting and Research Services
longer time scale; even though viruses were detected at low levels in
at Montana State University that is supported by Institutional Development
our samples, legacy effects are certainly possible in future seasons
Awards (IDeA) from the National Institute of General Medical Sciences of the
or generations. However, we lack information on how virus levels National Institutes of Health under Awards P20GM103474, U54GM115371,
relate to symptoms and health in bumble bees, and this area deserves and 5P20GM104417. The content is solely the responsibility of the authors
further study (but see Wang et al. 2018). and does not necessarily represent the official views of the National Institutes
While this study adds to our understanding of the interaction of Health.
between wild bees and honey bees, it also raises many new questions
that deserve future research. Our data suggest that bumble bee ex-
posure to honey bee viruses is likely to be higher for some viruses
(like DWV) in sites with honey bee hives present. However, this was References Cited
not true for all viruses and many questions remain. Why are there dif- Aizen, M. A., M. P. Arbetman, N. P. Chacoff, V. R. Chalcoff, P. Feinsinger,
ferent patterns of exposure for different viruses? What is the nature L. A. Garibaldi, L. D. Harder, C. L. Morales, A. Sáez, and A. J. Vanbergen.
of interactions between wild and managed bees, and when and how 2020. Chapter Two- Invasive bees and their impact on agriculture, pp. 49–
92. In D. A. Bohan and A. J. Vanbergen (eds.), The Future of Agricultural
are viruses spread in the bee community? If male bumble bees are
Landscapes, Part I. Advances in Ecological Research. Elsevier, London.
infected, like the male B. impatiens sampled in 2017, could they
Alger, S. A., P. A. Burnham, H. F. Boncristiani, and A. K. Brody. 2019. RNA
transmit viruses to the queen during mating? Could queens transfer
virus spillover from managed honeybees (Apis mellifera) to wild bumble-
viruses to the next year’s brood, and how might that impact the bees (Bombus spp.). PLoS One. 14: e0217822.
colony health? These differences between viral prevalence have been Ascher, J. S., and J. Pickering. 2017. Discover Life bee species guide and world
observed in past studies and could signal different susceptibilities checklist (Hymenoptera: Apoidea: Anthophila). www.discoverlife.org
for some wild bee species (Singh et al. 2010, McMahon et al. 2015, (Accessed 1 Sept. 2018).You can also read