ADAR-deficiency perturbs the global splicing landscape in mouse tissues
←
→
Page content transcription
If your browser does not render page correctly, please read the page content below
Downloaded from genome.cshlp.org on November 12, 2020 - Published by Cold Spring Harbor Laboratory Press

Research

ADAR-deficiency perturbs the global splicing
landscape in mouse tissues
Utkarsh Kapoor,1,4 Konstantin Licht,1,4 Fabian Amman,1,2 Tobias Jakobi,3
David Martin,1 Christoph Dieterich,3 and Michael F. Jantsch1
1
 Center of Anatomy and Cell Biology, Department of Cell and Developmental Biology, Medical University of Vienna, A-1090 Vienna,
Austria; 2Institute of Theoretical Biochemistry, University of Vienna, A-1090 Vienna, Austria; 3Department of Internal Medicine III
and Klaus Tschira Institute for Computational Cardiology, Section of Bioinformatics and Systems Cardiology, University Hospital,
D-96120 Heidelberg, Germany

        Adenosine-to-inosine RNA editing and pre-mRNA splicing largely occur cotranscriptionally and influence each other.
        Here, we use mice deficient in either one of the two editing enzymes ADAR (ADAR1) or ADARB1 (ADAR2) to determine
        the transcriptome-wide impact of RNA editing on splicing across different tissues. We find that ADAR has a 100× higher
        impact on splicing than ADARB1, although both enzymes target a similar number of substrates with a large common over-
        lap. Consistently, differentially spliced regions frequently harbor ADAR editing sites. Moreover, catalytically dead ADAR
        also impacts splicing, demonstrating that RNA binding of ADAR affects splicing. In contrast, ADARB1 editing sites are
        found enriched 5′ of differentially spliced regions. Several of these ADARB1-mediated editing events change splice consensus
        sequences, therefore strongly influencing splicing of some mRNAs. A significant overlap between differentially edited and
        differentially spliced sites suggests evolutionary selection toward splicing being regulated by editing in a tissue-specific
        manner.
        [Supplemental material is available for this article.]

RNA modifications affect composition, stability, structure, and                           Splicing efficiency can control editing levels. Both mini-gene
function of messenger RNAs (Licht and Jantsch 2016). In metazo-                     reporter assays as well as analyses of endogenous targets demon-
ans, adenosine-to-inosine (A-to-I) RNA editing is the most abun-                    strated that exon-intron-dependent editing sites are strongly af-
dant type of RNA editing and is mediated by the adenosine                           fected by the efficiency of splicing (Licht et al. 2016).
deaminase acting on RNA (ADAR) family of enzymes (Nishikura                         Conversely, A-to-I RNA editing may affect splicing by creating or
2016; Eisenberg and Levanon 2018). During A-to-I editing, an ino-                   disrupting splice sites or branch points (Rueter et al. 1999).
sine is generated by hydrolytic deamination of adenosines.                          Similarly, ADARs may alter binding sites for splicing factors and
Inosines are primarily read as guanosines by cellular machines                      compete with splicing factors for binding and/or access to the
and occasionally as adenosines or uracils (Basilio et al. 1962;                     same RNA. Several studies have shown an impact of RNA editing
Licht et al. 2019a). In mammals, two types of active ADARs,                         on splicing for selected substrates. For instance, inhibition of edit-
ADAR (ADAR1) and ADARB1 (ADAR2), are found that modify dif-                         ing of the glutamate receptor subunit Gria2 impairs splicing of in-
ferent but partially overlapping substrate sites (Eggington et al.                  tron 11 and affects alternative splicing at intron 13/14 (Higuchi
2011).                                                                              et al. 2000; Schoft et al. 2007; Penn et al. 2013). Similarly, global
     ADARs bind double-stranded RNA (dsRNA) which can be                            studies performed in human tissue culture cells, flies, and mouse
formed between different regions of an RNA. In mRNAs, this can                      brains lacking ADARB1 have provided insights into the impact
involve exon-intron, exon-exon, or intron-intron base-pairing.                      of editing on splicing (Solomon et al. 2013; St Laurent et al.
We recently showed that, in the mouse, most editing-competent                       2013; Mazloomian and Meyer 2015; Dillman et al. 2016; Hsiao
structures are formed within introns (intron-intron base-pairing),                  et al. 2018). However, a transcriptome-wide splicing analysis com-
followed by structures formed within UTRs (Licht et al. 2019b).                     paring different tissues within a mouse genetic deletion model of
The definition of some editing sites by base-pairing between exon-                  Adar remains elusive.
ic and intronic sequences has led to the notion that A-to-I editing                       In mice, both ADARs are essential but can be rescued to differ-
must occur cotranscriptionally, or before intron removal                            ent extents. Adar-null mice are embryonic lethal and die at stage
(O’Connell 1997). Splicing itself occurs mostly cotranscriptionally                 E11.5 and show defects in erythropoiesis, elevated interferon sig-
(Merkhofer et al. 2014). Consistently, both pre-mRNA splicing and                   naling, and widespread apoptosis (Hartner et al. 2004, 2009;
RNA editing are coordinated (Bratt and Ohman 2003). Moreover,                       Wang et al. 2004; Liddicoat et al. 2015). It has been shown that
both processes contribute to proteomic diversity (Wang and                          a deletion in Adar can be rescued by a concomitant deletion of
Burge 2008).                                                                        the gene encoding the cytoplasmic RNA sensor IFIH1 (also known
                                                                                    as MDA5) or the gene encoding its downstream signaling mediator
                                                                                    MAVS. The extent to which Adar deficiency can be rescued de-
                                                                                    pends strongly on the Adar allele used and ranges from complete
4
  These authors contributed equally to this work.
Corresponding author: Michael.Jantsch@meduniwien.ac.at
Article published online before print. Article, supplemental material, and publi-   © 2020 Kapoor et al. This article, published in Genome Research, is available
cation date are at http://www.genome.org/cgi/doi/10.1101/gr.256933.119.             under a Creative Commons License (Attribution 4.0 International), as described
Freely available online through the Genome Research Open Access option.             at http://creativecommons.org/licenses/by/4.0/.

30:1–12 Published by Cold Spring Harbor Laboratory Press; ISSN 1088-9051/20; www.genome.org                                      Genome Research               1
                                                                                                                                    www.genome.org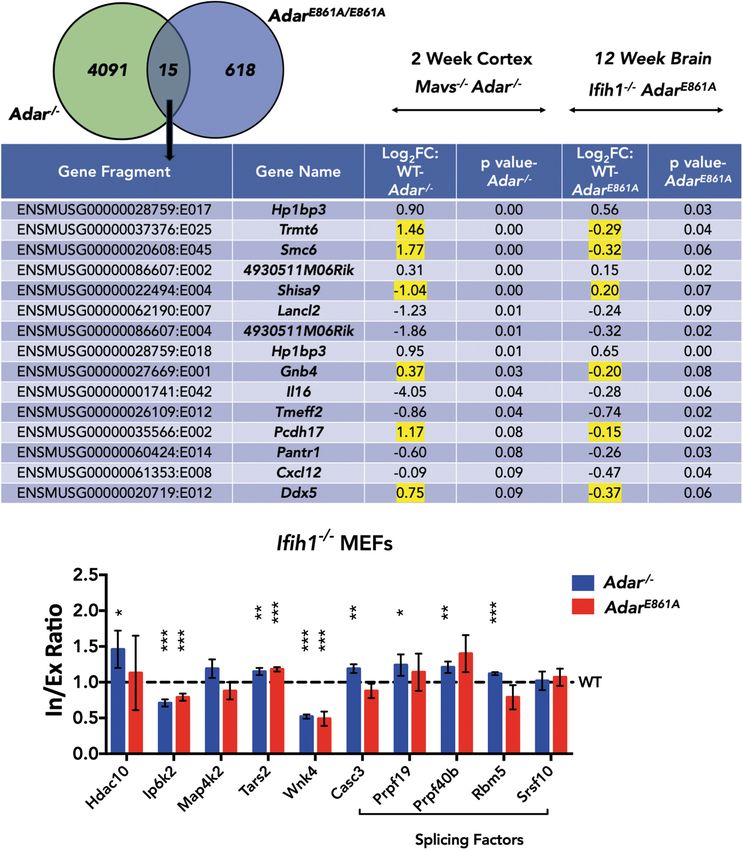
Downloaded from genome.cshlp.org on November 12, 2020 - Published by Cold Spring Harbor Laboratory Press

Kapoor et al.

viability, over reduced growth, to postnatal death (Mannion et al.       splicing patterns (Supplemental Fig. S3; Vaquero-Garcia et al.
2014; Liddicoat et al. 2015; Pestal et al. 2015; Bajad et al. 2020).     2016). We obtained 269 LSV events in 141 genes from RNA-seq
Similarly, Adarb1-null mice die within a few weeks after birth ac-       data analysis of Adar KO cortex and 52 LSVs in 35 genes in
companied by seizures and epilepsy. Adarb1 deficiency can be res-        Adarb1 KO cortex (Fig. 1B; Supplemental Dataset 2). MAJIQ gener-
cued by a pre-edited version of the AMPA glutamate receptor              ates a probability score P which estimates whether the difference of
subunit 2 (Gria2) (Higuchi et al. 2000). These mice have been ex-        splice junction usage (delta Ψ) between experimental conditions is
tensively studied and appear phenotypically normal under stan-           greater than or equal to 20% (P [delta Ψ] ≥ 0.2]. Higher probability
dard laboratory conditions (Higuchi et al. 2000). The Adar               suggests high confidence in the predicted differential splicing
deletion mice rescued by a concomitant Mavs deletion exhibit a           event. For RT-PCR and qRT-PCR validations, LSVs that had a prob-
minute phenotype (Bajad et al. 2020).                                    ability score ≥ 0.6 were picked (Fig. 1D,E). Out of 24 tested targets
     In this study, for the first time, we use Adar-deficient, rescued   with probability values ranging between 0.62 and 0.99, 19 were
mice to characterize the ADAR-mediated impact on the transcrip-          positively validated to have a significant change in inclusion to ex-
tome-wide splicing landscape in different mouse tissues and com-         clusion ratio in at least two replicates indicating a false discovery
pare their splicing landscape with that of Adarb1-deficient rescued      rate of ∼20%.
mice (Higuchi et al. 2000).                                                    Several substrates previously shown to be differentially
                                                                         spliced upon loss of editing (e.g., Gria2, Htr2c) were not identified
                                                                         in the MAJIQ analysis (Flomen et al. 2004; Licht et al. 2016).
Results                                                                  MAJIQ computes relative inclusion of isoforms but does not quan-
                                                                         tify expression levels of isoforms. Thus, we decided to complement
RNA-seq and global splicing analysis                                     our analysis using DEXSeq (Anders et al. 2012) which evaluates dif-
To determine the impact of ADAR on splicing, we interbred                ferential exon usage between samples from RNA-seq data. We ad-
Mavs −/− mice with Adar +/− (Adar Δ7-9) mice to generate Adar+/− ;       justed the DEXSeq analysis in order to allow quantification of
Mavs−/− mice (Bajad et al. 2020). Offspring of these mice with ge-       differential intron usage, thereby allowing analysis of intron reten-
notype Adar+/+ ; Mavs−/− (Adar WT) and Adar−/− ; Mavs−/− (Adar           tion events. We found 4113 events in 3010 genes in Adar KO and
KO) were collected at P14. In the Adar−/− mice used here, a truncat-     only 15 events in nine genes in Adarb1 KO that were significantly
ed, editing-deficient ADAR protein is expressed (Bajad et al. 2020).     different (adjusted P-value ≤ 0.1) (Fig. 1C; Supplemental Dataset
To assess the impact of ADARB1 on splicing, we crossed heterozy-         3). Not only did DEXSeq predict a much higher number of differ-
gous Adarb1 +/− ; Gria2 R/R mice and collected Adarb1 +/+ ; Gria2 R/R    ential exon/intron usage events in Adar KO cortex, but also
(Adarb1 WT) and Adarb1 −/− ; Gria2 R/R (Adarb1 KO) pups at P14.          transcripts with splicing events known to be affected by editing
      Since A-to-I RNA editing events are enriched in tissues of neu-    were detected. The overlap between events identified using
ronal origin, we sequenced poly(A)-selected RNA of cortices isolat-      MAJIQ and DEXSeq was only moderate (51 targets in the Adar
ed from Adar WT, Adar KO, Adarb1 WT, and Adarb1 KO mice in               KO cortex), suggesting that both algorithms complement each
biological triplicates in 125-bp paired-end mode on an Illumina          other (Supplemental Fig. S4). For qRT-PCR validations of differen-
HiSeq 2500 (Supplemental Fig. S1A,B). Editing sites were detected        tial exon/intron usage events predicted by DEXSeq, targets with an
in these RNA-seq data sets using a machine learning algorithm            adjusted P-value ≤ 0.1 were chosen. Out of 29 tested targets with
RDDpred (Kim et al. 2016). Editing levels for each site were calculat-   adjusted P-values ranging between 0.0 and 0.09, 22 were positively
ed by dividing the number of edited reads by the total number of         validated to have a significant change in inclusion to exclusion ra-
reads spanning the editing site. Following removal of known              tio in at least two out of three replicates indicating a false discovery
SNPs and stringent filtering, we compiled a list of differentially ed-   rate of ∼25% (Supplemental Figs. S5, S6). Among those, the tran-
ited sites where we observed a significant change (Welch’s t-test; P ≤   script encoding Dicer was differentially spliced in Adar KO cortex
0.1) in RNA editing levels between WT and KO cortex samples. We          (Supplemental Fig. S5A). Also, Adat2 had a significant differential
detected 9382 editing sites in Adar WT, out of which 1459 were           exon usage event in two out of three replicates in the Adar KO cor-
found to be differentially edited in the Adar KO cortex. Similarly,      tex. Further, Adarb1 transcripts displayed a significant differential
we detected 8161 editing sites in Adarb1 WT, out of which 1413           intron usage in three out of three replicates in the Adar KO cortex,
were found to be differentially edited in the Adarb1 KO cortex. As       likely leading to reduced ADARB1 protein expression, as the re-
expected, most differentially edited sites showed reduced editing        tained intron would reduce mRNA expression (Braunschweig
upon Adar or Adarb1 deletion. In contrast, editing levels were in-       et al. 2014; Wong et al. 2016). In line with this, we observed re-
creased for a small number of editing sites upon depletion of one        duced editing levels for several ADARB1-dependent editing sites
of the two ADARs (Fig. 1A). In the Adar −/− cortex, 117 sites showed     in the Adar knockout cortex (Supplemental Fig. S7).
an increase in editing between 1% and 83%. Similarly, in Adarb1 −/−            To identify editing sites that are associated with predicted
cortex, 107 sites showed an increase in editing between 1% and           splicing changes, we looked for enrichment of differential
54% (Supplemental Fig. S2A,B; Supplemental Dataset 1). This ob-          Adar or Adarb1 editing sites overlapping with or within a window
servation suggests competition between ADAR and ADARB1 for ac-           (±5 kb) of the significantly differentially spliced regions detected in
cess to the same editing site that hints toward a regulatory             either Adar or Adarb1 KO cortex. In the MAJIQ data set, only one
mechanism to keep editing levels in check.                               differential editing site overlapping a MAJIQ event was detected
      Next, we profiled global splicing changes using the Modeling       in 9930104L06Rik in the Adar KO cortex, whereas no editing sites
Alternative Junction Inclusion Quantification (MAJIQ) tool               were detected that overlapped a MAJIQ event in Adarb1 KO cortex
(Vaquero-Garcia et al. 2016). MAJIQ defines differential splicing        (Fig. 1F “overlap”). Out of a total of 14 differential editing sites that
events as local splicing variations (LSVs). An LSV encompasses typ-      were found within ±5 kb of differentially spliced MAJIQ coordi-
ical forms of alternative splicing like exon skipping, mutually ex-      nates in the Adar KO cortex data set, two editing sites were found
clusive exons, intron retention, and alternative 5′ or 3′ splice         upstream, one overlapped, and 11 were downstream from the
sites but also includes nonstandard events resulting in complex          event. On the contrary, four differential editing sites were detected

2    Genome Research
       www.genome.org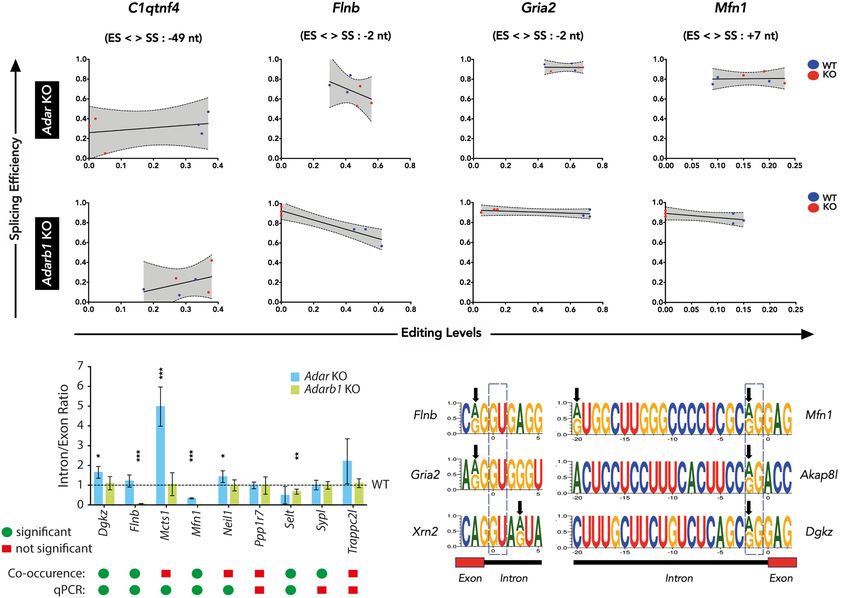
Downloaded from genome.cshlp.org on November 12, 2020 - Published by Cold Spring Harbor Laboratory Press

                                                                                              A-to-I RNA editing impacts pre-mRNA splicing

              A                    B                                      C                             D

              E

              F                                                                 G

Figure 1. ADAR or ADARB1 deficiency causes transcriptome-wide changes in splicing patterns. (A) Pie charts depicting differential editing analysis in Adar-
or Adarb1-deficient cortex. Editing levels remain steady (black), increase (red), or decrease (blue). (B) Histogram showing local splicing variations (LSVs)
identified by MAJIQ tool in ADAR (Adar-) or Adarb1-deficient cortex binned by MAJIQ probability score. (C) Histogram showing differential exon/intron
usage events identified by DEXSeq in Adar- or Adarb1-deficient cortex binned by DEXSeq adjusted P-value. (D) RT-PCR validation of LSVs predicted by
MAJIQ in Adar-deficient cortex resolved by agarose gel electrophoresis. (E) qPCR validation of LSVs predicted by MAJIQ in Adar-deficient cortex. Data shown
are the mean inclusion to exclusion ratio in Adar KO (±SD). (F) Histogram showing ADAR and ADARB1 differential editing sites found in the indicated dis-
tances of ADAR- and ADARB1-dependent LSV events identified by MAJIQ in the cortex; editing sites are binned (±5 kb) by significant chromosomal coor-
dinates. Editing sites that lie exactly on/within the differentially spliced regions have been highlighted and binned as “Overlap.” Only those editing sites that
were found in the ±5-kb window have been plotted. (G) Histogram showing ADAR and ADARB1 differential editing sites identified in the indicated distances
of ADAR- and ADARB1-dependent differential exon/intron usage identified in the cortex; editing sites are binned (±5 kb) by significant chromosomal co-
ordinates. Editing sites that lie exactly on/within the differentially spliced regions have been highlighted and binned as “Overlap.” Only those editing sites
that were found in the ±5-kb window have been plotted.

only downstream from differentially spliced MAJIQ coordinates in                    spliced DEXSeq coordinates, whereas none overlapped (Fig. 1G).
the Adarb1 KO cortex data set (Fig. 1F). A similar analysis was per-                These include editing sites in Flna and Flnb.
formed using the Adar/Adarb1 KO DEXSeq data sets (Fig. 1G). Out                           In the Adar KO cortex, we found 23 genes that harbored 37
of a total of 207 differential editing sites that were found within ±5              differential editing sites within the coordinates of a differential
kb of differentially spliced DEXSeq coordinates in the Adar KO cor-                 exon/intron usage event (Fig. 1G, “overlap”; Supplemental Table
tex data set, 72 editing sites were found upstream, 37 overlapped,                  S1). These genes include Alkbh2, Mcat, or Pin1 harboring intronic
and 98 were found downstream from the event. On the contrary,                       editing sites and Mrps17 which contains five differentially edited
in the Adarb1 KO cortex data set, 10 differential editing sites were                sites in the 3′ UTR. From this list, at random we picked four genes:
detected either upstream of or downstream from the differentially                   Dusp11, Eloc, Pin1, all harboring intronic editing sites, and Ezh1,

                                                                                                                                 Genome Research               3
                                                                                                                                    www.genome.org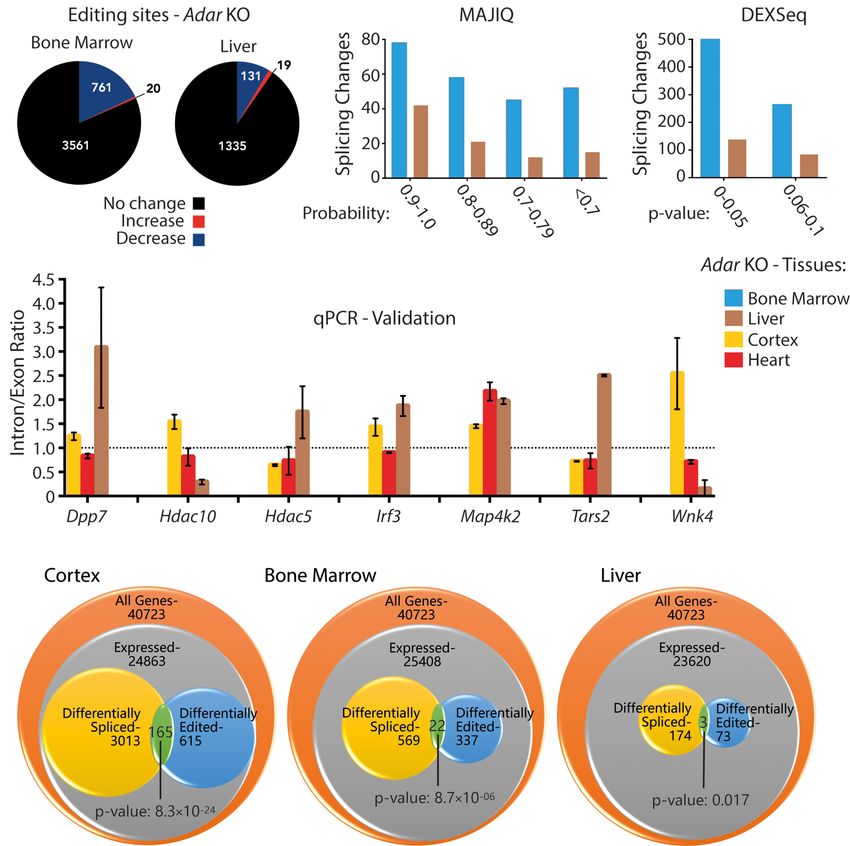
Downloaded from genome.cshlp.org on November 12, 2020 - Published by Cold Spring Harbor Laboratory Press

Kapoor et al.

having a differentially edited site in the 3′ UTR and validated them      list of differentially edited sites where we observed a significant
by qPCR. In three candidates, Dusp11, Ezh1, and Pin1, we observed         change (Welch’s t-test; P ≤ 0.1) in RNA editing levels between
the predicted trend in at least two out of three replicates in Adar KO    WT and KO samples. We found 805 (out of 4366) and 150 (out
cortex (Supplemental Fig. S5B). PIN1 [protein (peptidyl-prolyl cis/       of 1485) editing sites to be differentially edited (P ≤ 0.1) in Adar
trans isomerase) NIMA-interacting 1] is known to regulate Gria2 Q/        KO bone marrow and liver, respectively (Fig. 2A; Supplemental
R site RNA editing by binding to ADARB1 in a phosphorylation-de-          Fig. S2C,D; Supplemental Dataset 1). This is consistent with the
pendent manner (Marcucci et al. 2011). In the Adar KO cortex,             notion that A-to-I editing generally reaches the highest complexity
we found Pin1 to be differentially edited in intron 1, where              in brain tissues (Heraud-Farlow et al. 2017; Tan et al. 2017) but is
we observed editing levels at this site to drop from 11% to 0%.           also in good agreement with the different read coverage in those
We validated the same intron 1 to have a higher intron retention          tissues: ∼170 million in bone marrow, ∼131 million in liver,
ratio in Adar KO cortex, leading to a premature termination codon         ∼465 million in cortex.
and thus likely reducing PIN1 levels (Braunschweig et al.                       Next, the global splicing landscape was profiled in bone mar-
2014; Wong et al. 2016). This suggests that ADAR could also regu-         row and liver data sets using both MAJIQ and DEXSeq. MAJIQ
late ADARB1-dependent RNA editing via splicing of Pin1.                   identified 233 local splicing variations in 94 genes in Adar KO
Consistently, we observed a 50% drop in editing levels for several        bone marrow and 90 LSVs in 49 genes in Adar KO liver (Fig. 2B).
ADARB1-dependent editing sites upon Adar deletion, supporting             Similarly, DEXSeq identified 764 differential exon/intron usage
the idea that ADAR may lead to reduced ADARB1 activity by reduc-          events in 569 genes in Adar KO bone marrow and 222 events in
ing Pin1 expression (Supplemental Fig. S7; see above).                    174 genes in Adar KO liver (Fig. 2C). As mentioned, the lower num-
      We also validated differential intron 15 usage in Ezh1, a com-      ber of events detected in these tissues is likely due to less depth in
ponent of the Polycomb Repressive Complex 2 (PRC2) (Margueron             RNA-seq data (number of reads) but could also be attributed to the
and Reinberg 2011). This region has four differential editing sites       lesser splicing activity compared to tissues of neuronal origin (Raj
showing the highest change in editing levels from 46% to 0% in            and Blencowe 2015).
the Adar KO cortex. Additionally, Dusp11, which encodes an                      Next, the output of significantly altered splicing events from
RNA-binding protein, was validated to have differential intron 3          Adar KO cortex, Adar KO bone marrow, and Adar KO liver was in-
usage with an editing site showing a concomitant decrease in              tersected. Seven genes were commonly called differentially spliced
editing levels from 25% to 0% in Adar KO cortex (Supplemental             in all tissues. However, neither MAJIQ nor DEXSeq (Supplemental
Fig. S5B). Out of 23 genes that had differential editing sites overlap-   Fig. S9A) identified the same splicing event within those genes to
ping a DEXSeq event, two genes, Pnpla6 and Rbbp4, harbored                be similarly affected across all tissues. Although MAJIQ did not
intronic sites that showed an increase in editing levels from 1%          find any LSVs that were common across all tissues, we tested if
to 25% and 7% to 26%, respectively, in the Adar KO cortex                 the MAJIQ-predicted targets in the Adar KO cortex could have a tis-
(Supplemental Table S1).                                                  sue-specific outcome. For this, we chose LSVs that were already ver-
      To obtain insights into genes that were detected to be differ-      ified in the Adar KO cortex and validated them in other Adar KO
entially spliced in the MAJIQ and DEXSeq data sets, the Enrichr           tissues such as heart and liver by qPCR. Indeed, we found seven
tool (Kuleshov et al. 2016) was used to determine enrichment of           out of seven tested targets to behave in a tissue-specific manner
Gene Ontology (GO) terms in the DEXSeq and MAJIQ data sets.               (Fig. 2D). For instance, dipeptidylpeptidase 7 (Dpp7) and interfer-
In both, we found significant hits on ontology terms linked with          on regulatory factor 3 (Irf3) showed similar trends leading to high-
splicing, such as regulation of splicing via spliceosome, RNA pro-        er inclusion in Adar KO cortex and liver but less inclusion in Adar
cessing, and gene expression (Supplemental Tables S2, S3). This           KO heart. Histone deacetylase 5 (Hdac5) showed significantly al-
suggests that ADARs can have a broad impact on pre-mRNA splic-            tered splicing only in the Adar mutant cortex, whereas Hdac10
ing by regulating splicing factors that are involved or associated        showed significantly altered patterns in both mutant cortex and
with splicing.                                                            liver, albeit with opposite trends. Similarly, Tars2 and Wnk4
                                                                          showed different, yet significant trends in all three tested tissues
                                                                          Only Map4k2 showed significant and the same trends of higher in-
The impact of ADAR on splicing is tissue-specific                         clusion across all tissues (Fig. 2D).
Since ADAR seemingly has a larger impact on splicing than                       From the intersection of DEXSeq outputs, six events were
ADARB1 in the cortex, we asked if ADAR had any tissue-specific ef-        found to be common between cortex and liver, nine between liver
fect on splicing. To answer this, we used RNA-seq data from Adar          and bone marrow, and 18 between bone marrow and cortex
WT and Adar KO bone marrow and liver and profiled the global ed-          (Supplemental Fig. S9A; Supplemental Table S4). However, the rel-
iting as well as splicing landscape in these tissues (Bajad et al.        ative trend toward inclusion or exclusion differed strongly.
2020). These RNA-seq libraries were prepared from ribo-minus              Although eight out of nine events shared between bone marrow
RNA samples and sequenced in 125-bp paired-end mode using                 and liver showed the same trend for specific regions, this was true
the Illumina HiSeq 2500 (Supplemental Fig. S1A,B).                        for only three out of six DEXSeq regions when comparing cortex
     In order to look for editing sites that are differentially edited    and liver and 12 out of 18 regions for bone marrow versus cortex
across Adar-deficient tissues, we first performed editing site detec-     (Supplemental Table S4). From those significant events, we took
tion in Adar WT and Adar KO bone marrow and liver RNA-seq data            four candidates at random and successfully validated them by
sets using RDDpred (Kim et al. 2016). In all three tissues (cortex,       qPCR. Candidates were validated in all three tissues even if they
bone marrow, liver) only 5%–10% of editing sites were annotated           were only found common between any two tissues. DEXSeq gener-
as exonic whereas the majority of editing sites located to intronic       ates adjusted P-values and the fragment IDs of these candidates are
regions (Supplemental Fig. S8). The different modes of library            listed (Supplemental Fig. S9B). From qPCR analysis (Supplemental
preparation (cortex: poly(A)-selected vs. liver and bone marrow:          Fig. S9C), we find that mitochondrial ATP synthase (Atp5b)
ribo-minus) possibly reflect the higher ratio of intronic versus ex-      (Fragment: E010) and epidermal growth factor receptor (Egfr)
onic editing sites in bone marrow and liver. Next, we compiled a          (Fragment: E046) show similar trends leading to higher inclusion

4    Genome Research
       www.genome.org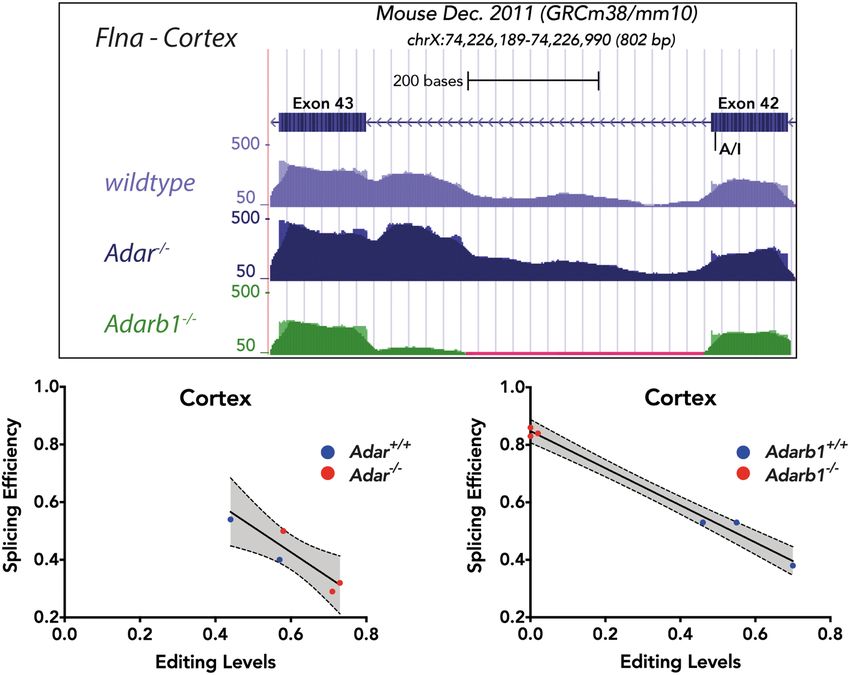
Downloaded from genome.cshlp.org on November 12, 2020 - Published by Cold Spring Harbor Laboratory Press

                                                                                             A-to-I RNA editing impacts pre-mRNA splicing

   A                                   B                                   C                                   Dataset 4). Overall, this led us to conclude
                                                                                                               that ADAR has a different impact on splic-
                                                                                                               ing in different tissues, with no particular
                                                                                                               trend toward inclusion or exclusion.
                                                                                                                     Given that we found a number of
                                                                                                               genes that responded to loss of Adar by
                                                                                                               showing changes in editing or splicing
                                                                                                               levels, we asked if this number of altered
                                                                                                               splicing events hinted toward a regulato-
    D                                                                                                          ry impact of editing on splicing. If this
                                                                                                               was the case, one would expect the over-
                                                                                                               lap between editing events and alterna-
                                                                                                               tive splicing events to be significantly
                                                                                                               larger than a stochastic model would pre-
                                                                                                               dict. We therefore used GeneOverlap, a
                                                                                                               Bioconductor R package that uses the
                                                                                                               principle of Fisher’s exact test to evaluate
                                                                                                               the statistical significance of overlap
                                                                                                               between any two gene lists normalized
   E                                                                                                           to the genomic/transcriptomic back-
                                                                                                               ground. Since DEXSeq was able to predict
                                                                                                               a higher number of differential exon/in-
                                                                                                               tron usage events in all tested Adar-defi-
                                                                                                               cient tissues, we used only DEXSeq
                                                                                                               genes for this analysis. When testing for
                                                                                                               an enriched overlap between the list of
                                                                                                               genes that have a significant differential
                                                                                                               editing site and the list of genes that
                                                                                                               have a significant DEXSeq event, we ob-
                                                                                                               served a significant enrichment in all
Figure 2. ADAR-dependent splicing changes are tissue-specific. (A) Pie charts depicting the differential       tested Adar-deficient DEXSeq data sets.
editing analysis in Adar-deficient bone marrow and liver. Editing levels remain steady (black), increase       The effect was most pronounced in the
(red), or decrease (blue). (B) Histogram showing local splicing variations identified by MAJIQ in Adar-de-     cortex where altered editing and splice
ficient bone marrow (blue) and liver (brown) binned by the MAJIQ probability score. (C) Histogram              pattern co-occurred in 165 genes (P-value
showing differential exon/intron usage events identified by DEXSeq in Adar-deficient bone marrow
(blue) and liver (brown) binned by the DEXSeq adjusted P-value. (D) Histogram showing inclusion/exclu-         8.3 × 10⁻²⁴), followed by bone marrow
sion ratios (liver: brown, cortex: yellow, heart: red) validated by qPCR of MAJIQ events (n = 2 or 3). Data    with 22 overlapping genes (P-value
shown are the mean inclusion to exclusion ratio in Adar KO (±SD). (E) GeneOverlap analysis of the number       8.7 × 10⁻¹⁰), and liver with three overlap-
of genes expressed per tissue, those that show differential editing, and those that show differential splic-   ping genes (P-value 0.017). This shows
ing. The overlap between the latter two categories is higher than stochastically expected, suggesting that
editing and splicing are mechanistically linked.                                                               that editing and splicing are significantly
                                                                                                               linked across tissues (Fig. 2E).

in the Adar KO in cortex and liver, while showing no change in the                A-to-I RNA editing in the immediate vicinity (
Downloaded from genome.cshlp.org on November 12, 2020 - Published by Cold Spring Harbor Laboratory Press
Kapoor et al.
levels by linear regression shows that A-to-I RNA editing influences co-occurrence using Fisher’s exact test (see Methods). To estimate
splicing efficiency irrespective of the position of the editing site the reliability of these results, we randomly chose nine editing site-
with respect to the exon/intron boundary (Fig. 3A–D). This splice site combinations and validated them by qPCR. We found
observation is limited to the editing sites in the chosen distance that six out of nine targets were in agreement with the prediction
(±50 nt). from co-occurrence analysis showing a significant change in inclu-
For instance, C1qtnf4 is an ADAR target, as editing levels in sion to exclusion ratio in either Adar or Adarb1 knockout cortex
Adar KO are consistently reduced whereas editing levels in the (Fig. 3E). The two targets Mcts1 and Neil1 predicted to have insig-
Adarb1 KO vary (Fig. 3A). Accordingly, splicing levels were consis- nificant co-occurrence were found to be significant by qPCR (Fig.
tent in at least two out of three Adar KO cortex samples but not in 3E). Overall, this led us to conclude that a co-occurrence analysis
the Adarb1 KO cortex. Furthermore, Flnb, Gria2, and Mfn1 are is a reliable strategy to identify splicing events that are affected
ADARB1 targets exhibiting consistent loss in editing levels with by A-to-I RNA editing events near the exon-intron boundary.
a concomitant increase in splicing efficiency in Adarb1 KO while Next, we examined if editing could have an impact on the
displaying no particular trend in Adar KO (Fig. 3B–D), indicating strength of the splice sites. For this analysis, we used the
that editing in these targets reduces splicing efficiency. The consis- MaxEntScan program that uses a maximum entropy principle to
tency of editing-splicing levels can be appreciated by the clear sep- model sequence motifs near exon-intron boundaries (Yeo and
aration and clustering of WT and KO data points in the respective Burge 2004). Specifically, it models nine bases at the 5′ splice site
genotypes. The editing site in Mfn1 is located at the 5′ end of the (−3 nt in exon and +6 nt in intron) and 23 bases at the 3′ splice
intron, which may affect U1 base-pairing (Fig. 3F; Supplemental site (−20 nt in intron and +3 nt in exon). Here, all currently known
Fig. S10). In contrast, the editing site in C1qtnf4 is located within editing sites in the mouse from RADAR (Ramaswami and Li 2014)
the intron and may lead to refolding of the intron and DARNED (Kiran et al. 2013) databases as well as editing sites
(Supplemental Fig. S10). Editing at the Gria2 R/G-site or Flna and identified in this study were used. From this repertoire of editing
Flnb sites is located close to the 5′ splice site at position −2 sites, 68 sites (33 novel sites, this study) were found in the 9-
(Higuchi et al. 1993; Czermak et al. 2018). base-long 5′ ss, and 66 sites (25 novel sites, this study) were found
Combination of reads that span editing site and splice site in the 23-base-long 3′ ss sequence. MaxEnt scores were obtained
were factored in when determining the statistical significance of for both the edited and unedited versions of the sequence, and
A B C D
E F
Figure 3. Nearby editing and splicing events are frequently linked. (A–D) Linear regression of co-occurrence analysis comparing editing levels and splic-
ing levels of C1qtnf4, Flnb, Gria2, and Mfn1 in Adar KO and Adarb1 KO cortex samples. WT samples are shown in blue and KO samples are shown in red. The
editing site position (ES) relative (upstream: +, or downstream: −) to the splice site position (SS) is given. (E) Histogram showing qPCR validation of targets
identified by co-occurrence analysis in Adar KO and Adarb1 KO cortex. Data shown are mean inclusion to exclusion ratio (±SD). Statistical test performed
with Student’s t-test; (∗ ) P < 0.05, (∗∗ ) P < 0.01, (∗∗∗ ) P < 0.001. A comparison of the significance found in the co-occurrence analysis of NGS data by Fisher’s
exact test and the output of the qPCR experiments as calculated by Student’s t-test. Green dots = significant; red squares = not significant. (F) Schematic
representing examples of positions of editing sites in the 5′ splice sites of Flnb, Gria2, and Xrn2 as well as in the 3′ splice sites of Mfn1, Akap8l, and Dgkz. Black
arrows show the location of editing sites. A dotted box highlights the canonical 5′ GU and 3′ AG splice sites.
6 Genome Research
www.genome.orgDownloaded from genome.cshlp.org on November 12, 2020 - Published by Cold Spring Harbor Laboratory Press
A-to-I RNA editing impacts pre-mRNA splicing
then the difference in MaxEnt scores was calculated of Flna in the cortex shows highest splicing efficiency in Adarb1
(Supplemental Table S5). The majority of editing sites in the 5′ KO but not in Adar KO (Fig. 4B,C).
splice site reduces the MaxEnt scores, indicating that A-to-I editing
reduces the strength of the 5′ splice sites. In contrast, in eight cases
(four novel sites identified here), editing leads to 5′ splice site cre- ADAR can impact splicing in an editing-independent manner
ation along with a strong improvement of the MaxEnt score The analysis of Adar−/− (Adar Δ7-9) tissues demonstrated that ADAR
(Supplemental Table S5). On the contrary, editing in the 3′ splice can influence splicing. However, in the DEXSeq-generated catalog
site does not follow any particular trend except in 11 cases (four of differential exon/intron usage events, only 129 out of 4113 in
novel sites from this study) where editing leads to 3′ splice site dis- cortex, seven out of 764 in bone marrow, and 0 out of 222 in liver
ruption (AG → GG) accompanied by a consistent decrease in events were found to harbor differential editing sites in a genomic
MaxEnt score (Supplemental Fig. S11). We validated the effect of region of 5000 nt surrounding the event at the pre-mRNA-level.
editing on splicing for five different editing sites using a mini- This suggests that the majority of differential exon/intron usage
gene approach. The difference in the MaxEnt scores correctly pre- events were devoid of differential editing sites in all tested Adar-
dicted the impact on splicing in all five cases (Supplemental Fig. KO tissues. Thus, ADAR may impact their splicing in an editing-in-
S12). Overall, this led us to conclude that A-to-I editing events in dependent manner. Given that the majority (∼80%) of editing
the bases surrounding splice sites impacts the strength of splice sites in the mouse can be found in intronic regions (Licht et al.
sites, frequently leading to a reduction in splicing. 2019b), the lower coverage of intronic regions in the poly(A)
RNA-seq performed in this study may partially explain this
observation.
ADARB1-mediated filamin, alpha editing causes intron retention
Still, to further explore this observation and to test for an ed-
The differential editing analysis performed in this study confirmed iting-independent impact of ADAR on splicing, a previously pub-
that filamin, alpha (Flna) is an ADARB1 target (Stulić and Jantsch lished RNA-seq data set generated from 12-wk-old mouse brain
2013). Flna gets edited at exon 42 where CAG → CGG conversion isolated from mice expressing a catalytic dead (Adar E861A/E861A)
leads to recoding of glutamine (Q) to arginine (R). version was analyzed (Heraud-Farlow et al. 2017). Embryonic le-
In the cortex of Adar KO mice, Flna is still edited by ADARB1. thality of these mice was rescued by concomitant deletion of
Indeed, a similar number of reads spanning the editing site and ad- Ifih1 (Liddicoat et al. 2015). Conceptually, ADARE861A fails to
jacent intron 42 can be found in RNA-seq data of Adar KO and WT edit but should still be able to bind RNA. Of note, the RNA-seq li-
samples. However, in the Adarb1 KO cortex, Flna is not edited. braries of Adar E861A/E861A mice were prepared from ribo-minus
Consistently, intron 42 is alternatively spliced in the DEXSeq RNA and sequenced in 75-bp paired-end mode using the
data (Supplemental Dataset 3), resulting in a reduced coverage of Illumina NextSeq 500 (Supplemental Fig. S1A,B).
intron 42 in the knockout (Fig. 4A). This indicates that editing of Analysis of the Ifih1 −/− ; Adar +/+ and Ifih1 −/− ; Adar E861A/E861A
Flna at exon 42 leads to increased retention of intron 42. Since data sets using DEXSeq identified 633 significant (P ≤ 0.1) differen-
Flna is primarily targeted by ADARB1, the co-occurrence analysis tial exon or intron usage events in 448 genes in the editing-
deficient Ifih1 −/−; Adar E861A/E861A brain
(Supplemental Dataset 3). This suggests
A that the editing activity of ADAR affects
some splicing events. However, the inter-
nal truncation allele used here, Adar Δ7-9,
that affects RNA binding and most likely
also protein stability, impacts many
more splicing events. It thus appears
that RNA-binding of ADAR has a strong
impact on RNA-splicing. Comparison of
the DEXSeq output from Adar−/− cortex
and Adar E861A/E861A brain found only 15
events (P ≤ 0.1) in 13 genes that were
common in both outputs (Fig. 5A,B).
B C Genes in this list encode for tRNA modi-
fying enzyme (Trmt6), RNA helicase
(Ddx5), component of AMPA receptor
complex (Shisa9), guanine nucleotide
binding protein (Gnb4), interleukin 16
(Il16), or heterochromatin binding pro-
tein (Hp1bp3). In this list of genes, six
DEXSeq events in Trmt6, Smc6, Shisa9,
Gnb4, Pcdh17, and Ddx5 showed oppo-
site directions of change in Adar−/− and
Adar E861A/E861A. Of these, Shisa9 and
Figure 4. ADARB1-mediated filamin, alpha (Flna) pre-mRNA editing causes intron retention. (A) RNA- Gnb4 have an editing site overlapping
seq coverage profile of Flna locus at exon 42-exon 43 from WT, Adar KO, and Adarb1 KO cortices. The
or next to the differentially spliced
editing site is shown at exon 42. (B,C) Linear regression of co-occurrence analysis comparing editing lev-
els and splicing levels of Flna in Adar KO (B) and Adarb1 KO (C ) cortex. WT samples are shown in blue and site. Thus, an impact of RNA-editing
KO samples are shown in red. and RNA-binding on RNA-splicing
Genome Research 7
www.genome.orgDownloaded from genome.cshlp.org on November 12, 2020 - Published by Cold Spring Harbor Laboratory Press
Kapoor et al.
A and Wnk4 showed impaired splicing
in both Adar−/− as well as in
Adar E861A/E861A, suggesting that the edit-
ing activity of ADAR is relevant. Overall,
this led us to conclude that ADAR can im-
pact splicing via editing-dependent and
B
editing-independent pathways.
Gene Symbol
ADAR-mediated impact on splicing
affects circular RNA biogenesis
Circular RNAs (circRNAs) are formed by
back-splicing of exons or introns, and
their biogenesis is also mediated by the
spliceosome (Memczak et al. 2013).
ADAR has been implicated in circRNA
biogenesis, and ADAR knockdown leads
to enhanced circRNA expression in hu-
man cells (Memczak et al. 2013; Ivanov
et al. 2015; Rybak-Wolf et al. 2015).
However, a tissue-specific analysis in
C mice lacking Adar was not performed to
this point. As circular RNAs lack poly(A)
tails, the ribosomal-RNA-depleted RNA-
seq performed on bone marrow and liver
data sets seemed suitable for this analysis
(Bajad et al. 2020). The data of WT and
Adar KO tissues were compared for ex-
pression profiles of circRNAs using the
DCC workflow (Cheng et al. 2016). The
program systematically detects back-
spliced junctions from RNA-seq data.
We found 1825 and 1768 circRNAs in
the bone marrow and liver data sets, re-
spectively (Supplemental Dataset 6).
Figure 5. ADAR can impact splicing in an editing-independent manner. (A) Venn diagram comparing Subsequently, read counts from both lin-
−/− E861/E861A
DEXSeq output of Adar cortex and editing-deficient Adar brain. (B) Table of DEXSeq events
common between Adar−/− cortex and Adar E861/E861A brain. Genes with opposite trends in the direction of ear reads as well as circular (back-spliced)
change are highlighted in yellow. Log2FC > 0 indicates higher quantity in WT and Log2FC < 0 indicates reads obtained from DCC were used to
higher quantity in knockout. (C) Histogram showing qPCR validation of splicing events in IFIH1-rescued perform differential expression analysis
MEFs. Data shown are mean inclusion to exclusion ratio in Adar−/− and Adar E861A/E861A (±SD) relative to using edgeR (Supplemental Fig. S13A,B).
Adar+/+. Statistical test performed was Student’s t-test; (∗ ) P < 0.05, (∗∗ ) P < 0.01, (∗ ∗∗ ) P < 0.001.
Out of 1825 detected, 242 circRNAs and
318 (out of 1768 detected) circRNAs
were differentially expressed (P ≤ 0.05)
seems possible. The small overlap between Adar−/− cortex and in bone marrow and liver, respectively. Next, we searched for
Adar E861A/E861A brain samples may also result from different sublo- circRNAs that were differentially expressed irrespective of
calized gene expression patterns (in cortex vs. whole brain), age their host gene expression. In bone marrow, 197 (out of 242)
(2 wk vs. 12 wk), different RNA-seq read depth (7 × 10⁷ 125-bp circRNAs differed significantly only in their circular counts, where-
PE vs. 7 × 10⁷ 75-bp PE), and library preparations (ribo-minus as 45 circRNAs were significant in both circular counts as well as
vs. poly[A]) (Supplemental Fig. S1A,B). linear counts. In liver, 298 (out of 318) circRNAs differed signifi-
In any case, to test for an editing-independent impact of cantly only in their circular counts, whereas only 20 circRNAs dif-
ADAR on splicing, we used mouse embryonic fibroblasts (MEFs) fered in both circular as well as linear counts. Among all the
generated from IFIH1-rescued wild-type (Ifih1−/ ; Adar+/+), knock- circRNAs detected, 1498 circRNAs were commonly expressed in
out (Ifih1−/− ; Adar/−), and knock-in (Ifih1−/− ; Adar E861A/E861A) both bone marrow and liver data sets. However, none of the signif-
mice. Candidates that were already validated in the MAJIQ/ icantly changed circRNAs in bone marrow showed significant
DEXSeq data sets in the Adar KO cortex and that were expressed changes in liver and vice versa.
in the MEFs were evaluated by qPCR (Fig. 5C). Eight out of 10 tar- Since the majority of the significantly differentially expressed
gets were differentially spliced to significant extents in either circRNAs showed no altered expression of their linear counter-
Adar−/− or in both Adar−/− as well as Adar E861A/E861A MEFs. Five sub- parts, ADAR seems likely involved in their biogenesis. To obtain
strates, Hdac10, Casc3, Prpf19, Prpf40b, and Rbm5, showed im- mechanistic insights for ADAR-mediated circRNA biogenesis, the
paired splicing only in Adar−/− and not in Adar E861A/E861A, regions flanking the circRNA coordinates were scanned for an en-
suggesting that splicing in these targets is mediated by ADAR in richment of editing sites. However, given the currently known ed-
an editing-independent manner. On the contrary, Ip6k2, Tars2, iting sites and sites detected in this study, no such enrichment was
8 Genome Research
www.genome.orgDownloaded from genome.cshlp.org on November 12, 2020 - Published by Cold Spring Harbor Laboratory Press
A-to-I RNA editing impacts pre-mRNA splicing
found in either bone marrow or liver circRNAs. Also, the average utkarshkapoor87&hgS_otherUserSessionName=Editing%2FSplicing
gene expression of host genes from which significant circRNAs %20Interplay.
emerged was not different from the expression of host gene from A concern is the ∼25% false discovery rate of alternative
which average circRNAs were derived (Supplemental Fig. S13C). splicing events. This reflects the shortcoming of available tools
As ADAR has an impact on alternative splicing and since to identify alternative splicing patterns. These tools are unable to
back-splicing is a type of alternative splicing, we next asked if detect the entire complexity of mammalian transcriptomes, as
the ADAR-mediated impact on alternative splicing can in turn per- pointed out before (Liu et al. 2014). Accordingly, the overlap be-
turb circRNA biogenesis. To this end, we intersected circRNA coor- tween MAJIQ and DEXseq events is relatively small. Also, the false
dinates obtained from DCC analysis with differential exon or discovery rate is comparable for both ADAR and ADARB1 target
intron usage events obtained from DEXSeq analysis. Here, of sites.
1825 circRNAs detected in the bone marrow data set, 139 over- In fact, we found only 23 genes that harbored 37 differential
lapped with DEXSeq genes. Of these 139 circRNAs, nine over- editing sites overlapping the coordinates of the DEXSeq event (i.e.,
lapped exactly with the coordinates of differential exon/intron the alternatively spliced region) in Adar KO cortex. However, the
usage coordinates (Supplemental Table S6). Similarly, out of detection of differentially edited sites requires high coverage.
1768 detected circRNAs in the liver data set, 47 overlapped with Thus, we may have missed several differentially edited sites in par-
DEXSeq genes in liver. Of these 47 circRNAs, three overlapped ex- ticular in intronic regions of transcripts. Still, in a window of 5000
actly with the coordinates of differential exon/intron usage coordi- nt up- or downstream from the spliced region, a total of 207 differ-
nates (Supplemental Fig. S13D; Supplemental Table S6). Although entially edited sites were found; harbored in 129 splicing events
a mere overlap of coordinates may not necessarily suggest an im- predicted by DEXSeq in Adar-deficient cortex. The relatively small
pact on circRNA biogenesis, it implies that these loci are hotspots number of differentially edited sites in the vicinity of differentially
of circRNA biogenesis. CircRNA biogenesis may be influenced by spliced regions suggests that the majority of the adenosine deam-
closely spaced paired repeat elements like inverted SINEs. inase-mediated impact on splicing may be indirect and act in trans.
Indeed, the set of circRNAs differentially expressed in bone mar- In fact, genes alternatively spliced in the Adar KO cortex were fre-
row but not in liver was closer to downstream paired SINE ele- quently associated with the GO terms “mRNA-splicing via spliceo-
ments (Supplemental Fig. S14A–C). Similarly, the distance to some,” “mRNA-processing,” and “gene expression.” This supports
downstream flanking exons was closer for circRNA differentially the idea that most altered splicing events are mediated by altered
expressed in the bone marrow but not in the liver (Supplemental expression patterns of genes affecting RNA metabolism.
Fig. S14D–F). Overall, this analysis detected differentially ex- Consistent with a previous study (Solomon et al. 2013), this sug-
pressed circRNAs in Adar KO tissues, suggesting that ADAR may af- gests that ADAR majorly impacts the global splicing landscape
fect a few selected circRNAs in their biogenesis. by altering the splicing pattern of trans-acting splicing factors.
Our analysis revealed differences in the splicing landscape in
the Adar KO tissues cortex, bone marrow, and liver. We found that
Discussion the absence of Adar can impact mRNA-splicing in a tissue-specific
The cotranscriptional nature of mRNA processing has permitted manner, both in terms of trend and magnitude. This may be regu-
evolution of various coupling mechanisms such as RNA editing lated by affecting different, tissue-specific splicing factors, by tis-
and pre-mRNA splicing. sue-specific ADAR interactomes, inosine reader proteins, or even
In this study, using genetic mouse models in which either one changes in transcriptional kinetics. In three different tissues, no
of the two catalytically active editing enzymes ADAR or ADARB1 single common editing target was edited and/or spliced to explain
are deleted, we determined their impact on pre-mRNA splicing. the global changes in splice patterns observed. The tissue-specific
So far, the study of splicing in Adar-ablated mouse postpartum impact of ADARB1-mediated RNA editing on pre-mRNA splicing
was precluded due to embryonic lethality. Our study fills this remains to be tested. Given that editing sites are edited in a tis-
gap by using Adar-deficient mice that are rescued by a deletion sue-specific manner, it would be interesting to test tissue-specific
of Mavs. We compared these data with Adarb1-deficient mice res- splicing outcomes of nonsynonymous editing targets that are
cued by a pre-edited Gria2 allele (Higuchi et al. 2000). We com- recoded as a result of ADARB1 editing.
pared transcriptome-wide editing patterns and splicing changes In order to enrich for genes that are directly impacted by ed-
in Adar- and Adarb1-ablated mouse tissues using the bioinfor- iting, we developed an orthogonal approach where we analyzed
matics tools MAJIQ and DEXseq. MAJIQ only picked up a small co-occurrence of editing and splicing events in individual reads.
number of alternative splicing events, leaving out events that We observed a reduction in splicing efficiency of recoding editing
were already known to be regulated by RNA editing (Higuchi targets like Flna, Flnb, Gria2, Mfn1, and Tmem63b. Since this ap-
et al. 2000; Flomen et al. 2004; Schoft et al. 2007; Licht et al. proach was limited to a ±50-nt window, an even higher number
2016). To overcome this shortcoming, we combined MAJIQ with of editing sites that impact splicing events might be detected by in-
an altered version of DEXSeq (Anders et al. 2012). Doing so al- creasing the scanning window. Furthermore, it remains to be test-
lowed us to identify a total of 3573 genes with altered exon/intron ed if the editing-splicing interplay impacts specific RNA-isoforms
usage patterns. where third generation single molecule sequencing technologies
Previously, we had identified around 90,000 editing sites in and long reads may come in handy (McCarthy 2010; Jain et al.
the mouse transcriptome, the majority of which are located in 2016).
intronic regions (Licht et al. 2019b). Consistently, many of the al- A particularly interesting editing target is Flna which is edited
ternatively spliced genes identified here are predicted to harbor throughout multiple tissues to different extents (Stulić and Jantsch
one or more editing sites. Nevertheless, the majority of these 2013). Our data provide evidence that RNA editing of Flna can re-
events were not differentially edited upon loss of ADAR duce its splicing efficiency, supporting the prediction from co-oc-
or ADARB1, as can be seen here: https://genome.ucsc.edu/ currence analysis. It would be interesting to test if the Flna editing-
cgi-bin/hgTracks?hgS_doOtherUser=submit&hgS_otherUserName= splicing link has any physiologically relevant effect in different
Genome Research 9
www.genome.orgDownloaded from genome.cshlp.org on November 12, 2020 - Published by Cold Spring Harbor Laboratory Press
Kapoor et al.
tissues given that Flna is edited to different levels in different tis- sequently generated from isolated poly(A) RNA using the NEBNext
sues (Stulić and Jantsch 2013). Ultra Directional RNA Library Prep kit for Illumina (New England
We found that the majority of genes with altered splice pat- Biolabs), barcoded using NEBNext Multiplex Oligos for Illumina
terns identified in this study did not harbor any editing sites that Index Primers Set 1 (New England Biolabs), and sequenced in a
were differentially edited upon either Adar or Adarb1 deletion. paired-end mode with 125-bp read length using the HiSeq 2500
We therefore tested for the impact of ADAR on splicing in an edit- (Illumina) platform.
ing-independent manner. By comparing the splicing landscape
between IFIH1-rescued Adar WT and Adar E861A/E861A mouse brain Differential editing analysis
(Heraud-Farlow et al. 2017), we were able to uncover 448 genes that
Differential editing analysis was performed by comparing editing
showed altered splicing patterns in Adar E861A/E861A. However, an
levels in WT and KO samples. Only those editing sites were consid-
IFIH1-rescued Adar KO data set, an important control supporting
ered for analysis that were covered by minimum five reads in at
our analysis, was missing in Heraud-Farlow et al. (2017).
least two out of three WT and in at least two out of three KO sam-
Therefore, a three-way comparison of global splicing landscapes
ples. We then compared the mean of editing levels of sites in WT
between Adar WT, Adar KO, and Adar E861A/E861A in the same tissue and KO samples and performed statistical analysis using Welch’s t-
remains to be tested. Nevertheless, our data suggest that ADAR also test, and all editing sites that had a P-value ≤ 0.1 were considered
influences alternative splicing in an editing-independent manner, significantly differentially edited. For comparison with previously
likely via binding to pre-mRNAs and competing with splicing fac- known sites, mouse editing sites were downloaded from RADAR
tors as we had previously observed for ADARB1 (Licht et al. 2016). (Ramaswami and Li 2014) and DARNED (Kiran et al. 2013)
Splicing can also influence editing levels via affecting the kinetics databases.
of forming and destroying editing-competent structures on the
pre-mRNA level (Licht et al. 2016, 2019b). These dynamics may
be modulated by alternative splicing factors (Licht et al. 2019b; Global splicing analysis
Quinones-Valdez et al. 2019). Overall, our study using connected, For profiling global splicing changes in Adar and Adarb1 knockout
yet independent orthogonal approaches demonstrates a wide- tissues, we first used a tool called Modeling Alternative Junction
spread but predominantly indirect effect of ADAR on splicing. In Inclusion Quantification which detects and quantifies local splic-
contrast, ADARB1 affects splicing to a much lower extent but ing variations from RNA-seq data (Vaquero-Garcia et al. 2016).
acts seemingly more directly by altering regulatory sequences in Default parameters were used. It quantifies relative abundance
the immediate vicinity of 5′ and 3′ splice-sites. (PSI) of LSVs and changes in relative LSV abundance (delta PSI) be-
Lastly, we analyzed changes in circRNA expression upon Adar tween genotypes. We also used a second tool which estimates
Differential Exon Usage (DEXSeq) from RNA-seq data (Anders
knockout in bone marrow and liver. The impact of ADAR on
et al. 2012). This program evaluates if a certain exon is under-/over-
circRNA expression was previously established using siRNA-medi-
represented relative to all the other exons in that gene in different
ated knockdown in HEK293, SH-SY5Y, and mouse P19 cells
experimental conditions. By default, DEXSeq excludes any
(Ivanov et al. 2015; Rybak-Wolf et al. 2015). However, although
intronic events. Since we know that A-to-I RNA editing events
the previous data suggest a general up-regulation of circRNA ex- are enriched in the introns, we tweaked DEXSeq to include intron
pression upon loss of ADAR, we observed distinct differences for information in the input mouse (assembly GRCm38/mm10) an-
individual circRNAs including both up- and down-regulation. notation (GTF) file. RNA-seq data from Adar +/+; Ifih1 −/− and
Moreover, in our analysis, changes in circRNA expression upon Adar E861A/E861A; Ifih1 −/− adult whole brain was retrieved from
Adar loss correlate with the expression changes seen for their linear NCBI Gene Expression Omnibus (GEO) (GSE94387).
counterparts.
Together with a comprehensive analysis of circRNA genesis in
the presence or absence of ADARs, our study provides a global and Validation of differential splice events from MAJIQ and DEXSeq
comprehensive view on the interplay of editing, RNA splicing, and To validate differential splicing events called in MAJIQ and
circRNA biogenesis. Our integrated and comprehensive data set is DEXSeq data sets, we used an RT-PCR approach. Total RNA was ex-
available as a resource in the form of a UCSC Genome Browser ses- tracted using TriFast (VWR Peqlab) and DNase I treated (Thermo
sion titled “Editing-Splicing Interplay.” Fisher Scientific) following the manufacturer’s instructions. One
microgram of DNase-treated RNA was reverse-transcribed
(Thermo Fisher Scientific) using the manufacturer’s instructions.
Methods NEB OneTaq Quick-Load 2X Master Mix with Standard Buffer
(New England Biolabs) was used for RT-PCR with sequence-specific
RNA-seq primers (Supplemental Table S7). Conditions for PCR are as fol-
Mavs+/− mice were acquired from Jackson Laboratory (stock lows: initial denaturation at 95°C for 3 min, 35 cycles of (95°C,
#008634, Allele: Mavs tm1Zjc). Adar Δ7-9 and Adarb1+/−; Gria2 R/R 30 sec; annealing at 55° or 58°C, 30 sec; extension at 68°C,
were kindly provided by Dr. Peter Seeburg (Higuchi et al. 2000; 30 sec), followed by final extension at 68°C for 5 min. RT-PCR
Hartner et al. 2004). Mice were bred using standard in-house products were subjected to agarose gel electrophoresis and imaged
mouse facility/FELASA guidelines. For RNA-seq, age-/sex-matched using Image Lab Software (Bio-Rad Laboratories Inc.). We also val-
littermate mice of desired genotypes were sacrificed at 2 wk of age, idated targets in a more quantitative manner by qPCR using NEB
the cortex was isolated, and RNA was extracted using TriFast (VWR Luna Universal qPCR Master Mix (New England Biolabs). In this
Peqlab) and DNase I treated (Thermo Fisher Scientific) following case, we used primers that specifically amplified pre-mRNA or
the manufacturer’s instructions. Three biological replicates were mRNA and compared inclusion/exclusion ratio between geno-
used for each genotype. To prepare RNA-seq libraries, we started types (Supplemental Table S7). Conditions for qPCR are as follows:
with 1 µg total RNA from each sample and performed poly(A) initial denaturation at 95°C for 1 min, 40 cycles of (95°C, 15 sec;
RNA selection using the NEBNext Poly(A) mRNA Magnetic annealing/extension at 60°C, 30 sec; extension at 68°C, 30 sec +
Isolation Module (New England Biolabs). cDNA libraries were sub- plate read) followed by a melt curve. Splicing was quantified as
10 Genome Research
www.genome.orgYou can also read