Observations and temperatures of Io's Pele Patera from Cassini and Galileo spacecraft images
←
→
Page content transcription
If your browser does not render page correctly, please read the page content below
Icarus 169 (2004) 65–79
www.elsevier.com/locate/icarus
Observations and temperatures of Io’s Pele Patera from Cassini and
Galileo spacecraft images
Jani Radebaugh,a,∗ Alfred S. McEwen,a Moses P. Milazzo,a Laszlo P. Keszthelyi,b
Ashley G. Davies,c Elizabeth P. Turtle,a and Douglas D. Dawson a
a Lunar and Planetary Laboratory, University of Arizona, Tucson, AZ 85721, USA
b US Geological Survey, 2255 N. Gemini Dr., Flagstaff, AZ 86001, USA
c Jet Propulsion Laboratory, 4800 Oak Grove Drive, Pasadena, CA 91109-8099, USA
Received 22 May 2003; revised 17 October 2003
Abstract
Pele has been the most intense high-temperature hotspot on Io to be continuously active during the Galileo monitoring from 1996–2001.
A suite of characteristics suggests that Pele is an active lava lake inside a volcanic depression. In 2000–2001, Pele was observed by two
spacecraft, Cassini and Galileo. The Cassini observations revealed that Pele is variable in activity over timescales of minutes, typical of
active lava lakes in Hawaii and Ethiopia. These observations also revealed that the short-wavelength thermal emission from Pele decreases
with rotation of Io by a factor significantly greater than the cosine of the emission angle, and that the color temperature becomes more
variable and hotter at high emission angles. This behavior suggests that a significant portion of the visible thermal emission from Pele comes
from lava fountains within a topographically confined lava body. High spatial resolution, nightside images from a Galileo flyby in October
2001 revealed a large, relatively cool (< 800 K) region, ringed by bright hotspots, and a central region of high thermal emission, which is
hypothesized to be due to fountaining and convection in the lava lake. Images taken through different filters revealed color temperatures of
1500 ± 80 K from Cassini ISS data and 1605 ± 220 and 1420 ± 100 K from small portions of Galileo SSI data. Such temperatures are near
the upper limit for basaltic compositions. Given the limitations of deriving lava eruption temperature in the absence of in situ measurement,
it is possible that Pele has lavas with ultramafic compositions. The long-lived, vigorous activity of what is most likely an actively overturning
lava lake in Pele Patera indicates that there is a strong connection to a large, stable magma source region.
2003 Elsevier Inc. All rights reserved.
Keywords: Satellites of Jupiter; Io; Volcanism; Surfaces-satellite; Interiors
1. Introduction and previous discoveries about Pele servations that it may have been active but difficult to de-
tect, like a “stealth” plume (Johnson et al., 1995). HST and
Jupiter’s moon Io lays claim to the hottest and most active Galileo observations suggest that the red material results
volcanoes in the Solar System. Of the many volcanoes litter- from short-chain S, and that SO2 is also present (Spencer
ing Io’s surface, Pele Patera is one of the most distinctive et al., 1997a, 2000a, Geissler el al., 1999). The Solid State
and dramatic in its eruption style, activity level, and ap- Imaging (SSI) camera on the Galileo spacecraft and HST
pearance (Smith et al., 1979; Spencer and Schneider, 1996; have shown that the plume sometimes reaches ∼ 450 km in
McEwen et al., 1998a). During the Voyager 1 flyby in 1979, height (Spencer et al., 1997a; McEwen et al., 1998a). In-
Pele Patera was observed to be the source of a giant, 1200 km ward of the red deposits is a fan-shaped deposit of dark,
diameter, diffuse, red ring of deposits (Fig. 1), produced by diffuse material that extends to 150 km from its source and
is likely to be composed of silicate pyroclastics ejected from
a plume reaching 300 km in height (Strom et al., 1981).
Pele (Strom et al., 1979; Geissler el al., 1999).
The plume was not observed by Voyager 2, but we now
Pele also exhibits continually high thermal emission. It
know from Galileo and Hubble Space Telescope (HST) ob-
was the hottest spot detected by Voyager, with a model tem-
perature of 650 K (Pearl and Sinton, 1982) that suggested
* Corresponding author. much hotter lava temperatures (Carr, 1986). Galileo obser-
E-mail address: jani@lpl.arizona.edu (J. Radebaugh). vations made of Io during eclipse by Jupiter and of Io’s
0019-1035/$ – see front matter 2003 Elsevier Inc. All rights reserved.
doi:10.1016/j.icarus.2003.10.019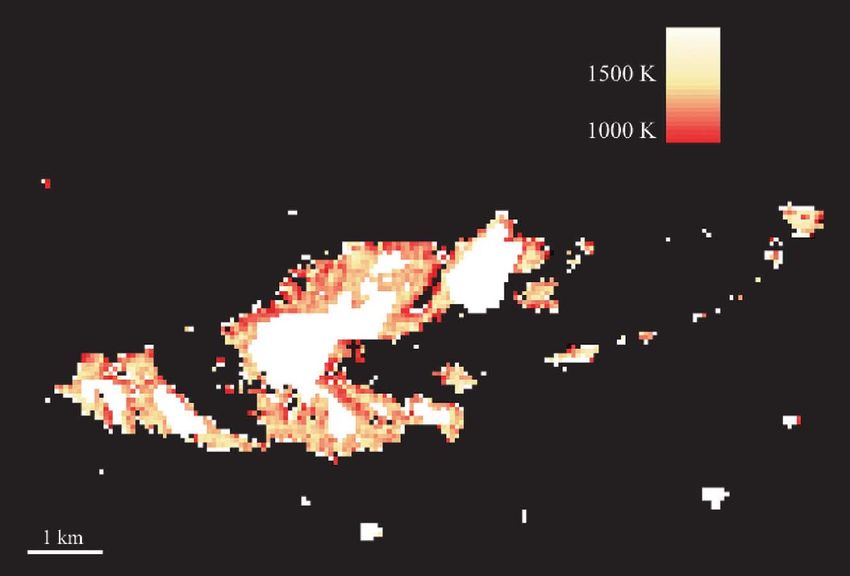
66                                                      J. Radebaugh et al. / Icarus 169 (2004) 65–79

                                                                                  Fig. 2. The best resolution daytime image of Pele Patera is from Voyager in
                                                                                  1979. The Pele region is shown here at ∼ 2 km pixel−1 . The patera extends
                                                                                  north from Danube Planum, a high plateau in the south center of this image.
                                                                                  Pele Patera is also bounded on the south by a large, east-west trending rift.
                                                                                  This rift shows evidence of current volcanic activity in the form of dark
                                                                                  pyroclastic deposits bordering its west end, and dark material, likely lava
                                                                                  flows, on its east end, in the south of the patera. The figure is taken from the
                                                                                  USGS Flagstaff global Io Voyager basemap. North is toward the top of the
Fig. 1. Slightly enhanced color image of Io centered on 270◦ west longitude,      image.
taken by Galileo SSI during the G1 orbit, 27 June 1996. Pele Patera is sur-
rounded by a fan of dark, pyroclastic material and a much larger, 1500 km
diameter, red ring of sulfur-rich plume deposits. The color image is a com-       (mean 6.6 km; Radebaugh, 1999). The activity at Pele ap-
bination of images taken through the near-IR, green, and violet filters and
                                                                                  pears to be confined to the southern portion of this patera,
has a resolution of ∼ 14 km pixel−1 .
                                                                                  since low-albedo materials associated with high-T hotspots
                                                                                  on Io (McEwen et al., 1985, 1997) are found there. This re-
nightside revealed Pele to be a prominent hotspot through-                        gion also coincides with a large rift that runs parallel to the
out 1996–2001 (McEwen et al., 1998a; Keszthelyi et al.,                           north margin of Danube Planum and the south margin of
2001). In many of these instances, the thermal output at                          Pele Patera (Fig. 2). NIMS observed high thermal output at
Pele was so great that it saturated the SSI detector, pre-                        the southeast corner of Pele Patera during orbit I27, in Febru-
venting us from determining precise temperatures (Keszthe-                        ary 2000 (Lopes et al., 2001; Davies et al., 2001). Lower res-
lyi et al., 2001). Pele was also observed by Galileo’s Pho-                       olution ( 3 km pixel−1 ) visible images from Galileo show
topolarimeter Radiometer (PPR) (Spencer et al., 2000b;                            that there are no large lava flows currently emerging from
Rathbun et al., 2004) and Near Infrared Mapping Spectrom-                         Pele Patera. However, NIMS spectra of thermal emission
eter (NIMS) (Lopes-Gautier et al., 1999; Davies et al., 2001;                     show persistent, elevated thermal emission peaking at wave-
Lopes et al., 2001, 2004), and by HST and ground-based                            lengths shorter than 3 µm, indicating a vigorous eruption that
telescopes (Spencer et al., 1997b; Marchis et al., 2001; in                       is constantly exposing new lava. These data were interpreted
preparation). In fact, Pele has been active in every observa-                     by Davies et al. (2001) as due to an active lava lake with a
tion made during the Galileo era, although it may have been                       crust disrupted by lava fountaining, which reinforced a sim-
inactive for a period of time between Voyager and Galileo                         ilar conclusion by Howell (1997) from groundbased data.
(Spencer and Schneider, 1996).                                                    A lava lake is defined as a volcanic depression that con-
   The tremendous thermal output observed at Pele is in                           tains exposed liquid lava, overlying and directly connected
contrast to the relatively small size of its patera (volcano-                     to a magma source. This feature reveals, through energy out-
tectonic depression), at least in comparison to other pat-                        put, the mass flux which in turn can be used to determine
erae on Io. Pele was best imaged in the daylight by Voy-                          the interior plumbing of the volcano (Harris et al., 1999;
ager 1, at about 1 km pixel−1 . It is an elongate depression,                     Davies, 2003).
extending north from the plateau Danube Planum (Fig. 2)                               During the Galileo I24 flyby of Io, SSI obtained nightside
(Strom et al., 1979; McEwen et al., 2000). Its dimensions                         observations of Pele Patera at 30 m pixel−1 . Only a curv-
are 30 km × 20 km, less than the mean diameter for paterae                        ing line of glowing spots, more than 10 km long and 50 m
on Io of 41 km and much smaller than the largest Ionian pa-                       wide (Fig. 3) was observed. It was suggested that the line of
terae, which are over 150 km in diameter (Radebaugh et al.,                       hotspots marked the edge of Pele Patera (which may also co-
2001), but large compared with terrestrial basaltic calderas                      incide with a margin of the rift) and that the chilled crust of a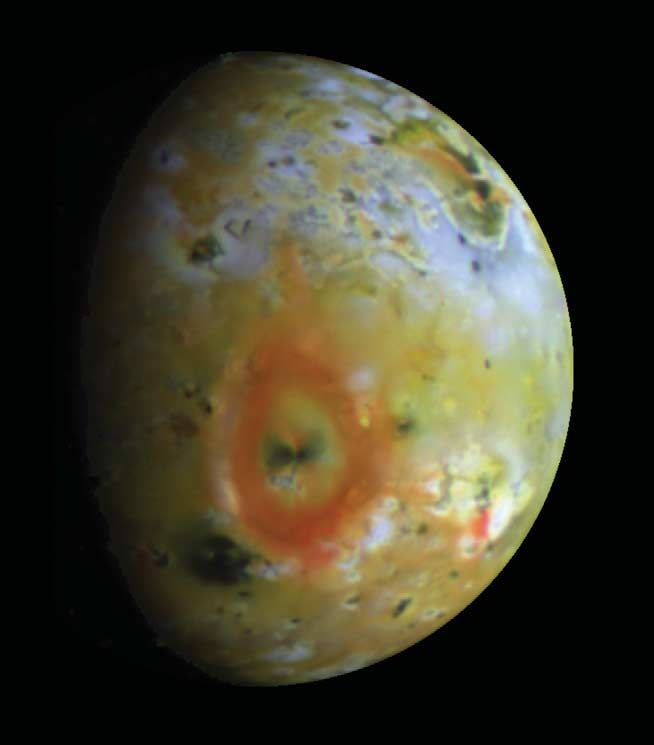
Observations and temperatures of Io’s Pele Patera                                                       67

                                                                                  Fig. 4. Clear filter (CL1–CL2) image of Io by Cassini ISS, obtained 1 Janu-
                                                                                  ary 2001, while Io was in eclipse by Jupiter. The brightest hotspot south and
                                                                                  east of center is Pele, the smaller one to the east of Pele is Pillan. Emissions
                                                                                  near Io’s limb are auroral glows from excitation of plume gases. Image res-
                                                                                  olution is ∼ 61 km pixel−1 .
Fig. 3. A bright, curving line of hotspots is seen here in nightside images of
the Pele region from the Galileo I24 orbit, 11 October 1999. This image was
taken through SSI’s clear filter. The bright regions resemble the margins of      2002). Cassini obtained four sets of multiple-filter images
terrestrial lava lakes where the chilled crust breaks up against the confining    of Io in Jupiter’s shadow, and Pele was the most prominent
walls, exposing the hot lava beneath. Image resolution is ∼ 30 m pixel−1 ,        of the hotspots observed (Radebaugh and McEwen, 2001;
north is toward the top.                                                          Porco et al., 2003). Cassini’s closest approach to Jupiter was
                                                                                  9.72 million kilometers, so it did not image Io with the high
lava lake was breaking up against the patera walls, exposing                      resolution of Voyager or Galileo. Still, at ∼ 61 km pixel−1 ,
the underlying, hot, liquid lava (McEwen et al., 2000).                           the eclipse images revealed several bright hotspots, Pele be-
   Previously published Galileo-derived temperature esti-                         ing by far the most radiant (Fig. 4).
mates included 1275 ± 15 K from an SSI eclipse observation                           Ten months later, Galileo flew to within only 200 km of
in 1997 (McEwen et al., 1998b). In addition, Lopes et al.                         Io’s surface, and obtained nightside images of Pele through
(2001) reported a median temperature of 1760 K (± 210 K)                          two filters at 60 m pixel−1 (I32 flyby, October 2001; Turtle
for the high temperature component of fits to 15 hand-picked                      et al., 2004). These observations provided us with much-
pixels within the largely-saturated, high-spatial resolution                      awaited details of the eruption morphology of the Pele vol-
I24 NIMS data. Maximum surface temperatures derived                               canic center.
from a fit to a combined NIMS-SSI dataset using a model
of volcanic thermal emission (Davies, 1996) yielded a liq-                        2.1. Cassini eclipse observations
uidus range of 1250–1475 K. Davies et al. (2001) found that
the high-temperature components of two-temperature fits to                           Io passes through Jupiter’s shadow every 42.5 hours. Dur-
NIMS data ranged from 1077 ± 13 to 1390 ± 25 K, but con-                          ing Cassini’s flyby of the jovian system, the narrow angle
cluded that the magma temperature needed to be > 1600 K                           camera (NAC) of its Imaging Science Subsystem (ISS) re-
to explain this thermal signature.                                                turned close to 500 images of Io in eclipse (Porco et al.,
                                                                                  2003). This suite of images was unique for Io because of its
                                                                                  high temporal resolution, wavelength range, and radiomet-
2. New observations                                                               ric precision. Imaging sequences lasted from two to three
                                                                                  hours, with individual images separated from each other by
   The main objective of this paper is to present the latest                      just several seconds to minutes (Table 1). Clear filter ob-
spacecraft observations of Pele Patera. In this section, we de-                   servations were spaced ∼ 11 minutes apart, the first time
scribe these data and briefly explain how we derive lava tem-                     variability in Io’s hotspot activity had been monitored from
peratures. While most of the details of the data analysis are                     a spacecraft over such short time scales. The Cassini ISS
in the appendices, it is important to note that these temper-                     camera provides 12 NAC filters resulting in 144 filter com-
atures could only be retrieved with such precision because                        binations to cover the wavelength range of 250–1050 nm, a
of the exquisite calibration of the cameras on both Galileo                       major improvement over the 8 filters across 350–1100 nm
and Cassini. Most of the techniques we use have not been                          for Galileo’s SSI. Furthermore, Cassini’s ISS records data at
applied to terrestrial remote sensing data from volcanoes on                      12-bits pixel−1 as opposed to Galileo SSI’s 8-bits pixel−1 .
the Earth because such rigorous calibration data is not gen-
erally available. The discussion of how our new results have                      2.1.1. Color temperatures from Cassini eclipse images
changed our understanding of the nature of the eruption oc-                          We obtained two-filter ratio temperatures of the Pele
curring at Pele Patera is presented in later sections.                            hotspot from the Cassini eclipse data. Details of our method,
   In late December 2000, the Cassini spacecraft passed near                      including error analysis, are in Appendix A.1. The tempera-
Jupiter, to gain a boost on its long journey to Saturn (Miner,                    tures, for all three sets of eclipse observations, are between
68 J. Radebaugh et al. / Icarus 169 (2004) 65–79
Table 1
Details of the Cassini eclipse observations of Io
Eclipse Start of End of SSC Lat SSC Lon Clear filter IR filter Time between Time between
observation imaging imaging exp time exp time clear and IR pairs
day364 2000 DEC 29, 2000 DEC 29, ∼ 0.5◦ N 300◦ –324◦ W 0.046 s 0.197 s 48 s 11 min 12 s
09:07:44.51 12:07:44.51
day000 2000 DEC 31, 2000 DEC 31, ∼ 0.2◦ S 286◦ – 302◦ W 0.046 s 0.197 s 3 min 13 s 5 min 35 s
03:07:44.51 05:07:44.51
day001 2001 JAN 1, 2001 JAN 2, ∼ 0.8◦ S 280◦ –305◦ W 0.046 s 0.197 s 48 s 11 min 12 s
22:07:44.51 01:07:44.51
Each observation is given a name corresponding to the day in the year 2000 or 2001. Data for the first planned eclipse observation, which would have been
acquired during December 27, 2000, were not acquired due to a reaction wheel anomaly. Image times are recorded in hundredths of seconds. “SSC Lat”
and “SSC Lon” indicate subspacecraft latitude and longitude. “Time between clear” and “Time between IR” are the times between the consecutive clear and
infrared images that were analyzed in pairs. This separation was much greater for day000 than for the other two eclipse observations, so interpretation of the
ratios that result from this observation must be done with caution. “Time between pairs” is the time elapsed between consecutive clear filter images used for
pair analysis. For this paper we analyzed ten image pairs for the day364 and day001 observations, and four image pairs for the day000 observation.
Fig. 5. Ratios of emission through Cassini’s clear and IR filters, plotted on
the curve of ratios of expected blackbody emissions from Fig. A.1 (Ap- Fig. 6. Intensity in electrons s−1 for each eclipse observation, clear filter
pendix A.1), in order to determine color temperature. Plotted error bars are only. Open symbols are corrected for emission angle using [cos(emission
> 1σ . Most data points are clustered between 1350 and 1400 K. angle)]1.6 as described in the text. Uncorrected data (filled symbols) show
a linear decrease in intensity with emission angle, although the day001 and
day364/day000 data are offset, likely due to a decrease in emission from
1260 and 1580 K (including ∼ 1 sigma error bars) as il- Pele in the later eclipse.
lustrated in Fig. 5. However, the temperatures are generally
tightly clustered around a median value of 1360 K. These The temperatures from individual ratios are plotted
values are consistent with other temperatures estimated from against emission angle in Fig. 7. Since emission angle in-
Galileo observations of Pele, as discussed in Section 1. creased over time during each observation, this plot illus-
trates temperature changes at Pele over the course of each
2.1.2. Variation over time eclipse observation. All temperatures are fairly constant and
Because Cassini obtained multiple image pairs over the are close to the median value of 1360 K. The exception is the
course of each eclipse, we were able to observe changes in last half of the first eclipse observation, day364 (December
intensity and temperature at Pele over time. Overall intensity 29, 2000), which shows statistically significant oscillations
declined over the course of each eclipse observation. This is in temperature from the lowest (1300 ± 40 K) to the highest
because as Pele rotated toward the east limb of Io the camera value (1500 ± 80 K) within just 22 minutes. This tempera-
received less of the volcano’s overall emission (Fig. 6). If the ture change also coincides with the highest emission angle
volcano were a perfectly flat radiator, during each observa- of any of the observations. Temperatures for day000 (De-
tion ISS should have seen a decrease in emission from Pele cember 31, 2000) and day001 (January 1, 2001) also show
by a factor of the cosine of the emission angle. However, minor variations. There is a slight downturn in temperature
the observed emission from Pele requires a correction factor at the end of day000, and the second half of day001 shows
of [cos(emission angle)]1.6 (Fig. 6). The interesting impli- a drop in temperature, followed by a steady increase. How-
cations this may have for the geometry of the hot material ever, these are fairly minor variations compared with the
within Pele is discussed later. dramatic oscillations from day364.Observations and temperatures of Io’s Pele Patera 69
days, then the data should all lie on the same curve in Fig. 6.
It is clear, however, that separate curves must be drawn
through the data for each eclipse, and that there is a grad-
ual decrease in total emission from Pele from the first to the
last eclipse observation (Fig. 6).
These are the first spacecraft observations of an Ionian
eruption at this temporal resolution. With Galileo, observa-
tions of the same regions were repeated either minutes or
months apart, but never several minutes apart over a two
hour time period, and then again 40 hours later, and again 40
hours after that. We have now been able to document vari-
ability in thermal output at Pele on time scales of minutes,
hours, days, months, and years. This volcano is remarkable
in its constant behavior, especially given that hot lava erupts
in spurts and cools rapidly.
Fig. 7. Variation in temperature against clear filter emission angle is shown 2.2. Galileo I32 nightside observation
for all three eclipse observations. Each eclipse observation progresses in
time from left to right. Temperatures result from ratios of CL1–CL2 to Galileo’s final successful imaging flyby of Io, I32, oc-
IR4–CL2 images. Values are generally equivalent to the mean value of
curred in October 2001 (Turtle et al., 2004). The I32 flyby
1360 K derived for the temperatures during the Cassini observations, but
the greatest variations occur during day364, the first eclipse observation, provided us with five spectacular nightside images of Pele
which reaches the highest emission angle of all of the observations. The ob- at 60 m pixel−1 . The images appear to have entirely covered
served oscillations are greater than the > 1σ uncertainties and are therefore the 30 km-wide patera and show some unexpected aspects
considered to be real. of this unique volcano. Additionally, the Galileo NIMS in-
strument obtained observations of Pele in darkness at spatial
It is interesting that total intensity (Fig. 6) and tempera- resolutions of ∼ 1 km pixel−1 , allowing coanalysis of SSI
ture (Fig. 7) are not generally correlated. However, the final and NIMS data (Davies et al., 2002).
intensity data point for day364 is slightly elevated above pre-
vious points, and this corresponds to the highest temperature 2.2.1. Image details
calculated during the eclipse observations. The total inten- The first three images were taken through the clear fil-
sity data also revealed variation in Pele’s emission over a ter, which has a wavelength range of 380–1100 nm, and
longer timescale. If emission from Pele remained roughly the second two images were taken through the 1 µm fil-
constant throughout the three observations spanning four ter with a wavelength range of 950–1100 nm. Figure 8a is
Fig. 8. Clear filter images of the Pele region from Galileo I32. (a) shows the raw data, illustrating the effect of radiation noise. (b) is the combination of the
three clear images, using the noise removal technique described in Appendix A.2. A faint hotspot chain can be traced across the breadth of the “reduced noise”
image.70 J. Radebaugh et al. / Icarus 169 (2004) 65–79
a single, unprocessed, clear filter image of the Pele region. (Appendix A.3). Since we had much better spatial reso-
Several features are apparent in the raw image. Many of the lution for these observations than for the Cassini observa-
bright spots in the image are saturated, and some are bleed- tions, we could derive color temperatures across the hot lava
ing (as evidenced by the bright spikes pointing downward, within Pele Patera. Figure 9 is a close-up of a single-pixel-
see Appendix A.2 for more details). The bright central re- temperature image, in which each temperature has been as-
gion also has some saturation and bleeding, and there are signed a color, ranging from dark red for lower tempera-
some interesting spatial patterns here. It is important to note tures, to bright yellow for higher temperatures, and white
that the images are extremely noisy, due to the charged- for saturation. Much of the middle region, near the large
particle-laden environment in the vicinity of Jupiter. Thus, saturation areas, has color temperatures of about 1270 ±
a noise removal technique was applied to the images (Ap- 100 K. There are also some hotter zones where pixels reach
pendix A.2). The reduced-noise images allow us to interpret 1350 ± 200, 1420 ± 300, and 1605 ± 220 K. Some individ-
the structures of the hot regions much more confidently. In ual isolated pixels give exceedingly high color temperatures
particular, it is possible to trace a faint string of hotspots (up to 10,000 K), but also have correspondingly large er-
down from the upper left corner of the processed clear image rors. These are interpreted to be traces of radiation noise
(Fig. 8b), through the bright hotspots, below the bright cen- that we did not succeed in removing from the data (Ap-
tral region, and back up the right side of the image. There pendix A.3) The temperature map shows that, as expected,
is also an elongate bright ring of hotspots at the far right most of the lower temperatures are at the outer margins of
of the image. These strings of hotspots are similar to what the high-emission areas, while the highest temperatures are
was observed at slightly higher resolution in February 2000 closest to the saturated zones. In fact, it is likely that we
(Fig. 3). are not measuring the highest color temperatures at Pele,
since those are probably within saturated regions. This is
2.2.2. Temperatures of Pele from Galileo I32 possibly also the reason for the difference in temperature
We used the reduced-noise clear and infrared filter im- between the Cassini and Galileo observations. Regions of
ages to calculate color temperatures for the Pele region Pele that produced emission that saturated the Galileo cam-
Fig. 9. Temperature map of the bright region of Pele Patera. In this image, the pixel values represent color temperatures according to the scale. White regions
are areas of saturation and/or bleeding, for which temperatures could not be determined.Observations and temperatures of Io’s Pele Patera 71
Fig. 10. Locations of four 3 × 3 pixel boxes selected from all possible 3 × 3 box combinations across the images for their high temperatures. Most of the high
temperatures found are in the small hotspot in the upper right corner of Fig. 9.
era and could not be used for temperature calculations were
included in our Cassini calculations of effective tempera-
ture.
A more precise estimate of the maximum color temper-
ature can be found by using 3 × 3 box averages to fur-
ther reduce the effect of radiation noise. Figure 10 shows
where four boxes that were selected for their high temper-
atures are located on the reduced-noise clear image. Box 1,
in the region just left of center, is 1294 ± 50 K. Boxes 2,
3, and 4 are all found in the large hotspot at the far right
of the image. The color temperatures derived from using
all the data in these boxes are, respectively, 1420 ± 100,
1310 ± 60, and 1390 ± 70 K. We note that these values
are similar to those derived for the high-temperature com-
ponents of two-temperature fits to NIMS data in Davies et
al. (2001).
Fig. 11. Histogram of single pixel color temperatures. Two gaussian curves
There is another way to look at these data that reveals are shown; the first is a fit to the data that cluster around the mode of 1270 K,
something more about the nature of the Pele region. Fig- called “Data fit.” The second is a fit to undetectable (by SSI) or physically
ure 11 is a histogram of color temperatures from individual impossible temperatures, < 700 and > 2500 K.
pixels. What is immediately apparent is that temperatures
drop off rather steeply in both directions away from the The first curve was fit to what was assumed to be noise, i.e.,
modal value of 1270 K. There is a small range of temper- the color temperatures > 2500 K. This fortuitously also pro-
atures for the majority of the Pele region, and then there vided a reasonable fit to the color temperatures < 700 K.
are a few temperature values higher and lower than this. These low temperatures must also be noise, because the SSI
We fit the temperature distribution seen at Pele with two detector (at this exposure and gain setting) is not able to
gaussian curves in an independent attempt to estimate the detect thermal emission from such cool surfaces. The re-
highest color temperatures that are likely to exist at Pele. maining data were fit with another gaussian. This fit closely72 J. Radebaugh et al. / Icarus 169 (2004) 65–79
matches the main peak in the histogram, suggesting that a (Keszthelyi et al., 2001). However, the flux and mass den-
large portion of Pele is close to 1270 K. The second gaussian sities derived from NIMS E16 Pele data are very similar
also predicts that there should be a few valid pixels with to those of the Kupaianaha lava lake during its most active
color temperatures up to ∼ 1500 K. It is intriguing that there phase, with fountaining and crustal disruption (Davies et al.,
is a small population of pixels between 1450 and 1600 K 2001).
that are not fit with the two simple gaussians. This provides
a hint that there may be a distinct population of smaller 3.3. Decrease in emissions with rotation
regions at these higher temperatures. However, we cannot
prove that these higher temperatures are statistically mean- Pele’s rotation eastward during each eclipse reveals in-
ingful. formation about the morphology of the hot lava within the
patera and its surrounding terrain. We found that the ob-
served drop in intensity can be correlated with [cos(emission
3. Interpretation of recent Pele temperature data angle)]1.6, significantly more pronounced than expected for
a flat surface (Fig. 6). In fact, comparison with other data
3.1. Continuous energy output sets suggests that the variation in intensity with emission
angle seems to be wavelength and therefore temperature
The consistently high thermal output that was seen in dependent. Marchis et al. (2001) observed telescopically
all previous observations of Pele continued during both the at 3.8 µm a decrease in energy from Pele with rotation of
Cassini and the Galileo I32 observations. Color temperatures [cos(emission angle)]1.3. From their observations, Marchis
of ∼ 1350 K were seen throughout the 87 hour duration of et al. (2001) concluded that there is topography, surrounding
the Cassini observations, and Galileo observed that > 5 km2 the patera or on its surface, that rotates into position to block
of the Pele region were at about 1270 ± 100 K, with some some of the emitted light from reaching the camera, result-
smaller areas being even hotter. Rough estimates of the to- ing in a greater decrease in intensity than would be seen for
tal thermal output of Pele, based on short-wavelength emis- a flat source.
sion obtained during the Galileo I32 October 2001 observa- The best dayside images we have of Pele are from Voy-
tions, are consistent with the value of ∼ 230 GW, calculated ager (Fig. 2), and they show that the patera is nestled in
using NIMS data for orbits G2, G8, C10, E15, E16, and an east-west oriented graben, at the northern end of a large
C20 (9/96–2/00) (Davies et al., 2001). Such long-lived, high mountain (Danube Planum). This orientation of the major
thermal output is consistent with a persistent, high effusion topographic features does not readily explain why thermal
rate eruption; however, there are no observed lavas erupting emission from Pele would be blocked as Pele rotated east-
from the Pele region onto the nearby plains. This reinforces ward with respect to Cassini. However, the high resolution
the conclusion reached by Davies et al. (2001) and Howell Galileo SSI data suggest that a portion of the incandescent
(1997) of a highly active, but confined, volcanic eruption: an lava in Pele is located at the southwestern margin of the pa-
active lava lake. tera. These areas could be blocked if there is a near-vertical
margin to Pele Patera, as was seen at Chaac and other pa-
3.2. Temporal variability terae (e.g., Radebaugh et al., 2001). However, since these
areas make up only a small fraction of the thermal emission
The high temporal resolution of the Cassini observations seen at high resolution, this mechanism seems inadequate to
of Pele enabled us to see variations in the eruption at visible explain the ISS observations.
and short infrared wavelengths over timescales of minutes We examine two other possibilities: cracks in the lava
(Fig. 7). This aspect of the eruption occurring at Pele has crust and lava fountains. Most cooling lava surfaces develop
never been seen before on Io because of observational lim- near-vertical cracks. When viewed from directly above, the
itations, but it is typical of what happens at terrestrial lava hottest material at the base of the crack can be visible, but
lakes. From field observations of the Kupaianaha, Hawai’i, the effective temperature of the crack will rapidly dimin-
lava lake, Flynn et al. (1993) determined, from spectrora- ish with increasing emission angle (Stansberry, 1999). If this
diometer data between 0.4 and 2.5 µm, that the thermal out- were the dominant process at Pele, then the color tempera-
put from this lava lake varied on a time scale of seconds tures should decrease dramatically with increasing emission
to minutes during phases of active overturning. The Cassini angle. While we see a rapid decrease in total emissions with
data of Pele show variation in activity on similar timescales rotation (Fig. 6), we do not observe a decrease in temperature
at some of the same wavelengths; this observation suggests with rotation (Fig. 7). However, since cracks are essentially
that a similar process to that at Kupaianaha may be taking inevitable on any cooling lava surface, it is likely that some
place at Pele (albeit over a much larger area). of the reduction in intensity as a function of emission angle
Flux density and temporal variation (or lack of variation) should be attributed to cracks (Davies, 1996).
can also be used to constrain eruption style. The flux den- If Pele has a combination of a flat lava surface and lava
sities observed at Pele are very different than those from fountains, then minor surrounding topography would pref-
the ionian “Promethean” and “Pillanian” styles of eruption erentially block the low-lying lava surface. In this case,Observations and temperatures of Io’s Pele Patera 73
as emission angle increases the color temperature would Therefore, we conclude that the eruptions are confined to the
also increase because the thermal emission is progressively patera, or to the large graben that contains the patera. A ma-
dominated by flux from the highly disrupted incandescent jor eruption that is confined within a topographic depression
lava in the fountains. This effect could cancel the emission- will inevitably form a lava lake.
decreasing effect of hot cracks. Furthermore, because lava Burgi et al. (2002) studied the permanently active, 80 m
fountains are typically very time-variable, we would expect diameter, basaltic lava lake at Erta Ale in Ethiopia in Febru-
the temperatures and thermal output to become significantly ary 2001 (Fig. 13). While the entire Erta Ale lava lake would
more erratic as emission angle increased. In addition, since only be slightly larger than a single pixel in the I32 SSI Pele
the effect of incandescent fountains will be less pronounced image, some valuable insights can be gained from the terres-
on longer wavelength data (e.g., Keszthelyi and McEwen, trial analog. Burgi et al. (2002) observed that the lava lake
1997), this model predicts that Pele should more closely exhibited three different states:
mimic a flat radiator at longer wavelengths, as observed.
Thus the variation in color temperatures as a function of (1) complete quiescence with no incandescent activity;
emission angle suggests that lava fountains contribute sig- (2) mild activity with some incandescent cracks; and
nificantly to the thermal flux seen at Pele. Considering that (3) intense activity with incandescent cracks and fountain-
a giant SO2 plume is continually being erupted from the ing.
vicinity of Pele’s incandescent region, we assume that as this
gas exits the magma chamber, it disrupts the lava lake crust The highest temperatures at Erta Ale were observed directly
and creates fountains. The data are insufficient to determine in the fountains, and the cracks and the crust were progres-
if the fountains are more similar to terrestrial strombolian sively cooler. Given the high temperatures seen at Pele over
or hawaiian eruption styles. Based on active terrestrial lava long timescales, we must be observing it always in the sec-
lakes, strombolian-type activity is favored, but in Io’s low ond or third state of activity, with incandescent cracks and/or
gravity and near-vacuum, it is likely that the lava is thrown fountaining, exposing the hot, young lava. The decrease in
further than would be the case on Earth. overall intensity from day364 to day001 in the Cassini ob-
servations (Fig. 6) could be due to fewer fountains or cracks
3.4. Details of the style of the Pele eruption in the Pele region exposing the hot material, a possible re-
sult of a decrease in input to the lava lake. The 200 K jump
It was not possible to acquire high-resolution, dayside ob-
in temperature at the end of day364 could be due to a new
servations in conjunction with the Cassini and Galileo I32
pulse of fountaining.
observations; however, NIMS I32 data are sufficient to de-
Davies et al. (2001) calculated a mass flux into the circu-
termine that there are no expanding warm areas that would
lating Pele lava lake system of 248–341 m3 s−1 . While this
correspond to lava flows extending from Pele (Fig. 12).
flux is orders of magnitude higher than mass fluxes at terres-
trial lava lakes such as Erta Ale (up to 7 m3 s−1 , see Harris
et al., 1999), this estimate is very close to an earlier estimate
by Carr (1986) of 350 m3 s−1 , determined from Voyager
IRIS data, under the assumption that thermal equilibrium
had been reached between cooling lavas and the eruption of
new material to maintain the observed thermal emission. The
consistent volumetric flux between Voyager and Galileo ob-
servations is yet another demonstration of both the longevity
and steadiness of volcanic activity at Pele.
The Galileo I32 October 2001 observation, although it
was at night, gives us our most detailed picture of the dis-
tribution of activity inside the patera. The images do not
reveal a large area of uniformly bright or hot material, rather
there are three distinct regions within the patera that can be
seen in Fig. 8. One is the vast, dark, background material
that is emitting at temperatures too cool for the SSI cam-
era to see (< 700 K) but which is easily seen in the NIMS
high-resolution data (Fig. 12). We believe that this material
Fig. 12. NIMS observation of the Pele region, obtained at a range of is a cooled crust that has formed on top of parts of the lava
∼ 4000 km during the I32 encounter on 16 October 2001, at ∼ 1 km pixel−1 lake (Fig. 13). Such a crust could be broken up by the sec-
resolution. Three distinct areas of thermal emission are seen, aligned along
the rift at the end of Danube Planum. These areas coincide with the
ond type of feature in the patera, the small, bright hotspots.
hottest areas seen in the SSI I32 image (see also Lopes et al., 2004; These hotspots form a remarkably uniform, curving line that
Davies et al., 2002). The positioning of the NIMS data on the Galileo SSI likely marks either the edge of the main patera or some
image is a best estimate. secondary structural feature within the patera. We interpret74 J. Radebaugh et al. / Icarus 169 (2004) 65–79
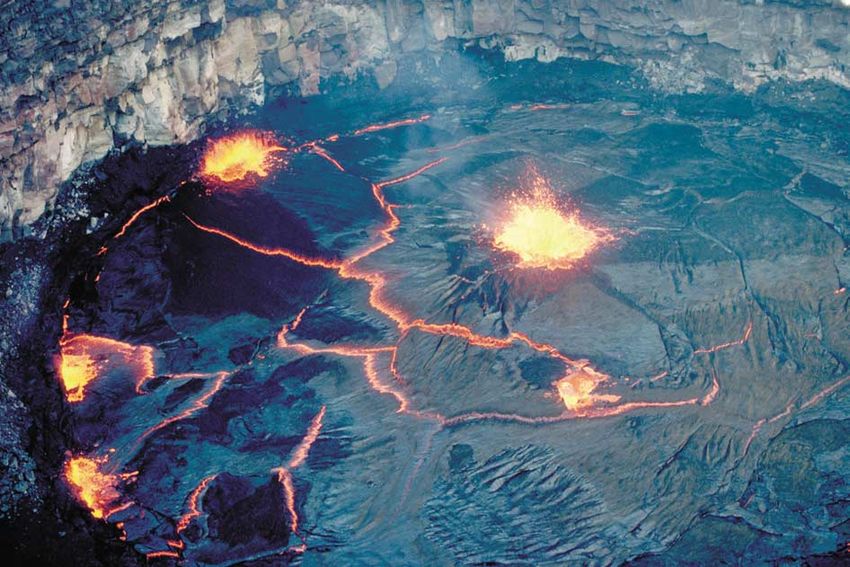
Fig. 13. Erta Ale lava lake, Ethiopia, in the Afar depression of the East African rift zone. Most of the 60 m × 100 m active lava lake is shown in this image
taken by Pierre Vetsch during a 1995 expedition. The lava lake crust is interrupted by cracks that separate the crust into plates, and by lava fountains, that occur
both in the middle and where the crust breaks up at the margins.
these hotspots to be analogous to the disrupted incandescent are not, however, the highest temperatures measured at vol-
margin that forms at the edge of the Erta Ale crater (Fig. 13) canoes on Io (McEwen et al., 1998a, 1998b; Davies et al.,
where the crust breaks up against the walls of the confining 2001). During the Galileo C9 flyby of Io in 1997, an out-
edifice, exposing the hot lava. burst was observed at Pillan Patera, and temperatures were
The third distinct feature of Pele Patera is the large, ex- measured by SSI to be 1500–2600 K, and by a NIMS model
tremely bright, but patchy, central region. This region, and to be 1825 K (McEwen et al., 1998b). Subsequent modeling
a couple of bright hotspots, can also be seen in the lower of the combined NIMS-SSI dataset constrained minimum
resolution, contemporaneous NIMS observation of the Pele lava temperatures at Pillan to be 1870 ± 25 K (Davies et al.,
region (Fig. 12; Davies et al., 2002). In the SSI data there 2001).
are large regions (three or four separate areas of ∼ 2 km2 The observed color temperatures are necessarily lower
each) of saturation and bleeding, for which we cannot ob-
limits on the actual lava temperature. This is because in any
tain temperatures or see the detailed structure (Fig. 9). These
pixel, there is a range of temperatures due to the formation of
are likely the locations of the most spatially extensive expo-
a chilled crust on the liquid lava. The wider this temperature
sures of hot lava, exposed perhaps through convection and
range, the further the color temperature deviates from the
gaseous disruption of the cooling surface. The sources of the
giant, 1500 km diameter plume deposit and the smaller, dark, eruption temperature of the liquid lava. At 61 km pixel−1 ,
pyroclastic apron are probably somewhere in this extremely the Cassini-derived temperatures could easily be hundreds
active, central region, so there must be a continual flux of of degrees lower than the actual eruption temperatures. Even
volatile-laden magma into this location. Therefore, the exis- at 60 m pixel−1 , the SSI single-pixel temperature estimates
tence of the plume is consistent with large-scale fountaining, may be significantly below the actual eruption temperatures.
and possibly convection and overturn. However, if the activity at Pele were extremely vigorous, it
would be plausible that regions thousands of square meters
3.5. Eruption temperatures and composition in area could be almost free of a chilled crust. Nonetheless,
it is likely that the lavas at Pele are significantly hotter than
We observed color temperatures from 1300 ± 40 to 1400 K.
1500 ± 80 K during the eclipse observations of Pele by Precise lava compositions cannot be derived from lava
Cassini, and a median of 1270 K for single pixel values, or a temperatures. First, lavas are very rarely erupted at their
maximum of 1420 ± 100 K from 3 × 3 pixel boxes, for the liquidus temperatures; instead they are typically a lower tem-
Galileo I32 observations. These numbers, especially those perature mixture of liquid, solid, and gas. It is even possible
from the Cassini flyby, are fairly consistent with the tem- for lavas to be heated somewhat above their liquidus tem-
peratures that have been measured previously at Pele from peratures (e.g., Kargel et al., 2003; Keszthelyi et al., 2004).
other Galileo flybys and ground-based observations. They On the Earth, it is most typical for flowing lavas to be severalObservations and temperatures of Io’s Pele Patera 75
tens of degrees below their liquidus. Second, a given liquidus equilibrium with a 1440 K magma match observations of
temperature does not uniquely define a lava composition. the gas species ratios (Zolotov and Fegley, 2000; Spencer et
Despite these caveats, there is a good relationship be- al., 2000b). Thus, the majority of Pele’s plume gases should
tween lava temperature and broad categories of lava com- be dissolved in the magma at depth, to be exsolved at low
position. Basalts most typically have liquidus temperatures pressures upon eruption, rather than being released from
of ∼ 1300–1500 K. A basalt from Makaopuhi, Hawaii, nearby crustal reservoirs of sulfur heated by silicate magma.
with an iron- and magnesium-rich olivine and pyroxene and Davies et al. (2001) determined that the lack of lava flows
calcium-rich plagioclase mineralogy, ranges from a 1235 K surrounding Pele, and strong localization of volcanic activ-
solidus to a 1470 K liquidus, at the upper end of typical
ity, means that the short-chain sulfur molecules in the plume
basaltic eruption temperatures (Wright and Okamura, 1977).
are exsolving from the erupting magma, and do not result
The temperatures measured for the fountains of the basaltic
from mobilization of sulfur compounds on the surface in
Erta Ale lava lake were 1460 K (Burgi et al., 2002). In con-
the manner of the Prometheus plume (Kieffer et al., 2000;
trast, ancient terrestrial ultramafic komatiite lava flows were
composed of a more mantle-like mineralogy of magnesium- Milazzo et al., 2001). Given the high rate of volcanic activity
rich olivine and pyroxene that reached liquidus temperatures over geologic time, it is expected that Io’s interior is depleted
of 1880 K (Williams et al., 2001). It is hypothesized that in volatiles. If Io lost its internal volatiles through volcanic
these lavas were generated by a high degree of partial melt- activity, then currently there must be a mechanism by which
ing of the mantle. volatiles are recycled into the magma. Perhaps this occurs
The derived temperatures presented in this analysis are by extremely rapid burial of volatile-enriched crustal ma-
towards the upper end of the basaltic range. However, given terials that are subsequently supplied to ascending magma
the limitations of deriving lava eruption temperature in the columns.
absence of in situ measurement, the possibility of ultramafic The lack of impact craters and high rate of volcanic ac-
compositions at Pele cannot be ruled out. tivity on Io’s surface attest to Io’s very high resurfacing rate
(Johnson and Soderblom, 1982; Phillips, 2000). This leads
to subsidence in the crust (O’Reilly and Davies, 1981; Carr
4. Implications for Io’s interior et al., 1998; Schenk and Bulmer, 1998; Turtle et al., 2001;
Jaeger et al., 2003), which carries volatiles to great depths
At 30 km × 20 km, Pele is an extremely large volcano- before they become liquid (Keszthelyi et al., 2004). Crustal
tectonic depression by Earth’s standards (Pike and Clow, subsidence also generates regional compressive stresses,
1981). Only the giant silicic calderas approach these dimen- driving mountain formation (Schenk and Bulmer, 1998;
sions, but they are not filled with mafic or ultramafic lava Turtle et al., 2001; Jaeger et al., 2003). Once these compres-
lakes. Thus Pele does not have a comparably sized terres- sive stresses are relieved, the crustal faults associated with
trial analog. Pele is similar to many other Ionian paterae mountain building can be exploited by magmas ascending
in that they appear to also have been filled with lava dur- to the surface (Turtle et al., 2001; Jaeger et al., 2003). This
ing some stage of their evolution (Radebaugh et al., 2002; process may lead to the formation of large, shallow sills,
Lopes et al., 2004). Their great sizes indicate that a substan- and subsequent mobilization of overlying, volatile-rich ma-
tial volume of lava has been generated and delivered from terial would then lead to patera formation (Keszthelyi et al.,
Io’s interior to its surface. However, Pele is a unique fea- 2004). Mountains and paterae are tectonically, and perhaps
ture in its fountaining and constant expulsion of gas that is genetically, linked, as more than 40% of all mountains are
not typically seen at other paterae [an exception could be associated with paterae (Jaeger et al., 2003). Even Pele Pat-
Tvashtar (Milazzo et al., in preparation)]. This demonstrates era is adjacent to Danube Planum, so perhaps Pele’s magmas
that Pele is an open system, that it is an active lava lake at ascended along crustal fractures associated with Danube’s
the top of a magma column with a direct link to a recirculat-
creation (Fig. 14).
ing subsurface magma supply (see Section 1). Other paterae
This recent work adds to our study of paterae on Io
may currently be inactive lava lakes or just be filled with
(Radebaugh et al., 2001), and furthers the understanding of
ponded lavas. These are analyzed differently since the result-
these large, long-lived, volcano-tectonic depressions as sig-
ing mass and energy fluxes are determined by topography
(which we do not know) more than mechanism of supply nificant features for the release of heat from Io’s interior.
(Davies, 2003). There is a strong dichotomy between these extremely hot,
Volatiles set Pele apart from other ionian volcanic centers active paterae that cover only about 2.5% of the surface of
by forming the plume, fueling the lava fountains, expelling Io (Zhang et al., 2002) and the cold, surrounding crust. The
the silicate magmas to be deposited in the dark pyroclastic implications of our results provide confirmation of earlier
deposit surrounding the patera, and being ejected to form indications (e.g., McEwen et al., 1985) that the tremendous
the giant short-chain sulfur ring surrounding Pele. Thermo- heat flow through Io’s lithosphere is extremely spatially dis-
dynamic calculations of the composition of Pele’s plume in crete.76 J. Radebaugh et al. / Icarus 169 (2004) 65–79
Appendix A
A.1. Modeling Cassini color temperatures from two-filter
ratios
Here we detail how we computed color temperatures
from the multi-filter Cassini ISS data. We use color tem-
perature because it generally provides a better temperature
estimate than brightness temperature (which is derived from
single filter images). Color temperature is derived from the
variations of blackbody thermal radiation (i.e., the Planck
function) as a function of wavelength. As such, only the rela-
tive intensities at different wavelengths need to be measured;
therefore, many wavelength independent factors needed to
calculate absolute radiances can be safely ignored.
ISS has two filter wheels in front of each camera, so that
Fig. 14. Hypothetical cross section of the lava lake at Pele Patera. Sil- all observations are taken through two filters. Commonly a
icate layers are interspersed with SO2 deposits (see Carr et al., 1979). clear filter (CL1 or CL2) is selected in one filter wheel while
It has been shown by Johnson et al. (1995) that these deposits can be a filter with a narrower bandpass is selected for the other
trapped between lava flows and buried, without being entirely driven
off. Magma rises through fractures in the crust, possibly along old fault
wheel. Selecting clear filters in both wheels (CL1 and CL2)
zones related to the formation of Danube Planum (Turtle et al., 2001; allows maximum light transmission (Porco et al., 2003). The
McKinnon et al., 2001), to form a high-level magma chamber. Volatiles Pele data have the best signal-to-noise ratio in the clear
rise with the magma and exsolve at the surface through bubble bursts and filter pair (CL1–CL2, transmitting 200–1050 nm), and the
lava fountains, and create the giant plume and mafic pyroclastic eruptions. infrared filter pair (IR4–CL2, transmitting 875–1050 nm),
Aspects of the drawing are not to scale.
so images obtained through these filters were used together
to obtain color temperatures. To determine the response of
5. Conclusions the ISS camera through each filter, we integrated, across the
range of wavelengths to which the detector is sensitive, the
product of
Two exceptional data sets were analyzed to obtain in-
formation about the eruption style and temperature of the
(a) blackbody thermal radiation at specific temperatures,
Pele volcano on Io. We found color temperatures for Pele
(b) the ISS detector’s wavelength-dependent response, and
as high as 1500 ± 80 K from Cassini and 1605 ± 220 K
(c) the filter transmissivity.
or 1420 ± 100 K from Galileo I32. Actual lava tempera-
tures could be hundreds of degrees higher, so compositions
This was only possible because the camera and filter re-
ranging from basaltic to ultramafic should be considered for
sponses were measured to ∼ 1% absolute accuracy at every
Pele’s lavas. The high temperatures, their variation over all
10 nm of wavelength. These pre-flight calibrations have been
timescales, and the decrease in brightness with rotation by
repeatedly tested in-flight, providing us with the highest pos-
a factor of [cos(emission angle)]1.6, along with Pele’s con-
sible level of radiometric precision. Camera responses were
sistent activity as evidenced by the continually replenished
calculated for blackbody temperatures from 600 to 2500 K,
giant ring of volatiles, lend further credence to the model of
at 100 K intervals. A constant emissivity of 1 was used in our
Pele as a vigorously active, fountaining lava lake.
calculations, but the value for emissivity cancels when the
signal from two filters is ratioed during the calculation of
color temperatures. Since there are no known strong spec-
Acknowledgments tral features in this part of the lava’s emission spectrum,
this seems a reasonable assumption. Ratios of integrated
The authors express their thanks to Paul Geissler for blackbody radiation in the clear and the infrared wavelength
his help with Cassini image processing. This material is ranges are plotted against the corresponding blackbody tem-
based upon work supported by the National Aeronautics and peratures (Fig. A.1). This plot is compared with ratios of
Space Administration under Grant Nos. NAG5-10166 and actual emission from Pele observed through the CL1–CL2
NAGW5-3632 issued through the Planetary Geology and and IR4–CL2 filter pairs through interpolation to determine
Geophysics Program, and by the Cassini project. Ashley color temperature.
Davies is supported by Grant No. 344-30-23-09 through the The image resolution is ∼ 61 km pixel−1 for all of these
NASA Planetary Geology and Geophysics program. All im- observations, so the Pele hotspot is much smaller than one
ages were processed at PIRL, the Planetary Image Research pixel. However, the hotspot appears similar to stars in the
Laboratory, unless otherwise stated. same image, in that the emission from Pele is distributedObservations and temperatures of Io’s Pele Patera 77
was 81 pixels. The SE was found using the following rela-
tionship:
SE = σ/n1/2 , (2)
where n is the number of pixels in a sample. This error was
applied to the ratios by the same procedure used by McEwen
et al. (1998b): adding the SE on the clear filter image to
the clear filter DN value, subtracting the infrared filter SE
from the infrared filter DN value, then taking the ratio of
these results to obtain the maximum value within the error
bars for a given ratio. Replacing “adding” with “subtracting”
in each case resulted in obtaining the minimum ratio value.
This method provides > 1σ limits, so we have reasonable
confidence that our results are within our stated uncertain-
ties. These maximum and minimum ratio values have been
converted to the error bars in Fig. 5.
Fig. A.1. Ratios of expected blackbody emission through the clear and IR
filters for the Cassini ISS (solid line) and Galileo SSI (dashed line) cameras.
A.2. Galileo I32 image details and noise-reduction
Notice how similar the responses are for the two cameras, especially at high technique
temperatures.
Each of the 3 clear and 2 infrared Galileo images was
separated by only ∼ 9 seconds, and the exposure times were
across a 9 × 9 pixel box due to the ISS point spread func-
0.046 seconds for the clear and 0.196 seconds for the 1 µm
tion. To determine the total output from Pele in terms of DN
images. Despite these short exposure times, in every image
s−1 , where DN = data number corresponding to the camer-
some pixels were saturated and even bleeding, because of
a’s response to scene intensity, we measured the mean DN
the intense emissions from small portions of Pele. When
values for the 9 × 9 pixel areas containing the Pele hotspot
pixels in the CCD of the camera become over-filled, they
in the clear and infrared images. To remove the contribution
bleed electrons to other pixels along the same column at a
to the signal from background radiation, we obtained mean
ratio of 1 electron to the pixel above to 10 electrons to the
DN background radiation values for two 9 × 9 pixel boxes,
pixel below. Figure 8a shows that many of the bright spots in
one on Io’s disk near the Pele hotspot but away from auro-
the unprocessed clear filter image have dramatic downward
ral glows and other hotspots, and the other in deep space,
spikes caused by bleeding, for example the large spike left of
away from Io’s disk. The average of the two background
center is probably a hotspot just 10 or 12 pixels in diameter.
DN values was subtracted from the mean DN value for the
The large bright region of high emission right of center also
hotspot.
has locations with bleeding. This effect has been seen be-
The overall “signal” for Pele, in DN s−1 , is given by the
fore at Io in other instances of intense thermal emission, for
relationship:
example, the eruption at Tvashtar Catena (Keszthelyi et al.,
signal = (DNmean − DNbg )n/t, (1) 2001). In fact, this process is sufficiently well quantified that
it has been used to derive accurate estimates of the intensity
where DNmean is the mean DN value of the 9 × 9 box con- of the thermal emission (e.g., McEwen et al., 1998b).
taining Pele, DNbg is the mean background value in DN, n is It is important to note that the image is extremely noisy.
number of pixels in the “sample” (92 = 81, in this case), and The high-energy particles close to Jupiter affect the SSI cam-
t is the exposure time in seconds (2 s for all images, except era in two ways. The highest energy “hits” cause distinct
the infrared images in day000, which were 3.2 s). We then bright spots or streaks, while the more numerous lower en-
divided the clear signal by the infrared signal to determine ergy particles raise the background DN level. To decrease
the ratio, which we converted to temperature by interpolating the noise and allow for better analysis of the data, we used
between the ratio values that were calculated at 100 K inter- the fact that we have multiple images through the same
vals, as described earlier. The results are plotted in Fig. 5. filter to identify and remove radiation “hits” using the fol-
Uncertainties in the temperatures are dominated by back- lowing algorithm. First, the three clear filter images were
ground noise. Therefore, we found the standard deviation co-registered so each pixel in each image corresponded to
(σ ) for data in each of the Cassini images by finding σ of the same location on the surface. Then, if a pixel in clear im-
the mean background values. This σ was then used to find age A was within ± 50% of the value of the same pixel in
the standard error (SE), which is a measurement of the typi- clear images B and C, the mean value from images A, B,
cal size of the chance variation of the “sample” value (Stark, and C was placed in a new image. Otherwise, the pixel was
1997). The SE is dependent on the size of the sample, which given a null value in the new image. The resulting image
for our measurements of the average DN of the Pele hotspot has most of the obvious radiation hits removed (Fig. 8b).You can also read


