Infrastructure Strategy 2021-2051 - Tararua District Council
←
→
Page content transcription
If your browser does not render page correctly, please read the page content below
Infrastructure Strategy 2021-2051
Table of Contents
Executive Summary................................................................................................................................. 1
1    Introduction ................................................................................................................................... 1
  1.1     Purpose of the Infrastructure Strategy ................................................................................... 1
  1.2     Scope of the Infrastructure Strategy....................................................................................... 1
  1.3     Relationship to Other Documents .......................................................................................... 3
  1.4     Improvement Plan .................................................................................................................. 5
2    Strategic Context ............................................................................................................................ 6
  2.1     District Overview..................................................................................................................... 6
  2.2     Tararua Strategic Context ....................................................................................................... 7
  2.3     Regional Strategic Context ...................................................................................................... 9
  2.4     National Strategic Context .................................................................................................... 10
3    Our Infrastructure Management Approach ................................................................................. 12
  3.1     Management Principles ........................................................................................................ 12
  3.2     Limitations and Assumptions ................................................................................................ 15
  3.3     Improving our Infrastructure Management Approach ......................................................... 17
4    Our Infrastructure ........................................................................................................................ 18
  4.1     Water Supply......................................................................................................................... 19
  4.2     Wastewater ........................................................................................................................... 20
  4.3     Stormwater ........................................................................................................................... 21
  4.4     Transportation ...................................................................................................................... 22
5    Our Key Infrastructure Challenges ............................................................................................... 23
  5.1     Affordability ............................................................................................................................ 0
  5.2     Infrastructure Age and Condition ........................................................................................... 1
  5.3     District Growth ........................................................................................................................ 2
  5.4     Climate Change and Natural Hazards ..................................................................................... 3
  5.5     Legislative Changes ................................................................................................................. 4
6    Our Approach to Addressing Challenges........................................................................................ 0
7    Infrastructure Investment Forecasts .............................................................................................. 0
  7.1     Most Likely Scenario ............................................................................................................... 0
  7.2     Financial Projections ............................................................................................................... 0
8    Improvement Plan.......................................................................................................................... 0
Appendix A – Drivers for Change ............................................................................................................ 0
  Population Growth Trends ................................................................................................................. 0
  Economic trends ................................................................................................................................. 1
  Climate Change ................................................................................................................................... 2
Appendix B – Data Reliability Ratings ..................................................................................................... 4
Appendix C – Local Government Act 2002 Requirements ...................................................................... 7

                                                                                                                                              Page ii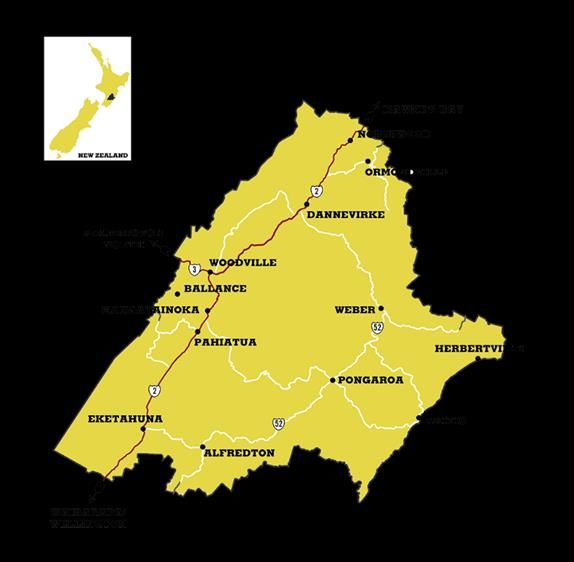
Executive Summary
The Infrastructure Strategy for Tararua District Council (TDC) 2021 – 2051 sets out Council’s strategic
direction for delivery of our key services and the infrastructure assets that support them, over the
next 30 years.
                                               Our Vision
                         Vibrant, connected communities where our people flourish

                                              Our Mission
       We strive to be an innovative, collaborative and connected Council that enables a range of
                                      opportunities for our people.

                                         Our Infrastructure Objectives
   •       To ensure a reliable supply of safe drinking water to our communities.
   •       To ensure efficient and reliable wastewater treatment that meets environmental outcomes.
   •       To ensure efficient stormwater network capacity that protects from flood events.
   •       To ensure public roads and footpaths are safe, reliable and resilient.
   •

                                          Our Big Picture Issues
                                                                      Level of        Level of
                                                                     Uncertainty      Impact
                               Affordability                            Low            High
                      Infrastructure Age & Condition                    Low            High
                              District growth                         Medium          Medium
                    Climate Change & Natural Hazards                  Medium           High
                             Legislative change                       Medium           High

                                          Our Key Principles
                   Lifecycle Management                  Evidenced Based Decision Making
                                                              Proactive Management
                   Demand Management                  Investment in Resilient and Sustainable
                                                                   Infrastructure
                                                        Manage within Existing Boundaries
               Levels of Service Management            Aim to Delivery Existing Service Levels
                     Risk Management                  Improve Asset Criticality Understanding

                                                Our Priorities
       •     Improving asset information and infrastructure asset management maturity
       •     Delivering ongoing maintenance and renewals programmes to meet current service levels
             and with a view to preventing asset consumption
       •     Addressing key level of service deficiencies
       •     Addressing key network performance issues
       •     Improving service delivery resilience
       •     Minor network extensions to enable some growth in our larger townships

                                                                                                 Page 1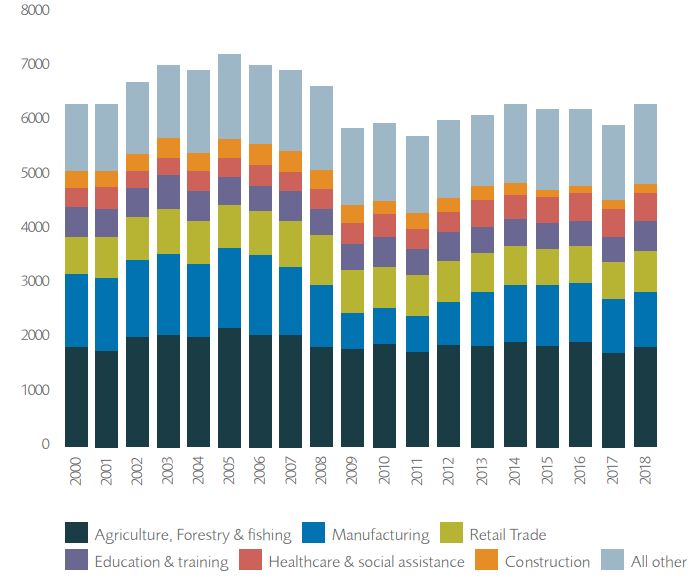
1 Introduction
The Infrastructure Strategy for Tararua District Council (TDC) 2021 – 2051 sets out Council’s strategic
direction for delivery of our key services and the infrastructure assets that support them, over the
next 30 years.

Infrastructure plays an important part in our everyday lives, providing a platform for healthy, thriving
communities and allowing our business community to deliver goods and services to customers.
‘Infrastructure’ refers to physical and organisational structures and facilities (e.g. treatment plants,
water pipes, roads, footpaths etc).

Based on the strategic direction set out in this document Council will develop a schedule of intended
capital works for the next 30 years. Council will prioritise these projects based on the needs of the
community and funding available. The projects identified will be discussed in more detail in the
respective Activity Management Plans.

1.1 Purpose of the Infrastructure Strategy
This infrastructure strategy has been prepared to meet the requirements of section 101B of the Local
Government Act 2002 (LGA). Section 101B requires Councils to prepare an infrastructure strategy that
identifies:

•   Significant infrastructure issues facing Tararua District over the next 30 years
•   The principal options for managing these issues and the implications of these options.

The Act also requires Council to consider and set out in this strategy how, in managing its
infrastructure assets:

•   It will respond to growth or decline in demand for services reliant on those assets;
•   It will manage the renewal or replacement of existing assets over their lifetime;
•   Planned increases or decreases in levels of service will be allowed for;
•   Public health and environmental outcomes will be maintained or improved; and
•   Natural hazard risks will be addressed in terms of infrastructure resilience and financial planning.

Developing this strategy assists Council to look at what is likely to be required over the next 30 years;
balancing the ratepayer’s ability to pay and future ratepayers having well maintained and functioning
infrastructure.

1.2 Scope of the Infrastructure Strategy
1.2.1 Overview of Services

The scope of the Strategy is primarily defined by the Local Government Act. Section 101B of the LGA
requires Council’s infrastructure strategy to cover infrastructure assets used to provide services by or
on behalf of Council in relation to the following activities:

•   Water supply
•   Sewage and the treatment and disposal of sewage (wastewater)
•   Stormwater drainage
•   Roads and footpaths

                                                                                                  Page 1
• Flood protection and control works
• Any other assets that the local authority, in its discretion, wishes to include in the strategy.
This Infrastructure Strategy includes TDC’s infrastructure activities under the portfolio categories
included in Table 1.
Table 1 Infrastructure Portfolios included in our Infrastructure Strategy
Portfolio Activities Key Infrastructure Assets
• Treatment Plant and Facilities
Water • Network (Pipes)
• Other Reticulation Assets
• Treatment Plant and Facilities
3 Waters Wastewater • Network (Pipes)
• Other Reticulation Assets
Stormwater • Network (Pipes)
• Other Reticulation Assets
• 1,187km sealed roads
• 772km unsealed roads
Transportation Roads and footpaths • 525 bridges and large culverts
• 1,842km drains and channels
• 119km footpath
This strategy does not cover:
• State highways, as these are the responsibility of Waka Kotahi NZ Transport Agency
• Flood protection and control assets, as these are the responsibility of the Horizons Regional
Council
In future TDC seeks to include a wider range of infrastructure portfolios to ensure more holistic
planning for sustainable service delivery. This will include:
• Parks, reserves and recreation facilities;
• Solid Waste and landfill facilities; and
• Property and community buildings.
1.2.2 Infrastructure Strategy Structure
The layout of this document and the corresponding LGA sections are shown in Table 2.
Table 2 Infrastructure Strategy Structure
LGA 2002
Section Purpose
(Section 101B)
Executive Summary Provides a summary of the document.
Identifies the purpose, scope and structure of the strategy, 6
1. Introduction
as well as its relationship to other documents.
Provides context through an overview of the district, and 2(a)
2. Strategic Context
the Council.
Page 2LGA 2002
Section Purpose
(Section 101B)
Identifies our objectives for infrastructure and how
infrastructure contributes to our community’s wellbeing.
Summarises our key principles used to manage 3(a) to 3(e), 4(c),
3. Our Infrastructure infrastructure in a way that maximises value for money. 4 (d)
Management Approach Outlines assumptions made as part of the strategic planning
process and the uncertainty related to these.
Provides a summary of the current state of our core 6
4. Our Infrastructure
infrastructure.
5. Key Infrastructure Identifies the internal and external factors influencing the 2(a)
Challenges management of Council’s infrastructure.
Summarises our significant decisions. 2(b), 4(b)
5. Principal Options for
Outlines the principal options for managing key risks and
Addressing Challenges
challenges identified for each activity.
7. Infrastructure Summarises our most likely scenario and expected 4(a)
Investment Forecasts investment.
Outlines the areas we will be focussing on for future
7. Improvement Plan
improvement of the Infrastructure Strategy
1.3 Relationship to Other Documents
This strategy provides a link between several important Council documents such as the District Plan,
Financial Strategy, and Activity Management Plans. Figure 1 shows the relationship between the
Infrastructure Strategy with other Council Plans and Policies interlinking with this document.
Figure 1 Relationship of Infrastructure Strategy to Other Council Plans
Consultation
Long Term Plan Annual Plan Annual Report
Document
Legislation Infrastructure Strategy Financial Strategy
National Strategies &
Policies
Activity Management
Regional Strategies & Plans
Plans
Council Strategies &
Policies Service Delivery
District Plan
Performance Quarterly
Bylaws Monitoring Report
Page 31.3.1 Planning Horizons
Our planning has several different time horizons as shown in Figure 2. Table 3 outlines the intent of
key Council Plans and their level of accuracy.
Figure 2 Council Planning Horizons
SHORT TERM BUDGETING PROGRAMMING INVESTMENT PLANNING FOR FUTURE NEED
LONG TERM PLAN INFRASTRUCTURE STRATEGY
ANNUAL PLANNING
ACTIVITY MANAGEMENT PLANS
1 YEAR HORIZON 10 YEAR HORIZON 30 YEAR HORIZON
Committed Programmed Forecast
Table 3 Planning Intent and Accuracy
Planning Level of
Council Plans Intent
Horizon Accuracy
Forecasting Future Need Moderate to
The Infrastructure Strategy guides policy decisions, goal Lower
2021 – 2051
setting and long-term capital investment. It helps (depending on
30+ years Infrastructure
establish the sustainable level of funding required to assumptions
Strategy
deliver service and accommodate future demand. and data
We update our Infrastructure Strategy every 3 years. accuracy)
Programming Investment
The key documents underpinning the Infrastructure
Strategy are the Transportation Activity Management
Plan and 3-Waters Activity Management Plan. These
plans combine management, financial, engineering and
technical practices to ensure that the level of service
required by customers is provided effectively and
efficiently. This requires taking a whole-of-life approach
to asset investment planning. Moderate to
Activity
10-30+ Areas of specific focus for the updates included; High
Management
years ensuring relevant levels of service and service (depending on
Plans
performance measures, assessing performance, data accuracy)
identifying new key risks and significant issues. This
work has led to the identification of the current and
future asset requirements and the financial forecast for
capital (renewals and new capital projects) and
operational expenditure for each asset group.
These documents should be referred to if tactical and/or
operational detail related to this strategy and the
respective assets is sought.
Page 4Planning Level of
Council Plans Intent
Horizon Accuracy
Our Activity Management Planning is updated on an
ongoing basis, but plans are formally adopted by Council
every three years.
Committing Budgets
These plans allow for consultation with the community
around the services we provide. They are made publicly Moderate to
available once finalised. High
2021 – 2031 Areas of specific focus for the updates include; ensuring (depending on
10+ years
Long Term Plan relevant levels of service and sustainable cost of service. data and cost
The Plan outlines how our services are performing and estimate
investment in capital projects and operational required accuracy)
to provide our services over the next 10 years.
We update our Long Term Plan every 3 years.
This detailed level planning prioritises the capital
projects and operating budget for the next 1-3 years.
High
Where possible capital project prioritisation is
(depending on
1-3 years Annual Plan completed using a business case and optioneering
cost estimate
process. This is particularly the case for Transportation,
accuracy)
where investment planning must meet Waka Kotahi
investment decision making requirements.
1.4 Improvement Plan
The development of this Infrastructure Strategy is based on the existing levels of service, the best
available current information and the knowledge of Council staff. It provides our best estimate of
expected changes over the term of the Strategy, at this point in time.
Opportunities for Improvement - throughout this document we have identified specific
areas for improvement in the development of future versions of this Infrastructure
Strategy. These are identified with this symbol.
Improvement initiatives are summarised in our Improvement Plan in Section 8.
Page 52 Strategic Context
2.1 District Overview
2.1.1 Geographic Context
The Tararua district is located within
the Manawatu-Whanganui region,
situated on the southeast coast of the
North Island, bound to the west by
the Ruahine and Tararua Ranges. It
covers an area of 4,360km²
The four main towns of Dannevirke,
Woodville, Pahiatua, and Eketahuna
are service centres for the
agricultural sector. In addition, they
service other categories of economic
activity, such as industry and tourism
(mostly domestic from passing
traffic).
2.1.2 Our Climate
We expect that our district will be affected by long-term climate change, as per predictions advised
by central government agencies. While the long-term trend of rising temperatures and more frequent
intense weather events is reasonably certain, the short to medium term impacts are less certain. The
recent 2020 drought is an example of this, as are recent flooding events in Napier and Plimmerton.
Severe weather events cause significant damage to infrastructure and service disruption, placing
additional pressure on resources and funding.
2.1.3 Our People
Tararua District has a resident population of approximately 18,650.
Council has determined that the Most Likely Scenario in terms of population and household change is
a medium growth scenario, based on forecasts prepared for the Long Term Plan. Based on the
medium scenario, a plateau in growth would be seen with a population of 20,650 in 2038 (8,300
households), after which the population would begin to gradually decline. Growth is likely to be mostly
centred around all main urban areas. The rural area is expected to have minor growth driven by
lifestyle subdivision, offset by larger farm sizes and conversions to forestry.
Increasing population reflects people coming into the district seeking affordable housing and lifestyle
options. The pandemic has strengthened this trend with increasing numbers of people returning to
their provincial roots. An increase in overall demand is expected over the next 10-30 years.
Like many parts of New Zealand, our population is ageing. Our population over the age of 65 is
expected to increase over the next 30 years. This means that an increasing proportion of our residents
will be reliant on fixed incomes and will be less able to absorb increased costs of service.
Page 6More details on population changes that may impact demand for services is included in Appendix A.
2.1.4 Our Economy
The primary industry in Tararua is agriculture with over a third of the district’s workers employed in
this sector, and most businesses. Tararua has a wealth of resources, the greatest being the farmland
that grows top quality stock, producing wool, meat, and dairy products of a particularly high standard.
A small number of larger industries include meat processing, dairy processing and steel fabrication,
and smaller scale industries including clothing and confectionary.
Agriculture, retail trade, manufacturing, farm servicing, health and education services make up the
bulk of employment. Cottage industries and home occupations are common. Tourism currently
makes a small contribution to the district’s economy.
More details on economic changes that may impact demand for services is included in Appendix A.
2.2 Tararua Strategic Context
Tararua District Council is the local territorial authority for the District. Several different borough
councils established the assets of Council prior to the merger and establishment of Tararua District
Council in 1989.
The delivery of services such as transportation, water supply, wastewater and stormwater is a core
function of Council, with provision and management of associated infrastructure accounting for the
largest portion of its annual operating and capital expenditure. These services and associated
infrastructure provided by the Council protects public health by providing clean drinking water and
treating and disposing of wastewater appropriately. It enables goods and people to move around the
district, contributing to the economy and facilitating social interaction. It ensures that homes and
businesses are protected from the effects of flooding, and it is at the heart of the recovery following
a natural disaster.
2.2.1 Vision and Objectives
The district vision for the 2021–2031 Long Term Plan is:
Vibrant, connected communities where our land and waters are
nurtured and our people flourish.
Mā te whenua, mā te waiora tātou e ora ai hei hapori ngangahau hei
hapori honohono hoki.
Council’s mission is:
Page 7In partnership with tangata whenua and our communities, we will
innovate and collaborate to enable a range of opportunities for the
Tararua District.
Mā te mahi tahi mātou o kaunihera ki ngā tangata whenua, ka auaha
aheinga mō tātou katoa o te rohe o Tamaki-nuia-Rua.
Council have four overarching strategic objectives; Delivering Resilient Infrastructure, Prudent
Financial Management, Growing Strong Communities, and Building a Vibrant Economy. Priorities for
the Delivering Resilient Infrastructure objective, where they relate to core infrastructure covered by
this document, are:
• To ensure a reliable supply of safe drinking water to our communities.
• To ensure efficient and reliable wastewater treatment that meets environmental outcomes.
• To ensure efficient stormwater network capacity that protects from flood events.
• To ensure public roads and footpaths are safe, reliable and resilient.
2.2.2 Community Wellbeing
This Long Term Plan has seen the reintroduction of the four wellbeing’s. Whilst much of Council’s
focus and investment will remain on managing and delivering core infrastructure services effectively
and efficiently, increased emphasis will be placed on the wellbeing outcomes resulting from the
services Council provides. Council’s Wellbeing Outcomes are shown below.
Environmental Economic
Social Wellbeing Cultural Wellbeing
Wellbeing Wellbeing
To enable our people Our people respect the
to achieve the goals beliefs, values, histories A vibrant economy that
Our natural
that are important to and languages of our enables a range of
environment is healthy,
them communities opportunities for our
resilient and cared for
people
Four Wellbeings
2.2.3 Strategic Alignment
The quality of life in the Tararua District is reliant on infrastructure. The impact of infrastructure failure
and associated loss of service can significantly impact each of the four wellbeings. One of Council’s
largest challenges is investing in the resilience of its infrastructure while still maintaining affordability,
to ensure community wellbeing is enhanced.
Table 4 summarises our core infrastructure related services, the associated assets, the respective
strategic objectives, and the contribution to community wellbeing.
Page 8Table 4 Linking Infrastructure Services to Community Wellbeing
The infrastructure
The service we Delivering Resilient Our contribution to
assets we have to
provide Infrastructure priorities wellbeing
provide the service
Water Source, treatment To ensure a reliable supply of
plants, reservoirs,
reticulation
safe drinking water to our
communities.
● ● ●●
Wastewater Reticulation, treatment To ensure efficient and reliable
plants wastewater treatment that
meets environmental outcomes.
● ●●●
Stormwater Open drains, To ensure efficient stormwater
underground pipes network capacity that protects
from flood events
● ● ●●
Transportation Roads, footpaths, To ensure public roads and
bridges, drainage, signs, footpaths are safe, reliable and
rails, markings resilient. ●●●●
Key: ● = high contribution, ● = medium contribution, ● = low contribution
● = social wellbeing, ● = environmental wellbeing, ● = cultural wellbeing, ● = economic wellbeing
Strategic Direction – Over the next 1-3 years, Council will be reviewing its strategic
planning and setting key strategic goals that will provide direction for future long term
planning. Future versions of the Infrastructure Strategy will be driven by this revised
strategic direction.
2.3 Regional Strategic Context
Tararua District Council is part of Horizons Region which extends over 22,200km2 - from Ruapehu in
the north and Horowhenua in the south, to Whanganui in the west and Tararua in the east. Horizons
provide services for Tararua, Manawatu, Horowhenua, Rangitikei, Wanganui and Ruapehu districts,
Palmerston North City, and part of the Waitomo, Taupo and Stratford districts. There are several
regional initiatives which impact on 3 waters activities.
2.3.1 Water Supply Review
The past contamination of Havelock North’s public water supply has highlighted several areas for
improvement in the management of public water supplies throughout New Zealand. Horizons have
partnered with district councils and drinking water assessors at MidCentral Health (Pattle Delamore
Partners Ltd) to complete a review of water supplies in the Horizons Region to prioritise actions to
reduce the risk of contamination.
2.3.2 The One Plan
The One Plan is the resource management planning document for the Horizons Region. The One Plan
defines how the natural and physical resources of the Region, including fresh water, air, productive
land and natural ecosystems, will be cared for and managed by the Regional Council in partnership
with Territorial Authorities and the community. This document details the overall policies for
managing the environment in the region. It includes policies that relate directly to stormwater,
Page 9waterways, and land use in general. In this respect the plan manages the effects that water runoff
has on waterways and surrounding land. Horizons Regional Council hold considerable information on
river flood levels and land subject to flooding. This data can be used in the flood maps contained in
the Tararua District Council District Plan to control safe floor levels of new construction.
2.3.3 Collaboration projects
Horizons’ freshwater work is vital to aquatic indigenous biodiversity, which is in a state of degradation.
This degradation includes greatly reduced native fish populations, poor habitat (loss of riparian
margins in most areas, and the introduction of exotic fish and pest plants), and many barriers between
coastal wetlands, streams and headwaters. Horizons has several work programmes dedicated to
sustainable land management, improving water quality, and protecting habitats, such as the
Sustainable Land Use Initiative (SLUI). Horizons works collaboratively with iwi, community groups,
councils, industry partners, and landowners and is an active founding member of the Manawatū River
Leaders' Accord and the Lake Horowhenua Accord.
2.4 National Strategic Context
2.4.1 National Changes to 3Waters
In the past three years central and local government has focused on improving the delivery of 3 waters
services to the community in a desire to improve freshwater, increase resilience to climate change
and natural hazards, and enhance community wellbeing. However further investment into 3 waters
infrastructure is needed to overcome persistent affordability issues faced by parts of the country.
Taumata Arowai is being established as the new water services regulator to enforce new drinking
water regulatory frameworks and oversee the wastewater and stormwater networks.
The Government is intending on implementing a public multi-regional model for the delivery of water
services. This provides the benefits of scales for communities and reflect neighbouring catchments
and communities of interest. There is a preference that entities will be in shared ownership of local
authorities. Design of the proposed new arrangements will be informed by discussion with the local
government sector. This creates some uncertainty around future planning for this Infrastructure
Strategy.
In the short term, the Government has provided post Covid-19 stimulus to maintain, improve water
infrastructure and support a three-year programme of reform of local government water service
delivery arrangements.
The funding currently secured is $5.02 million of water projects for Tararua District and focuses on
renewals, resilience and planning for future growth, job creation, supporting local and keeping as
much money flowing into our communities as we can. There is also a possibility of more government
funding.
2.4.2 Transportation Focuses
Central Government is responsible for overseeing all Transportation Activities across New Zealand.
The Land Transport Management Act 2003 (LTMA), Transport Outcomes Framework and the
Government Policy Statement (GPS) on Land Transport Funding provide strategic direction. The LTMA
states that Local Authorities across New Zealand have statutory obligations to maintain a Roading
network within their respective districts and in support of the GPS. The One Network Road
Page 10Classification (ONRC) provides a consistent approach to classifying and measuring the desired
outcomes.
2.4.3 Ministry of Transport – Transport Outcomes Framework
The Transport Outcomes Framework establishes the groundwork for a strategic approach to
Transportation for New Zealand, by identifying what the Government is aiming to achieve through the
transport system. It defines mode neutrality as a guiding principle for transport planning, investing
and regulating.
The framework itself is designed to highlight the intention behind the transport system rather than
specify how. In the transportation context, Waka Kotahi NZ Transport Agency (NZTA) use this
framework along with the Government Policy Statement (GPS) on Land Transport which they use to
guide Road Controlling Authorities towards a consistent strategic approach.
2.4.4 Government Policy Statement
The Government Policy Statement on Land Transport 2021 sets out the Government’s strategic
direction for the land transport system over the next 10 years and is updated every 3 years. NZTA
uses the GPS to provide guidance on how the National Land Transport Fund (NLTF) is invested and
how the Regional Land Transport Plans (RLTPs) and the National Land Transport Plan (NLTP) are
assessed and activities prioritised. The strategic priorities laid out in the upcoming GPS are;
• Safety
• Better travel options
• Improving freight connections
• Climate change
Page 113 Our Infrastructure Management Approach
Planning and delivering infrastructure is a balance between providing for growth in demand and the
levels of service the community desires, and affordability for ratepayers. Most infrastructure assets
have long lives that extent well beyond the 30 years of this strategy, and once in place, these assets
incur operating, maintenance and renewal costs that communities are committed to fund for many
years to come. Planning for future infrastructure needs to be considered with a long-term view in
mind.
3.1 Management Principles
Investment in core infrastructure is, by far, the most significant of all Council’s activities. The cost of
developing, maintaining and renewing our assets needs to be affordable for current and future
ratepayers. Our approach to ensuring that we manage existing infrastructure assets efficiently and
effectively and invest in new infrastructure assets wisely will be based on the following management
principals.
3.1.1 Lifecycle Management
Initial asset renewal/replacement strategies are largely age based; depending on when the existing
asset was constructed and what its expected useful life is. This is especially relevant for underground
water reticulation infrastructure, where minimal condition information exists due to the cost and
complexity to collect.
Programmes will then be developed from this based on condition and performance. Deficiencies are
identified by the monitoring of asset condition, reliability, capacity and efficiency during inspections
and operational activity. Indicators of the key deficiencies which inform the renewals programmes
include:
• Condition; i.e. the asset has or is about to fail
• Reliability; i.e. repeated asset failure
• Economics; i.e. annual cost of repairs and/or the annual operating cost exceeds (or is predicted to
exceed) the annualised cost of its renewal
• Performance; i.e. the asset is no longer capable of delivering expected service levels
• Risk; i.e. the consequence and probability of failure justifies proactive action.
Efficiency benefits will also be assessed, i.e. combining asset renewal with other construction activities
to reduce cost and disruption to customers (e.g. replacing reticulation infrastructure in conjunction
with a road rehabilitation project).
Predictive pavement deterioration modelling is utilised for roads, enabling network level assessment
and prioritisation. Similar tools are being assessed for reticulation infrastructure.
When renewing assets, Council will take the opportunity to achieve increased environmental
standards, public health and provide greater asset resilience, where this can be achieved as an
augmentation to the asset renewal programme.
Page 12Key Principles
Evidence Based Decision Making
In recent years Council has invested in improving the accuracy of data that drives
infrastructure investment decision making. This provides Council with increased
confidence that these assets can continue to deliver the agreed levels of service for the
least lifecycle cost without increasing the risk of failure.
Whilst a substantial amount of work has been completed, there are still significant gaps in the asset
data required to have a high degree of confidence. This is especially relevant to water reticulation
assets. Improvements will continue to be made in this area.
Asset Information Improvements – Increased investment and effort is required to
expedite improvements to data quality and confidence, enabling improved evidence
based investment decision to be made. Focus in the immediate future will be towards
improving asset inventory, criticality, condition and performance information.
Proactive Management
Whilst historic asset investment was largely reactive (i.e. waiting for customer
complaints to arrive before intervening), Council is, over time, transitioning to a far
more planned and proactive approach. This includes ongoing investment in preventive
maintenance and a focus on root cause analysis; understanding and treating the cause
of issues rather than just the symptoms.
Over time, we expect this will extend the expected useful lives of many assets and improve Council’s
ability to deliver agreed levels of service for the least whole-of-life cost without increasing the risk of
failure.
3.1.2 Demand Management
Council’s approach to managing demand has historically been relatively reactive and ad-hoc. This is
largely due to the past nature of changes in demand, where population ‘growth’ has been negative or
static. Budget contingencies have been developed to accommodate this, where service extension is
required to meet expected service levels.
District Growth Strategy – With predicted growth now expected to have significant
impacts on our infrastructure and expected levels of service, a District Growth
Management Strategy is currently being developed. This will enable a holistic
assessment of core infrastructure and identify key infrastructure deficiencies,
supporting effective prioritisation of investment.
Until this has been completed, Council’s focus is to invest in resilient and sustainable infrastructure,
while managing with existing network boundaries.
Key Principles
Investment in Resilient and Sustainable Infrastructure
We know many of our asset networks are vulnerable to external impacts, especially
related to environmental and legislative changes. We will target investment to increase
the resilience and sustainability of our infrastructure, ensuring we have future proof
but still fit-for-purpose assets that met both current and predicted demands.
Page 13Manage within Existing Boundaries
We need to ensure that our water, wastewater and stormwater networks remain
affordable and sustainable for current and future generations. To ensure the continued
affordability of our infrastructure networks, our approach to the growth pressure is:
• Improve capacity and performance modelling of our 3Waters networks to ensure that our assets
are not placed under too much stress during peak periods or in years where our climatic conditions
place constraints on our ability to meet demand for services
• To encourage utilisation of existing infrastructure where existing capacity allows.
• Allow connections inside our current boundaries as of right.
• Ensure existing networks meet legislative requirements.
• Not provide for new reticulation beyond the urban areas until the reticulation inside the
boundaries has been upgraded and the District Plan has confirmed the new service areas, unless
paid for by developers.
3.1.3 Level of Service Management
Increasing service levels typically increases the cost of operating and maintaining assets. Assumptions
are that while the number of households in the Tararua District is expected to increase over the next
30 years, while levels of service will remain the same.
Key Principles
Aim to deliver existing service levels
On a network basis, Council has not identified any significant gaps between the levels
of service people expect from core infrastructure and the levels of service Council is
able to deliver, now and over the next thirty years. This does assume continued
external funding for transportation, at least at the current levels, to continue for the long term. Where
levels of service gaps exist currently, projects and changes in management techniques have been
identified or are underway to address these, as detailed in the Activity Management Plans.
3.1.4 Risk Management
Risk Management continues to be an area of learning and growth for Council. We are focussed on
developing a consistent organisational approach to risk management. The Draft Risk Management
Framework was developed in November 2020 and is expected to be adopted in early 2021.
The Risk Management Framework follows the principles of AS/NZS ISO31000:2009 and uses a matrix
with five step risk likelihood and severity scale that reflects the relatively simple asset base that exists
in the Tararua District.
Key Principles
Asset criticality
Understanding our critical assets ensures that we can prioritise investment in the areas
that matter most.
Asset Criticality Framework – Following on from the Risk Management Framework
development, we will develop an asset criticality framework that can be consistently
applied across all activities. A “criticality rating” will then be assigned to all assets.
Page 14Formal criticality rating system to be developed by end 2023 and criticality list to be
reviewed and updated by end 2023.
3.2 Limitations and Assumptions
In developing this Infrastructure Strategy, there are a number of things that Council do not or cannot
know. This has flow on effects on the identification of issues and options for dealing with issues and
how Council can best respond.
Key assumptions and areas of uncertainty made as part of this planning process and their likely
consequences or impact are included below.
Table 5 Key Assumptions in the Infrastructure Strategy
Uncertainty
Type Assumption Impact Risk Level
Level
That asset replacement costs and
useful lives are as stated in (or close If assets deteriorate earlier
to) the Asset Valuation. Valuation or later than estimated, if
Low to
figures are based on good industry will impact our funding Moderate
Moderate
practice and are peer reviewed by levels and, potentially,
an external expert in infrastructure depreciation reserves.
asset valuation.
That the 69% Financial Assistance Changes to rates or project
Rate (FAR) from Waka Kotahi NZ eligibility criteria would
Transport Agency through the have a large impact on the
National Land Transport Fund will net cost of transport
remain for the foreseeable future, projects for the Council. Low to
Moderate
for investment in transportation This would be particularly Moderate
infrastructure. significant as there is a
large amount of forecast
expenditure on transport
over the 30-year period.
Lifecycle
Health and Environment subsidies
There is no risk to the LTP
will not be available for wastewater
forecasts as any variation
and water network improvement
to this assumption will be
projects on an ongoing basis.
financially positive to
Council is not expecting any further
Council. Any further
government funding for water and
subsidies will reduce the
wastewater in the LTP on top of the
rate requirements and
3 waters reform funding already
debt levels.
provided.
That current assumptions of asset
age are accurate and depreciation
reserves will be adequate to fund
required asset renewals. Poor asset information
Improvements to asset impedes decision quality
Moderate High
management processes and for maintenance, renewals
planning will improve our ability to and future planning
predict, prioritise and plan the asset
investment required to intervene at
the right time.
Page 15Uncertainty
Type Assumption Impact Risk Level
Level
That current assumptions of asset
condition are accurate and forecast
budgets will be adequate to fund
required asset renewals. Poor asset information
Improvements to asset impedes decision quality
Moderate High
management processes and for maintenance, renewals
planning will improve our ability to and future planning
predict, prioritise and plan the asset
investment required to intervene at
the right time.
That district growth aligns with
current projections and that the If growth significantly
District Growth Management increases for that
Strategy, currently being projected, it is likely that
developed, will identify key increased funding will be Moderate Moderate
infrastructure deficiencies and required to fund
enable prioritisation and delivery of associated infrastructure
infrastructure growth/improvement development.
within forecast capital budgets.
The transportation programme Forestry harvests that
an funding arrangements grow significantly over the
Demand
adequately addresses the 10 years cause major
forestry harvesting impact on damage to some arterial Moderate Moderate
our road network. roads resulting in costly
renewals and increasing
operational costs.
That forecast budgets will be
sufficient to deliver expected Demand on regional
service levels despite the supply suppliers could increase to
chain impacts as a result of a point where costs to
increased infrastructure investment complete work Moderate Moderate
in the region, or there is some level significantly increases or
of flexibility with regards to project expected timeframes
timeframes to ensure value for cannot be achieved.
money.
That the District will be affected by Natural disasters cannot be
long-term climate change in parallel foreseen and can have a
with predicted changes as advised significant impact on
by government agencies, but that infrastructure and financial
there will not be any natural requirements for remedial
Moderate High
disasters resulting in widespread works. While the Council is
Levels of Service
damage or remedial work to the insured for natural
Council’s in00frastructure. hazards, this would not
fully cover the costs of a
highly-damaging event.
That any resource consents due for
If there was a requirement
renewal during the 10-year period
for significantly higher
will be renewed accordingly as
standards associated with High High
budgeted. Resource consents
consent, this will likely
issued for new / upgraded
result in the need for
infrastructure will not contain
Page 16Uncertainty
Type Assumption Impact Risk Level
Level
significantly different conditions / additional unplanned
standards to those anticipated in expenditure.
the project.
That Council will retain the current
boundaries and will continue to
Moderate High
provide water, wastewater and
stormwater services.
3.3 Improving our Infrastructure Management Approach
3.3.1 Reliability of Information
Council has developed this Infrastructure Strategy based on information with varying levels of
reliability across the activities covered in this strategy. The reliability of data and information used as
inputs into this Strategy varies.
Part of the Strategy is to improve decision-making by addressing gaps in asset data. While we have
made improvements to our data quality and completeness for roads in recent years, Council is now
targeting further collection, validation and analysis of the data for other activities. This will fill the gaps
to inform the 2024 -2054 strategy, by providing primary evidence for infrastructure decisions.
We have rated the confidence of our data for each activity in our Infrastructure Summary, using the
ratings included in Appendix B. More information on data reliability is available in the AMPs for the
respective activities.
3.3.2 People and Organisation
We recognise that in order to make good infrastructure decisions we need the right people capacity
and capability in place.
Roles & Responsibilities – Resourcing is one of the specific challenges we face,
particularly to ensure that the current day-to-day activity focus is paired with the
necessary long-term focus. A review of key roles and responsibilities for Infrastructure
Management will be completed to ensure Council has the right levels of resourcing and
capability.
3.3.3 Asset Management Maturity
Council wants to ensure the levels of service and cost of service is appropriate for our community. So
it is important that these outputs are being delivered in an economic and sustainable manner. To do
this requires a more in-depth understanding of the decisions, information and processes that we use
for the lifecycle management of our assets.
We need to develop our Asset Management capabilities to appropriate levels of maturity which are
fit for purpose to meet the current and future needs of its stakeholders.
Page 17Council has not formally adopted a target practice level for Asset Management, however, we seek to
meet a ‘Core’ level of Asset Management practice that meets custodial responsibilities identified in
the International Infrastructure Management Manual (IIMM) to carry out the following activities:
• Record and report on the state of all assets to the community;
• Meet current statutory reporting requirements;
• Ensure community safety; and
• Provide management information to guide decisions by Council on the impact of decisions.
Asset Management Maturity – We have not formally assessed the maturity of our
infrastructure management practices to date. We will be completing a full asset
management maturity assessment aligned with IIMM and ISO55000, the internal
standard for Asset Management to ensure we are becoming more competent and
effective in ‘Core’ level asset management as depicted below.
4 Our Infrastructure
This section provides a summary ‘state of infrastructure’ for the four activities covered by this plan.
Page 184.1 Water Supply
The water supply activity involves the management, operation and maintenance of the district’s water
Service
supply network. Council is responsible for providing safe, clean drinking water to domestic,
commercial, and industrial customers connected to its water supply networks as a matter of public
health.
Aim
To ensure a reliable supply of safe drinking water to our communities.
Maintenance of Water demand is
Issues relating to Customers are
Goals
Water provided is the reticulation managed
water supplies are satisfied with
safe to drink network is effectively
responded to supplied water
effective.
Seven schemes: Replacement value: Age Based Condition:
• Dannevirke ~$80M 100%
• Pahiatua 75%
• Woodville 50%
• Eketahuna 25%
• Norsewood 0%
• Akitio Treatment Plant and Treatment Network Other
Facilities Plant and (Pipes) Reticulation
• Pongaroa Network and Other Assets Facilities Assets
Very Good Good Fair Poor Very Poor
Service level performance: Customer requests: Customer satisfaction:
20 1000 100%
Number of measures
800
15 75%
600
10 400 50%
5 200 25%
0
0 0%
2014
2010
2011
2012
2013
2015
2016
2017
2018
2019
2020
2017/18 2018/19 2019/20 2016 2017 2018 2019 2020
Achieved Not Achieved Overall Water
Data Confidence Inventory Condition Age
Treatment Plant and Facilities B – Reliable B – Reliable C – Uncertain
Network and Other Assets B – Reliable C – Uncertain C – Uncertain
Asset Performance:
• Currently unable to meet the NZ Drinking Water Standards for all of our schemes.
• High unaccounted for water (UFW) has been reported. Minimum night flows in some locations are
reported to be as high as 50% of daytime demand which is considered high.
• Water restrictions are being implemented due to increased water consumption and low source flows.
Recent achievements:
• Three treatment plants upgraded (Pahiatua, Pongaroa, and Akitio).
• Installation of backwashing system at Woodville Treatment Plant
• Impounded storage added at Dannevirke 140ML and Woodville 90ML
• Reservoir Storage added at Pahiatua 8ML to reduce periods of water restrictions
• Protocols for managing water restrictions developed to aid community engagement and lessen the
impact of water restrictions
• >100 smart meters installed to trial new technology and gain a better understanding of water
consumption
• Identified connections without backflow preventors
Page 194.2 Wastewater
Service
The wastewater activity includes four wastewater schemes serving our urban communities. Council
collects, treats and disposes treated wastewater from domestic, commercial and industrial premises.
Aim
To ensure efficient and reliable wastewater treatment that meets agreed environmental outcomes.
Risks to public health
Issues relating to the
Goals
The wastewater and our natural Customers are satisfied
wastewater system
system is adequate environment are with wastewater systems
are responded to
minimised
Seven schemes: Replacement value: Age Based Condition:
• Dannevirke ~$60M 100%
• Pahiatua 75%
• Woodville 50%
• Eketahuna 25%
• Norsewood 0%
• Ormondville Treatment Plant and Treatment Network Other
Facilities Plant and (Pipes) Reticulation
• Pongaroa Network and Other Assets Facilities Assets
Very Good Good Fair Poor Very Poor
Service level performance: Customer requests: Customer satisfaction:
120 100%
10
100
Number of measures
80 75%
60 50%
5
40
20 25%
0
0 0%
2014
2010
2011
2012
2013
2015
2016
2017
2018
2019
2020
2017/18 2018/19 2019/20 2016 2017 2018 2019 2020
Achieved Not Achieved Overall Wastewater
Data Confidence Inventory Condition Age
Treatment Plant and Facilities B – Reliable B – Reliable B – Reliable
Network and Other Assets B – Reliable B – Reliable C – Uncertain
Asset Performance:
• The system does not have enough capacity to convey wastewater during wet weather, which is
compounded by high rates of inflow and infiltration.
• Wastewater discharge consents have either lapsed or are due to expire by 2024. Discharges from the
existing wastewater plants do not comply with modern standards.
• Wastewater is currently discharged to watercourses, which does not align with Maori cultural values.
Recent achievements:
• Membranes replaced at Dannevirke Wastewater Treatment Plant
• Pilot DAF Plant installed at Pahiatua Wastewater Treatment Plant
• 100% of accessible sewer network (78% of total network) has been CCTV inspected in the main towns
• Sewer main replacement in Pahiatua Main Street
• Good relationship maintained with Horizons Regional Council; no enforcement notices issued
Page 204.3 Stormwater
Stormwater is the runoff of rainwater which requires management and disposal using various
Service
drainage systems. Council has stormwater reticulation with associated manholes and sumps, as well
as open stormwater channels drains.
To ensure efficient stormwater network capacity that protects built assets and people from flood
Aim
events.
Risks to public health
Issues relating to the Customers are satisfied
Goals
The stormwater and our natural
stormwater system are with stormwater
system is adequate environment are
responded to systems
minimised
Four schemes: Replacement value: Age Based Condition:
• Dannevirke ~$24M 100%
• Pahiatua 75%
• Woodville 50%
• Eketahuna 25%
0%
Network (Pipes)
Network and Other Assets
Very Good Good Fair Poor Very Poor
Service level performance: Customer requests: Customer satisfaction:
6 140 100%
120
Number of measures
100 75%
4
80
60 50%
2 40
20 25%
0
0 0%
2010
2011
2012
2013
2014
2015
2016
2017
2018
2019
2020
2017/18 2018/19 2019/20 2016 2017 2018 2019 2020
Achieved Not Achieved Overall Stomwater
Data Confidence Inventory Condition Age
Systems B – Reliable C – Uncertain C – Uncertain
Asset Performance:
• Performance of the network is not formally measured and is based more on staff knowledge and
customer requests.
• A stormwater model was developed although suggested that redesign of the current systems is required
to enable delivery of current and forecast future customer expectations.
Recent achievements:
• Initial investigations into stormwater network modelling completed
• Pahiatua Town Centre stormwater improvements
• No habitable floors flooded in urban stormwater
Page 214.4 Transportation
Service
Council provides a safe and efficient road and footpath network that enables the movement of
people and products, both within and through the district.
To provide a safe and efficient roading network that meets the needs of the district and is operated
Aim
and enhanced in a sustainable manner at the lowest overall whole of life cost.
To provide safe spaces for “non-vehicular” modes of transport to operate.
Our roads are Our transportation Our customers are
Goals
Our roading network is
maintained to an network is being responded to in a
safe
appropriate standard maintained effectively timely manner
Asset summary: Replacement value: Condition:
• 1,187km sealed ~$1B 100%
roads
75%
• 772km unsealed
roads 50%
• 525 bridges and 25%
large culverts Formation 0%
• 1,842km drains and Sealed Road Surface Sealed Bridges Footpaths Culverts
channels Roads
Sealed Pavement layers Very Good Good Fair
• 119km footpath Unsealed Pavement layers Poor Very Poor Unknown
Service level performance: Customer requests: Customer satisfaction:
20 3000 100%
Number of measures
2500
2000 75%
10 1500 50%
1000
500 25%
0 0
0%
2016
2010
2011
2012
2013
2014
2015
2017
2018
2019
2020
2017/18 2018/19 2019/20
2016 2017 2018 2019 2020
Achieved Not Achieved
Overall Roads, Footpaths and…
Not Measured
Data Confidence Inventory Condition Age
Formation B – Reliable Not Applicable Not Applicable
Sealed Pavement Surface A – Highly Reliable A – Highly Reliable A – Highly Reliable
Sealed Pavement Structure C – Uncertain B – Reliable C – Uncertain
Unsealed Pavement Structure C – Uncertain C – Uncertain D – Very Uncertain
Drainage A – Highly Reliable A – Highly Reliable C – Uncertain
Footpaths B – Reliable B – Reliable C – Uncertain
Surface Water Channels B – Reliable B – Reliable C – Uncertain
Signs B – Reliable B – Reliable B – Reliable
Streetlights B – Reliable B – Reliable B – Reliable
Retaining Walls C – Uncertain B – Reliable D – Very Uncertain
Railings B – Reliable B – Reliable C – Uncertain
Bridges and Major Culverts A – Highly Reliable A – Highly Reliable B – Reliable
Asset Performance:
• Condition indicators show a steady performance of the pavement and surfacing assets – slightly poorer
results than some of our peers but appropriate for our network.
• Bridges continue to require work to ensure the they are resilient enough for changing vehicle
configurations but in general are performing well with poor condition rectified in a timely manner.
• A full drainage asset condition capture has been performed which has highlighted a number of very poor
condition assets requiring intervention which forms part of the additional funds added to the next 3 year
funding block request
Recent achievements:
Page 22You can also read