CORROSION IN SODIUM FAST REACTORS - NRC.gov
←
→
Page content transcription
If your browser does not render page correctly, please read the page content below
Letter Report
                                                   TLR-RES/DE/CIB-CMB-2021-07

         CORROSION IN SODIUM FAST REACTORS
                                        May 2021

PREPARED FOR:

U.S. Nuclear Regulatory Commission
TASK ORDER NO. 3131002N0007 (Task 2b)

PREPARED BY:

Oak Ridge National Laboratory
Marie Romedenne
Bruce A. Pint

PROGRAM MANAGERS:

Office of Nuclear Regulatory Research
U.S. Nuclear Regulatory Commission
B. Harris
R. Iyengar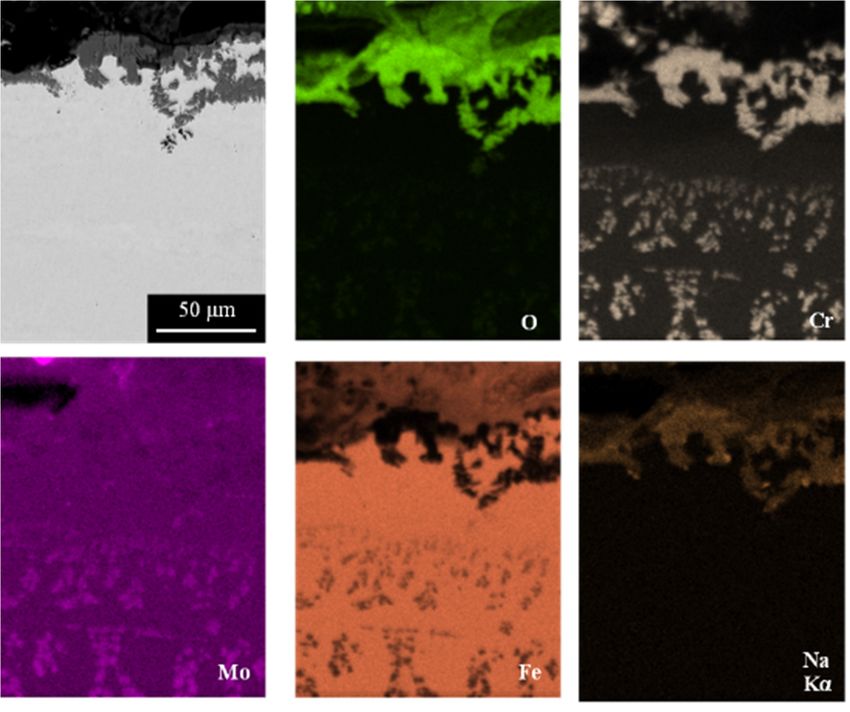
DISCLAIMER
This report was prepared as an account of work sponsored by an agency of the U.S.
Government. Neither the U.S. Government nor any agency thereof, nor any employee, makes
any warranty, expressed or implied, or assumes any legal liability or responsibility for any
third party's use, or the results of such use, of any information, apparatus, product, or
process disclosed in this publication, or represents that its use by such third party complies
with applicable law.
This report does not contain or imply legally binding requirements. Nor does this report establish
or modify any regulatory guidance or positions of the U.S. Nuclear Regulatory Commission and is
not binding on the Commission.
DOCUMENT AVAILABILITY
Reports produced after January 1, 1996, are generally available free via US Department of Energy
(DOE) SciTech Connect.

        Website www.osti.gov

Reports produced before January 1, 1996, may be purchased by members of the public from the
following source:

        National Technical Information Service
        5285 Port Royal Road
        Springfield, VA 22161
        Telephone 703-605-6000 (1-800-553-6847)
        TDD 703-487-4639
        Fax 703-605-6900
        E-mail info@ntis.gov
        Website http://classic.ntis.gov/

Reports are available to DOE employees, DOE contractors, Energy Technology Data Exchange
representatives, and International Nuclear Information System representatives from the following
source:

        Office of Scientific and Technical Information
        PO Box 62
        Oak Ridge, TN 37831
        Telephone 865-576-8401
        Fax 865-576-5728
        E-mail reports@osti.gov
        Website http://www.osti.gov/contact.html

             This report was prepared as an account of work sponsored by an
             agency of the United States Government. Neither the United States
             Government nor any agency thereof, nor any of their employees, makes
             any warranty, express or implied, or assumes any legal liability or
             responsibility for the accuracy, completeness, or usefulness of any
             information, apparatus, product, or process disclosed, or represents that
             its use would not infringe privately owned rights. Reference herein to
             any specific commercial product, process, or service by trade name,
             trademark, manufacturer, or otherwise, does not necessarily constitute
             or imply its endorsement, recommendation, or favoring by the United
             States Government or any agency thereof. The views and opinions of
             authors expressed herein do not necessarily state or reflect those of the
             United States Government or any agency thereof.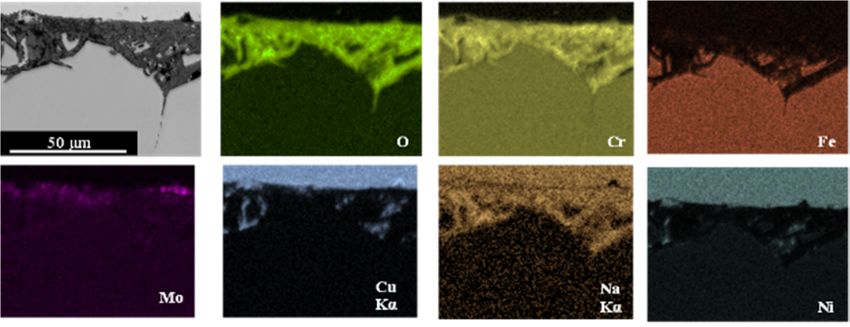
ORNL/ SPR-2020/1580

   Materials Science and Technology Division

CORROSION IN SODIUM FAST REACTORS

              Marie Romedenne
                 Bruce Pint

                Date Published:

                  May 2021

                 Prepared by
   OAK RIDGE NATIONAL LABORATORY
          Oak Ridge, TN 37831-6283
                 managed by
            UT-BATTELLE, LLC
                    for the
      U.S. DEPARTMENT OF ENERGY
     under contract DE-AC05-00OR22725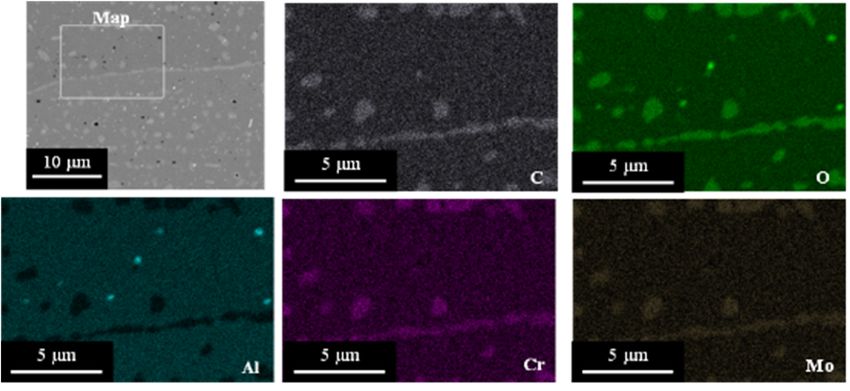
CONTENTS

LIST OF FIGURES ...................................................................................................................................... v
LIST OF TABLES ....................................................................................................................................... vi
LIST OF ABBREVIATIONS .................................................................................................................... viii
EXECUTIVE SUMMARY .......................................................................................................................... 1
1. SODIUM FAST REACTORS .............................................................................................................. 2
    1.1 INTRODUCTION ...................................................................................................................... 2
    1.2 SFR DEVELOPMENT IN THE WORLD ................................................................................. 2
2. STRUCTURAL MATERIALS ............................................................................................................ 3
    2.1 CORE .......................................................................................................................................... 4
    2.2 REACTOR VESSEL, HEAT EXCHANGERS AND STEAM GENERATOR SYSTEM ........ 4
3. SODIUM PROPERTIES AND CHEMISTRY .................................................................................... 5
    3.1 SODIUM PROPERTIES ............................................................................................................ 5
    3.2 COMPOSITION AND PURIFICATION OF SODIUM ............................................................ 5
    3.3 SODIUM CHEMISTRY AND THERMODYNAMICS ............................................................ 7
         3.3.1 Chemical thermodynamics............................................................................................. 7
         3.3.2 Carbon and nitrogen solubilities in sodium ................................................................... 8
         3.3.3 Solubility of hydrogen in sodium................................................................................... 9
         3.3.4 Solubility of oxygen in liquid sodium............................................................................ 9
         3.3.5 Solubility of pure metallic elements in purified liquid sodium.................................... 10
4. CORROSION MECHANISMS IN SFRs ........................................................................................... 12
    4.1 EXPERIMENTAL TECHNIQUES .......................................................................................... 13
         4.1.1 Static sodium corrosion test ......................................................................................... 13
         4.1.2 Flowing sodium corrosion experiments ....................................................................... 15
    4.2 CORROSION OF PURE METALS IN STATIC SODIUM (ISOTHERMAL
         CONDITIONS) ......................................................................................................................... 16
    4.3 CORROSION OF STRUCTURAL MATERIALS IN STATIC AND FLOWING
         LIQUID SODIUM .................................................................................................................... 17
         4.3.1 Corrosion of austenitic steels in static liquid sodium................................................... 17
         4.3.2 Corrosion of nickel-based alloys and ODS alloys in static liquid sodium ................... 19
         4.3.3 Corrosion of ceramics in liquid sodium ....................................................................... 32
         4.3.4 Influence of sodium flow velocity ............................................................................... 33
         4.3.5 Influence of oxygen and temperature........................................................................... 34
         4.3.6 Influence of TCL or FCL on the corrosion behavior of materials in liquid
                sodium .......................................................................................................................... 36
         4.3.7 Corrosion lifetime models: Corrosion rates of austenitic steels in liquid sodium........ 38
    4.4 CORROSION BY CARBON, CARBURIZATION ................................................................. 39
         4.4.1 Carburization in high carburizing sodium (ac = 1) ....................................................... 39
         4.4.2 Carburization in carburizing sodium (ac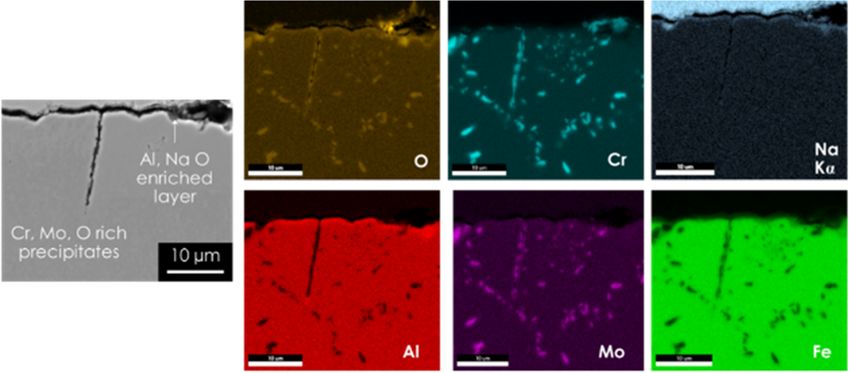
LIST OF FIGURES
Figure 1. Schematic diagram of a sodium fast reactor with a pool design with the intermediate
heat exchanger located inside the core ............................................................................................. 2
Figure 2. Carbon solubilities in liquid sodium measured by different authors (from [28]). ......................... 9
Figure 3. Sketch of the Na-O phase (from [32]). ........................................................................................ 10
Figure 4. Summary of measured solubilities of the literature ..................................................................... 12
Figure 5. Static sodium experimental setup from [52, 69]. ......................................................................... 14
Figure 6. Static sodium experimental setup used for more than 60 years at ORNL. .................................. 15
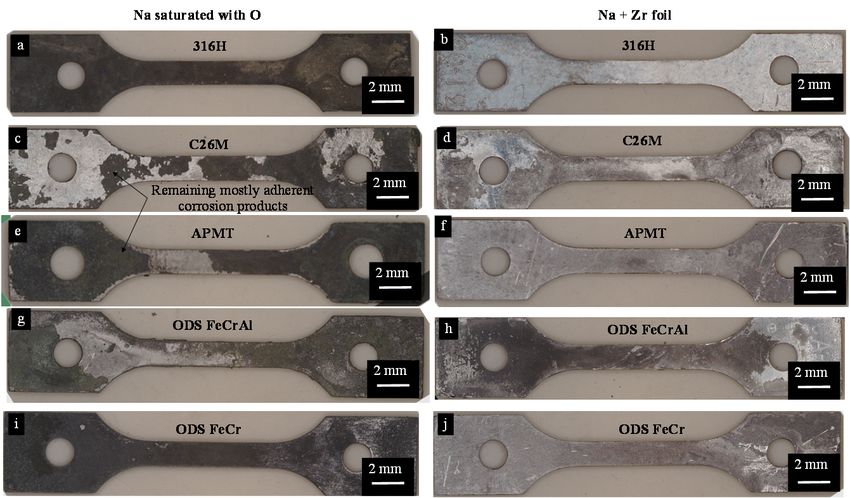
Figure 7. Scanning electron microscope micrograph of 316LN stainless steel exposed to liquid
sodium at 550 °C, along with XRD diffractogram indicating the presence of ferrite on the
surface of the steel (from [14]). ..................................................................................................... 18
Figure 8. Effect of exposure time in high-velocity sodium at 760°C on the corrosion rate of 304
steel (from[43]). ............................................................................................................................. 19
Figure 9. Schematic representation of the capsule containing sodium without Zr foil (left) and
with added Zr foil (right). .............................................................................................................. 20
Figure 10. Optical images of (a, b) 316H, (c, d) C26M, (e, f), APMT, (g, h) ODS FeCrAl, and (i,
j) ODS FeCr (Oak Ridge Fast Reactor Advanced Fuel Cladding) tensile specimens after
1,000 h exposure in static (a, c, e, g, i) sodium saturated with oxygen and (b, d, f, h, j)
sodium with added Zr foil at 700°C. .............................................................................................. 21
Figure 11. BSE images of (a, b) 316H, (c1, c2 , d) APMT, and (e, f) ODS FeCr after 1,000 h
exposure in liquid sodium saturated with oxygen at 700°C........................................................... 22
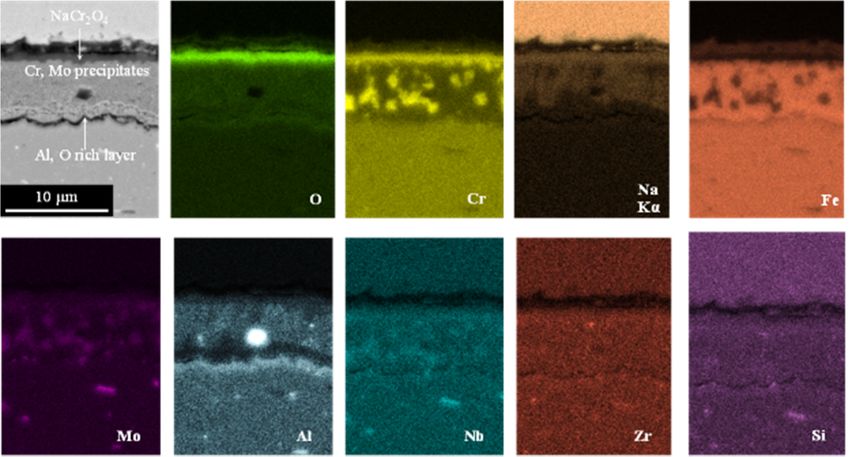
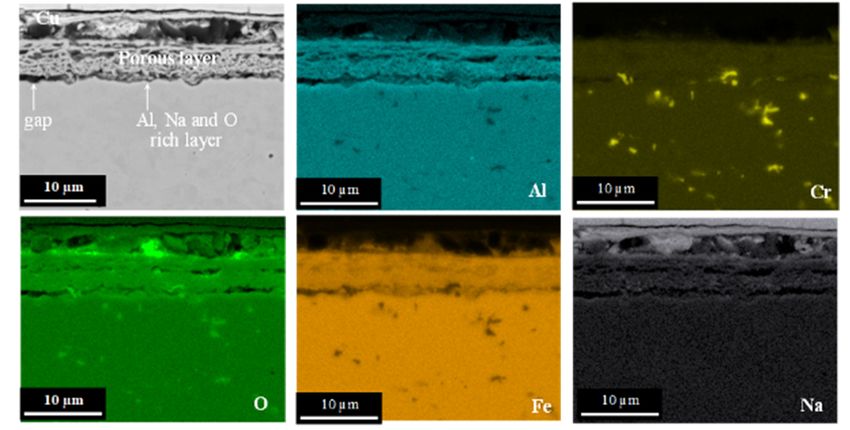
Figure 12. EDS elemental maps of (a) 316H, (b) APMT, and (c) ODS FeCr after 1,000 h
exposure in sodium saturated with oxygen at 700°C. .................................................................... 24
Figure 13. ODS FeCr specimen etched using oxalic acid solution after 1,000 h exposure in
sodium saturated with oxygen at 700°C. ....................................................................................... 25
Figure 14. BSE images of (a) C26M (b) ODS FeCrAl after 1,000 h exposure in liquid sodium
saturated with oxygen at 700 °C. ................................................................................................... 26
Figure 15. (a) BSE image and (b) etched optical image (oxalic acid) for C26M and 1,000 h
exposure in liquid sodium saturated with oxygen at 700 °C.......................................................... 26
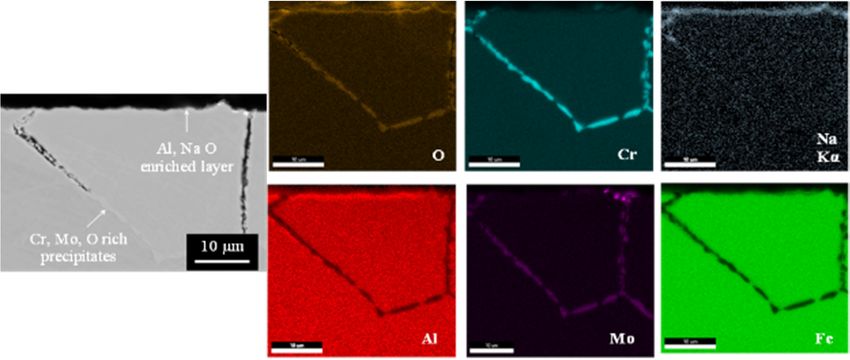
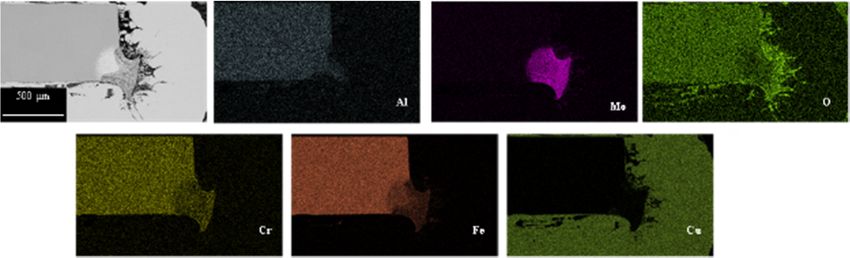
Figure 16. EDS elemental maps of corner of C26M specimen after 1,000 h exposure in sodium
saturated with oxygen at 700 °C. ................................................................................................... 26
Figure 17. EDS elemental maps of C26M specimen after 1,000 h exposure in sodium saturated
with oxygen at 700°C. ................................................................................................................... 27
Figure 18. EDS elemental maps of ODS FeCrAl after 1,000 h exposure in sodium saturated with
oxygen at 700°C............................................................................................................................. 27
Figure 19. Etched optical (10 vol. % oxalic acid) and unetched BSE images of (a, d) 316H, (b, e)
APMT, and (c, f) ODS FeCr after 1,000 h exposure in sodium with added Zr foil at
700°C. ............................................................................................................................................ 28
Figure 20. EDS elemental maps of precipitates near the surfaces in APMT specimen after 1,000 h
exposure in sodium with added Zr foil at 700 °C. ......................................................................... 28
Figure 21. BSE images of APMT specimen after 1,000 h exposure in liquid sodium with added Zr
foil at 700°C. .................................................................................................................................. 29
Figure 22. EDS elemental maps of C26M after 1,000 h exposure in liquid sodium with added Zr
foil at 700°C. .................................................................................................................................. 29
Figure 23. EDS chromium line profiles in the underlying (a) 316H and ODS FeCr (OFRAC)
alloys and (b) APMT, C26M, and OCA after 1,000 h exposure in (closed symbols)
sodium saturated with oxygen and (open symbols) sodium with added Zr foil at 700°C. ............ 30
v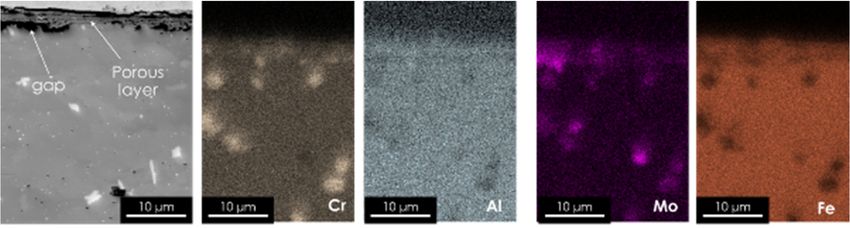
Figure 24. EDS aluminum profiles in the underlying APMT, C26M, and ODS FeCrAl (OCA)
        specimens after 1,000 h exposure in (closed symbols) sodium saturated with oxygen and
        (open symbols) sodium with added Zr foil at 700°C. .................................................................... 31
Figure 25. Effect of velocity on the dissolution of 316 stainless steel in a stainless steel sodium
        loop at 650°C and 725°C with less than 5, 10, and 25 ppm of oxygen [94]. ................................. 34
Figure 26. Effect of oxygen content in sodium on the rates of metal loss of different materials
        [94]. ................................................................................................................................................ 35
Figure 27. Schematic representation of a mass transfer phenomenon under thermal gradient in a
        circuit (from [39]). ......................................................................................................................... 36
Figure 28. (a) Microstructure of 316 steel (760 µm thickness) after 243 h at 643°C in carburizing
        sodium [109]. (b) Microstructure of 316 steel after 168 h exposure in carburizing sodium
        at 600°C [62]. ................................................................................................................................. 40
Figure 29. Microstructure of (A) 15Cr15Ni0.4Ti, (B) 316L, and (C) 9Cr1Mo steels after
        exposure for (a) 500 h and (b) 5000 h at 600°C [65]. .................................................................... 40
Figure 30. Effect of different carbon sources on the carburization of 316L specimens exposed at
        650°C in sodium [61]. .................................................................................................................... 41
Figure 31. Creep strength of 2.25Cr-1Mo steel exposed for up to 5000 h in liquid sodium (10
        ppm of oxygen) between 500 and 600°C [55]. .............................................................................. 43
Figure 32. Influence of nickel diffusion on the tensile properties of ferritic ODS steels [54]. ................... 44

                                                                 LIST OF TABLES

Table 1. Structural and core materials for fast reactors (from [10]). ............................................................ 3
Table 2. Nominal composition of all investigated commercial materials in wt. %. ..................................... 4
Table 3. Thermophysical properties of liquid sodium and water [14]. ......................................................... 5
Table 4. Composition of standard grade sodium (from [17]). ...................................................................... 6
Table 5. Specification of sodium for MONJU (from [17]). .......................................................................... 6
Table 6. Standard Gibbs energies of formation of sodium oxides [35]. ..................................................... 11
Table 7. EDS composition of Cr-, Mo-rich phase. ..................................................................................... 25
Table 8. Ultimate tensile strength (UTS) and fracture elongation (ɛ) of specimens before and after
        1,000 h exposure in liquid sodium saturated with oxygen at 700°C. ............................................. 32
Table 9. Ultimate tensile strength (UTS) and fracture elongation (ɛ) of specimens before and after
        1,000 h exposure in liquid sodium with added Zr foil at 700°C. ................................................... 32
Table 10. Tested ceramics from Kano et al. [89]. ....................................................................................... 33

                                                                               vi
LIST OF ABBREVIATIONS
AISI American Iron and Steel Institute
ANL Argonne National Laboratory
APMT Advanced Powder Metallurgy Tube
ASTRID Advanced Sodium Technological Reactor for Industrial Demonstration
BCC Body centered cubic (crystal structure)
BSE Backscattered electron (images)
CDFR China Demonstration Fast Reactor
EDS Energy Dispersive X-ray Spectroscopy
FBR Fast Breeder Reactor
FCC Face centered cubic (crystal structure)
FCL Forced Convection Loop
FM Ferritic Martensitic (steel)
IHX Intermediate Heat Exchanger
LCAC Low-Carbon, Arc-Cast (molybdenum)
LWR Light Water Reactor
PFBR Prototype Fast Breeder Reactor (India)
ODS Oxide Dispersion Strengthened
ORNL Oak Ridge National Laboratory
PRISM Power Reactor Innovative Small Module
SFR Sodium Fast Reactor
SS Stainless steel
TCL Thermal Convection Loop
UKAEA United Kingdom Atomic Energy Authority
UTS Ultimate Tensile Strength
XRD X-ray Diffraction
viiiEXECUTIVE SUMMARY
Compatibility of structural materials with liquid sodium is one of the most important aspects of the safety
and lifetime of sodium fast nuclear reactors (SFRs). This report reviews relevant and publicly available
knowledge on the interaction between sodium chemistry and thermodynamics with structural materials in
static and flowing Na conditions. The report begins with a summary of past SFR designs and structural
materials that serve as a basis for the development of present sodium-cooled reactors.
Because the corrosion of structural materials in liquid sodium is strongly affected by the presence of
oxidizing (oxygen) and carburizing (carbon) impurities, the solubilities of interstitials and major metallic
elements in liquid sodium are reviewed. The different systems and sensors used to purify and monitor the
sodium chemistry are also presented.
In the next chapters, the corrosion mechanisms in SFRs are discussed. These mechanisms are studied in
laboratory and reactor conditions. Laboratory experiments in static or flowing conditions are essential to
provide fundamental understanding of the fundamentals of corrosion and mass transfer phenomena
because the various parameters involved are either carefully controlled or monitored. However, these
experiments are limited in terms of duration of exposure (a few thousand hours). Reactor exposures are
indispensable for the detailed understanding of in-service and long-term (thousands of hours) corrosion
mechanisms.
The corrosion of pure metals in static liquid sodium and the corrosion of structural materials in static and
flowing liquid sodium are reviewed. The detrimental effect of oxygen on the corrosion of austenitic and
ferritic steels in liquid is reported. More work is necessary to understand how the interaction between
alloy chemistry and sodium chemistry affect the corrosion behavior and lifetime of Ni-based alloys and
ceramics.
Carbon as an impurity in the liquid sodium or transferred between materials in the liquid can induce
carburization of heat exchangers, structural steels, and control fuel rods in the reactor’s core. The effect of
carbon is widely reported from complex reactor and flowing sodium experimental conditions between
steels. However, additional work is necessary on the carburization behavior of other materials such as Ni-
based alloys.
The impact of corrosion on mechanical properties of structural materials is also discussed. Long-term and
in-reactor exposures did not reveal a significant impact of oxidation and dissolution on the mechanical
properties of austenitic stainless steels. However, carbon was found to affect the strength and ductility of
ferritic steels after long-term exposure in liquid sodium. Limited knowledge exists on the effect of sodium
exposure on the mechanical properties of Ni-based alloys and ceramics.
The report concludes with a list of knowledge gaps. Corrosion models are available for a few common
austenitic steels. However, given the range of temperatures, materials, and designs being considered,
modeling appears essential to reduce the amount and cost of experimental work. In general, less
prototypical experimental work has been conducted at the correct temperature and sodium chemistry
conditions. These knowledge gaps should not be interpreted as absolute barriers to the advancement of
SFR technology. They merely represent guidance for future research in preparation for upcoming needs.
Their relevance and importance is entirely dependent on the design choices made for each particular
reactor concept.
11. SODIUM FAST REACTORS 1.1 INTRODUCTION To provide reliable and long-term energy supplies, several countries, including the United States, France, Japan, China, India, and Korea, developed or are in the process of developing fast reactors. SFRs are the most promising candidates, as they were studied and developed in the past (1950–1997). SFRs use liquid sodium as a coolant, unlike LWRs, which use water. With the use of sodium, the neutrons produced by the fission reactions are not moderated and higher power efficiencies are achieved (from 50 to 300 MWe for small plants and up to 1,500 MWe for larger plants). Fast neutron reactors are also used for a closed (recycle) fuel cycle, which allows the transmutation of transuranic waste products and high burnup levels (i.e., a longer core life without refueling). Figure 1 shows a common SFR configuration being considered. Encapsulated fissile materials (metallic fuel such a Zr-U-Pu alloy) are inserted in the core, which is filled with purified liquid sodium (T
•   Japan is studying improvements in the Monju reactor maintenance and design. [3]

•   In the United States, TerraPower was developing a 500 MWe SFR loop design [4], GE Hitachi
    Nuclear Energy has developed a 310 MWe reactor known as PRISM (Power Reactor Innovative
    Small Module) and is now collaborating with TerraPower to build a commercial Natrium PowerTM
    Production and Storage System. [5, 6]

•   China is developing the China Demonstration Fast Reactor (CDFR) (600 and 900 MWe). [7]

•   South Korea is considering building a 600 MWe prototype SFR. [8]

•   In France, a 600 MWe Advanced Sodium Technological Reactor for Industrial Demonstration
    (ASTRID) prototype pool type reactor was in development until the project was canceled in August
    2019. [9]

                                   2.   STRUCTURAL MATERIALS

Various materials are used in different systems and components of SFRs. In the next chapters, it will be
discussed that corrosion of structural materials is a function of their composition and microstructure as well
as the chemistry and temperature of the liquid sodium. Examples of the reported structural and fuel cladding
materials for SFRs from different countries are reported in Table 1. Many components are grades of
conventional 300 series stainless steels (SS) or 2.25% or 9%Cr steels (Grades 22 and 91). Throughout the
report additional alloys will be presented and referred to by their commercial names. Compositions of all
investigated materials are reported in Table 2.

                     Table 1. Structural and core materials for fast reactors (from [10]).
       Country                   Japan          England               France            Germany    Russia
Reactor name            Monju       JSFR       PFR          Phenix         SPX         SNR300     BN350
Reactor type            Loop        Loop       Tank         Tank           Tank        Loop       Loop
Reactor temperature             529/397        560/399      560/395        545/395     546/377    500/300
(out/in) (°C)
Fuel cladding            PNC316 (20%CW)          Nimonic    Cr17-Ni13-     316L(N)     304         304
                           oxide dispersion       PE16      Mo2.5-
                            strengthened                    Mn1.5-Ti-Si
Reactor vessel          304         316FR      321          316            316L(N)     304        304
IHX                     304         Grade 91   321          316            316L(N)     304        304
Primary pipes           304         Grade 91   –            –              –           304        304
Secondary pipes         304         Grade 91   321          321            316L(N)     304        304
                                                            304
Steam generator         Grade 22    Grade 91   Grade 22     Grade 22       Alloy 800 Grade 22     Grade 22
                        321                    316          321
                                               Grade 91

                                                      3
Table 2. Nominal composition of all investigated commercial materials in wt. %.
Name Fe Ni Co Cr Mo Mn Si Nb Al Ti C
Nimonic 31 Bal. 2 15–17 2.8–3.8 0.2 0.5 – 1.1–1.3 1,1 – 0.04–
PE16 1.3 0.08
316 Bal/ 10–14 – 16–18 2–33. SODIUM PROPERTIES AND CHEMISTRY
Liquid sodium being the environment of exposure where corrosion of structural materials of SFRs occurs,
understanding of the properties of unpurified and oxygen-purified liquid sodium is necessary.
The thermodynamics and chemistry of sodium in equilibrium with metallic elements present in the
reactor’s constitutive materials (e.g., Fe, Cr, Ni) and with non-metallic constituents (such as C, O, H, N),
that can be present as impurities in liquid sodium, need to be understood and summarized.
3.1 SODIUM PROPERTIES
Sodium properties were reviewed by several authors [12, 13]. As water is commonly used as a coolant in
LWRs, the properties of sodium are compared with those of water in Table 3 ([14]). Liquid sodium
presents several attractive properties, including a much higher thermal conductivity, a lower specific heat,
a lower viscosity, and a longer liquid range than water (Table 3). These better heat transfer properties than
water make it a well-suited coolant candidate for SFRs as the thermodynamic efficiency for energy
conversion could be increased.
Table 3. Thermophysical properties of liquid sodium and water [14].
Property Sodium Water
Melting point (°C) 98 0
Boiling point (°C) 877 100
Density (kg/m3) 845 997*
Thermal conductivity at 500°C (W⋅K-1⋅m-1) 68.8 0.67 (at 50°C)
Heat capacity at 773 K (kJ⋅kg-1⋅K-1) 1.269 1.339 (at 50°C)
Specific heat (J⋅g ⋅K )
-1 -1 1.23 4.18
Viscosity (centipoise) at 20°C 0.072 1
* corrected value
The boiling point of sodium being relatively low (877°C or 1,156 K) will require pressurized systems and/or
the use of condensers. The main concern is the chemical reactivity of sodium especially with water and
oxygen. The following exothermic reaction with water releases corrosive compounds and gas products that
threaten the integrity and safety of the heat transfer system of the reactor.
2Na(s) + 2H2O(l) ⟶ 2Na+(aq) + 2OH−(aq) + H2(g)
To identify a potential leak from the primary loop (sodium) that could interact with the intermediate loop
(water), the level of hydrogen in sodium is carefully measured [15] and monitored [16].
3.2 COMPOSITION AND PURIFICATION OF SODIUM
The main manufacturer of sodium, Métaux Spéciaux, provides technical-grade sodium with calcium,
metallic oxides, and potassium as the major impurities. An electrolysis process is used to obtain the
standard grade sodium of the composition given in Table 4 [17].
5Table 4. Composition of standard grade sodium (from [17]).
Element Typical
Na 99.9 %
Ca 350 ppm
K 200 ppm
Ba < 5 ppm
Fe < 5 ppm
Cl < 10 ppm
O unknown
In SFRs, purification of the sodium is necessary to control the corrosion processes and their effects on the
mechanical properties of structural materials. Indeed, impurities such as carbon and oxygen play an
important role in mass transfer and other corrosion processes of ferritic and austenitic steels [18]. Even
though corrosion in liquid sodium may not compromise the mechanical properties of the thickest
structural materials, it is important to reduce the amount of these impurities in sodium to limit the
accumulation of reaction products in the reactor. The presence of impurities in sodium can lead to the
formation of clusters that can reduce or even block flow in the IHX. For example, in the Japanese Monju
reactor, nuclear-grade sodium was recommended, and thus a sodium purification procedure was required.
The composition of the nuclear-grade sodium is reported in Table 5.
Table 5. Specification of sodium for Monju (from [17]).
Element ppm maximum ppm
O < 30 < 10
H• Electrochemical sensors monitor carbon and oxygen levels. [22]
Once sodium is purified, its purity can be altered by contact with ambient air, the dissolution of alloying
elements from the structural materials and the introduction of non-metallic impurities (C, N, O) during
operation and maintenance. Details of specific operating parameters and procedures are not publicly
available.
3.3 SODIUM CHEMISTRY AND THERMODYNAMICS
When a material with a defined chemical composition is exposed to liquid sodium at a specified
temperature, velocity, and impurity content, thermodynamics such as phase equilibria can give valuable
insight into predicting the reaction products that can form between the alloy and the liquid sodium at
equilibrium. The corrosion rate of a material in liquid sodium is then governed by diffusion and
interfacial processes in the material and in the liquid sodium at the studied temperature.
3.3.1 Chemical thermodynamics
The corrosion processes occurring between a particular alloy and the liquid sodium of specified
composition are driven by thermodynamics (chemical potential gradients between the alloy and the liquid
sodium) and kinetics. To predict which elements from the alloy will react with the liquid sodium it is
necessary to classify them regarding their stability and kinetics of formation/ dissolution in each media
(alloy and sodium). For a given time, temperature, and pressure, the compound that is the most stable and
the most rapid to form between the liquid sodium and the alloy will control the corrosion of the alloy in
sodium until equilibrium is reached. Dissolution of constitutive elements from the alloy into sodium are
presented considering that the kinetics of formation of a compound is usually fast (thus not limiting their
formation). Therefore, only thermodynamics govern corrosion of alloys in liquid sodium in this case. For
example, the dissolution of element i from the alloy into sodium will occur when the chemical potential of
element i in the alloy ( ) is higher than its chemical potential in the sodium ( ). At
thermodynamic equilibrium, both potentials should be equal. The chemical potential is expressed as a
function of temperature and activities (Eq. [1]).
= + . 1
The activity of element i in a phase ( ) is function of the composition of the phase (alloy or sodium)
and the temperature. For a solute i in a dilute solution (phase), is often simplified using Eq. (2),
= , 2
where is the activity coefficient of element i, which is equal to 1 when the i shows ideal behavior in the
considered phase, is the concentration of element i in the phase and is the standard state of the
element in a dilute solution. Equation (2) can only be used when the element i dissolved from the alloy is
in solution in the liquid sodium. However, in most cases, element i will not remain in solution but will
form a more stable compound with sodium or other impurities.
In most of the studies reported here, only solid solutions were assumed (because the exact value of γi is
unknown), and Eq. (2) was simplified using Eq. (3); was assumed equal to 1 mol/L, and was
assumed equal to the solubility of the element in sodium and T the temperature.
7log , = + . 3
where A and B are fitting parameters. Assuming that only sodium solutions of constitutive elements of
alloys are exposed to liquid sodium, extensive studies were performed to evaluate the solubilities of
alloying elements in liquid sodium [19].
3.3.2 Carbon and nitrogen solubilities in sodium
The solubility of carbon in sodium was measured by different authors between 350 and 1,000°C,
considering acetylide, M2C2, or graphite as the standard state for carbon in liquid sodium [23-27]. As
reported in Figure 2, different solubility relationships were obtained by the various authors. As the solute
species in liquid sodium was not clearly identified experimentally, this could explain the discrepancy. The
choice of standard state for carbon in liquid sodium will ultimately affect the solubility value of carbon in
liquid sodium at the considered temperature. This will then affect the carbon activity in the liquid sodium.
For example, when graphite is considered as the standard state for carbon in liquid sodium, the solubility
of carbon at 600°C, from Ainsley et al., is equal to 4 ppm when graphite forms in liquid sodium [24].
According to Eq. (2), this solubility value corresponds to a carbon activity of = 1 if is assumed equal
to 1. An activity of 1 for carbon in liquid sodium corresponds to strong carburizing conditions. If another
compound is formed with carbon in liquid sodium, such as Na2C2, the solubility of carbon in sodium will
increase (two carbon atoms are needed to form the acetylide). In this case, the activity of carbon in
sodium, with respect to graphite, will be higher than 1 in liquid sodium, corresponding to even stronger
carburizing conditions. In most of the recent literature, the standard state of the element considered (here
carbon) is often not mentioned. This can lead to errors in the evaluation of the solubility value of a
particular component in the studied phase (here liquid sodium). This is without considering that carbon
can form compounds with dissolved metallic elements from the structural elements of the reactors. This
will also affect the value of the solubility of carbon in liquid sodium if the formation of these new
compounds is not considered.
8Figure 2. Carbon solubilities in liquid sodium measured by different authors (from [28]).
In contrast to carbon, no compounds have been identified for the Na-N system. Metastable Na3N may be
present and NaN3 also may form [19]. Regarding the equilibrium for the Na-C-N system, sodium cyanide
(NaCN) was observed to dissolve in sodium and to precipitate in cold traps [29].
3.3.3 Solubility of hydrogen in sodium
Above 300°C, hydrogen and sodium form hydrides (NaH). Solid hydrides or gaseous hydrogen dissolves
in sodium [19]. The solubility has been measured several times [29, 30]. The two studies measured
hydrogen concentrations with different hydrogen meters and produced nearly identical values of the
saturation concentrations. Equation (4) shows the solubility relationship:
3,051.3 4
log , = 8.5184 .
3.3.4 Solubility of oxygen in liquid sodium
Solubility data for oxygen in liquid sodium were determined by Noden in the temperature range 114–
555°C [31], with significant scatter measured. Equation (5) shows the solubility relationship:
2,447
log , = 6.239 . 5
Although scatter was found between 107 experiments from 5 laboratories, all the groups were thought to
have performed careful work, with proper attention to contamination from the atmosphere, accurate
measurement of temperature using the equilibration technique, provided that the sodium did not interact
9with the container. The scatter could be related to the formation of NaO and Na2O2 compounds. as
presented in Figure 3.
Figure 3. Sketch of the Na-O phase (from [32]).
As previously mentioned for carbon, the presence of metallic elements in sodium can lead to compound
formation and complicate the oxygen solubility measurements. Likewise, the presence of oxygen in
sodium complicates solubility measurements for metallic elements.
3.3.5 Solubility of pure metallic elements in purified liquid sodium
As presented previously, significant scatter was measured for the solubilities of carbon and oxygen in
liquid sodium. This effect arises from the fact that the solubilities of the elements are strongly dependent
on the chemistry (i.e., phase stability) in the system (Na-C, Na-O, Na-C-N, Na-C-O). In addition, the
solubility of carbon and oxygen can also be affected by the presence of metallic elements present in the
liquid sodium which will form compounds with O or C in liquid sodium.
Therefore, to study the corrosion behavior of a pure metal M in liquid sodium it becomes necessary to
know which compounds will form at thermodynamic equilibrium since the solubility of each considered
element will be affected by the formed oxide compound. In pure sodium, the following binary phase
diagrams should be used for each element considered:
• M-Na
If sodium contains impurities such as carbon and oxygen, at least the following ternary diagrams should
be used for each element considered:
• M-C-Na
• M-O-Na
In the case of a multiphase alloy in contact with commercial liquid sodium containing oxygen impurities,
the situation is even more complex. The corrosion of an alloy in liquid sodium will be defined by the
stable compounds that can be formed among all of the constitutive elements of the alloy, sodium, and
impurities like oxygen. For example, when alloying elements M are dissolved in sodium, they can form
binary or ternary compounds associated with oxygen or carbon [33] (Eq. [6]).
10+ + = 6
2
For example, many oxides can be formed with Cr, Ni, and O. A list of the most commonly observed
oxides in sodium is shown in Table 6 with their respective Gibbs energies of formation (ΔGf0). The
oxides NaCrO2 and Na4FeO3 are known to influence the corrosion of steels in sodium [34]. They are
formed at ppm levels in sodium. The oxide Cr2O3 was not observed to form at any oxygen level in sodium
[19].
Table 6. Standard Gibbs energies of formation of sodium oxides [35].
Reference ΔGf° (kj⋅mol-1) Temperature range (°C)
Na2O [36] −421.5 + 0.1414T 227–1,027
NaCrO2 [37] −874.6 + 0.20921T 427–827
Cr2O3 [38] −1,109.9 + 0.2472T Not mentioned
NaMnO2 [38] −780.8 + 0.1663T Not mentioned
MnO [38] −778.08 + 0.1532T Not mentioned
Na2FeO2 [37] −777 + 0.20795T 427–827
Na4FeO3 [37] −1,214.17 + 0.34269T 427–827
NaFeO2 [37] −701.7 + 0.18945T 427–827
Na2NiO2 [38] −640.4 + 0.2217T Not mentioned
Na4MoO5 [38] −1907.2 + 0.4361T Not mentioned
Other minor elements such as Co, V, Nb, Mo, Mn Al, W, Zr, and U can also form binary or ternary
compounds [19]. The ΔGf0 for these compounds were not included in this report. However, numerous
ternary phase diagrams among sodium, alloying elements, and oxygen are available elsewhere [19].
In considering the dissolution of multiple elements in sodium, combined with impurities present in the
liquid, it is important to be aware of the sodium chemistry at equilibrium. Therefore, to evaluate the
dissolution behavior of alloys in liquid sodium, a combined thermodynamics and kinetics approach is
necessary. Furthermore, as the temperature is not homogeneous in a reactor, activity values will vary in a
thermal gradient. Usually, elements are dissolved from the higher-temperature regions (zones where the
chemical potentials of the alloys are higher than in sodium) and are precipitated in the lower-temperature
regions (where the chemical potential of the element in the alloy is lower than in sodium). In a circulating
system, this mass transfer process of dissolution and precipitation [39] is considered using
thermodynamic and kinetic approaches to evaluate the compatibility of structural materials in liquid
sodium. Selected solubility measurements are shown in Figure 4.
11Temperature (°C)
1394 977 727 560 441 352 283 227 182
Solubilities/ Concentration[i] (weight ppm)
1000
100 Hydrogen
Addison et al. (1967) Vissers et al. (1974)
Carbon
Thompson (1980)
Ainsley et al. (1974)
Longson (1970)
10 McKisson et al. (1969), Gehri (1970)
Johnson et al. (1973)
Salzano et al. (1972)
Oxygen
Nodel et al. (1972)
1 Nickel
Singer et al. (1968)
Eichelberger et al. (1968)
Iron
Stanaway et al. (1980)
0.1 Stanaway et al. (1980)
Thorley and Tyzack (1973)
Singer et al. (1968, 1970)
Manganese
Periaswami et al. (1982)
Stanaway et al. (1980, 1982)
0.01 Chromium
Eichelberger et al. (1968)
Singer et al. (1970)
0.001
0.6 0.8 1.0 1.2 1.4 1.6 1.8 2.0 2.2
-1
1/T (K )
Figure 4. Summary of measured solubilities in the literature. Experimental conditions (oxygen, carbon
concentration in Na, temperature, and experimental setup are presented in each reported reference)
Conclusions:
• Solubilities of carbon, oxygen, and metallic elements were reviewed. Although scatter was found
between experiments, it is considered that all groups reporting solubilities have done careful work,
with proper attention to contamination from the atmosphere, accurate measurement of temperature.
Differences were found to be due to the nature of the considered solute species in liquid sodium
which was not always the same (for example O concentration in Na) or in other cases not clearly
identified experimentally (for example, oxide compound with sodium, carbide compound with
sodium).
4. CORROSION MECHANISMS IN SFRs
The corrosion mechanisms of structural materials in liquid sodium can be separated into two categories.
The first mechanism category is the dissolution and mass transfer of constitutional elements from the
materials into the liquid sodium. The second category involves impurity and interstitial reactions,
alloying, and compound reduction [40]:
Dissolution of structural materials in liquid sodium was intensively studied in the past [18, 41-57]. These
studies demonstrated reasonable dissolution rates of different steels (austenitic, ferritic, or ODS) in liquid
sodium with low oxygen contents [10, 50, 52, 53]. The extent of dissolution in purified sodium and its
effect on the mechanical properties of structural materials is considered in the 40-year lifetime design of
SFRs, taking into account wall thinning and loss of strengthening elements. Since longer (60 year)
lifetimes are expected for future SFRs with higher safety levels, better understanding of the corrosion
12phenomena may be needed. The ability to predict the chemical compatibility of a fuel cladding with
liquid sodium, when new materials are being introduced (common steels, ODS or new candidate
materials), supported by well-chosen experimental observations, could be of great use in identifying
suitable materials for specific conditions. Knowledge of the effects of transient or accidental conditions
on the chemistry of liquid sodium, and on the corrosion rates of structural materials—as well as the ability
to predict the dissolution rate as a function of material composition, thickness, and time—would be useful
for designers, operators, and regulators.
The second category of impurity corrosion mechanisms refers to the interaction of the structural materials
with elements such as carbon in the sodium. During the dissolution step, carbon is released from other
structural materials in liquid sodium [58] or is present in liquid sodium as an impurity (see Section 3.2).
Very small (ppm) concentrations of oxygen or carbon can change their potential in liquid sodium. Two
different mechanisms can operate in liquid sodium. The first process is the loss of carbon from the
structural materials (decarburization). Decarburization releases carbon into the sodium, which then
facilitates additional reactions [59, 60]. Carbon is then transported from regions with higher carbon
potential to locations with lower carbon potential. The opposite process, carburization, is also well
documented [28, 47, 52, 58, 61-67]. Again, the carbon source may be from the decarburization of
structural materials or the presence of carbon impurities. For example, the carburization of control rods
may be induced by the release of carbon from B4C components. Carburization is a concern, as it affects
the mechanical properties of components [47, 61, 68].
In this section, experimental techniques used to study corrosion in liquid sodium, along with corrosion
mechanisms observed in SFRs, are summarized. In addition, a review of the literature regarding the
compatibility of structural materials with liquid sodium and its impurities is presented. Finally, the effects
of the corrosion mechanisms (dissolution, mass transfer, and carburization/decarburization) on the
mechanical properties of structural materials are discussed.
4.1 EXPERIMENTAL TECHNIQUES
4.1.1 Static sodium corrosion test
The first category of corrosion test is called “static” corrosion experiments because sodium is inserted in a
closed reactor [52, 69] or in a capsule or crucible [70]. The material of the container should be inert with
respect to sodium corrosion. In initial studies [70], nickel capsules were used and sealed in stainless steel
vessels. After compatibility issues were identified among nickel, iron, or stainless steels in sodium [34],
Mo crucibles were selected [69] because of their good compatibility with sodium and oxygen [71].
However, the introduction of carbon into the system was observed to lead to the formation of Mo2C.
Thus, Mo containers could be problematic for studying dissolved carbon in sodium. Figure 5 and Figure 6
show schematics of typical static sodium experiments. In the sodium–molybdenum capsule experiment
illustrated in Figure 6 (used at Oak Ridge National Laboratory (ORNL) for many decades [72]), the outer
stainless steel capsule provides secondary containment during the thermal exposure and prevents the Mo
from oxidizing and/or evaporating in an oxidizing environment. The capsule is inverted at the end of the
exposure to allow the sodium to drain away from the specimen for easier extraction. Similar capsules are
used for molten salt corrosion studies [73, 74]. Because of the relatively small (~10-12 cm3) volume of
sodium in each capsule, saturation of a dissolving element X during the corrosion experiment can occur
after prolonged exposure. As the concentration of X approaches saturation during exposure, the corrosion
kinetics will slow down and can then stop once equilibrium (saturation) is reached between the studied
alloy and the liquid sodium. Therefore, static experiments can act as a screening tool for compatibility
but are not conclusive, especially in long duration experiments, because of the potential for saturation to
affect the result.
13Assuming the activity (ai) of an element is equal to its solubility in liquid sodium (Ci), as mentioned in
Section 3.3.1, the dissolution of element i in liquid sodium can be written according to Eq. (7):
Ji = ki(CSi-Ci) , 7
where Ji is the flux of species i (e.g., Cr) into the liquid, ki is a constant, CSi is the solubility limit of i in
the liquid salt, and Ci is the instantaneous concentration of i in the liquid [75]. Thus, as i dissolves into the
liquid in the capsule, the reaction should slow and stop as the liquid becomes saturated with i. This is the
reason for specifying a preferred ratio higher than 10 between the sodium volume and the specimen
surface area in an isothermal capsule test. Furthermore, long-term crucible or capsule tests are limited in
value. However, they can be employed as screening tests and for short-term exposures (times ≤2000 h).
From Eq. (7), the rate of mass loss should decrease with time until the concentration of the element i
reaches its solubility in liquid sodium, where Ji is equal to 0. For example, the dissolution of iron from the
alloy will stop when Fe(s) precipitates in sodium. By selecting materials containing elements with low
solubilities (chemical potentials) and low solution rate constants, the dissolution process can be
minimized. However, as noted previously, if oxygen is present in sodium, iron can form ternary
compounds in sodium (e.g., Na4FeO3), resulting in increased solubility of iron in sodium compared with
the solubility in the presence of Fe(s) only (i.e. low O levels in the Na). Furthermore, the temperature in
SFRs is not homogeneous (the liquid sodium used as a coolant is lower in temperature than sodium
present in the core). Thus, different solubility (chemical potential) levels can be achieved in the sodium
circuit, resulting in different solubilities (chemical potentials) and solution rates in the sodium circuit.
Solution rates ki will also be affected if dissimilar materials are present in an SFR. Different solubilities
(chemical potentials at equilibrium) between each alloy and the liquid sodium will be obtained at different
locations in SFRs.
Figure 5. Static sodium experimental setup from [52, 69].
14Figure 6. Static sodium experimental setup used for more than 60 years at ORNL.
4.1.2 Flowing sodium corrosion experiments
In static sodium, the corrosion rates are relatively small and often not representative of reactor conditions
with temperature gradients [34]. Therefore, convection loops are used. There are two types of convection
loops: natural or TCLs and pumped or FCLs. From an engineering perspective, corrosion rates in
controlled-velocity FCLs are closer to those measured in reactors. However, without pumps and valves,
TCLs are much less expensive to build and operate, but still enable study of the effects of thermal
gradients, dissimilar materials interactions, and mass transfer in general [39].
4.1.2.1 Thermal convection loops
Results from TCLs have been reported by many organizations [67, 72, 76]. In a TCL, a section of the
loop is heated at the temperature of interest (hot leg) and the other section is not heated or is actively
cooled (cold leg) to create the desired temperature gradient. In this experimental setup, flow is driven by
the temperature-induced density difference. The temperature gradient also creates a difference in
solubility that can drive mass transfer between the two legs. The velocity in a TCL is typically much
slower than in-reactor applications, 1–2 cm/s. After operation, the TCL tubing can be sectioned to study
the mass transfer, or chains of specimens can be hung in the flow path to measure mass change on each
specimen as a function of temperature and location in the hot and cold legs. The mass transfer mechanism
is much easier to understand if the specimen materials exposed in the loop are identical to the material of
the loop itself, i.e., it is a monometallic TCL. However, materials of interest are not always readily
available in tube form to build a TCL. If the TCL loop and specimen materials are dissimilar, chemical
potential gradients among the different loop materials will play a role in the observed corrosion behavior.
In the literature, it is common to see TCL (and FCL) studies that consider a loop consisting of a material
different from the inserted studied coupons [49, 53, 54, 77-81].
4.1.2.2 Forced convection loops
Corrosion of materials is also studied in FCLs, where sodium is mechanically or electromagnetically
pumped at a desired velocity [82]. Typically, FCL experiments can explore temperature gradient and
velocity effects with conditions comparable to those in SFR designs. However, as noted in the previous
section, the FCL may be constructed of multiple materials or expose specimens of multiple materials,
complicating the results. Active impurity controls are needed to produce optimal and reproducible results.
154.2 CORROSION OF PURE METALS IN STATIC SODIUM (ISOTHERMAL CONDITIONS)
In static liquid sodium, dissolution of pure metals or structural materials is controlled by thermodynamics
(chemical potential gradients between the alloy and sodium) and kinetics [43] as noted in Section 3.3. The
dissolution of one element in sodium can be favored by its thermodynamic solubility in sodium, and yet
not occur if the kinetics are too slow. To understand the dissolution mechanism in liquid sodium, it is
necessary to evaluate which compounds are stable compounds that form at thermodynamic equilibrium
between sodium and the alloy. Then kinetics play their role when the slowest reaction controls the
dissolution process.
In other words, when the temperature in the reactor is homogeneous and no impurities are present in the
liquid sodium, the rate of mass loss of an element i ( in mol⋅m-2⋅s-1) is controlled by the difference
between the chemical potential of the element i in the alloy ( ) and the chemical potential of the
element i in the liquid sodium ( ). Typically, is approximated to be equal to its solubility ( in
mol⋅m-3) in liquid sodium assuming a pure element i dissolved in sodium at thermodynamic equilibrium.
The is approximately equal to the measured concentration of element i in liquid sodium (Ci(t) in
mol⋅m-3 with t as time) [40]. However, as noted previously, this approach can be misleading if compounds
are formed between sodium and the solute.
For multicomponent alloys, the dissolution of different elements of the alloy will occur according to the
thermodynamics between the alloy and liquid sodium and their kinetics of dissolution. According to
Weeks et al., the measured corrosion rate represents the net sum of the rates of each of the many reactions
continuously occurring in the system as the reactants attempt to reach simultaneous equilibrium [43]. To
understand how corrosion of a multicomponent alloy occurs in liquid sodium, first, it is necessary to
review the literature on corrosion of pure elements in static and isothermal liquid sodium.
The corrosion of pure elements in liquid sodium is widely reported in the literature. The corrosion of pure
Zr, Ti, Nb, and Ta in liquid sodium containing up to 12 wt. % of oxygen was studied at 500, 550, and
600°C for durations of up to 576 h (24 days) in nickel crucibles. The corrosion products were
characterized using x-ray diffraction (XRD). After exposure, ternary and quaternary oxides (Na3NbO4,
Na3TaO4 Na4TiO4) were formed at the surface of the metal exposed to liquid sodium containing oxygen
[70, 83, 84]. These products led to the embrittlement of the transition metals (which all have high O
solubilities). It was also mentioned that the oxidation products might be washed away during the cleaning
procedure for the samples if care was not taken [67].
The corrosion of pure metals such as chromium and iron was investigated after exposure to liquid sodium
containing up to 6 wt. % oxygen at 600°C [34]. This study aimed to explain the variation in solubility
measurements observed in the literature for iron or chromium in liquid sodium. The authors explained
that a compound could form between iron or chromium and sodium and result in an increase in the
apparent solubility. The corrosion products were characterized using XRD without washing the samples
with alcohol or aqueous solvents after 168 h (1 week) and 336 h (2 weeks) at 600°C in sodium containing
between 20 ppm and 6.2 wt. % oxygen. The results identified NaCrO2 and Na4FeO3 corrosion products at
the surfaces of chromium and iron, respectively.
The corrosion of Mo and W was studied in static liquid sodium containing 1 and 3.5 wt. % oxygen and
carbon doped sodium (addition of charcoal or titanium carbide or steel tab), respectively, for periods of
48–576 h and temperatures between 400 and 650°C. The tests were performed in nickel crucibles. No
corrosion products were identified at the surfaces of the Mo samples (only NaO2). The W samples formed
Na3WO4 with oxygenated liquid sodium [71]. The corrosion of Mo was also studied in liquid sodium
doped with charcoal, doped with titanium carbide, or with a stainless steel tab inserted at 600°C for 384 h.
16In the presence of carbon in sodium, Mo2C was observed to form. The amount of Mo2C was a function of
the amount of carbon available in the source (stainless steel or charcoal) [71]. Similar to other elements,
the exposure of vanadium in oxygen-saturated sodium between 250 and 550°C led to the formation of
Na4VO4 [85].
Contrary to all of the other pure elements (Cr, Fe, Ta, Ti, Zr, W) studied, the corrosion of Mo was not
oxygen dependent. However, the formation of Mo2C in the presence of carbon in sodium might alter its
properties if it were used as a coating in SFRs.
Conclusions:
• Interaction between pure elements and sodium oxygen contents for up to 1,000 h and for
temperatures between 400 and 650°C were studied (summarized previously in Figure 4). The
compounds formed between pure elements and the sodium saturated with oxygen were identified
and were found to be mostly oxides.
4.3 CORROSION OF STRUCTURAL MATERIALS IN STATIC AND FLOWING LIQUID
SODIUM
As mentioned in section 3.3.1, dissolution of elements occurs when the chemical potential of element i in
the alloy is higher than the chemical potential of the same element in the liquid sodium. In this section,
the corrosion behavior of structural materials in static and flowing liquid sodium will be summarized.
Since highly alloyed steels and nickel-based alloys have not been widely used in SFRs the focus will be
mainly on conventional structural steels such as American Iron and Steel Institute (AISI) type 316
stainless steel or FM Grade 91 in static (reactor or capsule) or flowing sodium (TCL) experiments.
4.3.1 Corrosion of austenitic steels in static liquid sodium
For austenitic and ferritic steels, when the level of oxygen dissolved in liquid sodium is controlled under
10 ppm, two phenomena were observed during for the exposure of materials in liquid sodium. The first
step was defined as a transient state which corresponded to the dissolution of the native oxide layers
present on the surface of the samples. This step was observed to last for less than 24 h when the
temperature was lower than 370°C and for a few hours above 550°C [86]. The second step, dissolution,
was divided into two periods. The first period, was observed to last from several weeks at 600°C to about
300 h at 700°C and corresponded to the preferential dissolution of Ni, Cr, C, Si, and Mn [43]; sometimes,
less soluble Mo and Fe were observed to increase at the metal surface [48]. Some authors related the Mo
enrichment at the surface of the specimens to the formation of Fe7Mo6, Fe4Mo2C, or M6C (with M as Cr,
Mn, Fe, Ni or Mo) [42, 44, 45, 52]. For the austenitic steels, the chromium and nickel losses in the
austenite matrix led to the transformation of the austenite (FCC structure) into ferrite (BCC structure) [43]
and to the precipitation of sigma phase [52]. These processes occurred in the grains near the surface of the
specimen and at greater depths at the grain boundaries, as austenite is not stable below ~8% nickel and
~15% chromium. The formation of a ferrite layer is illustrated for type 316LN steels exposed in liquid
sodium at 550°C in Figure 7 from a secondary electron image and XRD measurements.
17You can also read