Riverine antibacterial resistance gradient determined by environmental factors
←
→
Page content transcription
If your browser does not render page correctly, please read the page content below
Riverine antibacterial resistance gradient determined by environmental factors
Cheng-Han Liu ( michaelliu103023055@gmail.com )
Kaohsiung Medical University https://orcid.org/0000-0003-0429-6892
Yi-Lynne Chuang
Kaohsiung Medical University
Revathi Gurunathan
Kaohsiung Medical University
Chi-Ying Hsieh
National Pingtung University of Science and Technology
Hans-Uwe Dahms
Kaohsiung Medical University https://orcid.org/0000-0002-0352-2715
Research Article
Keywords: Antibacterials, Antibacterial resistance, Wastewater treatment plant, Water pollution, Water quality, Risk assessment
Posted Date: September 28th, 2021
DOI: https://doi.org/10.21203/rs.3.rs-941400/v1
License: This work is licensed under a Creative Commons Attribution 4.0 International License. Read Full License
Page 1/19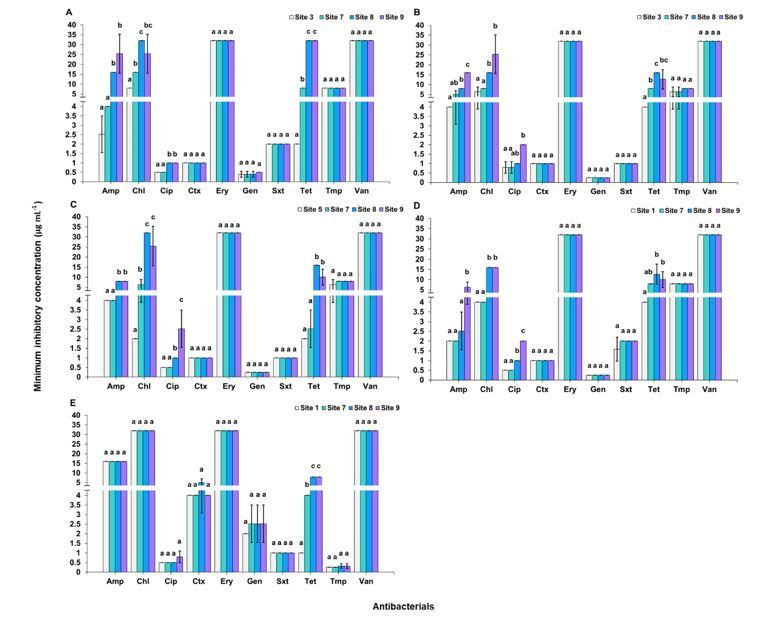
Abstract
Wastewater emission to surface waters is a major pathway for antibacterials and antibacterial-resistant bacteria. Polluted waterbodies such as rivers provide
a reservoir for bacterial resistance. We studied water quality and bacterial antibacterial resistance along the subtropical Qishan River in Taiwan as a case
study of environmental resistance spread in a pristine to rural area. Human settlement densities increased generally from pristine mountain sites to the more
polluted lowlands generally. Accordingly, as a working hypothesis, we expected antibacterial resistance level to increase towards downstream. We collected
sediment samples from 8 stations along the Qishan river and where the Qishan river reaches the Kaoping river. The samples were processed in the lab for
bacteriological and physicochemical analysis. Antibacterial resistance was tested by disk diffusion and micro-dilution with ten common antibacterials. A
comparison was made among the sites where isolates began to occur at the upstream (site 1-6) with the downstream, including site 7 (Qishan town), site 8
(wastewater treatment plant) and site 9 (Kaoping river). The results of multivariate analysis for bacteriological and physicochemical parameters showed
increasing water pollution levels downstream of the Qishan river. Ten bacteria including Escherichia coli, Klebsiella pneumoniae, Serratia marcescens,
Enterobacter sp., Acinetobacter sp., Staphylococcus spp. and Bacillus spp. were analyzed and tested in the study. Their percentage of occurrence varied at
each site. The resistance level was determined from the growth inhibition zone diameter (disk diffusion) and the minimum inhibitory concentration (micro-
dilution). The results indicated that antibacterial resistance was related to certain environmental factors. Besides, the usage pattern of different classes of
antibacterials in different places could alter trends of their resistance. Bacteria were found with increased resistance to antibacterials used in agriculture
through the downstream sites according to the results. The WWTP emitting wastewater was demonstrated to be a hotspot of resistance in aquatic
environments. In conclusion, bacterial resistance against antibacterials from the Qishan river has become a potential public health threat. This study could
assist authorities by providing a reference for water quality risk assessment and management in Kaohsiung city and southern Taiwan.

Introduction
Human health risks associated with microbial pathogens provide an increasingly serious environmental and public health problem along rivers, in estuaries,
and coastal zones which increased dramatically within a short time (Dahms 2018, Pereira et al. 2015). The most obvious ultimate sources of pathogens and
fecal indicators in the aquatic environment are humans, animals and wildlife in general. Around 1.1 billion people worldwide lack clean water and 2.4 billion
people had no access to sanitation in the late 2010s (Berendes et al. 2017). The more recent development and spread of antibacterial resistance is only one
aspect of water pollution and unsafety worldwide (Wi et al. 2017). The present approach towards these issues contains a comparison of supposedly less
contaminated places and highly contaminated places along a riverine gradient from highlands down to lowlands to understand real-time phenomena of
antibacterial resistance on site.

The causal relationship between an ever increasing human population density along water ways and aquatic environmental changes are well known. Human
health risks associated with resistant bacteria are providing serious problems (Allen et al. 2010, Dahms 2018, O’Neill 2014). The misuse or overuse of
antibacterials is a major cause of the development of resistant bacterial strains in normal as well as human pathogenic strains through evolutionary
processes in time (Bengtsson-Palme & Larsson 2016, Holmes et al. 2016). The emissions of antibacterials, antibacterial resistant bacteria, and resistance
genes into the aquatic environment cause antibacterial resistance among non-resistant bacterial communities for example through horizontal gene transfer by
transduction, transfection and translation (von Wintersdorff et al. 2016). The source of these pollutants in the aquatic environments could be derived from
domestic, clinical or industrial wastewater, or agricultural runoff. These wastewaters enter into water bodies and make surface waters, such as lakes and
rivers, receiving sinks and reservoirs for antibacterial resistance (Cheng et al. 2020, Jia et al. 2018, Laquaz et al. 2020, Vaz-Moreira et al. 2014) The occurrence
of antibacterial resistance is increasing in aquatic environments nowadays (Danner et al. 2019). Water from such reservoirs are commonly used as a drinking
water source for humans but also for livestock in agriculture or fish in aquaculture. They themselves are sources of food for humans. The transfer of resistant
bacteria from sewage sludge and manure to humans could ultimately occur via water or food (Danner et al. 2019, Ferri et al. 2017, Holmes et al. 2016).
Transmission of

resistance genes may occur within short periods of time so that antibacterial resistance would spread rapidly among bacterial communities.

The development and spread of antibacterial resistance are regarded as a universal threat of public health and environmental safety. It was predicted in a
recent study that 10 million people will die per year by 2050 due to antibacterial resistance (Danner et al. 2019). Some studies demonstrated the significance
of environmental settings such as water or soil as a pathway and reservoir for the spread of antibacterial resistance (Cheng et al. 2020, Rizzo et al. 2013,
Sidrach-Cardona et al. 2014). Previous studies found antibacterial resistant bacteria in different water bodies including rivers, estuaries, lakes, and coastal
waters. Water bodies are constantly exposed to environmental deterioration such as by wastewater pollution from domestic, agricultural, and industrial
sources (Laquaz et al. 2020, Rizzo et al. 2013). As knowledge about the pressure and spread of resistant bacterial strains or genes in drinking/ recreational
water of the coastal zone increases, new public health policies are providing awareness to academia and the public (W.H.O. 2015). Searching publicly
available databases, only a few data could be found from the main water bodies of Taiwan (Miftahussurur &Yamaoka 2015, Rizzo et al. 2013).

The level of resistance to antibacterials by normal and pathogenic strains was increasing at an alarming rate for several decades (Danner et al. 2019). Since
then, the uncontrolled use of pharmaceutical substances in industry, hospital, agriculture, and aquaculture has introduced several antibacterial to the aquatic
environment (Bengtsson-Palme &Larsson 2016, Ryu et al. 2019, Van den Meersche et al. 2020). The abuse of antibacterials imposes new evolutionary
pressure on non-pathogenic and pathogenic bacterial strains (Kummerer 2009b, a). In Taiwan, a large area of water bodies is used as a disposal and dumping
place for medicinal, aqua-/ agricultural, industrial, and domestic wastes. However, there are very few reports about antibacterial resistance in aquatic
ecosystems in Taiwan (Chang et al. 2007, Miftahussurur &Yamaoka 2015). The present study aims to identify and quantify bacterial antibacterial resistance
from riverine waters of southern Taiwan.

                                                                           Page 2/19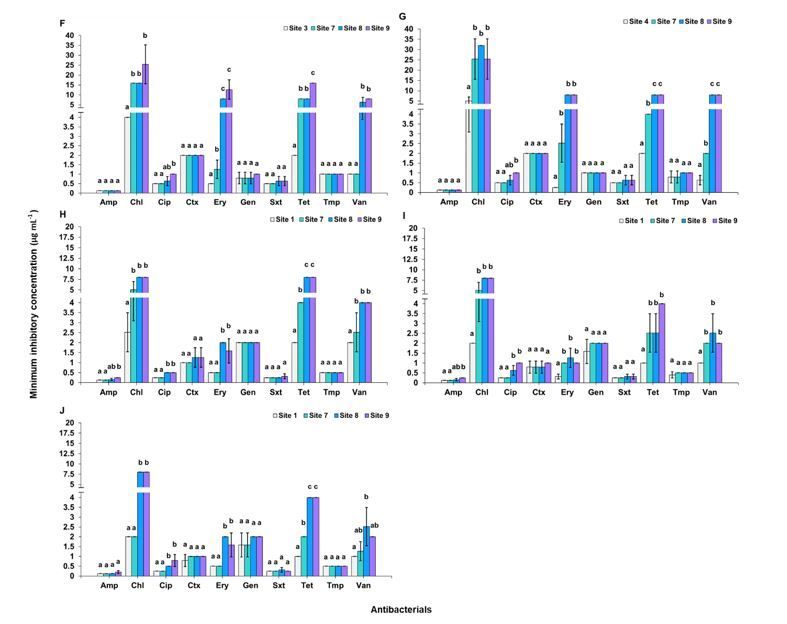
The Qishan river, also called the Nanzihsiian river, originates at the foothills of Yushan Mountain in Namasia, in the northeast of Kaohsiung city. The terrain
elevation varies greatly, with an average slope about 1/142 of the river bed. Due to fluvial erosion, the undercutting of the river bank has formed many cliffs
along the river. The river course is turbulent and meandering, flowing southwest for 65 km to the Jiasian district, where the channel begins to widen. It enters
plain and merges with the Laonong river into the Kaoping river in Qishan district. The Qishan river has atotal length of 118 km and a drainage basin area of
842 km2 (Yang 1997). Within the basin, agriculture dominates the socioeconomic structure with around 228.88 km2 total agricultural area. The following
administrative districts belong to the basin of the Qishan river: Namasia, Jiasian, Shanlin, Meinong, Qishan, Neimen, Taoyuan in Kaohsiung city, Alishan in
Chiayi county, and Ligang in Pingtung county. Qishan river is the main tributary of the Kaoping river, of which the basin area covers the coastal region of
Southern Taiwan. The upstream Qishan river fills the Nanhua Reservoir, which provides nearly 90% of the water supply for Tainan and Kaohsiung city. Its
downstream supplies waters for domestic, agricultural, and industrial needs of various respects. The Kaoping river supplies water for domestic, agricultural,
and industrial needs in Tainan city, Kaohsiung city, and Pingtung county (Yang 1997). Thus, the sanitation of the Qishan river could affects environmental and
public health greatly. The Qishan river system provides a gradient of presumably pristine waters and adjacent environments to heavily populated and polluted
areas where it discharges into the Kaoping river. From the river banks surface water is directly used for agricultural irrigation and drinking water supplies to
husbandry. Since this provided health issues, we studied physicochemical properties and antibacterial resistance from the Qishan river. We collected eight
sediment samples along the Qishan river and one at the confluence of the Qishan river and the Kaoping river.

The human population, settlement density, and husbandry area generally increase from pristine mountains to more polluted lowlands (Wang et al. 2019), so in
the Qishan river catchment area. The upstream sampling sites (sites 1–6) belong to rural Namasia, Jiasian, and Shanlin districts with fewer human activities.
We performed a physicochemical and bacteriological study to assess the water quality. From the results we could compare pollution extent among the
sampling sites. Since the emitted water is from villages and towns with higher population densities in the Qishan district. The isolates from Qishan river are
suspected to be more resistant (Hultman et al. 2018, Proia et al. 2018, Xu et al. 2015).

This study focusses on Qishan river water quality and bacterial antibacterial resistance from river samples. We obtained first-hand data about potential
pathogenic resistant bacteria from the sampling sites. With the above aspects in view, detailed investigations of the research were pursuing the following
objectives: to identify bacterial strains that represent communities with morphological and biochemical methods, to analyze physicochemical and
bacteriological parameters, to perform a risk assessment and qualitative analysis, to compare antibacterial

resistance levels among isolates from different sampling sites. We hypothesize an increase in the level of antibiotic resistance towards downstream.

Materials And Methods
Sample collection

We collected sediment samples at 9 sites along the Qishan river, from close to its source at the foot of Yushan Mountain (Xu et al. 2015) to its confluence with
the Kaoping river (22°47'35.5"N 120°27'46.9"E (Google) in September 2019. The coordinates and GPS information were recorded from the Google map
application ver. 10.39. 1. Sites 1-6 belong to the Qishan river upstream, sites 7-9 belong to the downstream (Fig. 1). Sampling was performed at about 10 km
intervals on average along the course of the Qishan river, where it could be accessed at bridges or trails (Table S1). At each sampling site, we obtained water
samples by using 1-liter sterile disposable bottles. Samples were stored at 4 ℃ and processed within 12 hours of collection (Moore et al. 2010, Vignesh et
al. 2014, Vignesh et al. 2012). All samples were collected with precautions required for sterile microbiological sampling and personal protection.

Water quality testing

In this study, physicochemical and bacteriological parameters were included in the water quality analysis. First, we obtained the data of physicochemical
parameters by instruments and bacteriological parameters by microbiological methods. And then we analyzed their variation along the river to see the
pollution level change. Finally, we used these results for a multivariate analysis to detect possible interactions.

The physicochemical analysis of the water is assessed using several parameters amenable to water quality assessment. These are temperature, pH,
conductivity, total dissolved solids, salinity, dissolved oxygen and biological oxygen demand. Temperature (Temp.) and potential of hydrogen (pH) were
measured by immersing a portable sensor PH200 (CLEAN Instruments) into the field river water, conductivity (conduct.), total dissolved solids (TDS) and
salinity (Sal.) by CON200 (CLEAN Instruments), dissolved oxygen (DO) by DO200 (CLEAN Instruments). After 3-5 minutes of immersion, each of these devices
was removed for reading of the results. Biological

oxygen demand (Lee &Nikraz 2015) was tested within 12 hours after sampling in the laboratory following a standard method (Baird 2017).

Bacterial strains were isolated and identified, and then used for antibacterial resistance testing. Bacterial numbers were estimated in each water sample by
employing a plate count method. Samples were diluted to 10-2 with autoclaved river water and 100 μL of the sample solutions were spread on different agar
media of Petri dishes. The isolation of bacteria was made using different growth media such as Nutrient agar for total colony counts and mostly present
isolates, MacConkey agar for coliforms such as E. coli and Enterobacteriaceae, and Mannitol salt agar for Staphylococcus spp. Bacterial counts were used as
indicators for water quality. The representation, which is the occurrence ratio of each isolate, was also calculated since previous studies have documented that
polluted waters could impact the bacterial community composition (Lu et al. 2017, Tang et al. 2016).

The spread plates were incubated at 35 °C for 16-18 hours. Bacterial colonies were then developed and colony forming units (CFUs) were then counted from
single bacterial cell counts. From each agar we told the difference among the colonies by their characteristics (color, size, texture, or borders etc.) (Table 2).

                                                                            Page 3/19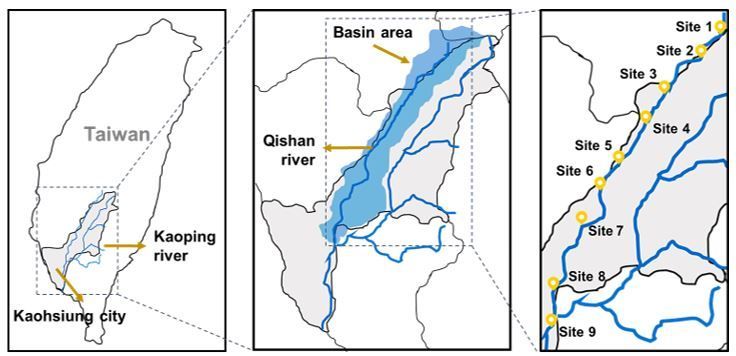
This way the number of viable counts per sample unit and their density within the original sample were calculated and expressed as the number of colony
forming units (CFUs) per 1 mL of the sample. Our first steps were sub-culturing and isolating morphologically different CFUs until pure, uncontaminated
cultures were obtained, followed by DNA extraction from bacterial cells. For 16S rRNA identification, genomic DNA extraction was performed using the
GeneJET Genomic DNA Purification Kit (Thermo Scientific, Waltham, MA, USA). After DNA extraction, we checked whether the isolation was successful and
verified its presence by 0.8% agarose gel electrophoresis. Then Polymerase chain reaction (PCR) was performed in 50 µL volume which consisted of 1 × Taq
buffer, 0.2 mM of dNTP mix each, 1 µM of each of the reverse and forward primers, 100 ng template DNA, 1.25 U Taq DNA polymerase (New England Biolabs)
and sterile distilled water. The two universal primers (27F 5’-AGAGTTTGATCCTGGCTCAG3’; and 1492R: 5’-GGTTACCTTGTTACGACTT-3’) were used to amplify
the 16S rRNA gene sequence. The following cycling conditions were used: initial denaturation 95 °C for 5 mins, 35 cycles of 95 °C for 1 min, 55 °C for 1 min,
72 °C for 1 min and 40 secs, and final elongation at 72 °C for 10 min. For purification the GeneJet PCR purification kit (Thermo Scientific, Waltham, MA, USA)
was used. Finally, unknown sequences were compared

with reference sequences from the NCBI database by BLAST-analysis to identify the bacterial strains. Gene sequences were aligned using the software Clustal
W ver. 1.83. The gene sequences of strains were analyzed in the National Center for Biotechnological Information (NCBI) and an accession number is in the
process of being obtained.

Multivariate statistics such as principal component analysis (PCA) have been used to demonstrate some of the variation in different samples. PCA has been
adopted in a variety of scientific studies for simplifying a large volume of datasets containing several variables, e.g., the physicochemical characterization of
surface water (Tanor et al. 2014), wastewater sludge (Tanor et al. 2016), different animal manures (Nnamdi et al. 2017) and rainwater (Wu et al. 2017a, Wu et
al. 2017b). PCA identifies groups and sets of variables with similar properties and allows us to make our description of observations straightforward by
discovering the trends or patterns in chaotic or confusing datasets. Our study concerned the characterization of river water from different sampling sites and
the simultaneous analysis of physicochemical and bacteriological parameters.

Antibacterial resistance tests

To evaluate the antibacterial resistance of environmental bacteria in this study, we adopted two approaches, disk diffusion and broth micro-dilution as
recommended by the CLSI (CLSI 2018). Isolated colonies of the same morphological type from an agar plate were suspended in 5 mL broth medium. The
inoculated culture was incubated at 35 °C until it was harvested once its turbidity reached or exceeded an optical density (O.D.) at 600nm of 0.4-0.6 (being
equivalent to 1–2*108 colony forming unit mL-1). Cell population growth was at the log phase when harvested. The following 10 common antibacterials were
tested in this study: ampicillin, cefotaxime, chloramphenicol, ciprofloxacin, erythromycin, gentamicin, tetracycline, trimethoprim,
trimethoprim/sulfamethoxazole and vancomycin (all antibacterials were supplied by Sigma-Aldrich). They were dissolved in their respective solvents and
diluted in their specific diluents (Table S2). And then they were sterilized by syringe filters (Sigma-Aldrich). We evaluated the resistance by inhibition zone of
disk diffusion and minimum inhibitory concentration (MIC) of micro-dilution (Jorgensen &Turnidge 2015). Breakpoints of susceptibility, intermediate
resistance and complete resistance were based on CLSI criteria (CLSI 2018). For the results of downstream

samples, which were found significantly different from upstream, and reaching the breakpoints of above intermediate resistance would be considered as
increase of resistance.

For disk diffusion, we charged a sterile cotton swab with inoculum suspension and inoculated the surface of a Mueller-Hinton agar plate (Sigma-Aldrich) by
streaking the swab in a back-and-forth motion. The plate was then rotated by 90° and the streak action was repeated for 4 times to ensure an even distribution
of the inoculum. After the plate inoculation, we placed the antibacterial- impregnated disks onto the surface of the agar with forceps, which were tested at the
indicated concentrations: ampicillin (10µg), cefotaxime (30µg), chloramphenicol (30µg), ciprofloxacin (5µg), erythromycin (15µg), gentamicin (10µg),
tetracycline (30µg), trimethoprim (5µg), trimethoprim/sulfamethoxazole (1.25/23.75µg) and vancomycin (30µg). Negative controls were prepared by using
blank disks with double-distilled water and ensuring that there was no inhibition zone around the control disk. Once all disks were inoculated, they were
incubated at 35 °C for 16 to 18 hours. Following the incubation, the inhibition zone diameters were measured to the nearest millimeter by a ruler and recorded
on sheets. The longer the diameter, the more effective the respective antibacterial was in the prevention of bacterial growth. All the tests were done in
triplicate (Hudzicki 2009).

We performed the micro-dilution method on 96-well plates. There was a total of 200 µL volume in each well. An aliquot of 20 µL with an O.D. 600 of 0.4-0.6
inoculum suspension was added to all the wells except the negative control. Column 11 wells, the positive control, carried inoculated broth; and column 12
wells, as the negative control, carried broth only. Column 1-10 wells contained 180 µL of the 10 different antibacterials dissolved in Mueller-Hinton broth
(Sigma-Aldrich). The range of antibacterial concentration in each well was 0.25–32 µg mL-1 (except for ampicillin, 0.125–16 µg mL-1), totally 8 two-fold serial
concentrations of an antibacterial were dispensed to a single row. The plates were incubated for 12 to 13 hours at 35 °C. Resazurin dye (Sigma-Aldrich) of an
amount of 20 µL was added to each well and the plates were then incubated for 3-4 more hours. Living bacteria are maintaining a reducing microenvironment
within their cells. This environment could cause the Resazurin color to change from blue (the oxidized-form) to red (the reduced form). Resazurin was prepared
at 0.01%, sterilized with a syringe filter, and stored at 4 °C. The well of the dilution that showed no color changes (blue) at the antibacterial concentration was
determined as the minimum inhibitory concentration (MIC) value. MIC is the lowest concentration of an antibacterial to inhibit visible

bacterial growth. Bacterial cell viability could be measured by absorbance at 600 nm using a spectrophotometer. A higher absorbance value indicated more
viable cells which coincided with the color change. All the tests were done in triplicates (Herbst et al. 2014).

                                                                            Page 4/19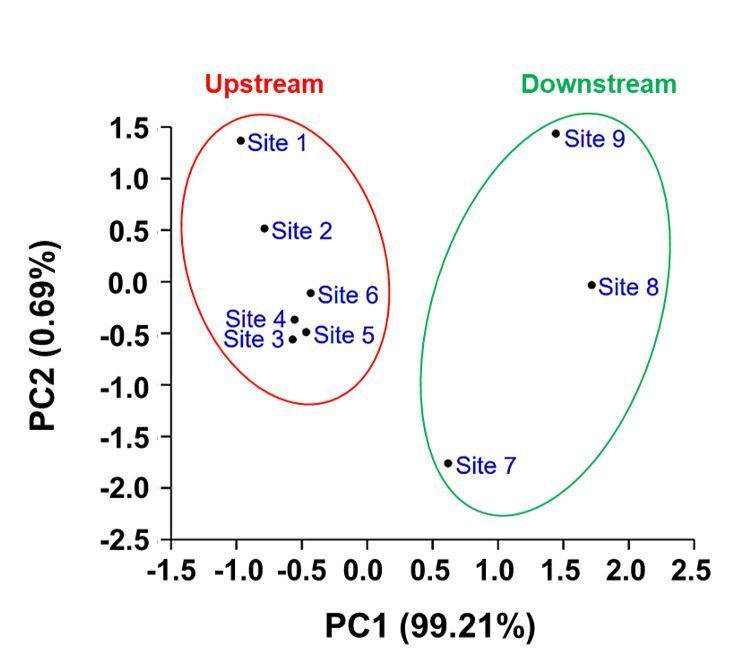
Statistical analysis

Statistical tests were initially performed using Microsoft office Excel ver. 2016. The physicochemical and bacteriological parameters were analyzed by
Principal Component Analysis (PCA) mean values of samples in PAST ver. 4.03. A one-way analysis of variance (ANOVA) in R Studio Desktop ver. 3.5.1. was
used to analyze the results of inhibition zones and MICs. MICs were expressed as geometric mean. For statistical evaluations, MIC data were log-transformed
(log2MIC) and calculated. Results were considered as statistically significant at p < 0.05.

Results
The results of water quality tests indicated different pollution levels between the upstream and the downstream. It showed different variation patterns of
physicochemical and bacteriological parameters along the watercourse. According to the PCA results, we found different degrees of pollution among the
sampling sites.

Physicochemical parameters

Overall there was an increasing trend of temperature, conductivity, TDS, salinity and BOD values in the downstream. While pH and DO values went in an
opposite trend. Temperature values gradually increased at downstream, it ranged from 20°C to 25°C in the upstream and from 25°C to 30°C in the
downstream. For conductivity, TDS, salinity and BOD, the mean values slightly varied in the upstream from site 1 to site 6 (conduct. = 244.00 ─ 362.00 μS cm-
1
 , TDS = 120.20 ─ 174.00 mg L-1, Sal. = 128.67 ─ 210.33 mg L-1, BOD = 0.20 ─ 0.33 mg L-1). For each of these values, there was a substantial increase in the
downstream from site 7 to site 9 (conduct. =

557.33 ─ 758.33 μS cm-1, TDS = 303.33 ─ 419.33 mg L-1, Sal. = 381.67 ─ 519.00 mg L-1, BOD = 0.97 ─ 1.27 mg L-1). pH values were > 8.00 in the upstream
and < 8.00 in the downstream. The DO were > 8.00 mg L-1 in the upstream and < 8.00 mg L-1 in the downstream (Table 1.1).

Bacteriological parameters

A total of 5 bacterial species were predominantly isolated and from samples inoculated on nutrient agar: Bacillus subtilis (B. subtilis), Bacillus megaterium (B.
megaterium), Bacillus cereus (B. cereus), Acinetobacter sp. and Serratia marcescens (S. marcescens); Enterobacteriaceae including Escherichia coli (E.
coli), Klebsiella pneumonia (K. pneumonia), Enterobacter sp. and S. marcescens were isolated on MacConkey agar; Staphylococcus aureus (S. aureus) and
Staphylococcus epidermidis (S. epidermidis) were isolated on Mannitol salt agar. Bacillus species, Acinetobacter sp. and S. marcescens began to occur at site
1, E. coli and K. pneumonia and S. aureus at site 3, S. epidermidis at site 4 and Enterobacter sp. at site 5. For abundance analysis, we calculated total viable
counts (TVC), total Enterobacteriaceae (TE), total coliforms (TC), E. coli (EC), total Staphylococcus (TS), Acinetobacter sp. (AB) and total Bacillus (TB). As for
representation analysis, we calculated the proportion of total Enterobacteriaceae (TEP), total coliforms (TCP), E. coli (ECP), total Staphylococcus (TSP),
Acinetobacter sp. (ABP) and total Bacillus (TBP) (Table 1.2).

We present here the abundances of different bacteria or bacterial groups at different sampling sites. There was an increasing trend of CFU numbers for TVC,
TE, TC and each of these bacteria in the downstream. Compared with the site where the bacteria or bacterial groups began to occur in the upstream (TVC =
4.35 × 10⁴ CFU mL-1, TE = 4.48 × 10³ CFU mL-1, TC = 3.46 × 10³ CFU mL-1, EC = 2.45 × 10³ CFU mL-1, TS = 2.45 × 10³ CFU mL-1), the mean values slightly
increased at site 6 (TVC = 7.82 × 10⁴ CFU mL-1, TE = 1.37 × 10⁴ CFU mL-1, TC = 7.11 × 10³ CFU mL-1, EC = 3.11 × 10³ CFU mL-1, TS = 5.65 × 10³ CFU mL-1). For
TVC, TE, TC, EC and TS, there were substantial increases of the values from site 6 to site 7 (TVC = 1.66 × 10⁵ CFU mL-1, TE = 3.06 × 10⁴ CFU mL-1, TC = 1.73 ×
104 CFU mL-1, EC = 8.76 × 10³ CFU mL-1, TS = 9.38 × 10³ CFU mL-1), and from site 7 to site 8 (TVC = 3.27 × 10⁵ CFU mL-1, TE = 6.46 × 10⁴ CFU mL-1, TC = 3.89
× 104 CFU mL-1, EC = 1.75 × 10⁴ CFU mL-1, TS = 2.53 × 10⁴ CFU mL-1). At site 9, the values were close to site 8 (TVC = 3.27 × 10⁵ CFU mL-1, TE = 6.32 × 10⁴
CFU mL-1, TC = 3.87 × 10⁴ CFU mL-1, EC = 1.82 × 10⁴ CFU mL-1, TS = 2.65 × 10⁴ CFU mL-1). The AB and TB increase gradually. AB ranged from 8.08 × 10³ CFU
mL-1 to 1.12 × 10⁴ CFU mL-1 in the upstream and from 1.67 × 10⁴ CFU mL-1 to 2.63 × 10⁴ CFU mL-1 in the downstream. TB ranged from 1.88 × 10⁴ CFU mL-1 to
3.05 × 10⁴ CFU mL-1 in the upstream and from 4.61 × 10⁴ CFU mL-1 to 7.04 × 10⁴ CFU mL-1 in the downstream. For representations of different bacteria or
bacterial groups at different

sampling sites, TBP maintained the highest value of the community along the river. Compared with site 1 (ABP = 18.59 %, TBP = 43.25 %), the mean values of
ABP and TBP slightly decreased at site 6 (ABP = 14.25 %, TBP = 38.91 %). There was a substantial decrease of ABP and TBP from site 6 to site 7 (ABP = 10.06
%, TBP = 27.76 %) and from site 7 to site 8 (ABP = 7.28 %, TBP = 21.12 %). At site 9, the value was close to site 8 (ABP = 8.04 %, TBP = 21.54 %). Compared
with the site where the bacteria or bacterial groups began to occur in the upstream (TEP = 10.31 % ─ 17.52 %, TCP = 5.68 % ─ 9.09 %, ECP = 3.97 % ─ 4.43 %,
TSP = 4.43 % ─ 7.22 %), TEP, TCP, ECP, and TSP overall maintained the values in the downstream (TEP = 18.46 % ─ 19.73 %, TCP = 10.42 % ─ 11.88 %, ECP =
5.28 % ─ 5.55 %, TSP = 5.65 % ─ 8.11 %).

                                                                           Page 5/19
Principal components analysis
River water was characterized by 7 physicochemical parameters and 13 bacteriological parameters. The PCA analysis showed that of the 20 components, the
first principal components accounted for 99.21%, while the second, third, fourth and fifth principal components accounted for 0.69%, 0.05%, and 3.83%,
respectively (Table S4). Here we present a scatter plot consisting of PC1 and PC2 (Fig. 2). It demonstrates two clusters, one accommodates the samples which
are from the upstream (Upstream cluster), while the other comprises those from the downstream (Downstream cluster). The two clusters differ in dispersion.
The distribution of the 3 samples in the Downstream cluster are more dispersed than those in the Upstream cluster. This finding might imply that the pollution
scenarios are similar among the sampling sites in the upstream but varied among the 3 sites downstream. Thus, for the following antibacterial resistance
tests, we decided to make a comparison among 4 sites: a site where the isolate began to occur at the upstream of Qishan river, compared to the following
downstream sites: Qishan town (site 7), WWTP (site 8) and Kaoping river (site 9).
Antibacterial resistance tests
Resistance level could be indicated by zone diameter in disk diffusion and MIC in micro-dilution. For each antibacterial activity on bacteria, resistance level
that significantly increased and reached the breakpoints of above intermediate resistance were considered as increased resistance (Table 3). The results
showed variable patterns of antibacterial resistance levels among sampling sites along the watercourse. Most increased resistance occurred at site 8 and site
9. Overall, the two methods showed that there were mainly 5-6 types of antibacterials showing increased resistance with bacteria in the downstream.
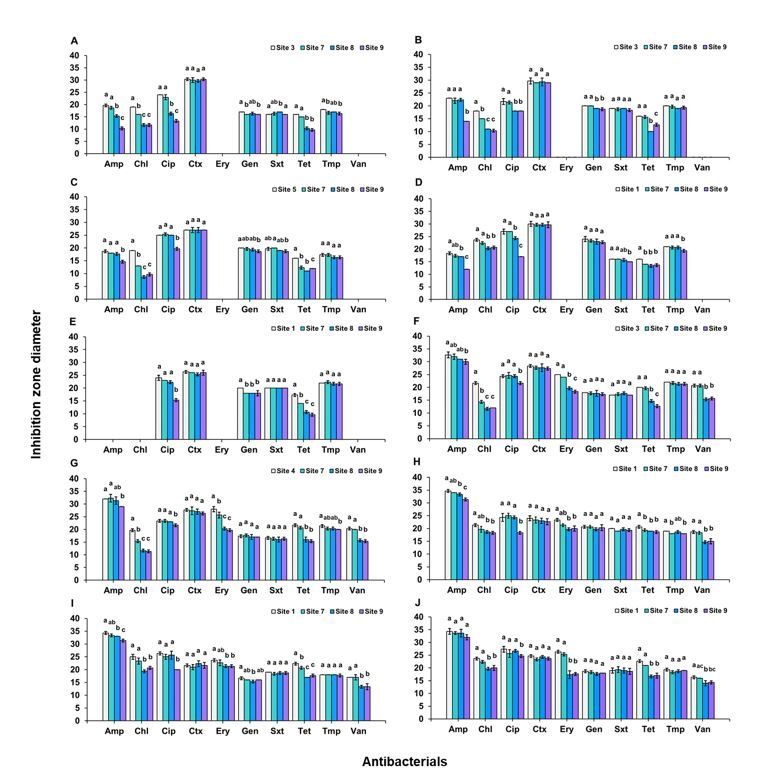
Disk diffusion
Fig. 3 shows the results of disk diffusion. All comparisons were made between a site where the isolate began to occur in upstream and sites in downstream.
For E. coli, by comparison with site 3, increased resistances were found with ampicillin (p < 0.0001), chloramphenicol (p < 0.0001), ciprofloxacin (p < 0.0001)
and tetracycline (p < 0.0001). Site 7 showed smaller inhibition zones with chloramphenicol. Both sites 8 and 9 showed smaller inhibition zones with ampicillin,
chloramphenicol, ciprofloxacin and tetracycline (Fig. 3A). For K. pneumonia, by comparison with site 3, increased resistances were found with ampicillin
(p < 0.0001), chloramphenicol (p < 0.0001), ciprofloxacin (p < 0.0001), and tetracycline (p < 0.0001). Site 7 showed smaller inhibition zones with
chloramphenicol. Site 8 showed smaller inhibition zones with chloramphenicol, ciprofloxacin and tetracycline. Site 9 showed smaller inhibition zones with
ampicillin, chloramphenicol, ciprofloxacin, and tetracycline (Fig. 3B). For Enterobacter sp., by comparison with site 5, increased resistances were found with
ampicillin (p < 0.0001), chloramphenicol (p < 0.0001), ciprofloxacin (p < 0.0001) and tetracycline (p < 0.0001). Both sites 7 and 8 showed smaller inhibition
zones with chloramphenicol and tetracycline. Site 9 showed smaller inhibition zones with ampicillin, chloramphenicol, ciprofloxacin and tetracycline (Fig.
3C). For S. marcescens, by comparison with site 1, increased resistances were found with ampicillin (p < 0.0001),
ciprofloxacin (p < 0.0001), trimethoprim/ sulfamethoxazole (p < 0.0001), and tetracycline (p = 0.0002). Site 7 showed smaller inhibition zones with
tetracycline. Site 8 showed smaller inhibition zones with tetracycline. Site 9 showed smaller inhibition zones with ampicillin,
ciprofloxacin, trimethoprim/ sulfamethoxazole and tetracycline (Fig. 3D). The zone diameter breakpoints of Enterobacteriaceae were recommended by
CLSI (CLSI 2018) (Table S7.1).
For Acinetobacter sp., by comparison with site 1, increased resistance was found with ciprofloxacin (p < 0.0001) and tetracycline (p < 0.0001). Both sites 7 and
8 showed smaller inhibition zones with tetracycline. Site 9 showed smaller inhibition zones with ciprofloxacin and tetracycline (Fig. 3E). The zone diameter
breakpoints of Acinetobacter spp. were recommended by CLSI (CLSI 2018) (Table S7.2).
For S. aureus, by comparison with site 3, increased resistances were found with chloramphenicol (p < 0.0001), erythromycin (p < 0.0001) and tetracycline
(p < 0.0001). Site 7 showed smaller inhibition zones with chloramphenicol. Both sites 8 and 9 showed smaller inhibition zones
with chloramphenicol, erythromycin and tetracycline (Fig. 3F). For S. epidermidis, by comparison with site 4, the increased resistances were found with
chloramphenicol (p < 0.0001), erythromycin (p < 0.0001) and tetracycline (p < 0.0001). Site 7 showed smaller inhibition zones with chloramphenicol. Both sites
8 and 9 showed smaller inhibition zones with chloramphenicol, erythromycin and tetracycline (Fig. 3G). The zone diameter breakpoints
of Staphylococcus spp. were recommended by CLSI (CLSI 2018) (Table S7.3).
For B. megatium, by comparison with site 1, the increased resistances were found with ciprofloxacin (p = 0.0001), erythromycin (p = 0.0008) and tetracycline
(p = 0.0056). Both sites 7 and 8 showed smaller inhibition zones with erythromycin. Site 9 showed smaller inhibition zones with ciprofloxacin, erythromycin
and tetracycline (Fig. 3H). For B. cereus, by comparison with site 1, the increased resistances were found with ciprofloxacin (p = 0.0001),
erythromycin (p = 0.0147) and tetracycline (p < 0.0001). Site 8 showed smaller inhibition zones with erythromycin and tetracycline, site 9 showed smaller
inhibition zones with ciprofloxacin, erythromycin and tetracycline (Fig. 3I). For B. subtilis, by comparison with site 1, the increased resistances were found with
erythromycin (p < 0.0001) and tetracycline (p < 0.0001). Both sites 8 and 9 showed smaller inhibition zones with erythromycin and tetracycline (Fig. 3J). The
zone diameter breakpoints of Bacillus spp. were recommended by CLSI (CLSI 2018) (Table S7.4).
Micro-dilution
Fig. 4 shows the results of micro-dilution. All comparisons were made between a site where the isolate began to occur in upstream and sites in downstream.
For E. coli, by comparison with site 3, increased resistances were found with ampicillin (p < 0.0001), chloramphenicol (p = 0.0001) and tetracycline
Page 6/19(p < 0.0001). Site 7 showed higher MICs with chloramphenicol and tetracycline. Both sites 8 and 9 showed higher MICs with ampicillin, chloramphenicol and
tetracycline (Fig. 4A). For K. pneumoniae, by comparison with site 3, increased resistances were found with ampicillin (p = 0.0001), chloramphenicol
(p = 0.0012), ciprofloxacin (p = 0.0118) and tetracycline (p = 0.0001). Site 8 showed higher MICs with chloramphenicol and tetracycline. Site 9 showed higher
MICs with ampicillin, chloramphenicol, ciprofloxacin and tetracycline (Fig. 4B). For Enterobacter sp., by comparison with site 5, increased resistances were
found with ampicillin (p < 0.0001), chloramphenicol (p < 0.0001), ciprofloxacin (p < 0.0001) and tetracycline (p < 0.0001). Site 8 showed higher MICs with
ampicillin, chloramphenicol and tetracycline. Site 9 showed higher MICs with ampicillin, chloramphenicol, ciprofloxacin and tetracycline (Fig. 4C). For S.
marcescens, by comparison with site 1, increased resistances were found with chloramphenicol, ciprofloxacin and tetracycline. Site 7 showed higher MICs
with tetracycline. Site 8 showed higher MICs with chloramphenicol and tetracycline. Site 9 showed higher MICs with chloramphenicol (p < 0.0001),
ciprofloxacin (p < 0.0001) and tetracycline (p = 0.0054) (Fig. 4D). The MIC breakpoints of Enterobacteriaceae were recommended by CLSI (CLSI 2018) (Table
S7.1).
For Acinetobacter sp., by comparison with site 1, the increased resistance was found with tetracycline. Both sites 8 and 9 showed higher MICs with
tetracycline (p < 0.0001) (Fig. 4E). The MIC breakpoints of Acinetobacter spp. were recommended by CLSI (CLSI 2018) (Table S7.2).
For S. aureus, by comparison with site 3, the increased resistances were found with chloramphenicol (p < 0.0001), erythromycin (p < 0.0001), tetracycline
(p < 0.0001) and vancomycin (p < 0.0001). Site 7 showed higher MICs with chloramphenicol, erythromycin and tetracycline. Both sites 8 and 9 showed higher
MICs with chloramphenicol, erythromycin, tetracycline and vancomycin (Fig. 4F). For S. epidermidis, by comparison with site 4, increased resistances were
found with chloramphenicol (p < 0.0001), erythromycin (p = 0.0006), tetracycline (p < 0.0001) and vancomycin (p < 0.0001). Site 7 showed higher MICs with
chloramphenicol and erythromycin. Both site 8 and site 9 showed higher MICs with chloramphenicol, erythromycin, tetracycline and vancomycin (Fig. 4G). The
MIC breakpoints of Staphylococcus spp. were recommended by CLSI (CLSI 2018) (Table S7.3).
For B. megatium, by comparison with site 1, the increased resistances were found with erythromycin and tetracycline. Both site 8 and site 9 showed higher
MICs with erythromycin (p = 0.0012) and tetracycline (p < 0.0001) (Fig. 4H). For B. cereus, by comparison with site 1, the increased resistances were found
with erythromycin (p = 0.0013). Sites 7, 8 and 9 showed higher MICs with erythromycin (Fig. 4I). For B. subtilis, by comparison with site 1, the increased
resistances were found with erythromycin (p < 0.0001). Both sites 8 and 9 showed higher MICs with erythromycin (Fig. 4J). The MIC breakpoints
of Bacillus spp. were recommended by CLSI (CLSI 2018) (Table S7.4).
Discussion
Physicochemical analysis
Rivers act as important bodies of surface water, playing an essential role in the water cycle. They are polluted by the disposal of sewage and wastewater from
human activities, which severely impact the physicochemical characteristics and bacterial communities. The results of physicochemical analysis showed
differences in the degree of pollution between the upstream and downstream of Qishan river. Temperature could affect not only the physical and chemical
properties of water but also the biological activities. Possibly due to the sea level, the temperature values in the downstream increased. The values of pH
variation towards acidity in the downstream could be attributed to the anthropogenic activities or acidic precipitation (Singh et al. 2016, Wu et al. 2017b).
Conductivity, TDS and salinity could correlate with each other (Rusydi 2018). They have been used to evaluate the purity of water. Their values substantially
increased in the downstream, which might have implied the more dissolved salts and minerals within the river water. The presence of DO is essential to
maintain the aquatic ecosystem and to keep the water bodies healthy from various pollutants. Decreased DO in the downstream might have been caused by
the decreased solubility of oxygen at higher temperature. BOD could represent the amount of biodegradable organic matters (Lee &Nikraz 2015). The values
increased in the downstream, indicating the higher pollution degree of organics in the river water.
Bacteriological analysis
Parameters such as TVC, TE, TC and EC and sometimes TS have been used as water quality indicators (Britz et al. 2013, Curtis et al. 2011, Rahmani et
al. 2020). Their presences in water bodies were associated with contamination. And they increased substantially from site 6 to site 7, which was the transition
from upstream to downstream where agricultural activity and human settlement grow considerably. And these parameters increased substantially again from
site 7 to site 8 where the river water received the WWTP effluent. The increase of TVC, TE, TC and EC and TS implied the impact of pollution on river water.
Though AB and TB were not usual indicators, they are ubiquitous in natural environments (Adegoke et al. 2012, Baruzzi et al. 2011). In the bacterial
enumeration, we commonly found and thus included them in bacteriological parameters. The AB and TB increase from upstream to downstream gradually.
Different from those indicators, their counts were maintained in higher values from site 1 to site 6. It is somehow related to their ubiquity in the more pristine
upstream. Though most bacteriological analyses take only bacterial enumeration as parameters, bacterial representation could provide information for water
quality since contamination could alter the bacterial community (Lu et al. 2017, Tang et al. 2016). ABP and TBP decreased substantially from site 6 to site 7,
which was the transition from upstream to downstream where agricultural activity and human settlement grow considerably. Both of them decreased
substantially again from site 7 to site 8 where the river water received the WWTP effluent. As more polluting bacterial species brought into river water with the
effluent, the values of ABP and TBP decreased. TEP, TCP, ECP and TSP maintained their values under the circumstance of the increase of TVC in the
downstream. It is consistent with the fact that TE, TC and EC increased as TVC increased. In other words, the increase of TE, TC and EC could have somehow
contributed to the increase of TVC.
Page 7/19Principal component analysis
Principal Component Analysis (PCA) is one of the most applied approaches in environmental sciences to study data. It is aimed at finding and interpreting
hidden complex and casually determined relationships between dataset features. This is accomplished by studying the data structure in a reduced dimension
while retaining the maximum of variability present in the data. To do this, it is necessary to estimate the number of significant components present in the data.
More precisely, a matrix of pairwise correlations among parameters is decomposed into eigenvectors. These eigenvectors are sorted in descending order of
their corresponding eigenvalues. The eigenvalue of PC1 overwhelms those of the other PCs (Table 2). All variables are well represented by the first
components, PC1. Thus, we focused mainly on the first principal components that explain nearly 100.0% of the total variance of the dataset. Since most
variables contributed to the first eigenvector, the first principal component can be interpreted as all of the parameters which are positively or negatively and
highly correlated with each other. The downstream generally receives lots of polluted water from human settlement. The more it receives, the more pollutants
(e.g. organics, heavy metals, nutrients, salt ions, coliforms, pathogens) be brought into river water. And for that the physicochemical parameters value change
simultaneously as pollution happens. Though there is no cause-and-effect relationship between the parameters, they still strongly correlated with each other.
Such case could lead to high percentages of variance which can be explained by PC1. And this might cause a considerable disparity in the eigenvalue for PC1
and the other PCs (Abdi &Williams 2010). The scatter plots (Fig. 2) indicated a different dispersion patterns within the Upstream and Downstream clusters.
The 6 upstream sampling sites are relatively pristine with nearly no pollution effect, and thus their status is close to each other, whereas the 3 downstream
sampling sites are relatively separated. While the downstream sampling site 7 receives water from the town of Qishan, site 8 receives water from the Qimei
wastewater treatment plant (WWTP) effluents, and site 9 locates at the Kaoping river receiving water from the Qishan river and the other tributaries. Thus these
sampling sites are supposed to have a different pollution status. For the above results, we compared the antibacterial resistance between site 7 to 9 with only
one site from upstream since sites 1 to 6 shared a similar status.
Antibacterial resistance tests
Previous researches have documented intrinsic bacterial resistance to antibacterials (Cox &Wright 2013). Natural resistance recommended by
CLSI (CLSI 2018) could be shown in the results of this study. All the Enterobacteriaceae had intrinsic resistance against erythromycin and vancomycin. As for
Acinetobacter sp., there were ampicillin, chloramphenicol, erythromycin and vancomycin. Although antibacterial resistance is a natural phenomenon as a
mechanism of bacteria for better competitiveness, the exposure of bacteria to selective pressure results in the emergence and spread of antibacterial
resistance (Fonseca et al. 2015, Pereira et al. 2015).
Overall, chloramphenicol, erythromycin and tetracycline were found to show increased resistance on bacteria along the downstream including sites 7 to 9. In
rural areas such as Qishan, agriculture and husbandry are important segments of the economy, and waste from these sectors represents an additional
potential source of contamination with antibacterials used for farming. Due to the high oral bioavailability and ability to accumulate in many tissues and
organs, chloramphenicol, erythromycin and tetracycline were widely used in veterinary practices to prevent and treat diseases in swine, poultry, cattle, and
sheep. Resistance to these three antibacterials are often simultaneously found in environments such as ponds (Zhou et al. 2019), wastewater and its receiving
river water (Jia et al. 2017), and even raw milk (Xie et al. 2017). Site 7 is located in Qishan Town and surrounded by agriculture area. The river water there
received the agricultural effluents that brought these antibacterials or antibacterial-resistant bacteria. Though chloramphenicol, erythromycin and tetracycline
resistances from site 7 could continue at site 8 as the river flows through., the resistance level could be higher in site 8 than site 7. According to the results of
both the methods (Table 3), intensity of chloramphenicol and tetracycline activities reached intermediate resistance at site 7 while complete resistance at site
8. Site 8 is located near from the WWTP, receiving the effluent from not only agriculture but also human settlement in the whole Qishan and other neighbor
districts. The effluent of WWTP provides an ideal environment for resistance gene transfer since environmental bacteria are kept in direct continuous contact
with antibacterials and antibacterial resistant bacteria (Rizzo et al. 2013). The results of higher resistance level at site 8 than site 7 and even site 9 for few
cases agreed with previous research that intensified pollution environments such as WWTPs could promote antibacterial resistance (Martinez 2009, Szekeres
et al. 2018). Moreover, ampicillin, ciprofloxacin and vancomycin on bacteria began to show resistance at either site 8 or site 9. Enterobacteriaceae showed the
increased resistance to ampicillin and ciprofloxacin. Though the results of micro-dilution showed that MICs of ampicillin for S. marcescens (site 9) and
ciprofloxacin for E. coli (sites 8 and 9) did not reached the breakpoints, they are still significantly higher than the upper stream sites. Pharmaceutical and
personal care products (PCPPs) are household chemicals that are used in large amounts worldwide and regarded as potential environmental pollutants. Most
of these products are discharged via domestic sewage system (Daughton 2003). Among the PCPPs, ampicillin and ciprofloxacin have been reported to be the
most widely used antibacterials worldwide. The β-lactam antibacterials including ampicillin have been reported to account for over 65% of the world antibiotic
market. Ciprofloxacin is one of the frequently used quinolones in hospitals, it is also available for limited use in veterinary medicine. Other report has also
found the both antibacterials in significant quantities in wastewater (Githinji et al. 2010). Some bacteria belonged to Enterobacteriaceae are able to produce
extended-spectrum β-lactamase (ESBL) enzymes, which confer resistance to most penicillin and its derivative antibacterials and most ESBL-producing
bacteria could also be resistant to several other clinically-relevant antibacterial classes (Magwenzi et al. 2017). Staphylococcus spp. showed the increased
resistance to vancomycin at both sites 8 and 9, according to the results of micro-dilution. Though in disk diffusion, the inhibition zone diameters of
vancomycin for S. aureus and S. epidermidis are significantly smaller at both sites 8 and 9 than upper stream sites, there is no standard for intensity of
vancomycin action on Staphylococcus spp. provided by the CLSI (CLSI 2018). Thus, we could not confirm if the resistance level reached the breakpoints. The
previous research has reported that emergence of resistance to vancomycin is a threat to the already challenging therapy of MRSA (Methicillin-resistant S.
aureus) or MRSE (Methicillin-resistant S. epidermidis). Our results indicated that S. aureus and S. epidermidis are not resistant to ampicillin, of which the
structure is similar to methicillin. However, the other bacterial isolates’ resistance to ampicillin implied that the stress caused by this type of antibacterial
cannot be ignored. The spread of MRSA coupled with the emergence of VISA (Vancomycin-intermediate S. aureus) and VRSA (Vancomycin-resistant S.
aureus) might become a major concern for public health further downstream or in the future (Tarai et al. 2013). Although there are fewer reports for the
Page 8/19resistance of S. epidermidis, its antibacterial resistance to methicillin (MRSE/ Methicillin-resistant S. epidermidis) might extend an additional edge for VRSE
pathogenesis that in turn complicates the management of these infections in healthcare settings (Sanober et al. 2017).
Conclusion
This study provides evidence that there is contamination with antibacterial resistant bacteria along the Qishan river. The water quality tests and analyses
indicated different pollution status between the upstream and downstream of the Qishan river. The antibacterial-resistant bacteria from wastewater could be
the potential source of the emergence and spread of antibacterial resistance in the Qishan river basin area. The results of our survey of the Qishan river
indicates that levels of antibacterial resistance are related to environmental factors, such as agricultural area, population density and waste emission
pathway. Resistance levels increased substantially at both the WWTP and Kaoping river with intensified pollution. The WWTP acts as a major reservoir and
supplier of antibacterial resistance in riverine environments. The efficient and effective treatment of WWTP discharges should be considered with priority for
counteracting the emergence of antibacterial resistance. Water quality assessment and management are critical public health issues. The protection of
surface waters from pollutants, especially antibacterials, resistant bacteria, and resistance genes, is fundamental to improve the water safety in Kaohsiung
city and southern Taiwan. This study provides initial information of the distribution of antibacterial resistant bacteria. More detailed studies of the risks of
water-borne diseases via the contamination with antibacterial resistance are warranted.
Declarations
Supplementary information
The online version contains supplementary material available at (DOI).
Acknowledgements
The authors are grateful to Zong-Ying Lin, Tai-Yan Lin, Yun-Xuan Wen and Yu-Rong Zheng at Kaohsiung Medical University for helping with the research.
Zong-Ying Lin and Yun-Xuan Wen assisted with sample collection. Tai-Yan Lin helped with the identification of bacterial isolates and antimicrobial
susceptibility testing. Yu-Rong Zheng was very much helpful with the statistical analysis.
Authors’ contributions
All authors contributed to the study conception and design, especially Cheng-Han Liu and Hans- Uwe Dahms. All authors read and approved the final
manuscript.
Data availability
The datasets used and/or analyzed during the current study are available from the corresponding author on reasonable request.
Funding
Grants from MOST to Tan Han Shih (= Hans-Uwe Dahms) are gratefully acknowledged (MOST 107-2621-M-037-001, MOST 108-2621-M-037-001, and MOST
109-2621-M-037-001 to T.H. Shih). This work was supported partially by the Research Center for Environmental Medicine, Kaohsiung Medical University,
Kaohsiung, Taiwan (R.O.C.), from The Featured Areas Research Center Program within the framework of the Higher Education Sprout Project by the Ministry of
Education (MOE) in Taiwan (R.O.C.) and by Kaohsiung Medical University Research Center Grant (KMU-TC108A01). A KMU-NPUST collaborative research
grant is further acknowledged (NPUST-KMU-110-P010).
Declarations:
Ethics approval
Not applicable
Consent to participate
Not applicable
Page 9/19Consent for publication
Not applicable
Conflict of interests
The authors declare no competing interests.
References
1. Abdi H, Williams LJ (2010) Principal component analysis. Wiley Interdisciplinary Reviews: Computational Statistics 2:433–459
2. Adegoke AA, Mvuyo T, Okoh AI (2012) Ubiquitous Acinetobacter species as beneficial commensals but gradually being emboldened with antibiotic
resistance genes. J Basic Microbiol 52:620–627
3. Aditi FY, Rahman SS, Hossain MM (2017) A Study on the Microbiological Status of Mineral Drinking Water. Open Microbiol J 11:31–44
4. Allen HK, Donato J, Wang HH, Cloud-Hansen KA, Davies J, Handelsman J (2010) Call of the wild: antibiotic resistance genes in natural environments. Nat
Rev Microbiol 8:251–259
5. Baird RB (2017) Standard Methods for the Examination of Water and Wastewater, 23rd. ed. Water Environment Federation, American Public Health
Association, American Water Works Association
6. Baruzzi F, Quintieri L, Morea M, Caputo L (2011) Antimicrobial compounds produced by Bacillus spp. and applications in food. Science against microbial
pathogens: communicating current research technological advances 2:1102–1111
7. Bengtsson-Palme J, Larsson DG (2016) Concentrations of antibiotics predicted to select for resistant bacteria: Proposed limits for environmental
regulation. Environ Int 86:140–149
8. Berendes DM, Sumner TA, Brown JM (2017) Safely Managed Sanitation for All Means Fecal Sludge Management for At Least 1.8 Billion People in Low
and Middle Income Countries. Environ Sci Technol 51:3074–3083
9. Britz TJ, Sigge GO, Huisamen N, Kikine T, Ackermann A, Lötter M, Lamprecht C, Kidd M (2013) Fluctuations of indicator and index microbes as indication
of pollution over three years in the Plankenburg and Eerste Rivers, Western Cape, South Africa. Water SA 39
10. Chang YC, Shih DY, Wang JY, Yang SS (2007) Molecular characterization of class 1 integrons and antimicrobial resistance in Aeromonas strains from
foodborne outbreak-suspect samples and environmental sources in Taiwan. Diagn Microbiol Infect Dis 59:191–197
11. Cheng J, Tang X, Liu C (2020) Occurrence and distribution of antibiotic resistance genes in various rural environmental media. Environ Sci Pollut Res Int
27:29191–29203
12. CLSI (2018) Performance Standards for Antimicrobial Susceptibility Testing. 28th ed. CLSI supplement M100. Clinical and Laboratory Standards Institute,
Wayne, PA, USA
13. Cox G, Wright GD (2013) Intrinsic antibiotic resistance: mechanisms, origins, challenges and solutions. Int J Med Microbiol 303, 287 – 92
14. Curtis GDW, Baird RM, Corry JE (2011) Handbook of culture media for food and water microbiology. Royal Society of Chemistry, 2011
15. Dahms HU (2018) New Challenges by Toxic Threats to the Environment. Environmental Toxicology Studies Journal 2:7
16. Danner MC, Robertson A, Behrends V, Reiss J (2019) Antibiotic pollution in surface fresh waters: Occurrence and effects. Sci Total Environ 664:793–804
17. Daughton CG (2003) Cradle-to-cradle stewardship of drugs for minimizing their environmental disposition while promoting human health. I. Rationale for
and avenues toward a green pharmacy. Environ Health Perspect 111:757–774
18. Ferri M, Ranucci E, Romagnoli P, Giaccone V (2017) Antimicrobial resistance: A global emerging threat to public health systems. Crit Rev Food Sci Nutr
57:2857–2876
19. Fonseca JD, Knight GM, McHugh TD (2015) The complex evolution of antibiotic resistance in Mycobacterium tuberculosis. Int J Infect Dis 32:94–100
20. Githinji LJM, Musey MK, Ankumah RO (2010) Evaluation of the Fate of Ciprofloxacin and Amoxicillin in Domestic Wastewater. Water Air Soil Pollut
219:191–201
21. Google Google map application ver. 10.39. 1
22. Herbst W, Schlez K, Heuser J, Baljer G (2014) Antimicrobial susceptibility of Brachyspira hyodysenteriae determined by a broth microdilution method. Vet
Rec 174:382
23. Holmes AH, Moore LSP, Sundsfjord A, Steinbakk M, Regmi S, Karkey A, Guerin PJ, Piddock LJV (2016) Understanding the mechanisms and drivers of
antimicrobial resistance. The Lancet 387:176–187
24. Hudzicki J (2009) Kirby-Bauer Disk Diffusion Susceptibility Test Protocol
25. Hultman J, Tamminen M, Parnanen K, Cairns J, Karkman A, Virta M (2018) Host range of antibiotic resistance genes in wastewater treatment plant
influent and effluent. FEMS Microbiol Ecol 94
26. Jia J, Guan Y, Cheng M, Chen H, He J, Wang S, Wang Z (2018) Occurrence and distribution of antibiotics and antibiotic resistance genes in Ba River,
China. Sci Total Environ 642:1136–1144
Page 10/1927. Jia S, Zhang XX, Miao Y, Zhao Y, Ye L, Li B, Zhang T (2017) Fate of antibiotic resistance genes and their associations with bacterial community in
livestock breeding wastewater and its receiving river water. Water Res 124:259–268
28. Jorgensen JH, Turnidge JD (2015) Susceptibility Test Methods: Dilution and Disk Diffusion Methods, Manual of Clinical Microbiology. ASM Press
29. Jung B, Hoilat GJ (2020) MacConkey Medium. StatPearls Publishing, Treasure Island (FL)
30. Kummerer K (2009a) Antibiotics in the aquatic environment–a review–part II. Chemosphere 75, 435 – 41
31. Kummerer K (2009b) Antibiotics in the aquatic environment–a review–part I. Chemosphere 75, 417 – 34
32. Laquaz M, Dagot C, Wiest L, Bazin C, Gaschet M, Perrodin Y (2020) Ecotoxicity and antibiotic resistance of wastewater during transport in an urban
sewage network. Environ Sci Pollut Res Int 27:19991–19999
33. Lee AH, Nikraz H (2015) BOD: COD ratio as an indicator for river pollution. International Proceedings of Chemical, Biological and Environmental
Engineering 88, 89–94
34. Lu XM, Chen C, Zheng TL (2017) Metagenomic Insights into Effects of Chemical Pollutants on Microbial Community Composition and Function in
Estuarine Sediments Receiving Polluted River Water. Microb Ecol 73:791–800
35. Magwenzi MT, Gudza-Mugabe M, Mujuru HA, Dangarembizi-Bwakura M, Robertson V, Aiken AM (2017) Carriage of antibiotic-resistant Enterobacteriaceae
in hospitalised children in tertiary hospitals in Harare, Zimbabwe. Antimicrob Resist Infect Control 6:10
36. Martinez JL (2009) Environmental pollution by antibiotics and by antibiotic resistance determinants. Environ Pollut 157, 2893 – 902
37. Miftahussurur M, Yamaoka Y (2015) Appropriate first-line regimens to combat Helicobacter pylori antibiotic resistance: an Asian perspective. Molecules
20:6068–6092
38. Moore JE, Moore PJA, Millar BC, Goldsmith CE, Loughrey A, Rooney PJ, Rao JR (2010) The presence of antibiotic resistant bacteria along the River Lagan.
Agric Water Manag 98:217–221
39. Nnamdi UN, Khethang PM, Thabo JS, Relebohile ST, Mampiti AP, Lebitso S, Sissay BM, Mosotho JG (2017) A Chemometric Comparison of Organic
Manure from Different Animal Sources using a Principal Component Analysis. Asian Journal of Agricultural Sciences 9:1–7
40. O’Neill J (2014) Review on Antimicrobial Resistance Antimicrobial Resistance- Tackling a crisis for the health and wealth of nations. London: Review on
Antimicrobial Resistance, 2014
41. Pereira LC, de Souza AO, Franco Bernardes MF, Pazin M, Tasso MJ, Pereira PH, Dorta DJ (2015) A perspective on the potential risks of emerging
contaminants to human and environmental health. Environ Sci Pollut Res Int 22:13800–13823
42. Proia L, Anzil A, Subirats J, Borrego C, Farre M, Llorca M, Balcazar JL, Servais P (2018) Antibiotic resistance along an urban river impacted by treated
wastewaters. Sci Total Environ 628–629:453–466
43. Rahmani F, Hmaied F, Matei I, Chirila F, Fit N, Yahya M, Jebri S, Amairia S, Hamdi M (2020) Occurrence of Staphylococcus spp. and investigation of fecal
and animal viral contaminations in livestock, river water, and sewage from Tunisia and Romania. Environ Monit Assess 192:206
44. Rizzo L, Manaia C, Merlin C, Schwartz T, Dagot C, Ploy MC, Michael I, Fatta-Kassinos D (2013) Urban wastewater treatment plants as hotspots for
antibiotic resistant bacteria and genes spread into the environment: a review. Sci Total Environ 447, 345 – 60
45. Rusydi AF (2018) Correlation between conductivity and total dissolved solid in various type of water- A review, IOP Conference Series: Earth and
Environmental Science 2017. IOP Publishing, Orlando, Florida
46. Ryu AR, Mok JS, Lee DE, Kwon JY, Park K (2019) Occurrence, virulence, and antimicrobial resistance of Vibrio parahaemolyticus isolated from bivalve
shellfish farms along the southern coast of Korea. Environ Sci Pollut Res Int 26:21034–21043
47. Sanober G, Ahmad S, Azam SS (2017) Identification of plausible drug targets by investigating the druggable genome of MDR Staphylococcus
epidermidis. Gene Reports 7:147–153
48. Sidrach-Cardona R, Hijosa-Valsero M, Marti E, Balcazar JL, Becares E (2014) Prevalence of antibiotic-resistant fecal bacteria in a river impacted by both
an antibiotic production plant and urban treated discharges. Sci Total Environ 488–489:220–227
49. Singh S, Elumalai SP, Pal AK (2016) Rain pH estimation based on the particulate matter pollutants and wet deposition study. Sci Total Environ 563–
564:293–301
50. Szekeres E, Chiriac CM, Baricz A, Szoke-Nagy T, Lung I, Soran ML, Rudi K, Dragos N, Coman C (2018) Investigating antibiotics, antibiotic resistance genes,
and microbial contaminants in groundwater in relation to the proximity of urban areas. Environ Pollut 236:734–744
51. Tang J, Bu Y, Zhang XX, Huang K, He X, Ye L, Shan Z, Ren H (2016) Metagenomic analysis of bacterial community composition and antibiotic resistance
genes in a wastewater treatment plant and its receiving surface water. Ecotoxicol Environ Saf 132:260–269
52. Tanor EB, Ts’enoli S, George MJ (2014) Physicochemical assessment of pollution in the Caledon River around Maseru City, Lesotho. Europen Chemical
Bulletin 3:776–782
53. Tanor EB, George MJ, Mohase PJ, Khesa ME, Khesa LA (2016) Characterization of the physico-chemical properties of the Maseru municipal wastewater
sludge for potential application in agricultural soils as an organic-mineral and soil modifier. European Chemical Bulletin 5:252–258
54. Tarai B, Das P, Kumar D (2013) Recurrent Challenges for Clinicians: Emergence of Methicillin-Resistant Staphylococcus aureus, Vancomycin Resistance,
and Current Treatment Options. J Lab Physicians 5:71–78
55. Van den Meersche T, Rasschaert G, Vanden Nest T, Haesebrouck F, Herman L, Van Coillie E, Van Weyenberg S, Daeseleire E, Heyndrickx M (2020)
Longitudinal screening of antibiotic residues, antibiotic resistance genes and zoonotic bacteria in soils fertilized with pig manure. Environ Sci Pollut Res
Int 27:28016–28029
Page 11/19You can also read