Unexpected ancestry of Populus seedlings from a hybrid zone implies a large role for postzygotic selection in the maintenance of species
←
→
Page content transcription
If your browser does not render page correctly, please read the page content below
Molecular Ecology (2014) 23, 4316–4330                                                                doi: 10.1111/mec.12759

Unexpected ancestry of Populus seedlings from a hybrid
zone implies a large role for postzygotic selection in the
maintenance of species
D O R O T H E A L I N D T K E , * † Z A C H A R I A H G O M P E R T , ‡ C H R I S T I A N L E X E R † and C . A L E X
BUERKLE*
*Department of Botany, University of Wyoming, Laramie, WY 82071, USA, †Unit of Ecology and Evolution, Department of
Biology, University of Fribourg, 1700, Fribourg, Switzerland, ‡Department of Biology and Ecology Center, Utah State
University, Logan, UT 84322, USA

            Abstract
            In the context of potential interspecific gene flow, the integrity of species will be main-
            tained by reproductive barriers that reduce genetic exchange, including traits associ-
            ated with prezygotic isolation or poor performance of hybrids. Hybrid zones can be
            used to study the importance of different reproductive barriers, particularly when both
            parental species and hybrids occur in close spatial proximity. We investigated the
            importance of barriers to gene flow that act early vs. late in the life cycle of European
            Populus by quantifying the prevalence of homospecific and hybrid matings within a
            mosaic hybrid zone. We obtained genotypic data for 11 976 loci from progeny and their
            maternal parents and constructed a Bayesian model to estimate individual admixture
            proportions and hybrid classes for sampled trees and for the unsampled pollen parent.
            Matings that included one or two hybrid parents were common, resulting in admixture
            proportions of progeny that spanned the whole range of potential ancestries between
            the two parental species. This result contrasts strongly with the distribution of admix-
            ture proportions in adult trees, where intermediate hybrids and each of the parental
            species are separated into three discrete ancestry clusters. The existence of the full
            range of hybrids in seedlings is consistent with weak reproductive isolation early in
            the life cycle of Populus. Instead, a considerable amount of selection must take place
            between the seedling stage and maturity to remove many hybrid seedlings. Our results
            highlight that high hybridization rates and appreciable hybrid fitness do not necessar-
            ily conflict with the maintenance of species integrity.
            Keywords: admixture, Bayesian inference, next-generation sequencing, parentage, paternity,
            reproductive isolation
            Received 14 January 2014; revision received 15 March 2014; accepted 8 April 2014

                                                                One of the central questions in evolutionary biology
Introduction
                                                                thus concerns the understanding of the origin and
Species are thought to arise through the accumulation           maintenance of reproductive barriers that reduce
of traits that contribute to reproductive isolation (RI)        genetic exchange to a level that creates or maintains
and evolutionary independence, with intermediate                independent groups of organisms in primary or second-
stages of speciation achieving some evolutionary inde-          ary contact (Coyne & Orr 1998; Turelli et al. 2001; Ortiz-
pendence even in the presence of some amount of                 Barrientos et al. 2002). Barriers that reduce gene flow
hybridization and gene flow (Wu 2001; Mallet 2005).             between populations or species are typically categorized
                                                                according to timing (pre- or postzygotic) or mechanism
Correspondence: Dorothea Lindtke, Fax: 307 766 2851; E-mail:    (intrinsic or extrinsic). Early-acting reproductive barriers
dlindtke@uwyo.edu                                               are often thought to be more important to total RI than

                                                                                               © 2014 John Wiley & Sons Ltd
H Y B R I D I Z A T I O N F R E Q U E N C Y I N P O P U L U S 4317 late-acting barriers (Kirkpatrick & Ravigne 2002; Mosaic hybrid zones between Populus alba (white Ramsey et al. 2003; Rieseberg & Willis 2007; Lowry et al. poplar) and P. tremula (European aspen) exhibit such a 2008), although the contrary might equally be true challenging setting. The parental source populations are (Coyne, & Orr 1998, 2004; Bomblies & Weigel 2007). ecologically and morphologically well differentiated, Incomplete species barriers resulting in (occasional) with differences in habitat type (lowland flood-plains hybridization and gene flow between diverging lineages for P. alba and upland for P. tremula), latitudinal distri- are common in nature, often without threatening spe- butions and leaf morphology associated with ecology cies integrity (Wu 2001; Mallet 2005; Mallet et al. 2007; (Lexer et al. 2005, 2009; Dickmann & Kuzovkina 2008). Butlin et al. 2008; Abbott et al. 2013). One of the major Despite these differences, species distributions overlap explanations for the maintenance of species differences considerably along European river systems, where in the absence of complete geographical or prezygotic P. alba and P. tremula can form large mosaic hybrid isolation is that hybrids show poor performance due to zones (Lexer et al. 2005, 2010). Diploid hybrids, some- extrinsic or intrinsic factors and are thus quickly elimi- times referred to as P.9canescens (gray poplar), are fre- nated by selection (e.g. Schluter 2001; Wu 2001). How- quently found as pioneers in disturbed habitats (e.g. ever, theoretical and empirical data indicate that some river flood-plains; natural or anthropogenic distur- hybrids can be as fit or even fitter than their parental bance), where hybrids and parental trees often grow species (Arnold & Hodges 1995; Barton 2001). This can within tens of metres (van Loo et al. 2008; Lindtke et al. weaken interspecies RI through the opportunity for 2012). Comprehensive genetic analyses of these Populus recombination between divergent traits or incompatible hybrid zones have indicated that, even in such sympat- loci in hybrids. For example, loci involved in assortative ric settings, parental species and their hybrids are sepa- mating and differential adaptation can recombine or rated into three distinguishable ancestry groups (Lexer nondetrimental allele combinations of genetic incompat- et al. 2010; Lindtke et al. 2012). Hybrids are considered ibilities can be recovered (Kirkpatrick & Ravigne 2002; to be highly recombinant and are genetically and phe- Ortiz-Barrientos et al. 2002; Bank et al. 2012). This might notypically mainly intermediate between their parental lead to genetic swamping and loss of evolutionary inde- species (Lexer et al. 2009, 2010). Few mature trees show pendence (Seehausen 2004; Mallet 2005; Seehausen et al. backcross-like genotypes (those that are likely back- 2008). In contrast, hybridization can also be a creative crosses more commonly have P. alba as the nonhybrid force in evolution through adaptive introgression or parent), and F1 hybrid genotypes are either very rare or hybrid speciation (Rieseberg et al. 2003; Seehausen 2004; absent (Lexer et al. 2009, 2010; Lindtke et al. 2012). Pre- Jiggins et al. 2008; Abbott et al. 2013). The fate of vious work indicates that hybrids consist only of a sub- hybridizing species can therefore depend strongly on set of possible genotypic combinations, pointing to an the fitness of interspecific genotypes, as well as the important role of genome interactions in RI (Lindtke genetic architecture, strength and type of isolation barri- et al. 2012). ers between diverging lineages. In this study, we quantify the abundance of homo- Studies of hybrid zones are expected to contribute to specific and hybrid matings in a Populus hybrid zone, our understanding on the establishment and mainte- using an approach related to parentage analysis. nance of RI and species differences in the face of gene Although parentage analysis is a powerful tool for evo- flow (Barton & Hewitt 1989; Buerkle & Lexer 2008; lutionary biology and hybrid zone research, it requires Payseur 2010; Gompert et al. 2012b). Particularly exhaustive sampling of potential parents, a task that ‘mosaic’ hybrid zones can provide an excellent opportu- would be prohibitive in a wind-pollinated, dioecious nity to study RI, as the effect of ecogeographical isola- tree such as Populus. Instead, we use DNA sequence tion on species barriers is diminished by the close data for thousands of loci to estimate genetic ancestries spatial proximity of parental species and their hybrids for hundreds of sampled trees, including 17 maternal (Harrison & Rand 1989; Vines et al. 2003). Although trees and their open pollinated progenies. The genetic divergent habitat preferences or habitat-associated fit- data from mothers and progeny allow us to infer the ness could explain the frequently observed patchy dis- genetic ancestries of the unknown and unsampled tribution of different hybrid classes, several mosaic paternal trees (pollen donors) within a hierarchical hybrid zones lack clear evidence for habitat-associated Bayesian model. effects (Nosil et al. 2005). The existence of fit hybrids in By studying mating patterns in a mosaic hybrid zone such a nearly sympatric setting will continuously chal- between P. alba and P. tremula, we aim at a better lenge the maintenance of reproductive barriers between understanding of the maintenance of species despite species that are threatened by the homogenizing effects hybridization and potential interspecific gene flow. Our of gene flow and recombination (e.g. Buerkle et al. 2000; main goal is to infer the timing of RI and selection Ortiz-Barrientos et al. 2002). responsible for the observed separation of adult trees © 2014 John Wiley & Sons Ltd
4318 D . L I N D T K E E T A L .

and hybrids into three discrete ancestry clusters. This
distribution of ancestry in adult trees could arise from
selection that acts early in the life cycle, before or
during seed formation, or later, between seedling estab-
lishment and maturity. We argue that random or non-
random paternity with respect to the genetic ancestry of
the mother will help to reveal the timing of RI and
selection. Nonrandom, assortative paternity in seedlings
would provide evidence for early-acting RI and might
arise if mothers mate assortatively with fathers with
similar ancestry, or through lethality of heterospecific
embryos. By contrast, random mating patterns would
indicate ineffective early-acting RI and that the remark-
able genetic discontinuities present in these hybrid
zones likely arise from substantial viability selection at
later stages of the life cycle.

Methods

Sampling
The study population is part of a large, natural, mosaic
hybrid zone between P. alba and P. tremula within the
protected area of the Parco Lombardo della Valle del
Ticino in northern Italy. Here, trees of each of the
parental species often grow within a few metres from
hybrids, in a natural flood-plain habitat. The genetic
structure of adult trees within this hybrid zone has been
characterized previously (Lindtke et al. 2012). Poplars
are dioecious, wind-pollinated trees, allowing sampling
of large maternal, open pollinated families. Both flower-
ing phenology and ecogeography are unlikely to con-
tribute substantially to RI between species, as P. alba
and P. tremula have overlapping flowering times
(Lauber et al. 2012), and wind-dispersed pollen is
expected to travel on average a few hundreds of metres         Fig. 1 Map of sampling localities. Top, locality of the Populus
within the genus (Bialozyt 2012). Although the principal       hybrid zone in northern Italy; bottom, enlarged map of the
                                                               core study stand. Triangles indicate maternal trees, and
hybrid zone stretches over 20 km along the river flood-
                0   00    0     00        0    00  0    00     squares population reference samples. Twenty P. tremula refer-
plain (N45∘18 23.5 E8∘55 11.4 to N45∘10 36.8 E9∘08 43.2 ),
                                                               ence samples collected approximately 50 km north of the
we restricted our sampling of all but two reproductive         hybrid zone are not shown. Black, P. tremula; grey, admixed
maternal trees to a mixed stand within 1.3 9 0.7 km            individuals; white, P. alba.
         0   00          0   00       0     00       0    00
(N45∘17 18.4 to N45∘18 0.8 , E8∘55 43.8 to E8∘56 15.8 ;
the core study stand) to ensure that all trees had a simi-
lar set of potential mates available (Fig. 1).                 DNA extraction. Because most putative P. alba trees
   We collected seeds by cutting catkins from 15 mater-        produced very few seeds in 2011, progeny samples of
nal trees in spring 2011 at the time when fruits burst         two P. alba trees that were collected and germinated
and seeds were mature, using scissors on a telescopic          during a pilot study in 2010 were also included (17
pole. Seeds were separated from wool and subse-                maternal trees total). We collected leaf tissue from all
quently germinated in the greenhouse in covered trays          mother trees and included population reference samples
on a 5- to 10-mm sand layer on top of autoclaved com-          from within and outside the hybrid zone (40 adult trees
mon garden soil. To monitor germination success and            each of P. alba, P. tremula and intermediate hybrids; a
survival, seedlings were counted seven and 14 days             total of 120 reference individuals). Reference samples
after sowing. For each family, leaf tissue, or the entire      were collected in 2008 and have been previously charac-
seedling, was collected and stored in silica gel prior to      terized by 77 microsatellite markers (Lindtke et al. 2012).

                                                                                               © 2014 John Wiley & Sons Ltd
H Y B R I D I Z A T I O N F R E Q U E N C Y I N P O P U L U S 4319
Genetic data length were excised and purified using Qiagen’s
QiaQuick gel extraction kit (Qiagen Inc.). Single-end
DNA extraction, library preparation and Illumina sequenc-
sequencing was performed on an Illumina HiSeq 2000
ing. We obtained genetic data from all 17 mother trees,
platform at the Lausanne Genomic Technologies Facility
484 progeny samples (8–34 samples per family, Table 1)
using one lane per library.
and 120 population reference samples. Genomic DNA
was extracted from approximately 7 mg of silica gel-
Sequence curation and assembly. DNA sequences from
desiccated plant tissue using Qiagen’s DNeasy 96 Plant
both libraries were passed through Illumina quality
Kit and DNeasy Plant Mini Kit (Qiagen Inc.). We gener-
filters to remove low quality reads. Additionally,
ated restriction fragment libraries for each individual
sequence reads were removed that had substantial simi-
(with each maternal sample replicated four times) using
larity to the PhiX genome, which is used as an internal
a protocol described in detail in Parchman et al. (2012).
positive control for the instrument, as well as oligonu-
Briefly, approximately 250 ng of genomic DNA was
cleotides used in the library preparation. A total of
digested with endonucleases EcoRI and MseI (NEB Inc.).
254 074 113 reads were retained. All reads were then
Fragments were ligated to double stranded adaptor
processed with a custom Perl script to excise, and
sequences including the Illumina sequencing adaptor
potentially correct, the internal barcodes and associate
and, for the EcoRI adaptor, 8–10 base pairs (bp) of
sequences with tree sample identifiers. After removal of
unique barcode for each individual. Adaptor-ligated
barcodes and invariant restriction site sequences, reads
fragments were PCR-amplified with one reaction per
were 85–87 bp in length. DNA sequences were assem-
individual using Illumina PCR primers. We combined
bled to the P. tremula draft genome assembly v0001
barcoded PCR products of maternal and population ref-
(UPSC draft genome release, http://popgenie.org;
erence samples and all progeny into two libraries, puri-
http://loblolly.ucdavis.edu/bipod/ftp/Genome_Data/
fied them by ethanol precipitation, and size selected
genome/Pota/), using BWA v0.7.5 algorithms INDEX, ALN
them on a 2.5% agarose gel. Fragments 250–400 bp
Table 1 Summary of homospecific and hybrid matings for 17 open pollinated families in this study, based on 11 976 SNPs. Fam,
family ID; q(m), admixture proportion of mother (from 0, P. tremula, to 1, P. alba); q(pro), mean (SD) admixture proportion of progeny
within family (note that these values need to be interpreted with caution for multimodal and bounded distributions); N pro, number
of progeny used for paternity inference; trem, hyb or alba give number of pollen parents categorized into three hybrid classes, with
q ≤ 0.1 assigned as P. tremula; 0.1 < q < 0.9 assigned as hybrid, and q ≥ 0.9 assigned as P. alba; homo (homospecific), F1-like, BCtrem,
BCalba or Fn (hybrid 9 hybrid) show proportion of crossing types in the progeny given the hybrid class assignments of their parents;
N seeds, number of seeds sown; GR, germination and survival rate (not available for families F010 and F011). The last three rows
give summary on pollen source, and mating patterns of species and hybrid mothers
Pollen parents Crossing types
GR GR
Fam q(m) q(pro) N pro trem hyb alba homo F1-like BCtrem BCalba Fn N seeds week1 week2
F021 0.00 0.04 (0.11) 30 25 4 1 0.83 0.03 0.13 — — 155 0.94 0.91
F030 0.00 0.06 (0.15) 30 25 2 3 0.83 0.10 0.07 — — 155 0.86 0.94
F031 0.00 0.06 (0.16) 30 25 2 3 0.83 0.10 0.07 — — 163 0.91 0.91
I_373 0.00 0.32 (0.17) 30 3 14 13 0.10 0.43 0.47 — — 163 0.84 0.87
I_345 0.22 0.18 (0.12) 30 19 10 1 — — 0.63 0.03 0.33 155 0.94 0.95
F008 0.51 0.75 (0.04) 30 0 0 30 — — 0.00 1.00 0.00 155 0.94 0.88
F009 0.50 0.72 (0.11) 30 1 1 28 — — 0.03 0.93 0.03 155 0.92 0.97
F020 0.50 0.68 (0.14) 8 0 1 7 — — 0.00 0.88 0.12 91 0.92 0.92
F022 0.50 0.63 (0.12) 30 0 15 15 — — 0.00 0.50 0.50 155 0.92 0.90
F026 0.50 0.57 (0.13) 30 0 20 10 — — 0.00 0.33 0.67 155 0.86 0.86
F032 0.50 0.66 (0.14) 30 1 8 21 — — 0.03 0.70 0.27 101 0.95 0.94
F033 0.50 0.71 (0.13) 30 2 0 28 — — 0.07 0.93 0.00 155 0.81 0.81
F036 0.50 0.58 (0.16) 30 0 18 12 — — 0.00 0.40 0.60 155 0.97 0.95
I_396 0.50 0.52 (0.15) 30 1 21 8 — — 0.03 0.27 0.70 155 0.97 0.95
F039 0.94 0.89 (0.10) 34 0 14 20 0.59 0.00 — 0.41 — 155 0.65 0.57
F010 1.00 0.97 (0.07) 19 0 3 16 0.84 0.00 — 0.16 — NA NA NA
F011 1.00 0.91 (0.15) 32 2 8 22 0.69 0.06 — 0.25 — NA NA NA
Overall 21.5% 29.2% 49.3%
Species 66.3% 10.7% 10.7% 12.2%
Hybrid 8.6% 57.6% 33.8%
© 2014 John Wiley & Sons Ltd4320 D . L I N D T K E E T A L .
and SAMSE (Li & Durbin 2009). To align sequences to the genetic ancestry of the gametes of the unknown fathers.
reference genome, we first seeded a 20 bp part of the One or more fathers are possible within an open polli-
sequence by tolerating two mismatches and then nated family. As our focus was to estimate the preva-
aligned the total sequence allowing not more than four lence of homospecific vs. hybrid matings, not the
mismatches. Sequences were trimmed to 35 bp if the number of contributing fathers, we estimated genetic
quality score was below 10. Only sequences with a ancestry of the pollen donor independently for each
unique best hit to the reference were aligned. Single progeny.
nucleotide variants were called with SAMTOOLS MPILEUP We used a Bayesian clustering method similar to that
and BCFTOOLS VIEW algorithms v0.1.19 from the aligned implemented in the software STRUCTURE (Pritchard et al.
sequences. This generated a VCF output file containing 2000; Falush et al. 2003). The main difference is that we
likelihood estimates for biallelic genotypes at variant incorporated genotype uncertainty arising from DNA
nucleotide positions. We called single nucleotide poly- sequence data with limited coverage (per locus and
morphisms (SNPs) at sites that were variant with an at individual) and that we estimated ancestry at both
least 99% probability, where at least 95% of our samples allele copies at a locus jointly, enabling better distinc-
were covered (had at least one read), and by using a tion between different hybrid classes. A closely related,
full prior for BCFTOOLS VIEW with the scaled mutation but independent, model and its application in an empir-
substitution rate set to 0.001. Variant calling was carried ical study has been described elsewhere (Gompert et al.
out for either the full data set including all individuals in press; Buerkle et al. in preparation). In this study, we
or a reduced set excluding progeny samples to omit modified the model to include the use of family data to
rare variants potentially present only in one family. We estimate the genetic ancestry of unsampled fathers. We
obtained 32 912 and 64 649 SNPs for the full and briefly describe the model here and refer to the Sup-
reduced data sets (the same stringent criteria applied to porting information for entire details. Figure 2 gives a
a smaller number of individuals allowed more SNPs to graphical representation of the model.
be identified). For both sets, we excluded variants with As in the ‘admixture model’ implemented in the soft-
minor allele frequencies ≤ 0.05, which were less likely ware STRUCTURE (Pritchard et al. 2000), our primary goal
to be informative about ancestry between the highly was to use a hierarchical Bayesian model to estimate
genetically divergent parental species (P. alba and the proportion qk of an individual’s genome that has
P. tremula). We retained 11 976 SNPs that were present ancestry in population k of K source populations. For
in both sets for the final analyses. To test for the poten- both models, the probability of observing the genotype
tial dependence among linked SNPs within the same g is conditional on the unknown population of origin z
sequence read (85–87 bp in length), we randomly of the alleles that form the genotype, and the unknown
selected only one variant from sites that were less than allele frequencies p in the source populations, P(g|z,p).
88 bp apart from each other and retained 5226 variants Relative to the STRUCTURE model, our modifications
used for additional analyses (Supporting information). include the use of genotype likelihoods associated with
Average sequence depth was > 8 per SNP and individ- next-generation DNA sequence data, considering both
ual for both data sets (Tables S1 and S2 in Appendix
S2, Supporting information).
Estimation of genetic ancestry. To learn more about the
timing of reproductive isolation between P. alba and
P. tremula, our main goal was to estimate the ancestries
of parents that mated naturally in the hybrid zone. In
particular, we wanted to (i) compare the species ances-
try of the father to the ancestry of the mother (i.e. is
mating random or nonrandom with respect to the
ancestry of the parents), and (ii) compare the distribu-
tion of the genome-wide admixture proportions in the
seedlings class to that of the established adult trees. By
knowing the genetic ancestry of the mother and her
progeny, it is possible to infer the genetic ancestry of
father’s gamete without the need to sample putative Fig. 2 Model graph. Dotted lines denote alternative paths to
fathers in the hybrid zone directly. We therefore built a model Q dependent on the family class of the sample (r, popu-
model that estimates the genetic ancestry of mothers, lation reference; m, mother; p, progeny; f, father). See Methods
their progeny, population reference samples and the and Supporting information for further details.
© 2014 John Wiley & Sons LtdH Y B R I D I Z A T I O N F R E Q U E N C Y I N P O P U L U S 4321
allele copies in a diploid genotype simultaneously (as
noted above) and different parameterization at a few
levels in the hierarchical model (including incorporation
of family data).
Because contemporary DNA sequencers result in sto-
chastic and finite sampling of DNA sequences from a
locus and individual, diploid genotypes can only be
inferred with some uncertainty. Rather than requiring
high sequence coverage and using arbitrary thresholds
to ‘call genotypes’ from genotype likelihoods, it is pos-
sible to utilize the genotype likelihoods directly in mod-
els and thereby utilize a greater fraction of the sequence
data by explicitly taking genotype uncertainty into
account (e.g. Gompert et al. 2010; Li 2011; Buerkle &
Gompert 2013). In addition, methods using genotype
likelihoods rather than potentially erroneous genotype
calls can give more accurate ancestry estimates
(Gompert & Buerkle 2013; Skotte et al. 2013). The geno-
type likelihoods, L(g|x), are precalculated from the
sequence data x using BCFTOOLS, where the number of
reads and allelic state, and the read specific error rate e
(computed from the base quality scores), are taken into
account (Li 2011; Gompert & Buerkle 2013). The precal- Fig. 3 Genome-wide ancestry estimated by admixture class
culated genotype likelihoods were used directly in the matrix Q or admixture proportion q for F1 and F2 (or other
model: L(g|x) / P(x|g). Genotypes were updated based recombinant) hybrid genomes. Q gives diploid ancestry combi-
on genotype likelihoods, estimated population allele fre- nations (intrasource ancestry: proportion of the diploid com-
quencies and locus-specific ancestry, enabling the han- plement in the genome with ancestry in the same source
population, Q11 or Q22; intersource ancestry: proportion of the
dling of residual genotype uncertainty resulting from
diploid complement in the genome with ancestry in different
missing data or sequencing errors in the genotype like- source populations, Q12+Q21). The admixture proportion q
lihood data (Equation 7, Supporting information). We gives the overall proportion of the genome with ancestry in
restricted our model to biallelic loci and diploid individ- population 1 or 2 (q1 and q2), independent on their diploid
uals, allowing four different genotypic states combination. Genome-wide ancestry between F1 and F2
gij 2 {00,01,10,11} for each individual j and locus i (0 hybrids differs for Q, but is identical for q. See text for further
denotes the reference allele, and 1 the alternative allele) details.
and assume independence among loci. We estimated
the allele frequencies pik in the K populations under an F- be modelled as a diploid combination of ancestry in the
model, in which pik are related to an allele frequency in genotype rather than considering ancestry for each allele
the common ancestor of the populations (pi) through a copy separately. For example, if K = 2, z can have four
variance term Fk (analogous to Wright’s FST; as in Falush states: both allele copies can originate from source popu-
et al. 2003; Gompert et al. 2012a; Buerkle & Gompert lation 1, both allele copies can come from source popula-
2013; Parchman et al. 2013). The ancestral allele frequen- tion 2, or the two allele copies can be derived from
cies p were modelled to depend on parameter a that different source populations (these are two states with
reflects the genetic diversity in the common ancestor. equal probability for our unphased data). Accordingly,
For each individual, we estimated locus-specific ances- Q can also have four different states, which describe the
try z conditional on the genome-wide ancestry class proportion of the individual’s genome that has intra-
matrix Q, P(z|Q). Q gives the proportion of the genome source (Q11 and Q22) or intersource ancestry (Q12+Q21;
that has intrasource population (on the diagonal) or we will refer to intersource ancestry as Q12 for simplicity
intersource population ancestry (off the diagonal; Fig. 3). as for our unphased data, Q is symmetrical above and
We use the terms ‘intrasource’ and ‘intersource ancestry’ below the main diagonal; Fig. 3). From Q, the marginal
to clearly distinguish between source population ances- genome-wide admixture proportion q can easily be
try and genotypic state (i.e. homo- or heterozygosity), as calculated. Estimating ancestry for both allele cop-
these terms are not equivalent (see Gompert & Buerkle ies jointly has two important advantages. First, it bet-
2013). The parameters in Q are related to the admixture ter distinguishes between different hybrid classes,
proportion q, but have the advantage that ancestry can particularly between F1 hybrids, recombinant hybrids
© 2014 John Wiley & Sons Ltd4322 D . L I N D T K E E T A L .
and backcrosses (Fig. 3; similar to the model of Ander- meant to emulate the type of empirical data we have in
son & Thompson 2002). For example, with K = 2, the this study. We simulated 15 000 loci distributed evenly
expected genome-wide admixture proportion q1 is 0.5 across 20 chromosomes, with population allele frequen-
for both F1 and F2 hybrids; however, their expected in- cies p drawn independently for two populations from a
tersource ancestry differs. For an F1 hybrid, the whole beta distribution with parameters shape1 = p(1/F1)
genome will be heterospecific; thus, intersource ancestry and shape2 = (1p)(1/F1). The (1/F1) term acts as a
will be 1. For an F2 hybrid, intersource ancestry will precision parameter for the distribution, and F is a vari-
have an expected value of 0.5, with some variance ance relative to the common ancestral allele frequency p
around it depending on the genetic map size (affected and is analogous to Wright’s FST (as in e.g. Gompert
by the number of chromosomes, genetic map size of et al. 2012a; Buerkle & Gompert 2013). The ancestral
chromosomes and recombination rate). Using Q as a allele frequency p was drawn from a symmetrical beta
model parameter, we can learn directly about the pro- distribution with shape a. We chose different a depend-
portion of an individual’s genome that has intersource ing on F to obtain U-shaped population allele frequency
or intrasource ancestry and thus better estimate its distributions similar to those of the empirical data. We
hybrid class. Second, when estimating genetic ancestry generated genotypic data for 5000 randomly selected
of progeny, it is highly beneficial to compute it for the loci for species and hybrid individuals (F1, F2, F3 and
ancestry combination in the genotype at a locus, first-generation backcrosses), including 17 mothers, 30
because the two allele copies are not independent of fathers and 510 progeny (also including later generation
one another. Instead, if one has been inherited from the crosses). Full details are in the Supporting information.
mother, the other must have been inherited from the We explored nine different simulation settings that are
father. likely to influence the information content of the data
We used different priors on Q for adult trees (moth- sets, namely the combinations of F = {0.1,0.5,0.8}, and
ers, Qm; fathers, Qf; population reference samples, Qr) mean sequence coverage of {1,3,8} drawn from a nega-
or progeny samples (Qp). For adults, we calculated Q tive binomial distribution with size 5. Details on the set-
only conditional on the parameter c that describes tings are provided in Table S3 (in Appendix S2,
admixture in the whole population, P(Qm,f,r|c). For Supporting information). Simulations were carried out
progeny, we have additional information and the in R (R Development Core Team 2012) and subse-
genetic ancestry of a progeny will depend on the quently analysed in the same way as the empirical
genetic ancestry of its parents. We therefore modelled data.
the admixture of the progeny conditional on a function
of the admixture proportions of the parents, m = f(Qm,
Results
Qf), and variance b, P(Qp|m,b). The parameter b models
the deviation from the expected ancestry m that results
Seed sampling and germination rate
from nonindependence among loci (i.e. limited meiotic
recombination of ancestry blocks in early-generation Based on classification by genetic ancestry, the sampled
hybrids, where the variance in gamete ancestry is mother trees consisted of four pure P. tremula (q ≤ 0.1),
affected by genetic map size). In the absence of direct three pure P. alba (q ≥ 0.9, including two trees sampled
observations of data for fathers, the parameter Qf is in 2010: F010 and F011) and 10 trees with admixed
estimated by its effect on Qp, independently for each ancestry (0.1 < q < 0.9; Table 1). All trees sampled in
progeny. 2011 showed a high synchrony in fruit burst allowing
The full model is given by: sampling of all seeds within a single week. There was a
tendency of fruit burst to start with P. tremula, followed
Pðg; z; p; p; F; a; Q; c; bjxÞ / by the hybrids, and P. alba fruits bursting at the end of
PðxjgÞPðgjz; pÞPðpjp; FÞPðpjaÞPðaÞPðFÞ ð1Þ the collection period (Fig. S1 in Appendix S2, Support-
PðzjQÞPðQr;m jcÞPðQ p jm; bÞPðQf jcÞPðcÞPðbÞ ing information). Seed output was substantially differ-
ent between species, with P. tremula producing huge
We provide full details on the implementation of the quantities of seeds, in contrast to P. alba and hybrid
MCMC algorithm and settings used for analysis in the mothers that often set seedless fruits (observation not
Supporting information and software. quantified). Of the trees sampled in 2011, 91–163 seeds
per family were sown to obtain tissue samples and to
Simulations. We used simulated data sets to evaluate determine germination and survival rates (Table 1).
how well our model could recover the genetic ancestry Germination and survival rates after 7 and 14 days
of fathers, given the genetic data for reference samples, were high (89% for both dates; SD < 10%) and showed
mothers and progeny. Overall the simulations were no difference between P. tremula and admixed mother
© 2014 John Wiley & Sons LtdH Y B R I D I Z A T I O N F R E Q U E N C Y I N P O P U L U S 4323
trees (t test, P value = 0.30 and 0.71 after 7 and Estimation of genetic ancestry
14 days, respectively; Table 1, Fig. 4; data for only one
Simulations. To assess the performance of our model for
family were available for P. alba). Unfortunately, many
estimating genetic ancestry for population and family
of the seedlings died shortly after 2 weeks, probably
samples, as well as ancestry of fathers, we generated
because of an infestation with root maggots.
simulated data sets with different amounts of ancestry
and genotype information (Table S3 in Appendix S2,
Supporting information). Overall, we found a high cor-
relation between true and estimated admixture propor-
tion q1 and intersource ancestry Q12 (Figs S2–S4 in
1.0
Appendix S2, Supporting information). The accuracy in
Germination and survival rate
ancestry estimates was considerably higher for data sets
0.8
with higher population divergence and thus informa-
tion content in terms of ancestry (F ≥ 0.5). For small F,
0.6
ancestry estimates were more centred towards interme-
diate values (i.e. few individuals reached the extremes
0.4
of the possible distribution; compare Figs 5 and S5 in
Appendix S2, Supporting information). This characteris-
0.2
tic (which is consistent with the usage of uninformative
priors) constitutes an opportunity to check for the preci-
sion of ancestry estimates in our empirical data, as the
0.0
expected ancestries for our population reference sam-
7 14 7 14 7 14
ples are known. Except for low F, estimates of the
P. tremula hybrids P. alba
genetic ancestry of mothers and progeny were more
Fig. 4 Germination and survival rates after 7 and 14 days accurate than those of population reference samples,
within open pollinated families. Data were pooled according to likely due to the mutually increased information in
the species assignment of the mother. ancestry for family samples. By contrast, multiple levels
(a) (b) Samples
1.0
1.0
Adults Progeny
par0 par0
Estimated q
BC1_0 BC1_0
F1
F1 F1
0.5
F2 F2
0.75
Inter−source ancestry Q12
F3 F3
BC1_1 BC1_1
par1 par1
0.0
Others
0.0 0.5 1.0
0.5
BC1_0 BC1_1 True admixture prop
(c) Samples (d) Fathers
1.0
1.0
Estimated Q12
F2 , F3
Estimated q
0.25
0.5
0.5
par0 par1
0.0
0.0
0.0
0.0 0.25 0.5 0.75 1.0 0.0 0.5 1.0 0.0 0.5 1.0
Admixture proportion q True inter−source anc True admixture prop
Fig. 5 Ancestry estimates for simulated data. The performance of the model and software is shown for one of the simulations, with
F = 0.8 and coverage = 8. (a) intersource ancestry (Q12) as a function of admixture proportion (q) for all samples excluding fathers;
lines indicate maximum possible Q12 given q; species samples (par0 and par1), hybrids (F1, F2, F3) and first-generation backcrosses
towards par0 or par1 (BC1 0 or BC1 1 ) are labelled; (b) comparison of true vs. estimated admixture proportion for all samples
excluding fathers; (c) comparison of true vs. estimated intersource ancestry for all samples excluding fathers; (d) comparison of true
vs. estimated admixture proportion for the gametes from fathers. Grey lines show 95% equal tail credible intervals.
© 2014 John Wiley & Sons Ltd4324 D . L I N D T K E E T A L .
of uncertainty in ancestry within family samples and (F011_26) due to difficulty in obtaining reliable parame-
unsampled fathers may have led to less precise esti- ter estimates from the model.
mates in some cases where F was low. Simulations of Based on their genome-wide admixture proportions,
different levels of genotype uncertainty (i.e. differences maternal trees were classified as either pure species or
in sequence depth) had minor effects on ancestry esti- intermediate hybrids, with two exceptions (Table 1).
mates for the whole genome of individuals (Figs S2–S4, One P. alba tree appears to be slightly introgressed
in Appendix S2, Supporting information; and compare (F039; q = 0.94, 95% equal tail credible interval (CI)
Figs 5 and S6 in Appendix S2, Supporting information). 0.937–0.947), and one admixed mother tree shows a
backcross-like genotype towards P. tremula (I_345;
Genetic ancestry of population reference samples, mothers q = 0.22, 95% CI 0.210–0.226). Three pairs of maternal
and progeny. For all maternal trees, their progeny and trees are likely to be ramets of the same clone based on
population reference samples, we estimated the genome- their very high genetic similarity (F008-F009, F036-I_396,
wide intersource ancestry (Q12) and admixture propor- and F021-F031; Table S4 in Appendix S2, Supporting
tion (q) for K = 2 (Data S1 in Appendix S1, Supporting information). Progeny samples spanned the whole range
information). Our estimates of the genetic differentiation of possible admixture proportions from 0 to 1 (Fig. 6a,
between the parental populations and the hypothetical d). Hybrid population reference samples that were pres-
common ancestor were high (FP. alba = 0.70 and FP. tremula elected based on data from 77 microsatellite markers to
= 0.76). In addition, P. alba and P. tremula reference sam- include only intermediate individuals (mean q = 0.51,
ples matched their expected ancestries (q approaches 0 or range 0.39–0.62 based on STRUCTURE analysis; Lindtke
1, Q12 approaches 0; Fig. 6). We therefore assume reliable et al. 2012) showed similar admixture proportions based
estimates of ancestry for our other samples too. As the on our sequence data and in our model (mean q = 0.50,
difference between the full and the reduced set of SNPs range 0.38–0.60). Intersource ancestries reached maxi-
on ancestry estimates was minor (11 976 or 5226 SNPs; mum possible values given q, indicating that most adult
Fig. S7 in Appendix S2; Data S1 in Appendix S1, Support- intermediate hybrids are likely F1 hybrids rather than
ing information), we only present results based on the recombinants. By contrast, genome-wide intersource
full data set. We excluded one of the progeny samples ancestry was lower in most of the progeny compared
(a) (b) References (c) Mothers
40
5
1.0
Family
4
Mothers
30
Progeny 3
20
2
0.75
Inter−source ancestry Q12
10
1
0
0
References
P. tremula 0.0 0.5 1.0 0.0 0.5 1.0
q q
0.5
Hybrids
P. alba
(d) Progeny (e) Fathers
80
Mother class
P. tremula
60
0.25
BC
Hybrid
P. alba
100
40
20
50
0.0
0
0
0.0 0.25 0.5 0.75 1.0 0.0 0.5 1.0 0.0 0.5 1.0
Admixture proportion q q q
Fig. 6 Ancestry estimates for empirical data, based on 11 976 SNPs. (a) Intersource ancestry (Q12) is plotted as a function of admix-
ture proportion (q) for all samples excluding fathers; lines indicate maximum possible Q12 given q; thin lines show 95% equal tail
credible intervals; circles, progeny; triangles, mothers; population reference samples (squares) are plotted separately as an insert at
the left; (b–e) Histograms of admixture proportions (q) for (b) population reference samples, (c) mothers, (d) progeny and (e) gametes
of fathers; for the latter, shades of grey indicate the hybrid class of the corresponding mother of the mating pair.
© 2014 John Wiley & Sons LtdH Y B R I D I Z A T I O N F R E Q U E N C Y I N P O P U L U S 4325
with the adult samples (Fig. 6a), consistent with the different distributions (P. alba vs. P. tremula, D = 0.74;
presence of recombinant hybrids in the seedlings. The P. alba vs. intermediate, D = 0.43; P. tremula vs. interme-
differences in the distributions of intersource ancestry diate, D = 0.65; Kolmogorov-Smirnov test, all P values
and genome-wide admixture proportions between < 0.00001; with mothers classified as P. tremula if
hybrid adults and hybrid progeny were highly signifi- q ≤ 0.1, as P. alba if q ≥ 0.9, and as intermediate if
cant (Q12, Kolmogorov–Smirnov test for individuals with 0.25 < q < 0.75). We also detected variation in admix-
Q12 > 0.1, adults vs. progeny, D = 0.89, P value < 2.2e-16; ture proportions of fathers between families of the same
q, Kolmogorov–Smirnov test for individuals with hybrid category of mothers (i.e. not all families shared
0.1 < q < 0.9, adults vs. progeny, D = 0.59, P value = the same mating pattern). Particularly admixed mothers
1.423e-13). These significant differences between adults showed high variation in admixture proportions of
and progeny still hold when comparing the distribu- inferred pollen parents both among and within families
tions of all adult and progeny samples, or by consider- (Table 1, Fig. 7).
ing progeny of pure species mothers only (reflecting the Mothers of each species mated more often with con-
extreme hypothetical case that hybrid mothers produce specific males (66.3%) than with hybrid males (22.9%)
negligible seed quantities compared with species moth- or heterospecifics (10.7%; Table 1). The only maternal
ers; Table S5, Fig. S8, in Appendix S2, Supporting infor- tree that deviates from this pattern (I_373) was sampled
mation). As ancestry estimates could potentially be from outside the core study stand (Figs 1 and 7).
affected by using different priors for adults and prog- Hybrid mothers showed a high propensity to backcross
eny (for the latter, the prior was computed as a function towards P. alba (57.6%) or to mate with hybrid males
of the ancestry of the parents), we additionally ran our (33.8%), whereas comparatively few seeds were fertil-
model without providing family information. We ized by P. tremula pollen (8.6%; Table 1, Fig. 7). The
obtained very similar results, indicating that different backcross-like individual I_345 showed much more sim-
prior constructions had little effect on our findings (see ilarity in the distribution of fathers’ admixture propor-
Supporting information for further details). tions to P. tremula than to the other hybrids (Table 1,
Fig. 7). Further, four hybrid trees sampled in close prox-
Genetic ancestry of fathers. We estimated genome-wide imity to P. alba also shared a similar mating pattern
admixture proportions of the unknown fathers based with P. alba (F008, F009, F020 and F033; Figs 1 and 7).
on genetic data of progeny and their mothers (Data S1 The mating patterns of the hybrids resulted in a high
in Appendix S1, Supporting information). As for the proportion of P. alba backcrosses in the seedlings, which
progeny samples, admixture proportions of fathers strongly contrasts to the distribution in adult trees
spanned the whole range of possible values from 0 to 1, where backcrosses are mostly absent (Fig. 6a, b, d, S8 in
although paternity from pure species and intermediate Appendix S2, Supporting information; Lexer et al. 2010;
hybrids was clearly predominant (Fig. 6e; for CIs, see Lindtke et al. 2012). Mothers that are likely to be ramets
Fig. S9 in Appendix S2, Supporting information). Most of the same clone shared very similar mating patterns
pollen (49.3%) originated from P. alba (q ≥ 0.9), 29.2% (F008-F009; F036-I_396; F021-F031; Table 1, Fig. 7).
from admixed trees (0.1 < q < 0.9) and 21.5% from
P. tremula (q ≤ 0.1). Note that these estimates involve
Discussion
some uncertainty for the admixed fathers, particularly
in cases in which one or both of the parents were likely In this study, we have investigated mating patterns in a
early-generation hybrids (F1 or backcrosses). In that natural mosaic hybrid zone of European Populus to
case, the stochasticity of recombination and segregation assess the importance of early-acting and late-acting
of the 19 Populus chromosomes can lead to overly reproductive barriers in species isolation. Although the
confident estimates of ancestry, as linkage within importance of prezygotic barriers has been emphasized
jointly inherited chromosome blocks would violate the by recent theoretical and empirical studies (e.g. Ramsey
assumed nonindependence among loci. et al. 2003; Rieseberg & Willis 2007; Lowry et al. 2008),
our results show that early-acting mechanisms are insuf-
ficient for the maintenance of RI in Populus. Rather, the
Frequency of homospecific and hybrid matings
prevalence of a full range of hybrids in progeny and the
There was considerable variation in admixture propor- discrete distribution of ancestry in adult trees suggest an
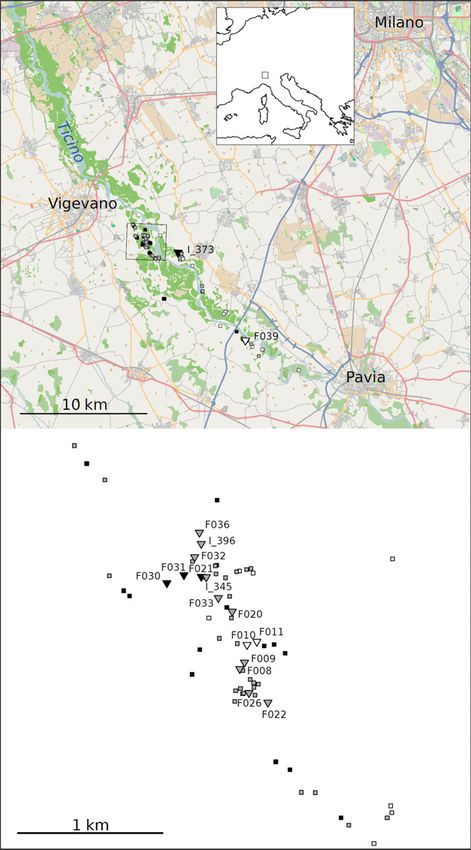
tions of fathers among and within families (Table 1, Fig. 7). important role for traits that act later in the life cycle to
The admixture proportions of fathers were largely contribute to postzygotic isolation and to maintain
dependent on the ancestry of the corresponding mother. species integrity. In addition, we found viable hybrid
When pooled according to the mother’s ancestry, progeny spanning the whole range of possible admix-
admixture proportions of fathers showed significantly ture proportions and fertile hybrids that contribute to
© 2014 John Wiley & Sons Ltd4326 D . L I N D T K E E T A L .
1.0
F021 F030 F031 I_373 I_345
1.0
1.0
1.0
1.0
Q12
Q12
Q12
Q12
Q12
0.5
0.5
0.5
0.5
0.5
0.0
0.0
0.0
0.0
0.0
0.0 0.5 1.0 0.0 0.5 1.0 0.0 0.5 1.0 0.0 0.5 1.0 0.0 0.5 1.0
q q q q q
F008 F009 F020 F022 F026
1.0
1.0
1.0
1.0
1.0
Q12
Q12
Q12
Q12
Q12
0.5
0.5
0.5
0.5
0.5
0.0
0.0
0.0
0.0
0.0
0.0 0.5 1.0 0.0 0.5 1.0 0.0 0.5 1.0 0.0 0.5 1.0 0.0 0.5 1.0
q q q q q
F032 F033 F036 I_396 F039
1.0
1.0
1.0
1.0
1.0
Q12
Q12
Q12
Q12
Q12
0.5
0.5
0.5
0.5
0.5
0.0
0.0
0.0
0.0
0.0
0.0 0.5 1.0 0.0 0.5 1.0 0.0 0.5 1.0 0.0 0.5 1.0 0.0 0.5 1.0
q q q q q
F010 F011
1.0
1.0
Q12
Q12
0.5
0.5
0.0
0.0
0.0 0.5 1.0 0.0 0.5 1.0
q q
Fig. 7 Mating patterns and ancestry estimates per family for empirical data, based on 11 976 SNPs. Histograms show admixture pro-
portions for fathers within an open pollinated family (family ID at top of each plot); below each histogram, intersource ancestry
(Q12) is plotted as a function of admixture proportion (q) for the mother (triangle) and her progeny (circles) of that family.
seedling production. This suggests that some hybrids and their hybrids in adult trees indicates that species
are possibly as fit as their parental species, which can barriers are nevertheless strong (see Lexer et al. 2010;
lead to the breakdown of species identity through Lindtke et al. 2012). We propose that RI is potentially
recombination and genetic exchange (Kirkpatrick & Rav- maintained by repeated episodes of selection between
igne 2002; Ortiz-Barrientos et al. 2002; Bank et al. 2012). germination and sexual maturation, in which the major-
Despite this potential for interspecific gene flow, the ity of recombinant hybrids have low viability, effectively
pronounced genetic clustering of the parental species reducing genetic exchange between parental genomes.
© 2014 John Wiley & Sons LtdH Y B R I D I Z A T I O N F R E Q U E N C Y I N P O P U L U S 4327
Populus hybrid zone (two species and intermediate
Mating patterns and hybridization frequency
hybrids) suggest that RI requires selection that acts later
By estimating genetic ancestries of maternal trees, prog- in the life cycle, after germination. The species and
eny and pollen parents within 17 open pollinated intermediate hybrid genotypes are likely to have a
families, we determined hybridization frequencies and selective advantage over other hybrid classes during
mating patterns within a mosaic hybrid zone. We later life stages. In addition, our results indicate that
detected a tendency for homospecific matings despite survival is highest for those intermediate genotypes that
the close spatial proximity of species and hybrids (Table also show maximal possible intersource ancestries (i.e.
1, Figs 1 and 7), consistent with early-acting barriers to F1 hybrids; Fig. 6a). Although we cannot completely
reproduction between P. alba and P. tremula. However, exclude the possibility that the rarity of recombinant
even though 66.3% of matings were homospecific, hybrids in mature trees relative to their abundance in
hybridization rates were high, resulting in the formation progeny results from a recent formation of the hybrid
of a substantial number of F1 hybrid (10.7%) and back- zone, this scenario is unlikely. First, the presence of
cross progeny (22.9%; Table 1). In addition, we found some backcross-like and putatively introgressed mature
evidence for fertility among admixed trees, which con- individuals (I_345, F039; also see Lindtke et al. 2012)
tributed as male and female parents in reproduction suggests that an opportunity for a second generation of
(Fig. 6c, e). Furthermore, germination and survival rates hybrids exists. Likewise, the flood-plain area has been
in hybrid families were high and did not differ from the protected for > 30 years and includes some old trees of
species samples (Table 1, Fig. 4). These findings indicate both species and hybrids. Second, the Italian peninsula
that while early-acting barriers are clearly important is considered to have served as a refugium during the
contributors to RI, they are also insufficient to explain last glacial maximum for P. alba and P. tremula, render-
the discrete ancestry clusters (i.e. species and intermedi- ing a long history of hybridization likely (Svenning
ate hybrids) found among adult trees. Although we et al. 2008; Fussi et al. 2010). Despite this opportunity
observed a very low seed output for hybrid and P. alba for hybridization, species remain genetically well differ-
mothers compared with P. tremula mothers in 2011 (not entiated, indicating strong RI. Third, previous work has
quantified), mating patterns of P. tremula females alone shown that very similar discrete ancestry clusters in
resulted in high hybridization rates (Table 1). adult trees exist in ‘replicate’ Populus hybrid zones in
The rarity of conspecific pollen is unlikely to be a Austria and Hungary (Lindtke et al. 2012), which are
major source for the observed hybridization rates, as unlikely to have all been formed recently.
pollen disperses on average over several hundreds of The finding that adult intermediate hybrids are most
metres in this wind-pollinated tree genus (Bialozyt likely to be F1 hybrids contrasts to previous conclusions
2012), and pollen from pure species and hybrids was gathered on the same population reference samples but
clearly available in the hybrid zone (Fig. 6e). Neverthe- that were based on microsatellite markers (see Lexer
less, our results are consistent with some spatial effect et al. 2010; Lindtke et al. 2012). According to these pre-
on hybridization frequency (Figs 1 and 7), which can vious studies, hybrids were inferred to be highly recom-
result from the higher relative abundance of pollen binant (Lexer et al. 2010), with an unusual high level of
from nearby males and thus a higher probability of pol- intersource ancestry that was nevertheless lower than
lination success (Lepais et al. 2009; Niggemann et al. that expected for F1 hybrids (Lindtke et al. 2012). These
2012; Lagache et al. 2013). The tendency for hybrid contrasting findings are potentially due to overconfi-
females to backcross more often towards P. alba than dence in genotype associated with microsatellite mark-
towards P. tremula (Table 1, Fig. 7) can be explained ers that are nevertheless prone to allele dropout
by an overall higher abundance of P. alba trees in flood- (Taberlet et al. 1996), but likely also reflect the difference
plain habitats (Lexer et al. 2005), differences in flower- in the models used to estimate ancestry (Fig. 3). In par-
ing time, pollen competition or intrinsic postzygotic ticular, for our previous studies, we applied a model
factors (Lowry et al. 2008). that estimates ancestry for each of the two allele copies
independently, where the prior probability of ancestry
for each allele copy equals the genome-wide admixture
Deviation in genetic ancestry between seedlings and
proportion q. With little information about locus-specific
mature trees
ancestry from the data (e.g. missing data, multiple seg-
We found marked differences in the ancestry of seed- regating alleles, low and uncertain allele frequency dif-
lings and adult trees, for both the distributions of ferential between the parental species), locus-specific
admixture proportions and intersource ancestry (Fig. 6, ancestry estimates will be strongly influenced by their
Table S5, Fig. S8 in Appendix S2, Supporting informa- prior probability, resulting in an expected intersource
tion). The three ancestry categories in adults in the ancestry of 2q(1q). In that case, the function of
© 2014 John Wiley & Sons Ltd4328 D . L I N D T K E E T A L .
expected locus-specific intersource ancestry given q has nant chromosomes to the next generation and thus lim-
its maximum at 0.5 and hence does not include the its the potential for interspecific gene flow. Interestingly,
value of 1 expected for F1 hybrids. By contrast, in our a number of other studies have similarly documented
current model, we estimated ancestry for both allele high hybridization rates (Field et al. 2011; Lepais & Ger-
copies jointly using the K 9 K matrices Q and z and ber 2011; Moran et al. 2012), high fitness of at least a
included an explicit parameter for genome-wide inter- subset of hybrid progeny (e.g. Cruzan & Arnold 1994;
source ancestry (Q12), which was allowed to range from Lepais & Gerber 2011), or differences in the distribution
0 to 1. This approach is expected to lead to more pre- of admixture proportion between life stages within
cise and accurate results for intersource ancestry, as loci hybrid zones (e.g. Cruzan & Arnold 1994; Cornman
with little information about ancestry will reflect prior et al. 2004; Curtu et al. 2009; Lepais & Gerber 2011). This
information on intersource ancestry from other loci, suggests that future studies on the evolution of RI that
rather than a function of q (where even a low propor- continue to investigate organisms with various life histo-
tion of loci with little ancestry information may bias ries might reveal additional examples for a strong role
genome-wide intersource ancestry towards 2q(1q)). of late-acting barriers for the maintenance of species.
A current limitation of our model is the assumption One potential explanation for the reduced life-time
of independence among loci. Nevertheless, tightly fitness of recombinant hybrids is coadaptation within
linked loci had a negligible effect on our ancestry esti- each of the parental species’ genomes, where recombi-
mates, as the difference in results between the full and nation can result in unbalanced genotypes (outbreeding
reduced set of SNPs was minor (Fig. S7 in Appendix depression; Lynch 1991; Edmands & Timmerman 2003).
S2; Data S1 in Appendix S1, Supporting information). Accumulative minor disadvantages between seedling
Although we cannot exclude over-representation of par- formation and maturity (resulting, for example, from
ticular parts of the genome in our sample, our results repeatedly misexpressed genes in recombinant hybrids)
should only be affected if these regions coincide with might explain the rarity of adult recombinant hybrids
directional introgression in recombinant hybrids. Incor- despite high germination rates and fitness at the seed-
porating linkage and haplotype information in future lings stage. Selective disadvantages of recombinant
models is likely to further improve inference of hybrid hybrids may be amplified by the life history of Populus
class and recombination history (e.g. see Wegmann (i.e. several years to reach maturity, the large quantity
et al. 2011; Gompert & Buerkle 2013). Regardless of of progeny but limited carrying capacity for adult
whether adult hybrid individuals are truly F1 or poten- trees). A long prereproductive period of selection and
tially more advanced-generation hybrids with excep- its potential importance for speciation has been demon-
tionally high intersource ancestry, the deviations in strated recently in a marine coral, characterized by a life
admixture proportion and intersource ancestry between history very similar to long-lived trees (Prada &
seedlings and adults highlight the likely importance of Hellberg 2013). Further steps towards a better under-
postgermination reproductive barriers between the standing of reproductive barriers in Populus would
investigated species. involve the identification of the set of genetic combina-
tions or environmental factors that are responsible for
the low fitness of a subset of recombinant hybrids dur-
Evolutionary implications and further directions
ing the transition from the seedling stage to maturity.
Our study on Populus offers an example system in which Modelling the null expectation for hybridization fre-
species boundaries are maintained without substantial quencies given the spatial distribution and demography
premating isolation in a secondary contact zone between of trees, quantifying the number of seeds produced in
highly divergent species. This indicates that the often each hybrid class (preferably over several years) and
generalized assumption regarding the importance of measuring different components to RI in experiments,
prezygotic barriers (e.g. Kirkpatrick & Ravigne 2002; can help to better determine the strength of different
Ramsey et al. 2003; Rieseberg & Willis 2007; Lowry et al. reproductive barriers in future studies.
2008) potentially results from the limited diversity of
species that has been studied so far and from the diffi- Acknowledgements
culties in detecting postzygotic isolation mechanisms
once prezygotic barriers are complete (Coyne & Orr We thank Stefano Castiglione, Alberto Spada, Berthold
Heinze, Tom Parchman, Eligio Bossolini, Alan Brelsford, P€ ar
2004). Our study provides further support for the impor-
Ingvarsson, Liz Mandeville and Monia Haselhorst for their help
tance of late-acting barriers even in highly divergent and advice. We thank Associate Editor Nick Barton and three
species as Populus. Although some of the hybrid individ- anonymous reviewers who helped to improve an earlier version
uals are fertile, only very few of their progeny reach of the manuscript. This work was facilitated by SNSF mobility
maturity. This reduces the opportunity to pass recombi- Grant PBFRP3_145869 to DL and an SNSF project grant to CL.
© 2014 John Wiley & Sons LtdYou can also read