Substrate thermal properties influence ventral brightness evolution in ectotherms - Nature
←
→
Page content transcription
If your browser does not render page correctly, please read the page content below
ARTICLE
                  https://doi.org/10.1038/s42003-020-01524-w               OPEN

                  Substrate thermal properties influence ventral
                  brightness evolution in ectotherms
                  Jonathan Goldenberg              1 ✉,   Liliana D’Alba       1,   Karen Bisschop         2,3,   Bram Vanthournout1 &
1234567890():,;

                  Matthew D. Shawkey               1

                  The thermal environment can affect the evolution of morpho-behavioral adaptations of
                  ectotherms. Heat is transferred from substrates to organisms by conduction and reflected
                  radiation. Because brightness influences the degree of heat absorption, substrates could
                  affect the evolution of integumentary optical properties. Here, we show that vipers (Squa-
                  mata:Viperidae) inhabiting hot, highly radiative and superficially conductive substrates have
                  evolved bright ventra for efficient heat transfer. We analyzed the brightness of 4161 publicly
                  available images from 126 species, and we found that substrate type, alongside latitude and
                  body mass, strongly influences ventral brightness. Substrate type also significantly affects
                  dorsal brightness, but this is associated with different selective forces: activity-pattern and
                  altitude. Ancestral estimation analysis suggests that the ancestral ventral condition was likely
                  moderately bright and, following divergence events, some species convergently increased
                  their brightness. Vipers diversified during the Miocene and the enhancement of ventral
                  brightness may have facilitated the exploitation of arid grounds. We provide evidence that
                  integument brightness can impact the behavioral ecology of ectotherms.

                  1 Evolution and Optics of Nanostructures group, Department of Biology, Ghent University, 9000 Ghent, Belgium. 2 Terrestrial Ecology Unit, Department of

                  Biology, Ghent University, 9000 Ghent, Belgium. 3 Theoretical Research in Evolutionary Life Sciences, Groningen Institute for Evolutionary Life Sciences,
                  University of Groningen, 9700 CC Groningen, The Netherlands. ✉email: jonathan.goldenberg@ugent.be

                  COMMUNICATIONS BIOLOGY | (2021)4:26 | https://doi.org/10.1038/s42003-020-01524-w | www.nature.com/commsbio                                             1
ARTICLE COMMUNICATIONS BIOLOGY | https://doi.org/10.1038/s42003-020-01524-w
T
he evolution of organismal coloration depends on multiple amounts of heat. Heat is transferred by conduction (direct con-
ecological and evolutionary factors1, and no single function tact, i.e., by molecular interactions), convection (within fluids) or
can fully explain color variation across the animal king- radiation (electromagnetic waves, without direct contact)
dom. Most previous studies on animal coloration have focused on mechanisms13,14. Soils convey heat to other objects mainly
colors for camouflage and mimicry e.g., refs. 2–4 or on sexual through conduction and secondarily via radiation (infrared
selection or social signaling e.g., refs. 4–6. However, pigmented energy). The immediate transfer of heat from low cp (water-
integument can also have significant thermal effects7,8. By selec- limited) soils such as sand or rock to other objects is higher than
tively absorbing and reflecting solar and environmental radiation, in high cp substrates (water-rich) such as humid forest grounds12,
the pigmented tissue can directly affect body temperature9,10. The because low cp soils release heat faster. Thus, variation in soils’
sun’s energy-rich radiation spans from the UV-visible (300–700 thermal properties could be particularly important for species
nm) to the near infrared (NIR: 700–2500 nm). Brightness is the such as squamates that live in continuous and close contact with
relative amount of light reflected from a surface, and it can have a their substrate. Because integumentary brightness in part deter-
strong effect on temperature because, all things being equal, a mines the amount of heat transferred, its evolution could be
bright material absorbs less solar radiation than a dark material11. influenced by the substrate on which an animal resides.
Solar energy can be transmitted directly or indirectly to an Brightness of the integument is largely determined by mela-
organism (Fig. 1). The former occurs via direct exposure to the nins, a ubiquitous class of multifunctional macromolecules15.
sun’s radiation, and the latter via transfer from the surroundings Melanins can absorb and transform solar radiation into heat16–18,
including the substrate. Indirect transmission can vary with the and have good electrical conductive properties16,19–21, in turn
type of substrate on which the organism lives; for example, each affecting thermal conductance22. Energy conduction occurs via
soil type has a different specific heat capacity (i.e., cp: amount of the transfer of ions and electrons, and in melanin it increases in
energy required to raise 1 kg of substance by 1 °C; ref. 12) and water-rich environments20,23–26. In reptiles, melanin is found in
therefore, soils with different heat capacities will store different organelles called melanosomes that are in turn housed in
on Di
Dire
iati re
ct
c t rad ra
ct ra
e
ion
Dir dia
tio
iat
diat
n
rad
Direct radiation
ion
t
ec
Dir
radiation
radiation
radiation
radiation
Thermal
Ground thermal Ground thermal
conductivity
radiation radiation Thermal
conductivity
Fig. 1 Flow of energy between direct-and-indirect solar radiations and the organism. Here, we assumed convective heat exchanges (i.e., wind),
evaporative cooling from metabolism, food uptake, and urine/faeces production to be constant. The formulated model is a simplification and presented in a
conceptual manner to reflect our hypothesis. The direct solar radiation contains all energy-rich radiations, spanning from the UV-visible (300–700 nm) to
the near infrared (NIR: 700–2500 nm). The reflected radiation and the ground thermal radiation contain IR energy. The ground thermal radiation and the
thermal conductivity increase with the increase of direct solar radiation. However, different grounds present different specific heat capacities (cp), which
ultimately affect the amount of heat released by the substrate. Solid lines represent the energy received by the organism; dashed lines represent the energy
reflected by the organism. Thicker dashed lines indicate high reflectance; thinner dashed line show low reflectance. Given the unique properties of melanin
(see main text), we reasoned that a brighter integument will reflect more direct or indirect solar energy, while a darker integument will absorb more direct
or indirect solar energy. Adapted from Porter & Gates13 and Porter et al.89. Drawing: Karen Bisschop.
2 COMMUNICATIONS BIOLOGY | (2021)4:26 | https://doi.org/10.1038/s42003-020-01524-w | www.nature.com/commsbioCOMMUNICATIONS BIOLOGY | https://doi.org/10.1038/s42003-020-01524-w ARTICLE
Table 1 Data acquisition in ImageJ.
Body region Region of interests (ROIs) Description
Venter 3 areas. Each spanning 1/10 of the trunk lengtha Maximum outline within the ROI. Only ventral scales
Dorsum 3 areas. Each spanning 1/10 of the trunk lengtha Maximum outline within the ROI. Only dorsal scales.
Head 3 areas Maximum outline within the ROI. Only parietal (cranial) scale
Pattern 3 areas Maximum outline of pattern areas within the dorsum
Our custom-made macro guides the user throughout analyses. Note that reference selection tool helps the user to stick to the reference length. For more details, please refer to Fig. S2
aWe aimed for 1/10 for comparative purposes.
melanophores27. These unique thermal properties of melanins led image analyses and spectrophotometry, (e) assessed the variability
us to predict that a less melanic (brighter) venter would be of image brightness within species, and f) verified the relationship
favored for animals that live on hot radiative and conductive between the visible (Vis), near infrared (NIR) and Ultraviolet
substrates, because it would allow them to better dissipate (UV) spectra.
transferred heat. For (a) We examined all images in ImageJ 1.52i through a
Previous research on squamates has primarily focused on dorsal custom-made interactive plugin that enables the user to obtain
coloration, perhaps because it is visually recognizable and exposed brightness levels (see Methods for more information). Here we
to direct solar radiation e.g., refs. 7,28–31. Fewer studies have defined brightness as the mean of the RGB values43.
investigated the ecological significance of ventral coloration e.g., For each species we calculated the mean brightness for each of
refs. 32–35, and only a handful have examined the link between it the four body regions (head, dorsum, venter, and dorsal pattern
and thermoregulation8,11,36. Older studies investigated the effect of (geometric shapes that contrast with the dorsal ground colora-
substrate use on thermoregulation37 and mentioned the thermo- tion)) (Table 1, Fig. S2). For (b), to assess the repeatability of the
ecological significance of ventral color reflectivity2,38,39. However, measurements, four observers independently analyzed 12 species
none specifically examined the evolution of ventral brightness. (388 images), (c) with the directive to avoid shaded areas and
Here we use a comparative approach to investigate the macro- flashed (“burned”) regions. We found positive relationship
evolutionary processes involved in shaping ventral brightness. We between the observers (Obs1 vs Obs2: r = 0.94; R² = 0.88; p <
hypothesized that, while the dorsal, head and pattern brightness 0.0001, Obs1 vs Obs3: r = 0.99; R² = 0.98; p < 0.0001, Obs1 vs
have evolved through tradeoffs between thermoregulation, pro- Obs4: r = 0.99; R² = 0.98; p < 0.0001, Fig. S3), so only one
tection, and camouflage, ventral brightness has been mainly dri- proceeded with data collection. For (d), we verified the relation-
ven by the cp of the substrates. We predicted that species ship between brightness values obtained through spectrophoto-
inhabiting hot, and highly radiative and superficially conductive metry from 29 living squamate species (including four viper
substrates (i.e., low cp) would express less melanic (i.e., darker) species; Table S2) and brightness obtained through photographs.
ventral integument than those on high cp substrates. Moreover, as We found a significant positive relationship (r = 0.79; R² = 0.62;
latitude in part determines how much of the sun’s radiation is p < 0.0001, Fig. S4), a solid support for our method, particularly
received by the organism, while also directly affecting transmis- given that images were by necessity from different individuals to
sion of energy to the substrate40, we expected higher latitude include intraspecific variation. For (e), we examined the variation
species to express a greater melanic ventral integument than of image brightness within same 29 squamate species. All
lower latitude counterparts. Furthermore, body size can have a standard deviations are moderate and similar across species
strong effect on the overall thermal inertia of an organism41, (Fig. S5, Table S3), supporting the use of multiple images to
therefore we advanced that larger species will benefit from a retrieve an overall brightness mean per species. For (f), since 50%
brighter venter given the slower cooling rates relative to smaller of the sun’s energy-rich radiation is confined to the NIR
species11. Finally, we predicted that high altitude species will region44,45 and images account only for the Vis spectrum, we
display a darker ventral integument than low altitude organisms, verified the relationship between these two spectral regions from
as high altitudes are generally colder than lower altitudes, and a spectrophotometry measurements on the same 29 living squa-
more melanic venter may confer a thermal advantage. Using mate species (Table S2). We found a strong positive relationship
vipers as study organisms, we combined ancestral state estima- (r = 0.79; R² = 0.62; p < 0.0001, Fig. S6) as predicted, supporting
tions and Bayesian mixed models to test these hypotheses. the use of the vis spectrum as a proxy for the full spectrum. UV
radiation also plays a role in the overall heating process of an
organism, thus we verified the relationship between the UV range
Results and the Vis spectrum on the same dataset. We found a significant
Study design and methodology validation. We analyzed 126 positive relationship (r = 0.68; R² = 0.46; p < 0.0001, Fig. S7),
taxonomically unambiguous viper species from 31 genera, cov- further supporting use of the Vis range as proxy for the full
ering ~35% of the family Viperidae (The Reptile Database42; spectrum.
accessed [July 2020]); Fig. S1). As direct spectrophotometry
measurements of live vipers are logistically challenging, we
retrieved brightness levels from 4161 images of these species from Bright ventra associate with low cp substrates. We found that
peer-reviewed articles, field guides, Google Images, doc- integumentary brightness and substrate type were associated in all
umentaries and our own data. We removed images that were models of ventral and dorsal body regions. However, environ-
clearly over-or-under exposed. To account for different lighting mental and morpho-behavioral variables differ depending on
and setup conditions, we took the following steps: (a) selected body region. Specifically, ventral brightness, in addition to being
multiple (head (M = 8.37, SD = 2.09), dorsum (M = 8.64, SD = positively associated with body mass and negatively with latitude
2.08), venter (M = 4.50, SD = 2.69), and dorsal pattern (M = variables, is strongly negatively associated with substrate type
7.53, SD = 2.78)) pictures/video frames per species, (b) assessed (Tables 2, S4–7); species living on substrates with low cp (i.e., arid
observer variability, (c) avoided over/under exposed areas, (d) grounds) have significantly brighter ventral coloration
assessed the relationship between brightness data obtained from 69% [61,78] than on any other substrate (Table S8, Fig. 2a).
COMMUNICATIONS BIOLOGY | (2021)4:26 | https://doi.org/10.1038/s42003-020-01524-w | www.nature.com/commsbio 3ARTICLE COMMUNICATIONS BIOLOGY | https://doi.org/10.1038/s42003-020-01524-w
Table 2 Influence of variables on the integumentary brightness.
Body region Substrate Body mass Distribution Altitude Day cycle Polymorphism
Ventrum −** +** −**
Dorsum −** −* −*
Head −** −*
Pattern ~**
Significant parameters influencing the brightness of the four body regions. Summary output from the ventral (Tab. S4–7), dorsal (Tab. S9–12), head (Tab. S14–17), and pattern (Tab. S19–21) MCMCglmm
models. Two asterisks (**) indicate strongly supported parameters (variable present in all mostly supported models (DIC < 5) and has a cumulative Akaike weight of >0.75); One asterisk (*) less strongly
supported (variable present in any of the mostly supported models (DIC < 5) and has a cumulative Akaike weight of > 0.75). “+” indicates a positive relationship between the variable of interest and the
body region brightness. “−” shows a negative relationship between the variable of interest and the body region brightness. “~” displays no clear trend between the variable of interest and the body region
brightness. Substrate: category from low-to-high substrate cp (specific heat capacity); Body Mass: continuous from small-to-large species; Distribution: category from low-to-high latitudes; Altitude:
category from low-to-high altitudes; Activity Pattern: category from day-to-night activity patterns; Polymorphism: binary category (“yes”,”no”).
a 100
75
Ventral brightness
(fitted values)
50
25
0
b 100
75
Dorsal brightness
(fitted values)
50
25
0
A B C D E F
Arid soils Arid soils + Grass +/ Generalists Grass + Forest grounds High vegetation Forest grounds
Forest grounds
Low Cp High Cp
Fig. 2 Brightness variation across different body regions and substrate types. MCMCglmm-predicted values of ventral (a) and dorsal (b) brightness
across the six different substrates. Bars represent 95% credible intervals. cp = Specific Heat Capacity. Generalists are species occurring on more than three
different types of substrates. For a full description of substrate classification see Methods. Credits: Echis leucogaster (© Gabri Mtnez, moroccoherps.com—
with permission), Gloydius ussuriensis (Orlov, N.L. et al.90), Echis coloratus (Wikipedia CC BY-SA 3.0), Atropoides picadoi (© Gert Jan Verspui, INaturalist, CC
BY-NC 4.0).
Dorsal brightness is lower than the ventrum (Table S12, Evolution of brightness in different body regions. The ancestral
Fig. 2b) and it is negatively associated with substrate type, but, state reconstruction of the ventral brightness (Fig. 3a) suggests that
unlike the ventrum, also with activity pattern and altitude the root viper node had a brightness level of 57% [44,71] 95% C.I.,
(Tables 2, S9–13, Fig. 2b). More specifically, diurnal and low and that several groups convergently evolved bright or dark inte-
altitude species are more likely to be brighter than nocturnal gument. During the mid-late Miocene (~14–6 Mya), brightness of
and high altitude animals (Tables 2, S12). Head brightness Echis sp–Cerastes sp. (71% [59,84], Pseudocerastes sp.–Eristicophis
follows a nearly identical trend to dorsum (Fig. S8), but is only sp. (64% [52,76], Bitis sp. (61% [50,72]), Causus sp. (58% [46,70]),
associated with substrate type and altitude (Tables 2, S14–18). Daboia sp. (58% [47,69]), and few species of Crotalus sp.
The result is not surprising, as the brightness levels of two regions (58% [51,64]), independently increased (Fig. 3a), and decreased in
are strongly associated with each other (Fig. S10B). By contrast, Bothrops sp. (53% [45,60]), Gloydius sp. (43% [33,52]), and Vipera
pattern region is only associated with substrate type. (Tables 2, sp. (45% [36,55]). The results are further supported by the Stay-
S19–21, Fig. S9). ton’s C1–C5 metrics of convergences based on dorsal and ventral
4 COMMUNICATIONS BIOLOGY | (2021)4:26 | https://doi.org/10.1038/s42003-020-01524-w | www.nature.com/commsbioCOMMUNICATIONS BIOLOGY | https://doi.org/10.1038/s42003-020-01524-w ARTICLE
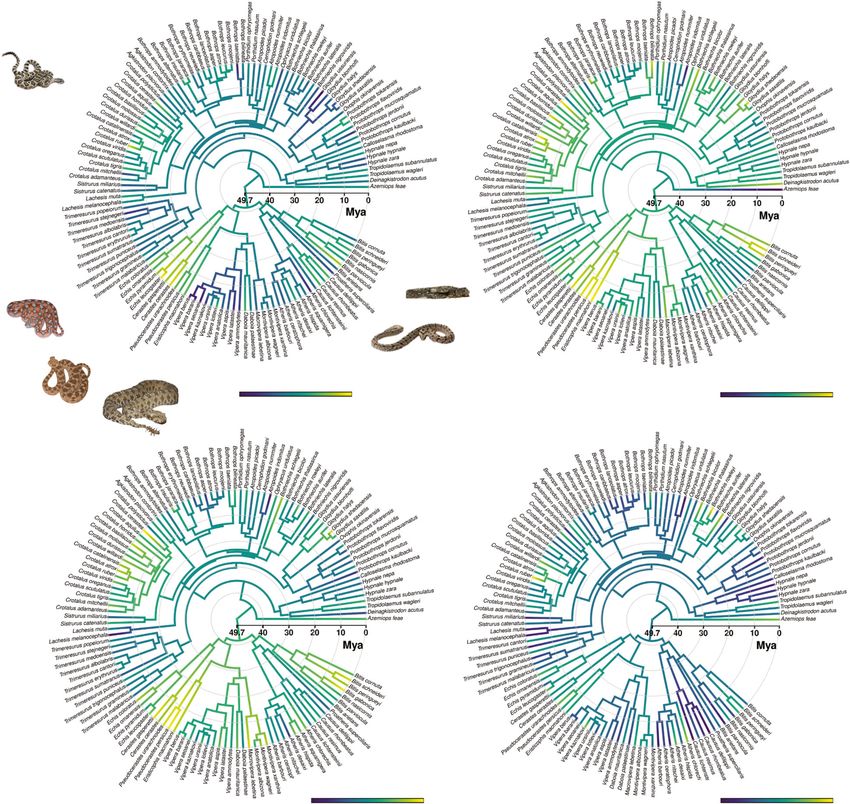
(a) (b)
26.286 Brightness 86.323 19.148 Brightness 52.783
Ventrum Dorsum
(c) (d)
16.959 Brightness 57.88 10.633 Brightness 62.322
Head Pattern
Fig. 3 Viperidae ancestral brightness estimation across different body regions. Viperidae ancestral state estimation of (a) ventral brightness, indicating
convergent evolution of particularly dark and bright ventral integuments; (b) dorsal brightness showing an overall convergent brightness increase across
different genera/species; (c) head brightness showing a similar trend to the dorsal brightness; and (d) pattern brightness indicating a global decrease of
brightness since ~20 Mya. Note that six species (Atheris squamigera, Trimeresurus albolabris, T. erythrurus, T. medoensis, T. popeiorum, T. stejnegeri) do not
show clear pattern shapes, therefore we dropped them from pattern analysis. Branches with blues (darker tonality) indicate dark colors, greens show the
mid-brightness ancestral state and yellows (brighter tonality) specify bright colors. Credits: Crotalus oreganus (© Will Flaxington, CC BY-NC 3.0), Echis
coloratus (© Matthieu Berroneau—with permission), Cerastes cerastes (© MinoZig, CC BY-NC 3.0.), Pseudocerastes urarachnoides (© Omid Mozaffari, CC-
public domain), Causus rhombeatus (© Paul Venter, CC BY-NC 3.0.), Bitis arietans (© Jonathan Goldenberg).
brightness of the focal taxa (Table S23); specifically C1 (i.e., the Brightness on the dorsum also increased across several genera
maximum distance between two lineages that has been brought (mostly different genera/species than those whose ventral
together by subsequent evolution) = 0.54 (p = 0.00) coupled with brightness increased) from the late Oligocene to the mid-
C5 (i.e., the number of convergent focal taxa that reside in a dis- Miocene (~24–14 Mya) (Fig. 3b). The head brightness follows
tinct region of the polymorphospace) = 15 (p = 0.00) show that the the same trend as the dorsum (Fig. 3c). Lastly, unlike all other
focal taxa significantly cluster together in a separate region of the body regions, brightness of patterns decreased starting in the
polymorphospace driven by ventral brightness (Table S23, early Miocene (~20–15 Mya) (Fig. 3d).
Fig. S14). As another line of evidence, the 95% C.I. phenogram,
which projects the phylogeny in a space defined by the ventral Discussion
brightness over time (Fig. S15B), shows that ventral brightness of We hypothesized that evolution of ventral brightness in ectotherms
the focal taxa shifted to bright brightness levels independently over confined to the ground is driven by the heat retention properties of
time, corroborating our findings. their primary substrates. We used ancestral reconstructions and
COMMUNICATIONS BIOLOGY | (2021)4:26 | https://doi.org/10.1038/s42003-020-01524-w | www.nature.com/commsbio 5ARTICLE COMMUNICATIONS BIOLOGY | https://doi.org/10.1038/s42003-020-01524-w multinomial models, with vipers as study organisms, to test this multiple climatic changes e.g., ref. 50; for instance, during the hypothesis. Our results show that, as predicted, bright ventral Miocene (~23–5 Mya) it underwent regional aridification phases integuments are associated with arid substrates, i.e., low specific due to new orogenic formations and changes in air circulation50. heat capacity substrates. This suggests that a bright ventral inte- Such environmental variations can significantly affect the per- gument may provide an evolutionary advantage to species living on formance and the bauplan of ectothermic organisms51. Vipers arid soils by more rapidly dissipating the heat transferred from the evolved from an ancestral form 49.7 Mya ca.52 and evolved ground, thereby potentially avoiding overheating. during these selective climatic fluctuations. The observed increase Ventral brightness was affected not only by the substrate, but in ventral brightness in the mid-late Miocene (Fig. 3a), suggests also by latitudinal distribution and body mass. However, contrary that following aridification, brighter integuments may have to our predictions, altitude did not play a role in shaping ventral enabled species inhabiting arid soils to more rapidly dissipate brightness. ground heat. Latitude in part determines how much the sun’s radiation is Integumentary brightness evolved differently in ventral and received by the organism, while also directly affecting transmis- dorsal regions, further suggesting that it is uncoupled in these sion of energy to the substrate40. Similarly to Moreno Azócar body regions. On the ventral side, five groups ((1) Causus sp., (2) et al.36, our results indicate that species closer to the equator are Echis sp. - Cerastes sp., (3) Pseudocerastes sp. -Eristicophis sp., (4) more likely to have brighter venters compared to species at higher Bitis sp., and (5) few members of Crotalus sp.) independently latitudes. The authors suggested a potential thermoregulatory enhanced brightness of their ventral integuments during the mid- function because ventral melanism was significantly affected by late Miocene (~14–6 Mya). Extant members of the African spe- cloudiness and minimum net radiation. We propose that darker cies inhabit the Sahara region. Zhang et al.53 estimated that this ventra may provide a thermal advantage in lower energy-rich desert formed 7–11 Mya. Interestingly, the rise of these four radiation zones, because melanin not only can absorb and bright ventral genera (group 2, 3) coincides with this aridification. transform solar radiation into heat16–18, but also conduct In parallel, the uplift of East Africa during the late Miocene may energy16,19–21, promoting thermal conductance22. have enabled the rise of several Bitis spp. following the shrinkage Body mass affects thermal inertia in that larger species take of rainforests and expansion of open habitats54,55. During the longer to change body temperature11,41. Our findings show that mid-late Miocene, wooded-savannahs gradually replaced tropical larger species have brighter venters, possibly because of the slower forests in Southern Africa56, creating new vacant niches that cooling rates relative to smaller species11. These results suggest could be filled by species with brighter venters such as Causus sp. that substrate conditions, together with latitude and body mass, Similarly, ancestral forms of Crotalus sp. rapidly radiated when shape the ventral brightness evolution in our ectothermic group. the great mountain ranges formed in North America, rapidly Finally, high altitudes are not only generally colder than low aridifying the surrounding environment57. On the other hand, the altitudes, but also have higher radiation. Therefore, unlike sub- steep decrease in brightness experienced by the Gloydius complex, strates at low altitudes, those at high altitudes likely experience especially G. ussuriensis, may be linked to the uplift of the Tibetan contrasting abiotic factors (e.g., high solar radiation, low tem- plateau, which provoked an increase in precipitation in the loess peratures), that ultimately affect the substrate thermal properties. plateau/east Asia around 8–9 Mya58 producing forests in which Our predictions did not account for the effect of solar radiation, dark ventral species may perform better. but only temperature, at high altitude, but given our results we Brightening of the dorsum and head may have been a response suggest that the brightness of the venter is not influenced by to the gradual replacement of forests with open areas since 20 altitude. Mya ca.59, where brighter integuments may have provided an Dorsal and head brightness were also negatively associated evolutionary benefit for camouflage and thermoregulatory with the substrate type, but they were darker than the venters purposes. across all substrate types (Fig. 2). Moreover, altitude and, on the In contrast to any other body region, the pattern area follows dorsum, the activity pattern, were also associated with the dorsal an overall decrease of brightness starting from 20 Mya. Darker and head brightness, suggesting that brightness of those regions is and contrasting patchy areas across the dorsum may have pro- driven by multiple competing pressures such as camouflage, vided an evolutionary advantage by disrupting the ground col- thermoregulation and UV protection. Indeed, we found that oration to better blend with the surrounding environment49. diurnal and lower altitude species are more likely to have a While the dorsum is exposed to both solar radiation and prey/ brighter integument than nocturnal and higher elevation animals predator sight, the ventral region is mostly cryptic in species on any given substrate. Darker integuments may contribute not confined to the ground. Ectotherms are highly susceptible to the only to better camouflage, but also to thermoregulatory functions surrounding environmental conditions to attain body tempera- in colder environments (e.g., allowing the brain to reach optimal tures that maximize performance. Thus, different brightness temperatures faster46) and UV protection (e.g., protecting the levels on different body regions may confer specific advantages to animal from higher radiations at higher altitudes47). The present achieve the desired function8,34. Our results support the results are further supported by Martínez-Freiría et al.48 who hypothesis that brightness of exposed body regions is not only found that darker dorsal colors in European vipers are associated selected for thermoregulatory properties, but also for protection with cold environments. Overall, our findings on the dorsal and and camouflage29,60. In contrast to Smith et al.’s8 prediction that ventral brightness suggest that these body regions are subjected to ventral color reflectivity would have little effect on thermo- divergent selective forces. regulation, as the animals lie flat against the surface, we found Only substrate type was associated with pattern brightness, that ventral brightness evolution appears to be mainly shaped by with no clear reduction in brightness with higher specific heat the substrate type. Hence, the upper and lower body regions capacity substrates. Recently, Pizzagalli et al.49 found that specific experienced contrasting selection pressures, leading to the current geometric shapes on the viper dorsa are associated with different variation in extant viper color brightness. ground habitats. Our results provide another line of evidence that We have here provided evidence for the significance of patterns primarily evolved for a function other than thermo- brightness of an often-neglected body region, and laid the regulation, most likely camouflage. groundwork for future studies examining the reflectance, emis- Substrate properties in a given location can rapidly change sivity and thermoregulatory properties of melanin. Moreover, it following climatic shifts. In the last 50 My Earth experienced may be important to implement such results in climate change 6 COMMUNICATIONS BIOLOGY | (2021)4:26 | https://doi.org/10.1038/s42003-020-01524-w | www.nature.com/commsbio
COMMUNICATIONS BIOLOGY | https://doi.org/10.1038/s42003-020-01524-w                                                                                           ARTICLE

risk assessments due to the potential impact they can have on                              Polar or any combination thereof. The level Temperate-Polar presented only one
species distribution.                                                                      species (Vipera berus); however, we kept that in our analyses as it did not affect
                                                                                           model convergence. Finally, latitude is linked with solar radiation, in turn affecting
                                                                                           temperature. Our models, by including the latitudinal distribution of a species,
                                                                                           account for the effect of different solar radiation levels, and thus, indirectly,
Methods                                                                                    temperatures, on shaping the physical characteristics of the local substrate; (3)
Species selection and dataset construction. Vipers (Viperidae Oppel, 1811) are             Body mass: from Feldman et al.72; (4) Polymorphism: species displaying
a family of venomous snakes that evolved 50 Mya c.a.52,61. Unlike other snakes,            intraspecific variation and/or sexual dimorphism were classified as polymorphic;
vipers use a sit-and-wait foraging behavior e.g., ref. 62, and therefore their substrate   and (5) Activity pattern: behavioral trait defined as Diurnal, Nocturnal, Both or
type likely plays an important role in regulating their body temperature. To date,         Unknown (all references used to score and classify the analyzed variables are
365 viper species (The Reptile Database42; accessed [July 2020]) are distributed           available at the provided repository). Vipers can ontogenetically shift at
across the globe ranging from the tropics to the higher latitudes63 (>60° N). The          morphological (e.g., color brightness shift in Tropidolaemus wagleri73) and
observed large diversity, coupled with their feeding strategy and a relatively long        behavioral levels (e.g., juveniles of Bothriechis lateralis live on the forest floor
evolutionary history, makes this family an ideal study organism to investigate how         whereas adults are arboreal74). Hence, we primarily analyzed adults for our
ventral brightness evolved under divergent selective environments.                         classification. However, if adults and juveniles occupy the same niche and do not
    To determine whether the specific heat capacity (cp) of substrates has played a         display any color brightness shift, we included both stages. We did not account for
role in the evolution of ventral brightness, we extracted information on integument        tail brightness as it can be used for luring purposes and/or as a prehensile tool75,76.
brightness levels of 126 taxonomically unambiguous viper species from 31 genera
distributed across the world. We previously explained in Results section our
precautions to retrieve brightness levels in different species from images and we          Brightness quantification. We analyzed all images in ImageJ 1.52i through a
refer the reader to that paragraph. All the references to the collected 4161 images        custom-made interactive plugin (MacroBright v.0.1)77 that guides the user to select
are available at the provided repository.                                                  the region of interests from which the researcher can obtain the brightness levels
    As integumentary brightness may be evolutionary constrained across different           (.json file available at the provided repository).
regions of an organism, we took measurements from three regions of interest in                 First, the user loads a folder with images and provides, image-by-image, a
each of the four body parts, i.e., head (M = 8.37, SD = 2.09), dorsum (M = 8.64,           reference scale, and then outlines the maximum area of the region of interest. The
SD = 2.08), venter (M = 4.50, SD = 2.69), and dorsal pattern (M = 7.53, SD = 2.78;         obtained RGB values are then saved in.csv format (Table 1; Fig. S2).
geometric shapes that contrast with the dorsal ground coloration) (Table 1, Fig. S2)
and for each species we calculated the mean brightness for each body section. Clear        Spectrophotometry. To quantify the reflectance of the 29 squamate species
images of the ventral side are rare, hence we analyzed a lower proportion of images        (Table S2; reptile collection of Tel Aviv University’s Garden for Zoological
for this cryptic body region. Six species (Atheris squamigera, Trimeresurus                Research), we deployed a dual spectrophotometer and light source (AvaLight-DH-
albolabris, T. erythrurus, T. medoensis, T. popeiorum, T. stejnegeri) do not show          S Deuterium-Halogen Light Source and AvaLight-HAL-(S)-MINITungsten Light
clear pattern outlines, therefore we dropped them from any pattern analysis.               Source) setup (Avantes Inc.,Broomfield, CO, USA across the UV-Vis-NIR range
    Soils display different cp based on the amount of water they contain12. Arid           (300–1030 nm) connected to a quadrifurcated fibre optic cable and held at 90°
substrates (low cp) quickly dissipate the heat via conduction and radiation, while         using a RPH-1 probe holder. To account for measurement repeatability, we
forests grounds (high cp), slowly absorb and diffuse the heat. Accounting for direct       acquired three spectra from three selected points on the trunk (Fig. S13). Because
cp values measurements on different soil types (Table S1), we classified substrates         no invasive procedures were performed on live animals, data collection was per-
based on a cp gradient, i.e., from low (arid substrates such as deserts and rocky          formed under the supervision of the reptile keeper.
soils) to high (forest grounds). We looked in the literature to find the substrate and
the ecological context for each species (all references are available at the provided
repository). We identified six Substrate categories based on the aridity and ground         Statistics and reproducibility. We used the species-level viper phylogeny by
composition; from low to high cp: A = arid substrates (e.g., sandy, rocky grounds);        Alencar et al.52, which is based on 11 genes (six mitochondrial and five nuclear)
B = arid substrates in combination with forest grounds and/or grass patches; C =           and 1186 sequences from 263 taxa, and to date is the most complete reconstruction
species inhabiting more than three different substrates; D = grass patches in              of this family. We conducted all analyses in R v.3.6.278. As a first step, we matched
combination with forest grounds; E = arboreal (high vegetation) species; and F =           the phylogenetic tree to our dataset (i.e., 126 species) with the treedata function in
forest grounds. A (n = 13), B (n = 30), C(n = 25), D (n = 15), E (n = 21), F (n =          “geiger”79. For our multinomial analyses, we employed a Bayesian approach that
22). Some categories may display similar or overlapping substrate cp values. For           allows us to interpret our results in terms of posterior probabilities.
example, category B and D both present grass patches and/or forest grounds.
However, species falling within category B will likely have to endure higher ground        Body brightness evolution. To investigate the evolutionary history of integu-
heat stresses than those on category D, because they also exploit arid substrates. For     mental brightness we estimated ancestral states of color brightness from each
a detailed description of our substrate classification, please see Table S1.                different body region using “phytools”80. We used a model-based approach to map
    We also incorporated other environmental data that could significantly affect           the estimating states at internal node using maximum likelihood with the contMap
the amount of the sun’s energy-rich radiation received by the animal and                   function. Then, to assess the observed convergences for ventral brightness among
substrate64,65, and morpho-behavioral information that can influence thermal heat           focal taxa (Bitis parviocula, Bitis peringueyi, Causus resimus, Causus defilippii,
transfer (for a frequency table please see Table S22): (1) Altitude range: as species      Daboia mauritanica, Eristicophis macmahoni, Pseudocerastes urarachnoides,
are distributed across a vast altitude range and there is very little information          Pseudocerastes persicus, Cerastes cerastes, Cerastes gasperettii, Echis pyramidum,
available on density distribution across the species ranges, we followed the               Echis omanensis, Echis coloratus, Echis leucogaster, Crotalus ruber, Crotalus cer-
thresholds provided in the mountain system classification of Körner et al.66, and           astes) we employed “convevol”81 to estimate the convergent metrics, where C1–C4
produced the following five categories: Low (x ≤ 500 m), Low-Medium (x ≤ 1000               are distances and C5 is a frequency-based degree of convergence82. As head
m), Medium-High (500 m < x ≤ 4000 m), High (1000 < x ≤ 4000 m), All (all the               brightness is highly correlated with dorsal brightness (Fig. S10B), pattern bright-
range). In this study, the threshold of 4000 m corresponds to the highest examined         ness displays a reduced dataset (Atheris squamigera, Trimeresurus albolabris, T.
viper distribution (i.e., Gloydius halys67). Furthermore, vegetation-based zonation        erythrurus, T. medoensis, T. popeiorum, T. stejnegeri do not show clear pattern
at lowlands are very susceptible to climate conditions68, thus different regions           shapes, therefore we have to remove those species for any analysis involving pattern
experience different upper limits for vegetation zonation, in turn potentially             brightness), and our interest relies on understanding the convergence patterns of
affecting the heat exchange dynamic between substrate-organism. Therefore, we              integument brightness, we defined a polymorphospace using ventral and dorsal
increased the lowland elevation from 300 m (proposed by Körner et al.66) to 500 m          brightness. Finally, to further support the convergence pattern in ventral bright-
as the latter reflects an average of the lowland thresholds (upper elevation limits for     ness, we produced a phenogram with 95% confidence intervals using “phytools”80.
lowland zonation are 600–700 m69). Finally, some viper species can span across a
vast altitudinal range (e.g., Atropoides picadoi70), while others are restricted to a
well-defined zone (e.g., Bothriechis rowleyi71). Therefore, a broadly distributed           Brightness of body regions and substrate association. To assess the probability
species may overlap the distribution of a limitedly distributed one. However, the          that a viper will display a specific brightness in a given substrate, we performed
species that spans across a vast range will likely be exposed to more selection            multiple Markov chain Monte Carlo Generalised Linear Mixed Models
pressures due to different levels of abiotic factors, such as humidity, temperature        (MCMCglmm83) while accounting for phylogeny using the pedigree command.
and solar radiation, that can ultimately affect the species thermal balance.               Initially we wanted to verify if substrate type was a significant explanatory variable
Consequently, in this study we produced the above-mentioned altitude categories            to describe brightness on different body regions. We first constructed four different
that also account for the species’ ecology. A graphical representation of altitude         global models, one for each body region, setting every time the brightness of the
distribution across species is in Fig. S10; (2) Distribution: the studied species are      body region of interest as the dependent variable and verified which variables better
distributed across all latitudes, but, similarly to elevation range, very little           explained variation in the system using the dredge function in “MuMIn”84 ranking
information is available on density distribution across the species ranges.                by Deviance Information Criterion (DIC). We defined variables as strongly sup-
Therefore, we classified the latitudinal distribution following the radiation index         ported if they were present in all mostly supported models (DIC < 5) and had a
presented in Barry & Chorley40: Tropical, Subtropical, Temperate, Temperate-               cumulative Akaike weight of >0.7585,86; less strongly supported if they were present

COMMUNICATIONS BIOLOGY | (2021)4:26 | https://doi.org/10.1038/s42003-020-01524-w | www.nature.com/commsbio                                                                      7
ARTICLE COMMUNICATIONS BIOLOGY | https://doi.org/10.1038/s42003-020-01524-w
in any of the mostly supported models (DIC < 5) and had a cumulative Akaike of 16. Meredith, P. et al. Towards structure–property–function relationships for
>0.75. Then, to retrieve the posterior means of the significant parameters, we set eumelanin. Soft Matter 2, 37–44 (2006).
those as fixed effect for each body region model. All mostly supported models 17. Geen, M. R. S. & Johnston, G. R. Coloration affects heating and cooling in
reported substrate type as a significant predictor. Therefore, as our research three color morphs of the Australian Bluetongue Lizard, Tiliqua scincoides. J.
question is to predict brightness levels on different body regions in response to Therm. Biol. 43, 54–60 (2014).
different substrates, to produce our graphical outputs we set substrate type as fixed 18. Cordero, R. J. & Casadevall, A. Melanin. Curr. Biol. 30, R142–R143 (2020).
effect and to account for the other significant variables from the global model we 19. Jastrzebska, M. M., Isotalo, H., Paloheimo, J. & Stubb, H. Electrical
set those as random. The construction of these graphical models was a necessary conductivity of synthetic DOPA-melanin polymer for different hydration
step in order to extract the probability intervals of only the substrate types. We ran states and temperatures. J. Biomater. Sci. Polym. Ed. 7, 577–586 (1996).
all models setting 1000000 MCMC iterations, burnin = 40000 and thin = 20. The 20. Mostert, A. B. et al. Role of semiconductivity and ion transport in the electrical
phylo object was converted to ultrametric values through the force.ultrametric conduction of melanin. Proc. Natl Acad. Sci. USA 109, 8943–8947 (2012).
function available in “phytools”80. As we did not have a prior knowledge of how 21. Mostert, A. B. et al. Understanding melanin: a nano-based material for the
brightness is related to different substrates and because all models converged (see future. In Nanomaterials: Science and Applications (eds. D. M. Kane,
below), we defined the default priors87, and family (a character vector describing A. Micolich & P. Roger) 175–202 (New York: Jenny Stanford Publishing,
the traits class) was set as “gaussian”. Then we extracted the probabilities of the 2016).
fixed effects through the function predict. Finally, we plotted the results in
22. Kellicker, J., DiMarzio, C. A. & Kowalski, G. J. Computational model of
“ggplot2”. To assess convergence, we ran five models to verify if they converged to
heterogeneous heating in melanin. Optical Interact. Tissue Cells XXVI 9321,
the same posterior distribution. The Gelman and Rubin criterion88 shows that the
93210H (2015).
point estimate values of the variables of interest are all confined between 1 and
23. Jastrzebska, M. M., Isotalo, H., Paloheimo, J. & Stubb, H. Electrical
1.02, and the multivariate psrf is 1. The results of the Gelman and Rubin criterion,
coupled with trace plots, indicated that our model successfully converged. conductivity of synthetic dopa-melanin polymer for different hydration states
and temperatures. J. Biomater. Sci. 7, 577–586 (1995).
24. Wünsche, J. et al. Protonic and electronic transport in hydrated thin films of
Reporting summary. Further information on research design is available in the Nature the pigment eumelanin. Chem. Mater. 27, 436–442 (2015).
Research Reporting Summary linked to this article. 25. Rienecker, S. B., Mostert, A. B., Schenk, G., Hanson, G. R. & Meredith, P.
Heavy water as a probe of the free radical nature and electrical conductivity of
Data availability melanin. J. Phys. Chem. B 119, 14994–15000 (2015).
All datasets are deposited at the provided repository77. 26. Migliaccio, L. et al. Evidence of unprecedented high electronic conductivity in
mammalian pigment based eumelanin thin films after thermal annealing in
vacuum. Front. Chem. 7, 162 (2019).
Code availability 27. Rosenblum, E. B., Hoekstra, H. E. & Nachman, M. Adaptive reptile color
All R-scripts and the macro developed for image analyses are available through our variation and the evolution of the Mc1r gene. Evolution 58, 1794–1808 (2004).
repository77. 28. Jackson, J. F., Iii, W. I. & Campbell, H. W. The dorsal pigmentation pattern of
snakes as an antipredator strategy: a multivariate approach. Am. Naturalist
110, 1029 (1976).
Received: 29 April 2020; Accepted: 25 November 2020; 29. Wüster, W. et al. Do aposematism and Batesian mimicry require bright
colours? A test, using European viper markings. Proc. R. Soc. Lond. Ser. B Biol.
Sci. 271, 2495–2499 (2004).
30. Allen, W. L., Baddeley, R., Scott-Samuel, N. E. & Cuthill, I. C. The evolution
and function of pattern diversity in snakes. Behav. Ecol. 24, 1237–1250 (2013).
31. Clause, A. G. & Becker, R. N. Temperature shock as a mechanism for color
References pattern aberrancy in snakes. Herpetol. Notes 8, 331–334 (2015).
1. Endler, J. A., Westcott, D. A., Madden, J. R. & Robson, T. Animal visual 32. Ressel, S. & Schall, J. J. Parasites and showy males: malarial infection and color
systems and the evolution of color patterns: sensory processing illuminates variation in fence lizards. Oecologia 78, 158–164 (1989).
signal evolution. Evolution 59, 1795–1818 (2005). 33. Morrison, R. L., Rand, M. S. & Frost-Mason, S. K. Cellular basis of color
2. Norris, K. S. & Lowe, C. H. An analysis of background color-matching in differences in three morphs of the lizard Sceloporus undulatus erythrocheilus.
amphibians and reptiles. Ecology 45, 565–580 (1964). Copeia 1995, 397–408 (1995).
3. Allen, J. J., Mäthger, L. M., Barbosa, A. & Hanlon, R. T. Cuttlefish use visual 34. Stuart-Fox, D. M. & Ord, T. J. Sexual selection, natural selection and the
cues to control three-dimensional skin papillae for camouflage. J. Comp. evolution of dimorphic coloration and ornamentation in agamid lizards. Proc.
Physiol. A Neuroethol. Sens. Neural Behav. Physiol. 195, 547–555 (2009). R. Soc. Lond. Ser. B Biol. Sci. 271, 2249–2255 (2004).
4. Cuthill, I. C. et al. The biology of color. Science https://doi.org/10.1126/science. 35. Langkilde, T. & Boronow, K. E. Hot boys are blue: temperature-dependent
aan0221 (2017). color change in male eastern fence lizards. J. Herpetol. 46, 461–465 (2012).
5. Seehausen, O., Van Alphen, J. J. M. & Lande, R. Color polymorphism and sex 36. Moreno Azócar, D. L. et al. Variation in body size and degree of melanism
ratio distortion in a cichlid fish as an incipient stage in sympatric speciation by within a lizards clade: is it driven by latitudinal and climatic gradients? J. Zool.
sexual selection. Ecol. Lett. 2, 367–378 (1999). 295, 243–253 (2014).
6. Pérez-Rodríguez, L., Jovani, R. & Stevens, M. Shape matters: animal colour 37. Pearson, O. P. The effect of substrate and of skin color on thermoregulation of
patterns as signals of individual quality. Proc. R. Soc. Lond. Ser. B Biol. Sci. 284, a lizard. Comp. Biochem. Physiol. Part A Physiol. 58, 353–358 (1977).
20162446 (2017). 38. Hutchinson, V. H. & Larimer, J. L. Reflectivity of the integuments of some
7. Tanaka, K. Thermal biology of a colour-dimorphic snake, Elaphe lizards from different habitats. Ecology 41, 199–209 (1960).
quadrivirgata, in a montane forest: Do melanistic snakes enjoy thermal 39. Norris, K. S. in Lizard Ecology: A Symposium (ed. W. W. Milstead) 162–229
advantages? Biol. J. Linn. Soc. 92, 309–322 (2007). (University of Missouri Press, 1967).
8. Smith, K. R. et al. Colour change on different body regions provides thermal 40. Barry, R. G., & Chorley, R. J. Atmosphere, Weather and Climate (Routledge,
and signalling advantages in bearded dragon lizards. Proc. R. Soc. Lond. Ser. B 2003).
Biol. Sci. 283, 20160626 (2016). 41. Olalla‐Tarraga, M. Á. & Rodríguez, M. Á. Energy and interspecific body size
9. Christian, K. A. & Tracy, C. R. The effect of the thermal environment on the patterns of amphibian faunas in Europe and North America: anurans follow
ability of hatchling galapagos land iguanas to avoid predation during dispersal. Bergmann’s rule, urodeles its converse. Glob. Ecol. Biogeogr. 16, 606–617
Oecologia 49, 218–223 (1981). (2007).
10. Clusella-Trullas, S., van Wyk, J. H. & Spotila, J. R. Thermal melanism in 42. Uetz, P., Freed, P. & Hošek, J. (eds.). The Reptile Database. http://www.reptile-
ectotherms. J. Therm. Biol. 32, 235–245 (2007). database.org (2020).
11. Moreno Azócar, D. L. et al. Effect of body mass and melanism on heat 43. Ohta, Y. I., Kanade, T. & Sakai, T. Color information for region segmentation.
balance in Liolaemus lizards of the goetschi clade. J. Exp. Biol. 219, 1162–1171 Comput. Graph. Image Process. 13, 222–241 (1980).
(2016). 44. Gueymard, C. A., Myers, D. & Emery, K. Proposed reference irradiance
12. Farouki, O. T. Thermal properties of soils. U.S. Army Corps of Engineers, Cold spectra for solar energy systems testing. Sol. Energy 73, 443–467 (2002).
Regions Research and Engineering Laboratory. https://doi.org/10.4236/ 45. Shawkey, M. D. et al. Beyond colour: consistent variation in near infrared and
ojss.2011.13011 (1981). solar reflectivity in sunbirds (Nectariniidae). Sci. Nat. (Naturwissenschaften)
13. Porter, W. P. & Gates, D. M. Thermodynamic equilibria of animals with 104, 78 (2017).
environment. Ecol. Monogr. 39, 227–244 (1969). 46. Shine, R. & Kearney, M. Field studies of reptile thermoregulation: how well do
14. Miller, G. E. in Introduction to Biomedical Engineering (3rd edn.) (eds. physical models predict operative temperatures? Funct. Ecol. 15, 282–288
Enderle, J., & Bronzino, J.) pp. 937–993 (Academic press, 2012). (2001).
15. Prota, G. Melanins and Melanogenesis (Academic Press, New York, 1992).
8 COMMUNICATIONS BIOLOGY | (2021)4:26 | https://doi.org/10.1038/s42003-020-01524-w | www.nature.com/commsbioCOMMUNICATIONS BIOLOGY | https://doi.org/10.1038/s42003-020-01524-w ARTICLE
47. Reguera, S., Zamora-Camacho, F. J. & Moreno-Rueda, G. The lizard 76. Menegon, M., Davenport, T. R. & Howell, K. M. Description of a new and
Psammodromus algirus (Squamata: Lacertidae) is darker at high altitudes. Biol. critically endangered species of Atheris (Serpentes: Viperidae) from the
J. Linn. Soc. 112, 132–141 (2014). Southern Highlands of Tanzania, with an overview of the country’s tree viper
48. Martínez-Freiría, F., Toyama, K. S., Freitas, I. & Kaliontzopoulou, A. Thermal fauna. Zootaxa 3120, 43–54 (2011).
melanism explains macroevolutionary variation of dorsal pigmentation in 77. Goldenberg, J., D’Alba, L. Bisschop, K., Vanthournout, B., Shawkey, M.
Eurasian vipers. Sci. Rep. 10, 1–10 (2020). “Replication Data for: Substrate thermal properties influence ventral
49. Pizzigalli, C. et al. Eco-geographical determinants of ornamentation in vipers. brightness evolution in ectotherms”; MacroBright v.0.1, https://doi.org/
Biol. J. Linnean Soc. 130, 1–14 (2020). 10.34894/FZ66NU, DataverseNL, V2. (2020).
50. Kurschner, W. M., Kvacek, Z. & Dilcher, D. L. The impact of Miocene 78. R-Core-Team. R: A Language and Environment for Statistical Computing. R
atmospheric carbon dioxide fluctuations on climate and the evolution of Foundation for Statistical Computing. https://www.R-project.org/ (2019)
terrestrial ecosystems. Proc. Natl Acad. Sci. USA 105, 449–453 (2008). 79. Pennell, M. W. et al. geiger v2.0: an expanded suite of methods for fitting
51. Schraft, H. A., Goodman, C. & Clark, R. W. Do free-ranging rattlesnakes use macroevolutionary models to phylogenetic trees. Bioinformatics 15,
thermal cues to evaluate prey? J. Comp. Physiol. A Neuroethol. Sens. Neural 2216–2218 (2014).
Behav. Physiol. 204, 295–303 (2018). 80. Revell, L. J. phytools: An R package for phylogenetic comparative biology (and
52. Alencar, L. R. V. et al. Diversification in vipers: phylogenetic relationships, other things). Methods Ecol. Evolution 3, 217–223 (2012).
time of divergence and shifts in speciation rates. Mol. Phylogenet. Evol. 105, 81. Stayton, C. T. convevol: Analysis of Convergent Evolution. R package version
50–62 (2016). 1.3. https://CRAN.R-project.org/package=convevol (2018).
53. Zhang, Z. et al. Aridification of the Sahara desert caused by Tethys Sea 82. Stayton, C. T. The definition, recognition, and interpretation of convergent
shrinkage during the Late Miocene. Nature 513, 401–404 (2014). evolution, and two new measures for quantifying and assessing the
54. Pokorny, L. et al. Living on the edge: timing of Rand Flora disjunctions significance of convergence. Evolution 69, 2140–2153 (2015).
congruent with ongoing aridification in Africa. Front. Genet. 6, 154 (2015). 83. Hadfield, J. D. MCMC methods for multi-response generalized linear mixed
55. Barlow, A. et al. Ancient habitat shifts and organismal diversification are models: the MCMCglmm R Package. J. Stat. Softw. 33, 1–22 (2010).
decoupled in the African viper genus Bitis (Serpentes: Viperidae). J. Biogeogr. 84. Barton, K. MuMIn: Multi-Model Inference. R package version 1.43.15. https://
46, 1234–1248 (2019). CRAN.R-project.org/package=MuMIn (2019).
56. Senut, B., Pickford, M. & Ségalen, L. Neogene desertification of Africa. C. R. 85. Marchetti, M. P., Light, T., Moyle, P. B. & Viers, J. H. Fish invasions in
Geosci. 341, 591–602 (2009). California watersheds: testing hypotheses using landscape patterns. Ecol. Appl.
57. Douglas, M. E., Douglas, M. R., Schuett, G. W. & Porras, L. W. Evolution of 14, 1507–1525 (2004).
rattlesnakes (Viperidae; Crotalus) in the warm deserts of western North 86. Buxton, A. S., Groombridge, J. J., Zakaria, N. B. & Griffiths, R. A. Seasonal
America shaped by Neogene vicariance and Quaternary climate change. Mol. variation in environmental DNA in relation to population size and
Ecol. 15, 3353–3374 (2006). environmental factors. Sci. Rep. 7, 1–9 (2017).
58. Zhisheng, A., Kutzbach, J. E., Prell, W. L. & Porter, S. C. Evolution of Asian 87. Hadfield, J. MCMC Course Notes. https://cran.r-project.org/web/packages/
monsoons and phased uplift of the Himalaya–Tibetan plateau since Late MCMCglmm/vignettes/CourseNotes.pdf (2018).
Miocene times. Nature 411, 62 (2001). 88. Gelman, A. & Rubin, B. D. Inference from iterative simulation using multiple
59. Janis, C. M., Damuth, J. & Theodor, J. M. The species richness of Miocene sequences. Stat. Sci. 7, 457–511 (1992).
browsers, and implications for habitat type and primary productivity in the 89. Porter, W. P., Mitchell, J. W., Beckman, W. A. & DeWitt, C. B. Behavioral
North American grassland biome. Palaeogeogr. Palaeoclimatol. Palaeoecol. implications of mechanistic ecology - Thermal and behavioral modeling
207, 371–398 (2004). of desert ectotherms and their microenvironment. Oecologia 13, 1–54
60. Walters, K. A., & Roberts, M. S. The structure and function of Skin. https://doi. (1973).
org/10.1002/yea (2002). 90. Orlov, N. L., Sundukov, Y. N. & Kropachev, I. I. Distribution of pitvipers of
61. Wüster, W., Peppin, L., Pook, C. E. & Walker, D. E. A nesting of vipers: “Gloydius blomhoffii” complex in Russia with the first records of Gloydius
phylogeny and historical biogeography of the Viperidae (Squamata: blomhoffii blomhoffii at Kunashir island (Kuril archipelago, Russian far east).
Serpentes). Mol. Phylogenet. Evol. 49, 445–459 (2008). Russ. J. Herpetol. 21, 169–178 (2014).
62. Shine, R. & Li-Xin, S. Arboreal ambush site selection by pit-vipers Gloydius
shedaoensis. Anim. Behav. 63, 565–576 (2002).
63. Ursenbacher, S. et al. Postglacial recolonization in a cold climate specialist in Acknowledgements
western europe: patterns of genetic diversity in the adder (Vipera berus) We are grateful to the Tel Aviv University’s Garden for Zoological Research for pro-
support the central-marginal hypothesis. Mol. Ecol. 24, 3639–3651 (2015). viding access to their reptile collection; especially to Shai Meiri, Ron Michlin, and Yossi
64. Blumthaler, M., Ambach, W. & Ellinger, R. Increase in solar UV radiation Yovel for arranging the visit and Barak Levi for the great support during animal
with altitude. J. Photochem. Photobiol. B Biol. 39, 130–134 (1997). handling. We are thankful to Lionel Hertzog, Rafael Maia, and Joshua W. Lambert for
65. Gaston, K. J. Global patterns in biodiversity. Nature 405, 220–227 (2000). the statistical support and to EON and TEREC groups for the multiple constructive
66. Körner, C. et al. in Ecosystems and Human Well-being, Chapter 24, vol. 1. discussions. We thank Florian Van Hecke and Bram De Vilder for the repeatability
(Island Press, 2005). analysis. J.G. was funded by the Special Research Fund of Ghent University (BOF). K.B.
67. Tuniyev, B. et al. Gloydius halys. The IUCN Red List of Threatened Species was funded through a VICI grant (VICI grant no. 865.13.00) and the Special Research
2009: e.T157282A5069394. https://www.iucnredlist.org/species/157282/ Fund (BOF) of Ghent University. This work was supported by the Research Foundation-
5069394 (2009). Flanders (FWO) grant GOG2217N.
68. Salter, C., Hobbs, J., Wheeler, J., Kostbade, J. T. Essentials of World Regional
Geography 2nd edn. (Harcourt Brace, New York, 2005) pp. 464–465. Author contributions
69. Couplan, F., & Ligeon, J. C. Fleurs des Alpes: balade d’un botaniste, des plaines J.G., L.D.A., K.B., B.V., and M.D.S. contributed to the writing of the manuscript and the
aux sommets (Nathan, 2005). interpretation of the results. J.G., L.D.A., and M.D.S. conceived the project. J.G., L.D.A.,
70. Solórzano, A., Porras, L. W., Chaves, G., Bonilla, F. & Batista, A. Atropoides and K.B. performed the analyses.
picadoi. The IUCN Red List of Threatened Species 2014: e.T203657A2769424.
https://doi.org/10.2305/IUCN.UK.2014-1.RLTS.T203657A2769424.en. (2014).
71. Canseco-Márquez, L. & Muñoz-Alonso, A. Bothriechis rowleyi. The IUCN Red Competing interests
List of Threatened Species 2007: e.T64304A12761506. https://doi.org/10.2305/ The authors declare no competing interests.
IUCN.UK.2007.RLTS.T64304A12761506.en. (2020).
72. Feldman, A., Sabath, N., Pyron, R. A., Mayrose, I. & Meiri, S. Body sizes and
diversification rates of lizards, snakes, amphisbaenians and the tuatara. Glob.
Additional information
Supplementary information is available for this paper at https://doi.org/10.1038/s42003-
Ecol. Biogeogr. 25, 187–197 (2016).
020-01524-w.
73. Hill, N. Description of cranial elements and ontogenetic change within
Tropidolaemus wagleri (Serpentes: Crotalinae). PLoS ONE 14, e0206023 (2019).
Correspondence and requests for materials should be addressed to J.G.
74. Savage, J. M. The Amphibians and Reptiles of Costa Rica: A Herpetofauna
between two Continents, between two Seas. (University of Chicago Press,
Reprints and permission information is available at http://www.nature.com/reprints
Chicago, 2002).
75. Fathinia, B., Rastegar-Pouyani, N., Rastegar-Pouyani, E., Todehdehghan, F. &
Publisher’s note Springer Nature remains neutral with regard to jurisdictional claims in
Amiri, F. Avian deception using an elaborate caudal lure in Pseudocerastes
published maps and institutional affiliations.
urarachnoides (Serpentes: Viperidae). Amphib. Reptilia 36, 223–231 (2015).
COMMUNICATIONS BIOLOGY | (2021)4:26 | https://doi.org/10.1038/s42003-020-01524-w | www.nature.com/commsbio 9You can also read