Mutualism with sea anemones triggered the adaptive radiation of clownfishes - WSL
←
→
Page content transcription
If your browser does not render page correctly, please read the page content below
Litsios et al. BMC Evolutionary Biology 2012, 12:212
http://www.biomedcentral.com/1471-2148/12/212
RESEARCH ARTICLE Open Access
Mutualism with sea anemones triggered the
adaptive radiation of clownfishes
Glenn Litsios1,2, Carrie A Sims3, Rafael O Wüest4, Peter B Pearman4, Niklaus E Zimmermann4 and
Nicolas Salamin1,2*
Abstract
Background: Adaptive radiation is the process by which a single ancestral species diversifies into many
descendants adapted to exploit a wide range of habitats. The appearance of ecological opportunities, or the
colonisation or adaptation to novel ecological resources, has been documented to promote adaptive radiation in
many classic examples. Mutualistic interactions allow species to access resources untapped by competitors, but
evidence shows that the effect of mutualism on species diversification can greatly vary among mutualistic systems.
Here, we test whether the development of obligate mutualism with sea anemones allowed the clownfishes to
radiate adaptively across the Indian and western Pacific oceans reef habitats.
Results: We show that clownfishes morphological characters are linked with ecological niches associated with the
sea anemones. This pattern is consistent with the ecological speciation hypothesis. Furthermore, the clownfishes
show an increase in the rate of species diversification as well as rate of morphological evolution compared to their
closest relatives without anemone mutualistic associations.
Conclusions: The effect of mutualism on species diversification has only been studied in a limited number of
groups. We present a case of adaptive radiation where mutualistic interaction is the likely key innovation, providing
new insights into the mechanisms involved in the buildup of biodiversity. Due to a lack of barriers to dispersal,
ecological speciation is rare in marine environments. Particular life-history characteristics of clownfishes likely
reinforced reproductive isolation between populations, allowing rapid species diversification.
Keywords: Ecological speciation, Diversification, Comparative method, Evolutionary rate, Brownian Motion,
Pomacentridae
Background The process is similar in the aftermath of a mass ex-
The concept of adaptive radiation has been central to tinction event, which allows surviving species to radiate
evolutionary biology since Darwin’s work on Galapagos rapidly by filling the available empty niches [7]. Modifi-
finches [1-3]. The general understanding of this process cation of a resource can also trigger native species radi-
is that rates of ecomorphological changes and species di- ation as demonstrated by the radiation of Lupinus in
versification will be increased by ecological opportunities high-elevation habitats that appeared during the An-
offering available resources untapped by competing spe- dean uplift [8]. Finally, the appearance of a trait allow-
cies [4]. Ecological opportunity can arise for four main ing new interactions with the environment, or key
reasons [5], the most widely described being the colon- innovation, can create an opportunity for species radi-
isation of geographically isolated areas with depauperate ation [9]. For example, the evolution of antifreeze
fauna (e.g. cichlid fishes in East-African Great Lakes [6]). glycoproteins found in notothenioid fishes of Antarctica
is thought to have triggered their adaptive radiation by
* Correspondence: nicolas.salamin@unil.ch
allowing survival in extreme environments [10]. In an
1
Department of Ecology and Evolution, Biophore, University of Lausanne, analogous manner to key innovations, the evolution of
1015, Lausanne, Switzerland mutualistic interactions can provide access to previ-
2
Swiss Institute of Bioinformatics, Génopode, Quartier Sorge, 1015, Lausanne,
Switzerland
ously inaccessible resources. For instance, phytopha-
Full list of author information is available at the end of the article gous insects host mutualistic microbes, which enable
© 2012 Litsios et al.; licensee BioMed Central Ltd. This is an Open Access article distributed under the terms of the Creative
Commons Attribution License (http://creativecommons.org/licenses/by/2.0), which permits unrestricted use, distribution, and
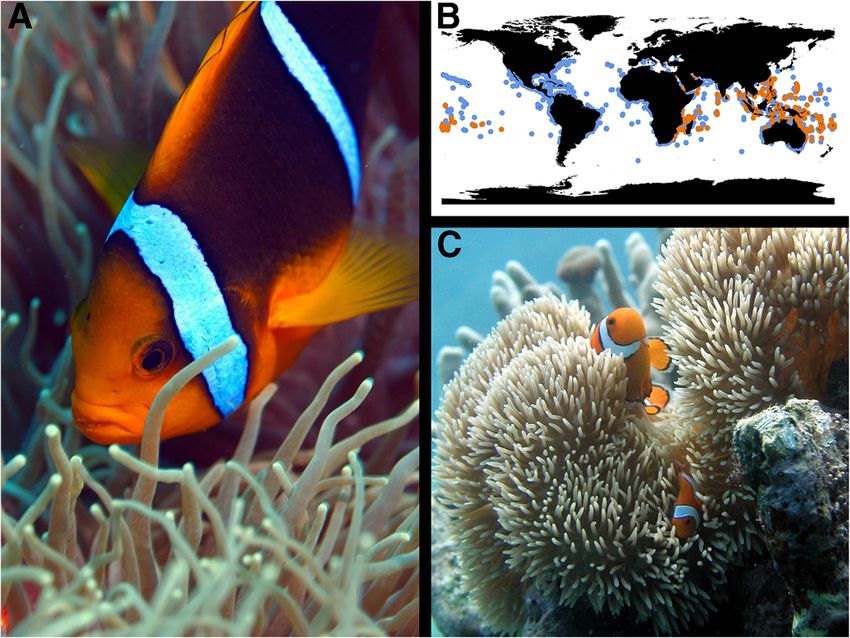
reproduction in any medium, provided the original work is properly cited.Litsios et al. BMC Evolutionary Biology 2012, 12:212 Page 2 of 15 http://www.biomedcentral.com/1471-2148/12/212 the breakdown and digestion of plant compounds by of the sea anemones. Furthermore, waste ammonia the insects [11]. While a plethora of case studies show- excreted by the clownfishes is used by the endosym- ing adaptive radiation driven by ecological opportunity biotic dinoflagellates living in the sea anemone tis- offered by one of the aforementioned possibilities exist sues, which makes it a three-way interaction [19,21]. [9], examples involving mutualism are scarce (but see The efficiency of the protection provided by the sea [12]). Since hosts shifts have allowed ecological speci- anemone is demonstrated by the extraordinary life span ation in a wide range of organisms, including coral- of clownfishes (ca. 30 years recorded for Amphiprion dwelling fish [13,14], there is a possibility for ecological percula), which is twice as long as any other damselfish speciation to occur in mutualistic systems. However, and six times greater than the expected longevity for a results from empirical and theoretic studies give contra- fish of that size [23]. dictory evidence on the effect of mutualism on species While species of clownfishes can develop mutualistic diversification [15,16]. The topic is thus still debated interactions with up to ten species of sea anemones and in need of further case studies. (Table 1), a large variation in host usage exists within the The clownfishes (or anemonefishes; subfamily Amphi- clade [20]. Eight host sea anemones have a widespread dis- prioninae) are a group of 30 species within the damselfish tribution and two (Heteractis malu and Macrodactyla family (Teleostei; Perciformes; Pomacentridae; [17]) and doreensis) have more restricted ranges, but are distributed are emblematic species of coral reefs (Figure 1A & 1C). around the centre of diversity for the clownfishes, making Their distribution spans from the Indian to the western interaction between most clownfishes and host species Pacific Oceans (Figure 1B) with their highest species rich- geographically possible [20]. Although geographically ness found in the Indo-Malay archipelago where up to widespread, sea anemone species differ in their preferred nine species have been observed in sympatry [18]. Their habitat (e.g. reef zonation, substrate, depth; [24]). It was complex association with sea anemones is now a textbook shown that coexistence of multiple clownfish species was example for mutualistic interactions [19-21]. Clownfishes possible because of difference in host and habitat utilisa- are left unharmed by the otherwise lethal nematocysts of tion [18]. It is therefore possible that the appearance of the sea anemone tentacles. This ability is thought to come mutualism was the key innovation that allowed the clown- from a protective mucous coat that prevents the discharge fishes to diversify in ecological niches associated with the of the nematocysts [22] and allows clownfishes to settle in different sea anemones species. However, this hypothesis sea anemones. The protection against predators pro- has never been tested thoroughly. vided by the sea anemones is a direct advantage for Examples of ecological speciation events are rare in clownfishes. Likewise, clownfishes chase the predators marine ecosystems. This is likely due to the fact that Figure 1 Clownfishes and sea anemones mutualism, and geographic distribution. Illustration of the mutualistic relationship between Amphiprion chrysopterus and Heteractis crispa (A). The distribution of the damselfishes in blue and of the clownfishes in orange is shown in panel B. As for every clownfish species, the female Amphiprion percula (on top of the picture of panel C, here with Stichodactyla gigantea) is bigger than the male beneath.
Table 1 Interaction matrix between clownfishes and their sea anemone hosts

                                                                                                                                                                                                                            http://www.biomedcentral.com/1471-2148/12/212
                                                                                                                                                                                                                            Litsios et al. BMC Evolutionary Biology 2012, 12:212
                              Cryptodendrum            Entacmaea            Heteractis      Heteractis.    Heteractis         Macrodactyla         Stichodactyla       Stichodactyla       Stichodactyla       Heteractis
                              adhaesivum               quadricolor          aurora          crispa         magnifica          doreensis            gigantea            haddoni             mertensii           malu
Amphiprion akallopisos                                                                                     +                                                                               +
Amphiprion akindynos                                   +                    +               +              +                                                           +                   +
Amphiprion allardi                                     +                    +                                                                                                              +
Amphiprion barberi                                     +                                    +
Amphiprion bicinctus                                   +                    +               +              +                                       +                                       +
Amphiprion chagosensis                                 (+)
Amphiprion chrysogaster                                                     +                              +                                                           +                   +
Amphiprion chrysopterus                                +                    +               +              +                  +                                        +                   +
Amphiprion clarkii            +                        +                    +               +              +                  +                    +                   +                   +                   +
Amphiprion ephippium                                   +                                    +
Amphiprion frenatus                                    +
Amphiprion fuscocaudatus                                                                                                                                                                   +
Amphiprion latezonatus                                                                      +
Amphiprion latifasciatus                                                                                                                                                                   +
Amphiprion leucokranos                                                                      +              +                                                                               +
Amphiprion mccullochi                                  +
Amphiprion melanopus                                   +                                    +              +
Amphiprion nigripes                                                                                        +
Amphiprion ocellaris                                                                                       +                                       +                                       +
Amphiprion omanensis                                   +                                    +                                                                          +
Amphiprion pacificus                                                                                       +
Amphiprion percula                                                                          +              +                                       +
Amphiprion perideraion                                                                      +              +                  +                    +
Amphiprion polymnus                                                                         +                                 +                                        +
Amphiprion rubrocinctus                                +                                                                                           +
Amphiprion sandaracinos                                                                     +                                                                                              +
Amphiprion sebae                                                                                                                                                       +
Amphiprion thiellei                                                                         (+)                                                                                            (+)
Amphiprion tricinctus                                  +                    +               +                                                                                              +

                                                                                                                                                                                                                                                       Page 3 of 15
Premnas biaculeatus                                    +
Known interactions are shown by plus signs. Field records are lacking for A. chagonsensis and A. thiellei, the most probable host is shown between parentheses. The species status of A. leucokranos and A. thiellei is
debated as they may be natural hybrids [20].
Litsios et al. BMC Evolutionary Biology 2012, 12:212 Page 4 of 15
http://www.biomedcentral.com/1471-2148/12/212
long-distance dispersal is common among marine or- standard length and the greatest body depth or “body
ganism [25]. However, clownfishes are known to have ratio”, the count of hard and soft dorsal-fin rays, the
high larval retention to natal reefs [26,27]. They are count of soft anal-fin rays, the count of pectoral-fin
also known to produce species-specific calls [28,29] rays, the number of gill rakers present on the first gill
that differ among geographic populations [30]. Such arch and the number of scales which possess a sen-
properties are likely to have reinforced reproductive sory tube or “lateral-line scales”). Standard length and
isolation by reducing gene-flow between clownfishes body ratio describe the overall fish shape, which has
populations and thus facilitated ecological speciation been shown to be linked with adaptation towards
processes in clownfishes. habitats with differing water velocity regimes [36,37].
In this study, we test whether the evolution of the mu- Fin morphology directly influences fish locomotory
tualism with sea anemone in the clownfishes lineage is a ability [38] and gill rakers are used as a proxy for the
key innovation that led to ecological adaptive radiation differentiation along the pelagic-benthic trophic re-
(sensu [4]). We ensure that the clownfishes are monophy- source axis [39]. The number of lateral-line scales is
letic by building a phylogeny for the Pomacentridae family. one of the more pronounced morphological differ-
Next, we show the occurrence of rapid speciation in the ences between the clownfishes and other damselfishes
clownfishes by testing whether their diversification rate is [40], and may be of importance in the ecological adaptive
higher than that of the other damselfishes. We then use an radiation. It was not possible to take into account intra-
ordination method on the mutualistic interactions to de- specific variation in our analysis and we recorded a single
scribe potential ecological niches associated with the sea value per trait estimated as the mean of the values obtained
anemones. We further apply phylogenetic comparative from the literature. To diminish potential allometric effects,
methods to test the association between morphological all traits were log transformed before further analysis.
traits and the putative ecological niches. We finally measure
the rate of evolution of the morphological traits to see if Phylogeny and divergence time estimation
they fit the theoretical expectation of faster morphological We assembled DNA sequence data for 196 Pomacentridae
evolutionary rate [4,31]. species (170/356 damselfishes, 26/30 clownfishes) spanning
all genera in the family (Accession numbers available in
Methods Additional file 2). Three cichlid species (Aequidens
Mutualism and clownfishes phenotype rivulatus, Thorichthys meeki, Tomocichla sieboldii) were
We collected data on the distribution of clownfishes among included as outgroups [41,42]. The concatenated sequence
the 10 possible sea anemone host species (Table 1; matrix was 6945 bp long and composed of six mitochon-
[19,20,32]). We applied a multiple correspondence analysis drial and three nuclear gene regions (12S, 16S, ATP6-8,
(MCA) on the matrix of mutualistic interactions between COI, cytochrome b, ND3, BMP-4, RAG1 & RAG2).
sea anemones and clownfishes. The MCA analysis is the Each DNA region was aligned separately with MUSCLE
counterpart of principal component analysis for categorical [43] and ambiguously aligned nucleotides were removed
data, which shows the underlying structure present in the using Gblocks [44].
dataset. We used the axes of the MCA that explained most After visually checking the alignment, we used BEAST
of the variance in the subsequent analysis. This allowed us [45] to simultaneously infer the phylogeny and estimate
to determine in a multivariate space, the characteristics of divergence times. We used a relaxed clock model, draw-
the ecological niches used by the clownfishes and provided ing substitution rates from a lognormal distribution. We
by mutualistic interactions. partitioned the alignment by gene as it outperformed an
We extracted morphological measurements of the unpartitioned analysis in Bayes factors in a similar data-
damselfish from the literature (mainly from [33], other set [41]. We selected, using Akaike information criterion
sources are listed in the Additional file 1). It is thought values (AIC), the substitution model that fits best
that adaptation to sea anemones required modifications each partition with the function “phymltest” available
of the general shape as well as a change in swimming in the Ape package [46] in R [47] (see the model
ability in host specialised clownfish. Indeed, continuous choice in Additional file 3). We used the only fossil
and fast swimming is not needed anymore because specia- calibration point available for the basal node of the
lised species never venture far from their host [34]. We Pomacentridae to obtain absolute divergence time
thus collected traits in the literature for all Pomacentridae estimates. The fossil that is the earliest record of
species present in our phylogeny that are linked with body Pomacentridae (Monte Bolca, Italy) dates back to 50
shape and swimming abilities as well as trophic niche, million years (MY) [48], which we used as minimum
which is generally linked with habitat in Pomacentridae age with a lognormal prior (mean = 2; sd = 1.2; prior
[35]. This analysis resulted in a matrix of eight morpho- 5-95% = 51.03-103.2) following [41]. We selected a lognor-
logical traits (maximum standard length, the ratio between mal prior to allow the basal node of the Pomacentridae toLitsios et al. BMC Evolutionary Biology 2012, 12:212 Page 5 of 15
http://www.biomedcentral.com/1471-2148/12/212
reach back to ~105 MY, which is the probable age of the help choose which branch length unit will be the most ap-
Perciformes [49,50]. We performed two parallel BEAST propriate for comparative analysis [51]. For both indexes,
runs, each 5*107 generations long and sampled posterior a value close to 0 is diagnostic of a weak or nonexistent
distributions every 1,000 generations. We checked the phylogenetic structure, while values close to one are
convergence of the two chains, optimal sampling of model expected if the data follows a Brownian motion (BM)
parameters and estimated the burn-in length in Tracer model of character evolution. We performed randomisa-
[45]. After the removal of 10,000 trees as burn-in, we tion tests for the K and a likelihood ratio test for λ to
merged both runs and inferred a maximum credibility test for an observed phylogenetic signal significantly
phylogeny using TreeAnnotator [45]. Finally, we resampled greater than 0. We repeated the analysis by taking
from the posterior distribution 100 trees to be used in fur- into account only the clownfishes and this time also
ther analysis. These time calibrated trees are hereafter re- measuring the phylogenetic signal of the four first
ferred to as the distribution of chronograms. As BEAST axes of the host usage MCA.
also outputs phylograms having branch lengths given in Past competition creating character displacement be-
expected number of substitution per site, we applied the tween related species will result in phenotypes that are
same resampling procedure to get a random sample correlated with resource usage [4]. We assessed whether
of 100 phylograms. This allowed us to test our hypoth- the morphological traits collected are linked to host
esis on two sets of phylogenies instead of possibly bias- usage in the clownfish by measuring the correlation
ing our results by choosing arbitrarily a specific branch between each of the first four axes of the MCA and the
length unit [51]. eight morphological traits. We used phylogenetic gener-
alised least squares (pGLS) as implemented in the caper
Diversification rate package in R [57]. The λ parameter, which models the
We used the package Diversitree [52] in R to test whether phylogenetic dependency of species trait values [55]
mutualism with sea anemones is linked with an increased was estimated by Maximum Likelihood and the model
diversification rate in the clownfishes as would be expected was replicated over each tree present in the samples
under the key innovation hypothesis. We applied the BiSSE of phylograms and chronograms. We assessed if the
method [53], which evaluates jointly the evolution of a bin- morphological variables explained a significant part of
ary character (here presence or absence of mutualism with the variance in the model by running an ANOVA on
sea anemones), speciation and extinction rates. As we do the pGLS output.
not have a complete sampling of the Pomacentridae, we
used an extension of the method that deals with incom- Morphological evolutionary rate
pletely sampled phylogenies [52]. A one-rate birth-death We measured the differences in rate of morphological
model is fitted to the whole tree and compared, using AIC evolution between clownfishes and damselfishes by com-
and Likelihood ratio test, with an alternative model allow- paring the fit of a single rate BM model to that of a mul-
ing two separate rates of speciation and extinction for tiple rate model. It has been shown that other models
clownfishes and damselfishes species. In this particular case, could better fit the data than BM especially in adaptive
the clownfishes are a monophyletic group nested within the radiations [58,59]. We choose to use BM because our
Pomacentridae phylogeny. No known clownfishes species goal is solely to compare the relative rate of evolution
has lost the mutualistic behaviour and we therefore forced between groups and not the actual trait values. The sin-
the loss of mutualism in the model (parameter q10) to a gle rate model assumes that all lineages accumulate the
fixed null value. We optimised the other parameters of the same amount of morphological variance per unit of
model (rates of speciation, extinction and probability of time while the multiple model allows clownfishes to
character change) by Maximum Likelihood estimation in- have a different rate of evolution than the damselfishes.
dependently on each of the 100 randomly sampled chrono- Both models were specified in the Phytools package [56]
grams to account for phylogenetic uncertainty. The rate of that implements the non-censored version of a typical
diversification was calculated by subtracting the extinction BROWNIE analysis [60]. The best fitting model was
rate from the speciation rate. selected according to sample size corrected AIC (AICc).
We analysed each of the recorded morphological traits
Phylogenetic signal and phenotype-environment on the two sets of 100 trees randomly sampled from the
correlation posterior distributions of phylograms and chronograms.
We estimated the phylogenetic signal in the morphological
data on each of the 100 phylograms and chronograms with Results
the K [54] and λ [55] indexes as implemented in the Phylogenetic inference and divergence time
Phytools package [56] in R. Assessing the phylogenetic sig- Our maximum credibility phylogenetic tree shows strong
nal of a trait on both phylograms and chronograms can support for the monophyly of the clownfishes with a highLitsios et al. BMC Evolutionary Biology 2012, 12:212 Page 6 of 15
http://www.biomedcentral.com/1471-2148/12/212
posterior probability (PP = 0.98) for the basal node of the shows principally a depth gradient and the fourth axis
clade (Figure 2). The monophyly of the clownfishes as well (12% of variance) exhibits a gradient between sand
as the general tree topology that we recovered was congru- dwelling sea anemone species living either among or
ent with previous phylogenetic trees of the Pomacentridae away from coral reefs. Although this has not been formally
[17,41,61]. Most of the nodes of the tree were highly sup- tested, species that are close in the MCA (Figures 4 and 5)
ported (PP>0.95, Figure 2 and Additional file 4). and thus similar in host usage, seldom co-occur in the wild.
The estimated age of the root node of the Pomacentridae
(~55 MY) was similar to previous findings [41]. We in- Phylogenetic signal
ferred a root age of ~19 MY for the clownfish clade and In the whole Pomacentridae family, the morphological
found the crown Amphiprion group, which holds most of traits were generally highly conserved (K and λ close
the clownfishes species (25 out of 30 species), to have an to 1, Table 2). On average, the phylogenetic signal was
age of ~7 MY (Figure 2).We did not include in this diver- closer to 1 when measured on phylograms than on
gence time analysis the closure of the Isthmus of Panama. chronograms. This would suggest that, for comparative
This calibration point, which constrains the split of the phylogenetic methods that apply the BM model of
pairs Abudefduf concolor/taurus and Abudefduf troschelli/ character evolution, using phylograms would give more
saxatilis [41] was not used, because biogeographic informa- accurate results [51]. We nevertheless ran all the subse-
tion can be uncertain when constraining the age of species quent analysis on both kinds of phylogenetic trees be-
splits [62,63]. However, we recovered similar dates and con- cause there is only a slight difference in the measured
fidence intervals as estimated in [41]. phylogenetic signal of our data between the phylograms
and chronograms.
Speciation rate In contrast to the whole Pomacentridae phylogeny, the
We tested whether the evolution of the obligate mutual- phylogenetic signal of the morphological traits and the
ism with sea anemones fitted the expectation of a key first four axes of the host usage MCA measured only on
innovation and was linked with an increased rate of the clownfish clade were relatively weak (K and λ close
speciation in the clownfish. We observed that mutual- to 0; Table 2). Only one morphological character had K
ism with sea anemones was linked with higher speci- value significantly different from 0 (three for the λ) while
ation, extinction and diversification rates (Figure 3). no MCA axis showed this pattern (Table 3).
The model allowing distinct rates of speciation and
extinction for clownfishes and damselfishes also explained Phenotype-environment correlation
the data significantly better than the simpler model where We assessed the correlation between clownfish morpho-
both groups have the same rate (median likelihood ratio logical traits and putative ecological niches (as described by
test P = 0.02). The dating and phylogenetic uncertainty the MCA axes) with a pGLS. The results for the models
are taken into account in the final result (Figure 3) were congruent between analysis of phylograms and
because we ran these analyses on a random sample of chronograms (Table 4). The analyses using phylograms
100 chronograms. found that all traits but body ratio and lateral line
scales had a significant relation with the first axis of the
Ecological niche of host usage MCA. Only standard length was important when cor-
The first four axes of the MCA explained 76% of the related with the third axis of the MCA. Results were
total variance in mutualistic interactions among clown- similar for chronograms, except for the pectoral-fin and
fish species and were kept for the following analysis hard dorsal-fin rays counts that did not significantly ex-
(Figures 4 and 5, see Additional files 5 and 6 for factorial plain variation in the first axis of the MCA (Table 4).
maps). Using knowledge on sea anemone habitat and
ecology [24], we could interpret the principal axes of the Morphological evolutionary rate
MCA. The first axis (35% of variance) showed a gra- We measured, for each morphological trait, the rate
dient of differing host usage by segregating generalists parameter of a BM model of character evolution to
clownfishes (positive values) that have interactions with assess if the appearance of mutualism was linked to
many sea anemone species from specialists (negative an increased rate of morphological evolution in the
values), which have a small range of possible sea clownfishes. We estimated, using AICc, if a model
anemone hosts. The remaining axes showed gradients where clownfishes and damselfishes have distinct rates
linked with habitat utilisation. Indeed, the second axis explains the observed data better than did a model of
(15% of variance) separates clownfishes species inter- common rate between the two groups. We found that,
acting with sea anemones that live on different types on phylograms, all traits studied had a larger rate of
of substrate (e.g. Heteractis aurora on sand and Entacmaea evolution in the clownfishes than in the damselfishes
quadricolor on rock). The third axis (14% of variance) (Figure 6). The pattern was more variable when measuredLitsios et al. BMC Evolutionary Biology 2012, 12:212 Page 7 of 15
http://www.biomedcentral.com/1471-2148/12/212
1 1
Aequidens rivulatus
Thorichthys meeki
Tomocichla sieboldii
1 Parma microlepis
Mecaenichthys immaculatus
0.98 Parma oligolepis
0.96 0.99
Plectroglyphidodon lacrymatus
Stegastes nigricans
0.99 1 0.99
Stegastes lividus
Stegastes planifrons
1 Stegastes imbricatus
Stegastes partitus
0.78 1 Stegastes diencaeus
1 0.96 1 Stegastes adustus
1 Stegastes leucostictus
Stegastes variabilis
1 Microspathodon dorsalis
1 Microspathodon chrysurus
0.97 1 1
Hypsypops rubicundus
Similiparma hermani
Abudefduf luridus
1 Plectroglyphidodon dickii
Plectroglyphidodon leucozonus
0.47 1 Stegastes obreptus
1 Stegastes apicalis
1 Stegastes altus
1 Stegastes fasciolatus
Lepidozygus tapeinosoma
0.81 Chromis ternatensis
1 0.66 Chromis viridis
Chromis caerulea
Chromis atripectoralis
1 Chromis notata
1 Chromis flavomaculata
0.99 1
Chromis chrysura
Chromis fumea
1 0.68 Chromis nitida
Chromis alta
0.99 Chromis punctipinnis
1 0.4 Chromis insolata
Chromis chromis
0.52 Chromis limbata
0.11 0.89 Chromis alpha
0.58 1 Chromis woodsi
0.6 Chromis opercularis
Chromis xanthura
0.67 0.39 Chromis cadenati
Chromis analis
0.35 0.26 Chromis degruyi
0.66 Chromis xanthochira
0.5
0.51 0.89 Chromis caudalis
Chromis xanthopterygia
Chromis weberi
0.27 0.96 Chromis abyssus
Chromis circumaurea
0.29 0.97 Chromis brevirostris
0.43 Chromis acares
Chromis vanderbilti
Chromis cyanea
1 0.98 Chromis multilineata
0.31 Azurina hirundo
0.69 Chromis atrilobata
Chromis agilis
0.99 1 Chromis amboinensis
0.97 Chromis ovatiformis
0.48 Chromis retrofasciata
0.99 0.85 0.92
Chromis atripes
Chromis margaritifer
10.99 Chromis iomelas
Dascyllus aruanus
Dascyllus melanurus
1 0.68 Dascyllus flavicaudus
1 Dascyllus marginatus
0.92 Dascyllus reticulatus
1 Dascyllus carneus
1 Dascyllus albisella
Dascyllus strasburgi
0.35 Dascyllus trimaculatus
1 1 Abudefduf declivifrons
Abudefduf concolor
1 Abudefduf taurus
1 1 Abudefduf notatus
Abudefduf septemfasciatus
1 Abudefduf sordidus
1 Abudefduf whitleyi
1 Abudefduf bengalensis
Abudefduf vaigiensis
1 0.96 Abudefduf margariteus
0.85 Abudefduf sparoides
Abudefduf sexfasciatus
1 0.81 Abudefduf abdominalis
Abudefduf lorenzi
1 Abudefduf saxatilis
1 Abudefduf hoefleri
1 0.99 Abudefduf troschelii
0.58 Nexilosus latifrons
Chrysiptera starcki
1 Dischistodus pseudochrysopoecilus
1 Dischistodus chrysopoecilus
Dischistodus melanotus
1 Dischistodus perspicillatus
0.97 Dischistodus prosopotaenia
1 0.87 Chrysiptera galba
0.73 Pomachromis richardsoni
0.82 Chrysiptera glauca
0.88 0.99
Chrysiptera unimaculata
0.92 Chrysiptera brownriggii
1 0.36
Chrysiptera leucopoma
Chrysiptera parasema
Cheiloprion labiatus
0.78 0.69 0.54
Chrysiptera oxycephala
Chrysiptera hemicyanea
0.6 Chrysiptera springeri
1 1
Chrysiptera rollandi
Chrysiptera talboti
0.57 Chrysiptera caeruleolineata
1 1
Chrysiptera rex
Chrysiptera cyanea
Chrysiptera taupou
0.62 0.72 Hemiglyphidodon plagiometopon
1 1
Amblyglyphidodon aureus
Amblyglyphidodon curacao
1 Amblyglyphidodon leucogaster
1 1
Altrichthys curatus
Altrichthys azurelineatus
1 Acanthochromis polyacanthus
1 Neoglyphidodon oxyodon
1 Neoglyphidodon polyacanthus
1 1
Neoglyphidodon melas
Neoglyphidodon nigroris
Neoglyphidodon thoracotaeniatus
0.49 Chrysiptera annulata
0.34 0.11
Amblypomacentrus clarus
Chrysiptera kuiteri
Chromis dasygenys
0.52 1 Pomacentrus bankanensis
1 Pomacentrus leptus
0.69 1 Pomacentrus pavo
1 Pomacentrus alleni
Pomacentrus caeruleus
1 0.91 Pomacentrus coelestis
1 Pomacentrus philippinus
Pomacentrus vaiuli
1 Pomacentrus trilineatus
1 Pomacentrus trichourus
0.38 0.83 Pomacentrus burroughi
Pomacentrus grammorhynchus
0.07 1 Pomacentrus moluccensis
0.6 0.58 Pomacentrus amboinensis
0.78 Pomacentrus albicaudatus
Pomacentrus adelus
Pomacentrus australis
0.67 0.71 1 Pomacentrus reidi
1 1
Pomacentrus chrysurus
1 Pomacentrus nagasakiensis
Pomacentrus milleri
Pomacentrus smithi
1 1 Pomacentrus lepidogenys
0.98 Pomacentrus stigma
1 Pomacentrus alexanderae
1 Pomacentrus nigromarginatus
Pomacentrus nigromanus
0.98 Pomacentrus brachialis
0.83 0.38 Pomachromis fuscidorsalis
Pristotis obtusirostris
0.49 0.89
Teixeirichthys jordani
Neopomacentrus miryae
0.61 Neopomacentrus sindensis
Neopomacentrus nemurus
0.72 0.98 Neopomacentrus azysron
0.42 0.77 Neopomacentrus cyanomos
0.88 Neopomacentrus taeniurus
Neopomacentrus filamentosus
Amphiprion latezonatus
0.98 0.99 1 Premnas biaculeatus
Amphiprion percula
0.63 Amphiprion ocellaris
Amphiprion clarkii
1 0.96 Amphiprion chrysopterus
Amphiprion leucokranos
0.48 1 Amphiprion sandaracinos
Amphiprion perideraion
0.87 Amphiprion akallopisos
0.19 0.84 Amphiprion polymnus
Amphiprion sebae
0.12 Amphiprion barberi
0.36 Amphiprion akindynos
0.98 Amphiprion mccullochi
0.99 Amphiprion ephippium
Amphiprion frenatus
0.24 0.51 1 Amphiprion melanopus
Amphiprion rubrocinctus
Amphiprion allardi
0.86 Amphiprion latifasciatus
0.57 Amphiprion chrysogaster
1 Amphiprion omanensis
0.14 Amphiprion bicinctus
0.93 Amphiprion nigripes
Amphiprion chagosensis
Late Cr. Paleocene Eocene Oligocene Miocene Pli. P.
70 60 50 40 30 20 10 0
Figure 2 Pomacentridae maximum credibility chronogram. Outgroup taxa are shown in black, damselfishes in blue and clownfishes in orange.
Error bars on node show the dating confidence intervals, scale is in MY. Numbers above nodes indicate Bayesian posterior probabilities.Litsios et al. BMC Evolutionary Biology 2012, 12:212 Page 8 of 15
http://www.biomedcentral.com/1471-2148/12/212
0.4
One Rate Model
Damselfishes
Clownfishes
0.3
Rate
0.2
0.1
0.0
Speciation Extinction Diversification
Figure 3 Diversification analysis. Rates of speciation, extinction and diversification measured on the sample of 100 chronograms. Rates of
damselfishes (mean diversification rate = 0.09) are shown in blue and clownfishes (mean diversification rate = 0.14) in orange.
on chronograms. In this case, only the standard length, clownfish species developed convergent phenotypes
body ratio, soft anal fin-rays and gill rakers had a faster correlated to the host-associated ecological niches.
evolutionary rate in the clownfishes. To verify that the ele-
vated rates found in the clownfishes were not due to the
relatively short branches of the clownfish clade we simu- Pomacentridae phylogeny and diversification
lated a continuous trait under a BM model with a single Our inferred phylogeny was congruent with previous
rate on our phylogenies. The rates we recovered were not work [17,41] and showed with high posterior prob-
different between clownfishes and damselfishes. abilities that clownfish are monophyletic within the
Pomacentridae family (Figure 2). We used the BiSSE
method [53] to test if the appearance of mutualism
Discussion acted as a key innovation and if it is associated with
We found that clownfishes exhibit patterns that are an increase in speciation rate. The BiSSE method is a
likely diagnostic of an ecological adaptive radiation powerful way to detect shifts in diversification rate
via ecological speciation [4]. Following the acquisition linked with a binary trait, but the change of state of
of specific ability to interact and live with sea ane- the binary trait does not usually correspond to a sin-
mones, clownfishes diversified into multiple ecological gle monophyletic group as in our case. Nevertheless,
niches linked with both host (Figure 7) and habitat we chose the BiSSE method as it takes into account
use. Morphological evolution accelerated and distinct the uncertainty in dating the appearance of mutualism
Figure 4 MCA of mutualistic interactions (axes 1 and 2). Each pie represent a clownfish species and the filling colours correspond to the
interacting sea anemone species (see legend in figure). Abbreviations: Amphiprion: A, Premnas: P, Stichodactyla: S, Entacmaea: E, Macrodactyla: M,
Heteractis: H, Cryptodendrum: C.Litsios et al. BMC Evolutionary Biology 2012, 12:212 Page 9 of 15
http://www.biomedcentral.com/1471-2148/12/212
Figure 5 MCA of mutualistic interactions (axes 3 and 4). Legend as in Figure 4.
on the phylogeny. Indeed, mutualism with sea ane- infer speciation rates on phylogenies that do not need
mones likely appeared in the common ancestor of the prior hypotheses on the location of the shift in rate
clownfish, but the stem branch of the group is ~13MY [64]. In a recent paper [41], the likely nodes of diversifi-
long (Figure 2). It is therefore important, when estimat- cation rate shifts were inferred for four coral reef fish fam-
ing speciation and extinction rates, to take into account ilies using relative cladogenesis test [65] and MEDUSA
the uncertainty in the time estimates that correspond [64]. The study included the Pomacentridae family and
to the appearance of this behaviour. We also con- they consistently found across methods that the clown-
strained the rate of mutualism loss to be null in the fishes experienced a significant rate increase. The rate shift
BiSSE model. This takes into account the fact that all
clownfish are nowadays mutualistic, but it may slightly Table 3 Phylogenetic signal of morphology and MCA
bias our analysis as it is not impossible that a clownfish axes
species will eventually revert to a non-mutualistic state. Phylograms Chronograms
However, we do not think that this parameter will in- K λ K λ
fluence significantly our results. Other methods exist to Standard 0.186±0.06 0.578±0.07 0.186±0.08 0.647±0.06
length
Table 2 Phylogenetic signal in the damselfishes Body ratio 0.149±0.09 0.868±0.16 0.147±0.10 0.829±0.08 *
Phylograms Chronograms Dorsal fin 0.201±0.04 0.131±0.24 0.179±0.05 0.085±0.20
hard rays
K λ K λ
Standard 0.407±0.11 0.934±0.09 0.358±0.10 0.883±0.04 Dorsal fin 0.169±0.07 0.175±0.30 0.150±0.07 0.141±0.26
length soft rays
Body ratio 0.205±0.08 0.954±0.07 0.233±0.09 0.921±0.02 Anal fin 0.11±0.09 0.941±0.14 ** 0.109±0.10 0.863±0.03 **
soft rays
Dorsal fin 0.467±0.14 0.925±0.06 0.461±0.14 0.886±0.02
soft rays Lateral line 0.245±0.10 0.686±0.14 0.216±0.09 0.666±0.21
scales
Dorsal fin 0.513±0.10 0.914±0.07 0.578±0.12 0.859±0.02
hard rays Pectoral 0.245±0.13 * 0.977±0.15 ** 0.239±0.14 0.89±0.08 **
fin rays
Anal fin 0.161±0.07 0.911±0.07 0.186±0.08 0.872±0.03
soft rays Gill rakers 0.068±0.05 0.721±0.11 * 0.068±0.06 0.738±0.05 **
Lateral line 0.856±0.30 1.026±0.06 0.973±0.33 0.962±0.02 MCA 1 0.097±0.06 0.322±0.41 0.088±0.05 0.326±0.40
scales MCA 2 0.033±0.03 0±0 0.032±0.03 0±0
Pectoral fin 0.349±0.12 0.842±0.06 0.329±0.12 0.842±0.04 MCA 3 0.108±0.05 0.172±0.12 0.106±0.05 0.285±0.12
rays
MCA 4 0.04±0.03 0.021±0.15 0.038±0.03 0±0
Gill rakers 0.237±0.09 1.011±0.07 0.294±0.12 0.949±0.02
Blomberg’s K and Pagel’s λ statistics of phylogenetic signal for the clownfish
Blomberg’s K and Pagel’s λ statistics of phylogenetic signal and standard morphological dataset and host usage MCA in the posterior distributions of
deviation for the damselfish morphological dataset in the posterior phylograms and chronograms. Phylogenetic signal significantly different than
distributions of phylograms and chronograms. For each trait, the statistic 0 is signified by asterisk (* = P-valuesLitsios et al. BMC Evolutionary Biology 2012, 12:212 Page 10 of 15
http://www.biomedcentral.com/1471-2148/12/212
Table 4 Correlation between morphological traits and Table 4 Correlation between morphological traits and
MCA axes MCA axes (Continued)
Phylograms Chronograms MCA Standard 1.498 1.247 1.56 1.248
Morphological Coefficients Error Coefficients Error 4 length ±0.035 ±0.015 ±-0.060 ±0.010
trait Body ratio 9.968 3.393 9.783 3.413
MCA Standard 0.264 1.785 −0.093 2.188 ±0.191 ±0.032 ±0.670 ±0.018
1 length ±0.321 ±0.115 ±0.755 ±0.408
Dorsal fin 7.273 6.502 7.820 6.337
Body ratio 0.039 4.480 −0.036 5.618 hard rays ±0.567 ±0.097 ±0.112 ±0.180
±1.765 ±0.468 ±1.435 ±1.423
Dorsal fin 0.651 6.551 1.395 6.395
Dorsal fin 8.617 11.096 3.661 11.074 soft rays ±0.609 ±0.073 ±0.400 ±0.321
hard rays ±1.941 ±0.715 ±4.792 ±2.168
Anal fin 9.599 7.148 9.327 7.142
Dorsal fin −6.904 12.666 −9.241 12.270 soft ray ±0.288 ±0.065 ±0.908 ±0.030
soft rays ±2.517 ±0.820 ±3.278 ±1.496
Pectoral −2.244 4.883 −2.427 4.864
Anal fin 0.155 9.593 −2.716 11.252 rays ±0.161 ±0.044 ±1.107 ±0.054
soft ray ±2.183 ±0.811 ±4.671 ±3.342
Lateral-line −10.471 4.058 −10.593 3.949
Pectoral −7.830 6.951 −4.235 8.226 scales ±0.154 ±0.083 ±0.200 ±0.018
rays ±3.415 ±1.247 ±5.400 ±2.055
Gill rakers −0.620 5.352 −0.742 5.316
Lateral-line −4.353 6.168 −1.190 7.030 ±0.151 ±0.067 ±1.517 ±0.199
scales ±1.593 ±0.349 ±4.424 ±-1.230 The table shows results and standard deviation of pGLS. Results in bold
Gill rakers 16.496 5.591 15.797 7.761 indicate variables explaining significant variation in the dependent variable as
±1.708 ±0.443 ±2.008 ±2.955 shown by the ANOVA on the pGLS output. Median adjusted R2 of the models
on phylograms, MCA 1 = 0.75, MCA 2 = 0.15, MCA 3 = 0.33, MCA 4 = 0.23, and
MCA Standard −0.920 1.452 −1.012 1.473 on chronograms, MCA 1 = 0.65, MCA 2 = 0.16, MCA 3 = 0.36, MCA 4 = 0.22.
2 length ±0.085 ±0.013 ±0.057 ±0.031
Body ratio 3.505 3.950 3.781 4.029
±0.143 ±0.054 ±0.459 ±0.024
was either placed at the origin of the clownfish or at
the base of the Amphiprion crown group. The fact that
Dorsal fin 3.751 7.569 2.811 7.484
hard rays ±0.518 ±0.115 ±0.488 ±0.325 a method which does not need a priori information
on the location of the diversification rate shift recov-
Dorsal fin 10.376 7.626 9.263 7.554
soft rays ±0.431 ±0.095 ±0.831 ±0.511 ered similar result as in our study confirms the
Anal fin −16.490 8.321 −16.398 8.433
strength of the diversification rate shift that occurred
soft ray ±0.543 ±0.074 ±0.890 ±0.060 in the clownfish clade.
Pectoral 7.134±0.241 5.685 7.356 5.742 It should be noted that the extinction rate also
rays ±0.060 ±0.747 ±0.003 increases in the clownfishes (Figure 3). A possible ex-
Lateral-line 0.024±0.295 4.724 0.253 4.663 planation is that during the diversification process, some
scales ±0.080 ±1.082 ±0.078 clownfish lineages did not leave any descendants as they
Gill rakers 4.083±0.344 6.23 4.429 6.274 were ecologically replaced by other more competitive
±-0.080 ±1.397 ±0.189 clownfish species. Such events could have occurred during
MCA Standard −2.421 1.233 −2.439 1.227 the long branch that is basal to the Amphiprion crown
3 length ±0.097 ±0.017 ±0.179 ±0.013 group. Also, it has been suggested that elevated extinction
Body ratio 1.134 3.356 1.024 3.355 rates in reef associated fishes could be linked with a poten-
±0.157 ±0.072 ±0.206 ±0.010 tial refuge effect of the coral reefs in the aftermath of pro-
Dorsal fin −1.219 6.430 −1.458 6.231 longed extinction events [41]. Yet, to be able to recover
hard rays ±0.472 ±0.134 ±0.415 ±0.194
extinction rate with high confidence and test such hypoth-
Dorsal fin −1.975 6.479 −2.173 6.288 eses, one would need clownfishes fossils [66], which are
soft rays ±0.435 ±0.131 ±0.112 ±0.336
not available. However, when compared to the damsel-
Anal fin −1.51 7.069 −1.429 7.023 fishes, the diversification rate of the clownfishes was still
soft ray ±-0.480 ±0.126 ±1.638 ±0.014
higher (Figure 3), showing that the extinction rate was not
Pectoral −5.235 4.829 −5.158 4.782
rays ±0.191 ±0.090 ±0.877 ±0.043
sufficient to slow down diversification [41].
Lateral-line −0.05 4.013 0.088 3.883
scales ±-0.300 ±0.091 ±1.333 ±0.026 Effect of mutualism and host-associated niches on
Gill rakers −1.585 5.293 −1.566 5.227 clownfishes evolution
±0.452 ±0.093 ±0.030 ±0.189 We measured the phylogenetic signal of each morpho-
logical trait on the samples of chronograms and phylo-
grams for the Pomacentridae (Tables 2 and 3). All
traits showed a signal close to one (the expectedLitsios et al. BMC Evolutionary Biology 2012, 12:212 Page 11 of 15
http://www.biomedcentral.com/1471-2148/12/212
A
7
Rate of Evolution (σ²)
* **
6
5
4
3
** * ** * ** *
2
1
0
1 2 3 4 5 6 7 8
1 Standard Length
2 Body Depth
3 Dorsal Fin Hard Rays
4 Dorsal Fin Soft Rays
5 Anal Fin Soft Rays
6 Lateral−Line Scales
7 Pectoral Fin Rays
8 Gill Rakers
B
0.03
Rate of Evolution (σ²)
* **
0.02
0.01
** *
0.00
1 2 3 4 5 6 7 8
Figure 6 Rate of morphological evolution. Evolution of the morphological traits measured on the sample of 100 phylograms (A) and
chronograms (B). Rates of clownfishes are in orange, damselfishes in blue and the one-rate model is shown in white. The P-values of model
comparison by likelihood ratio test is signified by asterisk (* = P-valuesLitsios et al. BMC Evolutionary Biology 2012, 12:212 Page 12 of 15 http://www.biomedcentral.com/1471-2148/12/212 Figure 7 Chronogram of the clownfishes radiation. Branch lengths are given in MY. The interacting sea anemone species are shown for each clownfish species. Sea anemone names abbreviations as in Figure 5. be explained by the morphological traits of our dataset for clownfishes (e.g. A. clarkii) will likely eat more plank- the first and third axes (Table 4). Increasing number of tonic food (and thus have more gill rakers) and be better hosts (represented by increasing values of the MCA 1 axis) swimmers than specialists, which never leave the close was correlated with a bigger size, more hard dorsal vicinity of their sea anemone host. Clownfishes that and soft anal rays, and more gill rakers, while size interact with sea anemones occurring at deeper depth was positively correlated with deeper habitats (repre- have also a bigger size, allowing for better locomotion in sented by decreasing values of the MCA 3 axis). In clown- areas where the water velocity is likely to be higher com- fishes, the phenotype-environment correlation relates to pared to more shallow and sheltered zones [70]. While both host usage (generalists/specialist gradient) and habi- our results show correlations between phenotype and envir- tat (substrate, depth). This contrasts with many exam- onment, we do not test for trait utility. This would require ples of adaptive radiation, where the resource axis a strict experimental setting that was out of scope for this has usually a single dimension representing habitat. There- paper. More studies are definitely needed to better describe fore, mutualism can be seen as a a key innovation that the adaptive advantage that those traits may provide in the offered untapped habitat for colonisation, but also allowed ecological context of the mutualistic interaction. diversification to happen on the host usage resource axes. Following an ecological opportunity, the rate of mor- The morphological traits studied are primarily used phological evolution is hypothesised to be elevated in for taxonomic purposes but they can still give important the traits that are functionally related to the ecological functional information for the evolution of the clown- niches filled during the radiation process [4,71,72]. We fishes. Size and fin traits are related to the locomotion tested this hypothesis on the eight morphological ability in various types of water velocities, while gill traits studied and found that, on phylograms, they all rakers can be used as a proxy for the trophic level. The evolved at higher rates in clownfishes than in dam- picture given by our analyses is that generalist selfishes (Figure 6). The picture is similar when rates
Litsios et al. BMC Evolutionary Biology 2012, 12:212                                                                            Page 13 of 15
http://www.biomedcentral.com/1471-2148/12/212

are measured on chronograms, although only four                   obligate mutualism with sea anemones is thought to be
characters are evolving significantly faster in the clown-        the key innovation that allowed clownfishes to radiate
fishes than in the damselfishes in this case. Following the       rapidly in untapped ecological niches. As expected under
comparison of phylogenetic signal that was made between           the ecological theory of adaptive radiation [4], it increased
phylograms and chronograms, phylograms are assumed to             diversification as well as rates of morphological evolution.
give, in this case, more accurate results [51]. The fact that     Clownfishes experienced rapid and convergent morpho-
all traits evolve at a higher rate is congruent with the pGLS     logical changes that were correlated with the different eco-
results, which shows all but two traits (lateral-line scales      logical niches offered by the host anemones. In marine
and body ratio) being significantly linked with host and          environments, barriers to dispersal are uncommon,
habitat usage. It is probable that lateral-line scales and body   which makes ecological speciation less likely than in
ratio evolutionary rates were accelerated in clownfishes be-      more isolated landscapes [25]. However clownfishes
cause they are indirectly correlated to the ecological niche      show a very short dispersal period compared to other
through another trait. Thus they would not be themselves          damselfishes [74]. In conjunction with a high reten-
correlated to host-usage/habitat but still show accelerated       tion of larva to natal reef [27] and population specific
rates of evolution. A clear followup to this broad descrip-       calls [30], restricted dispersal likely reinforced repro-
tion of clownfishes morphologies would be to extend our           ductive isolation between clownfish species allowing
analysis and use a morphometric approach (e.g. [36]) to be        for adaptive radiation.
able to give an accurate description of the different clown-
fishes ecotypes. Further studies will then be needed to test,
                                                                  Additional files
in an experimental framework, trait utility, which is one of
the diagnostic criteria of adaptive radiation [4]. The chem-       Additional file 1: References of morphological data used in this
ical biology of the interaction between clownfishes and            study.
sea anemones is also far from being solved [22]. It is             Additional file 2: GenBank accession number of the sequences
thus possible that unknown characteristics associated              used in this study.
for example, with the clownfishes mucus could be                   Additional file 3: Substitution model choice.
linked with the variation in interaction between clown-            Additional file 4: Phylogeny of the damselfish with branch lengths
                                                                   given in expected number of substitutions per site.
fishes and specific sea anemones.
                                                                   Additional file 5: Factorial map of the MCA analysis with
   We did not take into account the distribution of the            eigenvectors for the axes 1 and 2.
species in this study. Geographical isolation, coupled             Additional file 6: Factorial map of the MCA analysis with
with ecological differentiation, could also be at the ori-         eigenvectors for the axes 3 and 4.
gin of the evolutionary pattern found here. While sev-
eral clownfish species are local endemics that likely
                                                                  Competing interests
originated through vicariance events rather than ecological       The authors declare that they have no competing interests.
speciation, the majority of the species (17 out of 30) have
overlapping distributions centred on the Indo-Malay
                                                                  Authors’ contributions
archipelago. If reproductive isolation was solely due             GL and NS conceived the study. GL, CS and RW performed the analyses and
to geography, the latter species would have likely dis-           drafted the manuscript. NS supervised GL, coordinated the project and
appeared through hybridisation, which easily happens in           helped to draft the manuscript. PB and NZ supervised RW, participated in
                                                                  the coordination and helped to draft the manuscript. All authors read and
captivity [73]. Moreover, clownfishes that have similar           approved the final manuscript.
MCA values usually do not overlap in geographical
distribution (e.g. A. latifasciatus, A. nigripes and A.           Acknowledgments
sandaracinos in Figure 4), and sister species always              This work was funded by the grant (CRS113-125240) from the Swiss National
differ in host usage as can be seen on Figure 7. Such             Science Foundation to N.S., P.B.P. and N.E.Z. C.A.S. received a scholarship
                                                                  from the Summer Undergraduate Research Programme at Lausanne
a pattern could indicate that, in a given biogeographic           University. We would like to thank A. Dubuis, N. Arrigo, L. Pellissier, A.
region, only one species per ecological niche can sub-            Kostikova, P-A. Christin, M. Alfaro, N. Alvarez, L. Keller and two anonymous
sist, but also that ecologically similar species evolved          reviewers for their suggestions and comments on previous versions of the
                                                                  manuscript. We thank A. Grutter and K. Cheney for the pictures and
independently in geographically separated areas. This             Rattlebrained Designs for the clownfish drawing. This work received support
outlines the need for a thorough biogeographic analysis           from the Vital-IT facilities from the Swiss Institute of Bioinformatics.
that would help clarify the effect of geography on the
                                                                  Author details
evolution of the clownfish.                                       1
                                                                   Department of Ecology and Evolution, Biophore, University of Lausanne,
                                                                  1015, Lausanne, Switzerland. 2Swiss Institute of Bioinformatics, Génopode,
Conclusion                                                        Quartier Sorge, 1015, Lausanne, Switzerland. 3Ecological and Evolutionary
                                                                  Genetics Lab / Coral Reef Ecology Lab, School of Biological Sciences, The
Our study shows that clownfishes likely experienced an            University of Queensland, 4072, St Lucia, Australia. 4Landscape Dynamics,
adaptive radiation through ecological speciation. The             Swiss Federal Research Institute WSL, 8903, Birmensdorf, Switzerland.
Litsios et al. BMC Evolutionary Biology 2012, 12:212 Page 14 of 15
http://www.biomedcentral.com/1471-2148/12/212
Received: 6 June 2012 Accepted: 27 October 2012 27. Almany GR, Berumen ML, Thorrold SR, Planes S, Jones GP: Local
Published: 2 November 2012 replenishment of coral reef fish populations in a marine reserve. Science
2007, 316:742–744.
28. Parmentier E, Colleye O, Fine ML, Frédérich B, Vandewalle P, Herrel A:
References Sound production in the clownfish Amphiprion clarkii. Science 2007,
1. Grant PR: Ecology and evolution of Darwin’s finches. Princeton (NJ): Princeton 316:1006.
University Press; 1986:1–458. 29. Colleye O, Vandewalle P, Lanterbecq D, Lecchini D, Parmentier E:
2. Givnish TJ: Adaptive radiations and molecular systematics: issues and Interspecific variation of calls in clownfishes: degree of similarity in
approaches. In Molecular Evolution and Adaptive Radiation. Edited by closely related species. BMC Evol Biol 2011, 11:365.
Givnish TJ, Systma KJ. Cambridge, U.K: Cambridge Univ. Press; 1997:1–54.
30. Parmentier E, Lagardere JP, Vandewalle P, Fine ML: Geographical Variation
3. Losos JB: Adaptive Radiation, Ecological Opportunity, and Evolutionary in Sound Production in the Anemonefish Amphiprion akallopisos. Proc R
Determinism American Society of Naturalists E. O. Wilson Award Address Soc B 2005, 272:1697–1703.
*. Am Nat 2010, 175:623–639.
31. Harmon LJ, Schulte JA, Larson A, Losos JB: Tempo and mode of
4. Schluter D: The Ecology of Adaptive Radiation. Oxford, U.K.: Oxford University
evolutionary radiation in iguanian lizards. Science 2003, 301:961–964.
Press; 2000.
32. Allen GR, Drew J, Kaufman L: Amphiprion barberi, a new species of
5. Losos JB, Mahler DL: Adaptive Radiation: The Interaction of Ecological
anemonefish (Pomacentridae) from Fiji, Tonga, and Samoa. Aqua 2008,
Opportunity, Adaptation, and Speciation. In Evolution since Darwin: The
14:105–114.
First 150 Years. Edited by Bell MA, Futuyma DJ, Eanes WF, Levinton JS.
33. Allen GR: Damselfish of the world. Melle, Germany: Mergus Publishers;
Sunderland, MA: Sinauer As; 2010:381–420.
1991:271.
6. Salzburger W: The interaction of sexually and naturally selected traits in
34. Elliott JK, Lougheed SC, Bateman B, Mcphee LK, Boag PT: Molecular
the adaptive radiations of cichlid fishes. Mol Ecol 2009, 18:169–185.
evolution for the phylogenetic evidence of specialization in
7. Erwin DH: Lessons from the past: biotic recoveries from mass extinctions.
anemonefishes. Proc R Soc B 1999, 266:677–685.
Proc Natl Acad Sci USA 2001, 98:5399–5403.
35. Frédérich B, Fabri G, Lepoint G, Vandewalle P, Parmentier E: Trophic niches
8. Hughes C, Eastwood R: Island radiation on a continental scale:
of thirteen damselfishes (Pomacentridae) at the Grand Récif of Toliara.
exceptional rates of plant diversification after uplift of the Andes. Proc
Madagascar Ichthyol Res 2009, 56:10–17.
Natl Acad Sci USA 2006, 103:10334–10339.
9. Yoder JB, Clancey E, DES Roches S, Eastman JM, Gentry L, Godsoe W, Hagey 36. Clabaut C, Bunje PME, Salzburger W, Meyer A: Geometric morphometric
TJ, Jochimsen D, Oswald BP, Robertson J, Sarver BJ, Schenk JJ, Spear SF, analyses provide evidence for the adaptive character of the Tanganyikan
cichlid fish radiations. Evolution 2007, 61:560–578.
Harmon LJ: Ecological opportunity and the origin of adaptive radiations.
J Evol Biol 2010, 23:1581–1596. 37. Langerhans RB, Layman CA, Langerhans AK, Dewitt TJ: Habitat-associated
10. Matschiner M, Hanel R, Salzburger W: On the origin and trigger of the morphological divergence in two Neotropical fish species. Biol J Linn Soc
notothenioid adaptive radiation. PLoS One 2011, 6:e18911. 2003, 80:689–698.
11. Janson EM, Stireman JO, Singer MS, Abbot P: Phytophagous insect- 38. Drucker EG, Lauder GV: Locomotor function of the dorsal fin in teleost
microbe mutualisms and adaptive evolutionary diversification. Evolution fishes: experimental analysis of wake forces in sunfish. J Exp Biol 2001,
2008, 62:997–1012. 204:2943–2958.
12. Gómez JM, Verdú M: Mutualism with Plants Drives Primate Diversification. 39. Kahilainen KK, Siwertsson A, Gjelland KØ, Knudsen R, Bøhn T, Amundsen P-
Syst Biol 2012, 61:567–577. A: The role of gill raker number variability in adaptive radiation of
13. Munday PL, van Herwerden L, Dudgeon CL: Evidence for sympatric coregonid fish. Evol Ecol 2010, 25:573–588.
speciation by host shift in the sea. Curr Biol 2004, 14:1498–1504. 40. Allen GR: Damselfishes of the south seas. Neptune city, N.J: T.F.H.
14. Bolnick DI, Fitzpatrick BM: Sympatric speciation: models and empirical Publications; 1975:240.
evidence. Annu Rev Ecol Evol Syst 2007, 38:459–487. 41. Cowman PF, Bellwood DR: Coral reefs as drivers of cladogenesis:
15. Yoder JB, Nuismer SL: When does coevolution promote diversification? expanding coral reefs, cryptic extinction events, and the development of
Am. Nat 2010, 176:802–817. biodiversity hotspots. J Evol Biol 2011, 24:2543–2562.
16. Lengyel S, Gove AD, Latimer AM, Majer JD, Dunn RR: Ants sow the 42. Litsios G, Pellissier L, Forest F, Lexer C, Pearman PB, Zimmermann NE,
seeds of global diversification in flowering plants. PLoS One 2009, Salamin N: Trophic specialization influences the rate of environmental
4:e5480. niche evolution in damselfishes (Pomacentridae). Proc R Soc B 2012,
17. Quenouille B, Bermingham E, Planes S: Molecular systematics of the 279:3662–3669.
damselfishes (Teleostei: Pomacentridae): Bayesian phylogenetic analyses 43. Edgar RC: MUSCLE: multiple sequence alignment with high accuracy and
of mitochondrial and nuclear DNA sequences. Mol Phylogenet Evol 2004, high throughput. Nucleic Acids Res 2004, 32:1792–1797.
31:66–88. 44. Talavera G, Castresana J: Improvement of phylogenies after removing
18. Elliott JK, Mariscal RN: Coexistence of nine anemonefish species: divergent and ambiguously aligned blocks from protein sequence
differential host and habitat utilization, size and recruitment. Mar Biol alignments. Syst Biol 2007, 56:564–577.
2001, 138:23–36. 45. Drummond AJ, Rambaut A: BEAST: Bayesian evolutionary analysis by
19. Fautin DG, Allen GR: Anemonefishes and their host sea anemones. Perth: sampling trees. BMC Evol Biol 2007, 7:214.
Western Australian Museum; 1997. 46. Paradis E, Claude J, Strimmer K: APE: Analyses of Phylogenetics and
20. Ollerton J, McCollin D, Fautin DG, Allen GR: Finding NEMO: nestedness Evolution in R language. Bioinformatics 2004, 20:289–290.
engendered by mutualistic organization in anemonefish and their hosts. 47. R Development Core Team: R: A Language and Environment for
Proc R Soc B 2007, 274:591–598. Statistical Computing. Vienna, Austria: R Foundation for Statistical
21. Ricciardi F, Boyer M, Ollerton J: Assemblage and interaction structure of Computing; 2011.
the anemonefish-anemone mutualism across the Manado region of 48. Bellwood DR, Sorbini L: A review of the fossil record of the
Sulawesi. Indonesia Environ Biol Fishes 2010, 87:333–347. Pomacentridae (Teleostei: Labroidei) with a description of a new genus
22. Mebs D: Chemical biology of the mutualistic relationships of sea and species from the Eocene of Monte Bolca. Italy Zool J Linn Soc 1996,
anemones with fish and crustaceans. Toxicon 2009, 54:1071–1074. 117:159–174.
23. Buston PM, García MB: An extraordinary life span estimate for the clown 49. Santini F, Harmon LJ, Carnevale G, Alfaro ME: Did genome duplication
anemonefish Amphiprion percula. J Fish Biol 2007, 70:1710–1719. drive the origin of teleosts? A comparative study of diversification in ray-
24. Fautin DG: The clownfish sea anemones: Stichodactylidae (Coelenterata: finned fishes. BMC Evol Biol 2009, 9:194.
Actinaria) and others sea anemones symbiotic with Pomacentrid fishes. 50. Near TJ, Eytan RI, Dornburg A, Kuhn KL, Moore Ja, Davis MP,
T Am Philos Soc 1981, 71:3–115. Wainwright PC, Friedman M, Smith WL: Resolution of ray-finned fish
25. Puebla O: Ecological speciation in marine v. freshwater fishes. J Fish Biol phylogeny and timing of diversification. Proc Natl Acad Sci USA
2009, 75:960–996. 2012, 109:13698–13703.
26. Jones GP, Planes S, Thorrold SR: Coral reef fish larvae settle close to home. 51. Litsios G, Salamin N: Effects of Phylogenetic Signal on Ancestral State
Curr Biol 2005, 15:1314–1318. Reconstruction. Syst Biol 2012, 61:533–538.You can also read