Plant n-alkane production from litterfall altered the diversity and community structure of alkane degrading bacteria in litter layer in lowland ...
←
→
Page content transcription
If your browser does not render page correctly, please read the page content below
Biogeosciences, 15, 1815–1826, 2018
https://doi.org/10.5194/bg-15-1815-2018
© Author(s) 2018. This work is distributed under
the Creative Commons Attribution 3.0 License.

Plant n-alkane production from litterfall altered the diversity and
community structure of alkane degrading bacteria in litter layer in
lowland subtropical rainforest in Taiwan
Tung-Yi Huang1,* , Bing-Mu Hsu1,* , Wei-Chun Chao2 , and Cheng-Wei Fan1
1 Department of Earth and Environmental Sciences, National Chung Cheng University, Chiayi City, Taiwan
2 Department of Forestry and Natural Resources, National Chiayi University, Chiayi City, Taiwan
* These authors contributed equally to this work.

Correspondence: Cheng-Wei Fan (cwfan@mail.eq.ccu.edu.tw)

Received: 27 April 2017 – Discussion started: 31 May 2017
Revised: 13 February 2018 – Accepted: 20 February 2018 – Published: 28 March 2018

Abstract. n-Alkane and alkane-degrading bacteria have long            gesting a causal relationship between the plant n-alkane pro-
been used as crucial biological indicators of paleoecology,           duction and microbial community diversity. This finding in-
petroleum pollution, and oil and gas prospecting. However,            dicates that the diversity and relative abundance of microbial
the relationship between n-alkane and alkane-degrading bac-           communities in the litter layer are affected by n-alkane plant
teria in natural forests is still poorly understood. In this study,   composition in the litterfall.
long-chain n-alkane (C14 –C35 ) concentrations in litterfall,
litter layer, and topsoil as well as the diversity and abundance
of n-alkane-degrading bacterial communities in litter layers
were investigated in three habitats across a lowland subtropi-        1   Introduction
cal rainforest in southern Taiwan: ravine, windward, and lee-
ward habitats in Nanjenshan. Our results demonstrate that the         Alkanes are saturated hydrocarbons that account for a small
litterfall yield and productivity of long-chain n-alkane were         fraction of the total organic carbon, with a concentration
highest in the ravine habitats. However, long-chain n-alkane          range in natural habitats of not more than a couple of thou-
concentrations in all habitats were decreased drastically to          sand parts per million by weight (Rojo, 2010; Gomez-Coca
a similar low level from the litterfall to the bulk soil, sug-        et al., 2016). In non-contaminated habitats, long-chain n-
gesting a higher rate of long-chain n-alkane degradation in           alkanes with an odd/even predominance are produced by
the ravine habitat. Operational taxonomic unit (OTU) anal-            plants or algae to act as chemoattractants or agents that pro-
ysis using next-generation sequencing data revealed that the          tect against microbial invasion or water loss (Koch et al.,
relative abundances of microbial communities in the wind-             2009; Feakins et al., 2016). Alkanes are exceptionally sta-
ward and leeward habitats were similar and different from             ble molecules that can survive in soil and sediment, which
that in the ravine habitat. Data mining of community ampli-           make them useful as biomarkers in paleoecology (Sachse
con sequencing using the NCBI database revealed that alkB-            et al., 2012). Because alkanes are the major components in
gene-associated bacteria (95 % DNA sequence similarity to             petroleum, natural gas, and diesel fuel, the presence of en-
alkB-containing bacteria) were most abundant in the ravine            vironmental alkanes also serves as an index of oil contami-
habitat. Empirical testing of litter layer samples using semi-        nation (Afzal et al., 2013). Although alkanes are very stable,
quantitative polymerase chain reaction for determining alkB           most can be degraded by several microorganisms. Alkane-
gene levels confirmed that the ravine habitat had higher alkB         degrading bacteria are commonly upregulated when the con-
gene levels than the windward and leeward habitats. Heat              centration of alkanes is increased; it has thus been suggested
map analysis revealed parallels in pattern color between the          that these bacteria be used as a biological indicator for oil
plant and microbial species compositions of the habitats, sug-        and gas prospecting (Rasheed et al., 2012; Xu et al., 2013).

Published by Copernicus Publications on behalf of the European Geosciences Union.
1816                                              T.-Y. Huang et al.: Litterfall altered alkane-degrading-bacteria structure

   Extensive knowledge on the degradation of n-alkane by          the alkane and soil type. Although knowledge of the regula-
microorganisms has been acquired in the past decades. The         tory mechanisms regarding environmental plant litter on soil
first step of enzymatic reaction is oxidization of n-alkane to    bacterial levels and of the dynamics of alkane-degrading bac-
the corresponding primary alcohol by alkane terminal hy-          teria in natural habitats has been beneficial and important in
droxylases. This step is crucial because activation of the        many aspects, studies on their dynamic changes are currently
alkane molecule requires an enzyme system that is not             lacking and should be conducted (Schulz et al., 2012).
widespread (Rojo, 2010). The products can be further oxi-            The Nanjenshan Reserve, a lowland subtropical rainfor-
dized into a corresponding aldehyde and fatty acid, which         est in southern Taiwan, consists of several dynamic forest
are digested by most microorganisms. Although fungi and           plots for which forest structure, vegetation pattern, climate,
yeasts can degrade alkanes, most research has focused on          and topography data have been collected at well-established
the role of bacteria in the degradation of alkanes (Rojo,         permanent study sites. Four dynamic forest plots and a tran-
2009, 2010; Singh et al., 2012). To date, alkane monooxy-         sect zone in the habitat have been documented since 1989
genase gene (alkB) hydroxylases are the most commonly             (Chen and Huang, 1986; Hsieh et al., 2000; Tsui et al.,
found alkane hydroxylases in both Gram-negative and Gram-         2004; Fan et al., 2005; Chao et al., 2007, 2008; Chao et
positive bacteria. More than 60 genera of aerobic bacteria        al., 2010). Among them, three plots captured our attention,
and 5 genera of anaerobic bacteria are known to degrade           namely plot I (120◦ 500 5100 E, 22◦ 040 5400 N), plot II (120◦ 500
n-alkanes (Nie et al., 2014). Although alkanes can be me-         3600 E, 22◦ 040 5200 N), and the Lanjenchi plot (120◦ 510 3800 E,
tabolized anaerobically, the growth of anaerobic alkane de-       22◦ 030 2300 N). A ravine habitat is located across plots I and
graders is significantly slower than that of aerobic ones, es-    II, whereas leeward and windward habitats are located on
pecially in the litter layer environment where the oxygen         plot III. Surveys conducted over the past decade have demon-
supply is adequate (Wentzel et al., 2007). The alkB-encoded       strated that the annual yield of litterfall in the ravine habi-
membrane-bound homologous protein is an inducible inte-           tat was higher than that in the windward and leeward habi-
gral membrane-bound alkane hydroxylase that plays a vi-           tats. Moreover, studies have shown that in the leeward habi-
tal role in aerobic alkane degradation (Beilen et al., 2003).     tat, plant height was higher and plant density was lower
Evidence has revealed that the number of alkB bacteria dy-        when compared with the windward habitat (8.41 ± 1.73 vs.
namically changes in response to a fluctuation in environ-        4.63 ± 0.88 m; 7505 vs. 20 065 trees ha−1 ). The plant height
mental alkanes. In soil or water environments, when polluted      and density in the ravine habitat were 9.45 ± 1.35 m and
with crude oil, the alkane-degrading bacteria were upregu-        4257 trees ha−1 (Chin, 2008). In addition, the litterfall plays
lated (Afzal et al., 2013). For example, a 10-fold increase in    an essential role in sustaining the microorganism food chain
the relative abundance of oil degraders in contaminated ver-      in the forest ecosystem. The litter-leaf, the main component
sus clean sand was estimated for a Gulf of Mexico beach           of litterfall, similarly provides the major source of plant-
(Kostka et al., 2011). In oil and gas reservoirs, it has been     derived alkanes. The significant effects of litterfall derived
shown that the abundance of alkB bacteria was substantially       alkanes on the bacterial alkane degradation potential have
higher in the surface soils with no significant detection of      also been observed (Giebler et al., 2013 and Schulz et al.,
soil alkane (Xu et al., 2013). The dynamic relationship be-       2012). As the litterfall in the habitats of the Nanjenshan Re-
tween alkane and alkB bacteria in soil from an agriculture        serve was different, investigation into the effects of litterfall
research farm and a laboratory maintained under controlled        on various habitats and microbial communities in these habi-
conditions has been previously studied. Giebler et al. (2013)     tats is possible.
reported that in a controlled environment, sizeable commu-           Environmental microbial communities are highly complex
nities of alkane-degrading bacteria, especially Proteobacteria    and diverse and difficult to culture under laboratory condi-
and Actinobacteria, were detected at the soil–litter interface    tions. Next-generation sequencing (NGS) is a powerful tool
when it was enriched with artificial alkane supplements. The      for high throughput sequencing technologies. With this re-
researchers demonstrated that many of the alkane-degrading        cent advent platform and computational methods, we can
bacteria were not detected before the alkanes were supple-        conduct genome studies of microbes in these habitats, which
mented, suggesting that some alkane degraders may have            have numerous variables such as annual litterfall productiv-
been present in very low copy numbers and below the lim-          ity and plant vegetation (Degnan and Ochman, 2012). We
its of detection. It is reported that the substrate was discov-   investigated the productivity of long-chain n-alkane in the
ered to modulate the biomass of microorganisms based on its       pristine natural habitats of the Nanjenshan Reserve and ex-
initial concentration (Schmidt, 1992). Thus, different alkane     plored their relationship with microbial communities, par-
yields of litterfall in various natural habitats may upregu-      ticularly emphasizing the correlation between n-alkane pro-
late the growth of various alkane degraders. The relation-        duction and bacteria containing the alkB gene. During the
ship between alkB bacteria abundance and alkane substrate is      present 1-year follow-up study, gas chromatography with a
more complicated in natural habitats. The dynamic changes         flame ionization detector (GC-FID) was used to determine
in alkB-degrading bacteria populations were demonstrated to       n-alkane (C14 –C35 ) concentrations. Bioinformatics analyses
be driven by numerous factors, such as the original source of     and community amplicon sequencing data mining were per-

Biogeosciences, 15, 1815–1826, 2018                                                    www.biogeosciences.net/15/1815/2018/
T.-Y. Huang et al.: Litterfall altered alkane-degrading-bacteria structure                                                        1817

formed to identify microbial communities and read numbers            ternal standard of squalene (Acros) was added to the concen-
of bacterial lineages that contained alkB genes in the three         trated 1 mL of hexane fraction prior to instrumental GC anal-
rainforest habitats. Semi-quantitative polymerase chain reac-        ysis. Quantification of the n-alkanes was performed using a
tion (PCR) was performed to test the results of the bioinfor-        PerkinElmer Clarus 500 gas chromatograph equipped with
matics analysis.                                                     an autosampler, PerkinElmer Elite-5 CB fused silica cap-
                                                                     illary column (30 m in length, 0.32 mm i.d., film thickness
2     Materials and methods                                          0.25 µm), and flame ionization detector (FID). The GC oven
                                                                     temperature was programmed to increase from 70 to 310 ◦ C
2.1    Sample description                                            at a rate of 4 ◦ C min−1 . The n-alkanes between C14 and C35
                                                                     were identified and quantified using external standards that
A map of the sampling sites is provided in Fig. S1 in the Sup-       contained known concentrations of all n-alkanes of interest
plement. Twenty-two custom-made aluminum stands with                 (Dr. Ehrenstorfer GmbH), 5-α-cholestane, and squalene.
frames (0.71 m × 0.71 m) covered by a nylon mesh (1 mm                   The n-alkane concentrations in 42 litter-leaf samples were
i.d.) were used to collect litterfall. Twelve stands were lo-        measured and then used to estimate the n-alkane concentra-
cated in the ravine habitat, whereas 10 stands were located          tion from the litter-leaf and to assess litter-leaf productiv-
in the Lanjenchi plot. Of those on the Lanjenchi plot, six           ity in the three habitats. The n-alkane concentration in the
stands were placed in the windward habitat and four in the           litter-leaf from each stand (Cstand , in µg g−1 ) was summed by
leeward habitat. The horizontal distance between stands was          weighting the concentration in one species in the litter-leaf
approximately 50 m. The number of stands in the three habi-          by that species’ proportion of the total litter-leaf collected in
tats of the Nanjenshan Reserve was mainly selected based on          the stand as in the following equation:
the stands available in this area. Each nylon mesh containing
                                                                                42
litterfall was collected and replaced monthly from early Oc-                    X  Wi
                                                                     Cstand =              · Ci ,                                   (1)
tober 2012 to late September 2013. After their collection, the                        Wt
                                                                                i=1
litterfall samples were sorted into litter-leaf, litter-branches,
litter-flowers, litter-fruits, and miscellaneous fractions. The      where Cstand is n-alkane concentration in the litter-leaf from
sorted samples were weighed after being oven-dried at 40 ◦ C         each stand (µg g−1 ), Wi is the dry weight of litter-leaf of each
for 14 days (Conklin-Brittain et al., 2006). The litter-leaves       species (g), Wt is the dry weight of total litter-leaf (g), and
were further separated into genus and species. Samples of            Ci is the n-alkane concentrations (µg g−1 ) of 42 litter-leaf
the litter layer and underlying soils from the three habitats        samples.
were collected in 2015 and 2016, respectively. The collected             Calculation of the litter-leaf n-alkane concentration in
samples, including litter-leaf, litter layer, and soils, were sub-   each habitat was then performed by averaging the n-alkane
jected to n-alkane analysis, and litter layer samples from each      litter-leaf concentrations in all the stands. The annual n-
habitat were further subjected to DNA extraction and conse-          alkane productivity in each stand was calculated by multiply-
quential assays.                                                     ing the n-alkane litter-leaf concentration in each stand by the
    The annual yield (litterfall or litter-leaf) in each stand was   annual yield of that stand. The n-alkane litter-leaf productiv-
used to calculate the productivity of each habitat. The an-          ities of the stands in a habitat were then averaged to estimate
nual litterfall and litter-leaf yields in each habitat were calcu-   the annual n-alkane productivity in the three habitats, which
lated by averaging the annual stand weights. Statistically sig-      was evaluated using Student’s t test.
nificant differences between habitats were evaluated through
Student’s t test using the t test calculator (SD format).            2.3   DNA extraction

2.2    Extraction of n-alkanes                                       For DNA extraction in the litter layer, several pieces of
                                                                     leaves from the litter layer were randomly selected, cut into
All samples from the litter-leaf (42 plant species) and lit-         2 mm × 2mm chips, and well blended. The DNA extraction
ter layer and all soils were dried and well homogenized.             procedure is described in detail in the user manual, Genomic
Approximately 0.5 g of sample powder was dissolved in                DNA from soil (Macherey-Nagel). Briefly, a bulk mixture
dichloromethane (250 mL) and Soxhlet extracted for 16 h.             (approximately 0.1–0.2 g) was transferred to a tube contain-
A surrogate standard of 5-α-cholestane (Sigma) was added             ing ceramic beads. Lysis buffer (SL1, 700 µL) and enhancer
to each sample before extraction. The extracts were concen-          SX (150 µL) were added to each sample and vortexed for
trated into 5–10 mL volumes using a rotary evaporator with           5 min at room temperature. Precipitate contaminants were re-
a water bath and further concentrated to reduce the volume           moved through centrifugation for 2 min at 11 000 g. DNA su-
to approximately 1 mL, after which they were fractionated            pernatant was transferred to a new tube, 150 µL of SL3 was
using silica gel chromatography (Silica gel 60, 3 %). The            added, and the mixture was vortexed for 5 s before precip-
n-alkane fraction was eluted with 4 mL of hexane and re-             itation by centrifugation for 1 min at 11 000 g. The super-
duced to a 1 mL volume under a stream of nitrogen. An in-            natant inhibitors were removed using an inhibitor removal

www.biogeosciences.net/15/1815/2018/                                                                Biogeosciences, 15, 1815–1826, 2018
1818 T.-Y. Huang et al.: Litterfall altered alkane-degrading-bacteria structure
column. The column that bound the DNA was washed four erence library at a 97 % sequence identity level was per-
times and dried before DNA elution. DNA elution was per- formed to create OTU tables, which contained the number of
formed by centrifugation for 30 s at 11 000 g after incubation DNA sequence reads of each OTU. A 16S UTAX reference
with Buffer SE (50 µL). A final DNA extraction (approxi- database was employed as a BLAST (Basic Local Alignment
mately 30–100 ng µL−1 in 100 µL of Tris buffer) was eluted. Search Tool) library. Finally, these data were combined to de-
termine the relative abundances and subsequent visual pat-
2.4 Sequencing using an Illumina MiSeq platform terns of a heat map. Principal coordinate analysis (PCoA)
was used to identify the relative distance between OTUs. To
The genomic DNA (12.5 ng) obtained from each habitat plot PCoA figures, the calc_distmx command together with a
was used in amplicon PCR experiments, which were per- phylip_lower_triangular parameter was used to calculate the
formed in triplicate. We performed PCR amplification of distance of the OTUs. The axes file contained plotting coor-
16S rRNA gene sequences at the V3–V4 regions using dinates and was derived from mothur using the PCoA com-
Illumina’s MiSeq system to create paired-end sequencing mand. The PCoA figures were plotted using the R program.
data. The experimental protocol was modified from the Il-
lumina manual. The target sequence was amplified using 2.6 Proportion of alkB-gene-containing bacteria in the
PCR with mixed forward and reverse primers. The se- habitats estimated using the NCBI database
quences of forward primers included an adapter overhang
nucleotide sequence and V3–V4 primer pairs, which were Data mining for community amplicon sequencing was per-
5’-TCGTC GGCAG CGTCA GATGT GTATA AGAGA formed to search for microbial communities that may have
CAGCC TACGG GNGGC WGCAG, 5’-TCGTC GGCAG had alkB genes. Because bacteria in the same genus may
CGTCA GATGT GTATA AGAGA CAGAC CTACG have similar gene sequences and functions, nucleotide blast-
GGNGG CWGCA G, 5’-TCGTC GGCAG CGTCA GATGT ing was performed to search for homogeneous sequences
GTATA AGAGA CAGTD CCTAC GGGNG GCWGC AG, in the OTUs. Bacteria with DNA sequences 95 % or more
and 5’-TCGTC GGCAG CGTCA GATGT GTATA AGAGA similar to a known gene were defined as lineage-like bacte-
CAGGD RCCTA CGGGN GGCWG CAG. The sequences ria. The NCBI database was used to construct an alkB gene
of the reverse primers were 5’-GTCTC GTGGG CTCGG reference library. We collected representative 16s gene se-
AGATG TGTAT AAGAG ACAGG ACTAC HVGGG quences of all known alkB-gene-containing bacteria in the
TATCT AATCC, 5’-GTCTC GTGGG CTCGG AGATG TG- phyla Actinobacteria and Proteobacteria from the current
TAT AAGAG ACAGT GACTA CHVGG GTATC TAATC NCBI database to investigate the alkB gene family popula-
C, 5’-GTCTC GTGGG CTCGG AGATG TGTAT AA- tions in different habitats. The alkB gene sequences in bac-
GAG ACAGA CGACT ACHVG GGTAT CTAAT CC, and terial 16s rRNA were downloaded to a reference nucleotide
5’-GTCTC GTGGG CTCGG AGATG TGTAT AAGAG file and combined with the OTU libraries of Actinobacteria
ACAGG TTGAC TACHV GGGTA TCTAA TCC. After sep- and Proteobacteria.
aration using agarose gel electrophoresis, PCR products with To search the alkB family gene-like lineage in the current
expected sizes were purified from the matrix. The Illumina OTU database, sequence alignment and phylogenetic analy-
Nextera XT index kit was used in second-stage PCR for the sis of the alkB nucleotide sequences were conducted using
addition of the index. Capillary electrophoresis followed by the Molecular Evolutionary Genetics Analysis 7 (MEGA 7)
a fluorescence-based method was employed to qualify and program. MEGA 7 used parsimony, neighbor-joining, and
quantify libraries, respectively. Nucleotides were sequenced maximum likelihood analyses to create a 16S rRNA phy-
using the MiSeq sequencer for 18 dark cycles and 350 read logenetic gene tree. The NCBI nucleotide BLAST program
cycles in the forward read, and 18 dark cycles and 250 read was employed to test the similarity of DNA sequences be-
cycles in the reverse read. The data of forward and reverse tween OTUs and adjacent references. DNA sequences with
reads were aligned using the analysis platform from (Ge- a similarity of more than 95 % were manually selected to
nomic Workbench v.8.5) CLC bio with Q20 as a threshold determine the alkB-lineage OTU DNA sequence numbers
to generate output FASTA files. read in the library. The Shannon–Wiener diversity index was
used to calculate the plant diversity, overall bacteria commu-
2.5 The construction and analysis of community nities, and alkB-lineage bacteria and was determined using
amplicon sequencing library the PRIMER-5 software (Plymouth Routines in Multivariate
Ecological Research).
FASTA files were further processed using the sequence anal-
ysis tool, USEARCH. We merged all sequence files, removed
duplicates, and clustered the sequences into operational tax-
onomic units (OTUs) at 97 % pairwise identity with a min-
imum cluster size of two to construct an OTU reference
library. Then, a comparison between samples and the ref-
Biogeosciences, 15, 1815–1826, 2018 www.biogeosciences.net/15/1815/2018/T.-Y. Huang et al.: Litterfall altered alkane-degrading-bacteria structure 1819
2.7 Semi-quantitative PCR for determining alkB gene 12
levels in litter layer samples
10
Because alkB genes are highly abundant and diverse, a stan-
Average litter fall (t ha-1 yr-1)
dard method for alkB gene quantification was not available.
We employed semi-quantitative PCR for measuring environ- 8 * *
mental alkB in a method that was modified from previous
studies because the alkB-targeting primer covers Proteobac-
6
teria and Actinobacteria (Kloos et al., 2006; Jurelevicius et
al., 2013). Litter layer samples from three habitats in Nan-
jenshan were subjected to semi-quantitative PCR to quantify 4
the DNA levels of alkB genes in the natural habitats. Litter
layer samples from different stands in each habitat were ran-
2
domly selected for sample collection at three time points. Af-
ter collection, litter layer samples were sent immediately to
the laboratory at room temperature. Litter layer patches were 0
randomly selected and cut into approximately 2 mm × 2 mm Ravine Windward Leeward
chips. Samples (250 mg) were taken for DNA extraction.
Figure 1. Annual litterfall in three habitats of Nanjenshan Reserve.
Following DNA elution, 100 µL of buffer solution and 2 µL
Annual productivity of litterfall in ravine habitat was higher than
of eluted DNA were taken for semi-quantitative PCR. The windward and leeward habitats (* p < 0.05).
DNA was mixed with an alkB gene primer set (forward
primer: 5’- AAY ACN GCN CAY GAR CTN GGN CAY
AA -3’; reverse primer: 5’- GCR TGR TGR TCN GAR TGN ered to be approximately 7–10 t ha−1 , which is considered
CGY TG -3’, 1 µL, 0.4 µM), 5 µL Fast-Run Taq Master Mix to be a high volume when compared with the records. The
with Dye, and 16 µL ddH2 O with the final reaction volume primary reason for the large amount of litterfall during this
of 25 µL. Thermal cycling conditions for PCR were an ini- study was the occurrence of typhoons. Because typhoons in-
tial temperature of 95 ◦ C for 5 min, followed by 30, 27, or 24 crease litterfall in the three habitats equally, the ranking in
cycles of 95 ◦ C for 30 s, 55 ◦ C for 30 s, 72 ◦ C for 1 min, and annual litterfall volume was not altered by the advent of ty-
finally 72 ◦ C for 5 min. The expected amplicons of the PCR phoons. One of the reasons that the ravine habitat had more
were 548 bps. Following PCR, aliquots (5 µL) of each ampli- annual litterfall may be the topography of the ravine habitat,
con were confirmed using electrophoresis on 1.5 % agarose which is more suitable for plant growth than that of the other
gel followed by 0.5 µg mL−1 SYBR Safe DNA staining and habitats. The average height and diameter of cross sections
imaging using an ultraviolet transillumination system. The of plants in the ravine habitat were the largest of those in all
average band density levels were compared with a windward the habitats. Because litter-leaf was the major part of litter-
habitat density setting of 100 %. Statistically significant dif- fall and average n-alkane resources, we focused on n-alkane
ferences were evaluated using Student’s t test. levels in the litter-leaf in these habitats.
3 Results and discussion 3.2 Example of n-alkane measurements in the
Nanjenshan Reserve
3.1 Quantitative estimates of annual litterfall in the
Nanjenshan Reserve The n-alkane concentrations in litter-leaf from 42 plants were
measured using GC-FID. Figure S2 presents representative
The annual average litterfall was estimated from the litter- GC chromatograms of the Ilex rotunda leaves in each habi-
fall at the sampling sites. The annual yields of litterfall in tat. The recovery rates from the surrogate of 5-α-cholestane
the three habitats in Nanjenshan are illustrated in Fig. 1. As ranged from 70 to 108 % and averaged at 99 ± 7 %, suggest-
shown in the records from the past decade, the litterfall was ing satisfactory extraction efficiency. The n-alkane concen-
higher in the ravine habitat than in the other habitats. Our trations (ranging from 123 to 2694 µg g−1 ) calculated in this
results on the litterfall of Nanjenshan indicated that the an- study were not corrected by the recovery rate. All samples
nual weight productivity in the ravine habitat was approxi- exhibited an odd/even carbon number predominance, with
mately 30 % higher than in the leeward or windward habi- maximums at C31 , C29, , and C33 . n-Alkanes of C14 to C26
tats, which is consistent with previous studies. According to were present in only relatively low amounts. Further distri-
records from 1999 to 2007, seasonal litterfall in Nanjenshan bution analyses of the n-alkane litter-leaf components, such
ranged from 2 to 7 t ha−1 ; the increases in litterfall were con- as the carbon preference index (CPI) and C29 / C33 ratio, for
tributed by typhoons, precipitation, and the effects of mon- each species, were needed to further identify the relation-
soon seasons. In this study, the annual litterfall was discov- ships between plant species and n-alkane distribution pat-
www.biogeosciences.net/15/1815/2018/ Biogeosciences, 15, 1815–1826, 20181820 T.-Y. Huang et al.: Litterfall altered alkane-degrading-bacteria structure
terns. This paper is the first to reveal the n-alkane levels of carbon in the litter layer and bulk soil in the ravine habitat
plant vegetation in Nanjenshan. was equal to or less than that in the windward and leeward
habitats (Guo, 2010). Therefore, decomposition effects may
3.3 Annual litter-leaf productivity and n-alkane be stronger in ravine habitats. Figure 2a reveals that the n-
productivity rankings alkane concentration decreased significantly from litter-leaf
to surface soil, which could be due to the effects of bacteria.
A total of 42 plant species were identified in this study. Data It is plausible that other organic compounds were degraded
from the plant species revealed the total amount of leaves in addition to the n-alkanes. Several effects such as leaching,
in the annual litterfall, and the resultant ranking of leaf n- erosion, and sediment transportation could play roles in gov-
alkane concentrations in these plants is presented in Table 1. erning organic compound accumulation; therefore, we can-
The leaf n-alkane concentration and dry weight data were not rule out the diffusion effects of other physical factors
employed to make a gross estimate of the n-alkane produc- (Quinton et al., 2006; Kirkels et al., 2014). We performed
tivity of the litter-leaf in the Nanjenshan Reserve. The n- NGS-based analysis and bioinformatics studies to discover
alkane concentration was discovered to change during leaf the roles of microbial communities in n-alkane degradation.
development and was affected by environmental parameters
(Jetter and Schäffer, 2001; Kahmen et al., 2011; Hoffmann 3.5 Bacterial community composition in the
et al., 2013). For example, temperature and relative humid- Nanjenshan Reserve
ity affected the composition of n-alkanes in both Acacia and
Eucalyptus in Australia (Hoffmann et al., 2013). In our pi- NGS-based study was performed to reveal the microbial
lot study, the n-alkane concentration variation among plant communities in the litter layer from the three habitats. Fig-
species was less than 15 % of the standard error, as deter- ure 3 shows the relative abundance in community ampli-
mined through comparison of several samples from differ- con sequencing data of OTUs that were grouped by phylum.
ent stands and habitats for the same species. The ranges More detailed information about the relative abundance in
of leaf n-alkane concentrations between species were from class, order, and family levels is presented in Fig. S5. Inter-
2694 (µg g−1 ) in Ilex rotunda to 123 (µg g−1 ) in Alniphyllum estingly, a similarity was identified in microbial community
pterospermum. These data demonstrated that intraspecies structure between the windward and leeward habitats. Be-
variation in n−alkane concentration could be ignored com- cause the windward and leeward habitats are located on the
pared with the interspecies variation. Therefore, using a rep- same plot of a different orography, several parameters such
resentative plant n-alkane concentration was reasonable for as plant vegetation and soil properties were similar between
estimating the overall litter-leaf n-alkane production in a the habitats. As mentioned previously, the most considerable
habitat. When comparing the plant vegetation and leaf n- differences between the windward and leeward habitats were
alkane concentration, the plants with leaves that had a high the average height of plants and average number of trees per
n-alkane concentration tended to grow in the ravine habitat; hectare. The physical parameters that affect plant growth in
Ilex rotunda and Celastrus kusanoi, for example. mountainous areas did not appear to affect the relative abun-
dance of microbial communities. Conversely, the relative
3.4 Estimates of annual n-alkane productivity in the abundance of microbial communities in the ravine habitat
three habitats was different from that in the windward and leeward habitats,
with more members of the Actinobacteria phyla and fewer
Figure 2 presents the n-alkane concentrations from the litter- members of the Proteobacteria and Acidobacteria phyla. The
leaf to the bulk soil and the average litter-leaf n-alkane more abundant microbial communities of the Actinobacteria
productivity in the three habitats. The average litter-leaf n- phyla may have been because of higher n-alkane productivity
alkane concentration was highest in the ravine habitat. More- in the ravine habitat. Although many phyla have been identi-
over, the n-alkane concentration in different layers formed a fied as carrying the alkB gene, our data revealed that the only
steep gradient from the litterfall to the bulk soil. The n-alkane microbial communities carrying the alkB gene in our study
flux in the litterfall in the ravine habitat was approximately were Proteobacteria and Actinobacteria.
twice that in the other habitats. We concluded that the ravine
habitat had higher n-alkane input than the other habitats. This 3.6 Prediction of bacteria carrying alkB genes in
characteristic offers us an example of higher n-alkane input Nanjenshan Reserve
in the natural habitat to investigate the consequence of mi-
crobial community. The relative abundance of bacteria containing the alkB gene
The balance between litterfall yield and decomposition af- in the Actinobacteria and Proteobacteria phyla from differ-
fects the development of organic carbon in soil layers. This ent habitats is illustrated in Fig. 4. The phylogenetic trees of
study and previous reports have indicated that the litterfall in OTUs in the Proteobacteria and Actinobacteria phyla with
ravine habitats is higher than that in other habitats. However, alkB reference strains are shown in Figs. S3 and S4. The nu-
a study of these habitats demonstrated that the total organic cleotide sequence similarities of OTUs and the adjacent alkB
Biogeosciences, 15, 1815–1826, 2018 www.biogeosciences.net/15/1815/2018/T.-Y. Huang et al.: Litterfall altered alkane-degrading-bacteria structure 1821
Table 1. The resultant ranking of n-alkane concentration of 42 litter-leaf samples with the nomenclature and the semi-quantitative results of
annual litter-leaf productivity in three habitats. The plus sign (+) was used to denote the annual productivity rankings of litter-leaf in each
habitat. Five plus signs (+++++) denote the litter-leaf productivity rankings from 1 to 5; four plus signs (++++) denote the productivity
rankings from 6 to 10; three plus signs (+ + +) denote the rankings from 11 to 15; two plus signs (++) denote the rankings from 16 to 20;
one plus sign (+) denotes the rankings after 21. A blank space denotes no litter-leaf yield for the entire year in the habitat.
Relative annual litter-leaf production
Ranking of leaf (by dry weight)
n-alkane concentration Plant species Ravine Windward Leeward
1 Ilex rotunda + + ++ ++ +
2 Ficus benjamina L. +++++
3 Ficus microcarpa L. f. +++++ +
4 Diospyros eriantha ++ ++
5 Reevesia formosana +++
6 Celastrus kusanoi +++++ +
7 Erycibe henryi +++ +
8 Cyclobalanopsis longinux + + +++++
9 Archidendron lucidum +++++ +++++
10 Celtis sinensis Pers. +++
11 Vitis kelungensis Moriyama + + + ++ ++
12 Ilex cochinchinensis +++ +++
13 Rhaphiolepis indica +++++ +
14 Castanopsis fabri Hance + +++++
15 Symplocos caudata Wall. + + ++ +
16 Cryptocarya hainanensis + + ++ + +
17 Podocarpus macrophyllus +++++ +++
18 Sapium discolor ++ + + + ++
19 Illicium arborescens + +++ +
20 Syzygium formosanum +++++
21 Syzygium kusususense + +++ +
22 Machilus thunbergii +++++
23 Cyclobalanopsis pachyloma + +++ +
24 Lithocarpus formosanus +++++ + +
25 Bischofia javanica + + ++ + +
26 Machilus zuihoensis ++ +++++
27 Ficus aurantiaca + + ++ +
28 Helicia formosana +++ + + ++ + + ++
29 Cyclobalanopsis championii +++++ ++
30 Aglaia formosana +++ +++++
31 Turpinia ternata + + + ++ + + ++
32 Aglaia elliptifolia ++ ++ +
33 Castanopsis indica +++ + +++
34 Psychotria rubra + + ++ + + ++ +++
35 Castanopsis carlesii +++
36 Schima superba + + ++
37 Antidesma hiiranense + ++ +
38 Lithocarpus amygdalifolius + ++ +
39 Schizostachyum diffusum + + + + ++
40 Beilschmiedia fordii + + + + ++
41 Beilschmiedia erythrophloia + + ++
42 Alniphyllum pterospermum ++ ++ +
reference strains were manually blasted. Table S1 in the Sup- reference strains. Figure 4 illustrates that a significant num-
plement reveals the nomenclature of OTUs in Proteobacteria ber of reads in the OTUs whose sequences were similar to
and Actinobacteria with nucleotide sequences that had simi- those of alkB-gene-containing bacteria was identified for the
larity of higher than 95 % when compared with adjacent alkB ravine habitat. Although the relative abundance of Proteobac-
www.biogeosciences.net/15/1815/2018/ Biogeosciences, 15, 1815–1826, 20181822 T.-Y. Huang et al.: Litterfall altered alkane-degrading-bacteria structure
(a) Litter-leaf (b)
1200 Litter layer 7000
Annual n-alkane productivity (g ha- 1 yr- 1)
Surface soil
6000
1000
n-Alkane concentration (µg g - 1)
5000
800
* 4000
600
* 3000
* *
400
2000
200
1000
0 0
Ravine Windward Leeward Ravine Windward Leeward
Figure 2. (a) n-Alkane concentration in litter-leaf, litter layer, and surface soil. n-Alkane concentration in litter-leaf was higher in the ravine
habitat than in the other two habitats (* p < 0.05). (b) Estimated annual n-alkane productivity generated by litter-leaf of litterfall in three
habitats (* p < 0.05).
100 % 25
Firmicutes Actinobacteria
90 % Chloroflexi
Relative abundance (%)
80 % Cyanobacteria/Chloroplast
20
Proteobacteria
70 % Verrucomicrobia 15
Relative abundance (%)
Armatimonadetes
60 %
10
Planctomycetes
50 %
Candidate division WPS-1
5
40 % Candidatus Saccharibacteria
30 % Acidobacteria 0
Novel Ravine Windward Leeward
20 %
Bacteroidetes
10 %
Figure 4. The relative abundance in microbial community of alkB
Actinobacteria gene lineages. White block indicated the relative abundance of alkB
0% Proteobacteria gene in phylum Actinobacteria while the striped block was in Pro-
Ravine Windward Leeward
teobacteria.
Figure 3. Microbial community structure in the three habitats of
Nanjenshan Reserve. Bacterial lineages were indicated by phylum.
Our data provide evidence that there is a universal presence
of alkane degraders in natural habitats.
teria in the ravine habitat was 20 % less than that in the other
habitats (Fig. 3), the number of DNA sequence reads of alkB- 3.7 PCoA of bacteria carrying alkB genes
lineage-like bacteria in the ravine habitat was greater than 1.5
times those in the windward and leeward areas (Fig. 4). To PCoA was used to visualize the similarities of DNA se-
summarize, there were twice as many DNA sequence reads quences in Proteobacteria and Actinobacteria from the three
of alkB-lineage-like bacteria in the ravine habitat than in the habitats. The biodiversity index in OTUs of alkB-lineage-
other habitats. Despite the relative abundance of DNA se- like bacteria and other sample types is shown in Table S2.
quence reads in many OTUs of the alkB-lineage-like bacte- Figure 5 displays the distribution of 240 OTUs in the Pro-
ria, Proteobacteria, and Actinobacteria phyla were limited in teobacteria and Actinobacteria phyla. The majority of OTUs
the leeward and windward habitats (Fig. 4); these two habi- (> 90 %) are present in two or three habitats. An initial cap-
tats had small amounts of alkB-lineage-like bacteria (approx- ital letter in Fig. 5 was used to denote the OTUs with the
imately 0.1 % relative abundance) in most OTUs (Table S1). most read numbers for the habitats. The nomenclature of the
Biogeosciences, 15, 1815–1826, 2018 www.biogeosciences.net/15/1815/2018/T.-Y. Huang et al.: Litterfall altered alkane-degrading-bacteria structure 1823
0.6 gene concentrations. Figure 6a shows a triplicate study of
DNA staining of amplicons from the three habitats after var-
0.4 ious semi-quantitative PCR cycles. No bands were detected if
C A
D fewer than 24 amplification cycles were performed. Marginal
PCR products could be detected by increasing the cycle num-
0.2
ber to 27. Figure 6b shows the statistical results regarding
alkB gene levels in the three Nanjenshan habitats and con-
0.0 firms that bacterial alkB numbers were higher in the ravine
PC2
habitat than in the other two habitats. We have thus provided
-0.2 evidence that litterfall and plant vegetation increase the abun-
B dance of alkane-degrading bacteria communities in natural
-0.4 habitats.
Ravine
-0.6 Windward
3.9 Exploring the relationship between plant
vegetation and microbial communities using heat
Leeward
-0.8 map analysis
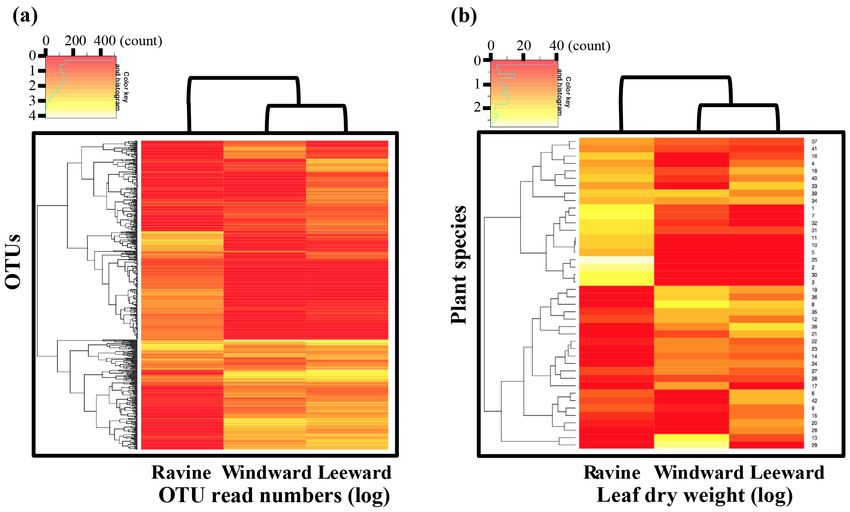
-0.6 -0.4 -0.2 0.0 0.2 0.4 Heat map analysis of plant species and read number of OTU
PC1 versus habitat were performed to investigate the relationship
Figure 5. The PCoA plot of OTUs data in phylum Actinobac- between plant vegetation patterns and microbial communi-
teria and Proteobacteria in three habitats. The circle areas in A, ties in different habitats. The heat map presented in Fig. 7
B, C, and D are classes of α-Proteobacteria, β-Proteobacteria, γ - was based on the microbial community abundance and plant
Proteobacteria, and Actinobacteria, respectively. productivity of litter-leaf from different habitats, with the
color intensity indicating the number of reads or weight of
litter-leaf (in logarithmic form). In Figure 7b, the color pat-
alkB-lineage-like bacteria OTUs and relative locations are terns of litter-leaf yields show that microbial abundance was
presented in the figure. Thirty-three OTUs contained alkB- similar in the windward and leeward habitats, demonstrat-
lineage-like bacteria in this study. The numbers of OTUs ing the similarity between the microbial community compo-
that contained alkB-lineage-like bacteria in the ravine, wind- sitions in these two habitats. Furthermore, the litterfall data
ward, and leeward habitats were 30, 30, and 25, respectively. were also similar between the two habitats, which suggests
The Shannon–Wiener index of OTUs that contained alkB- a connection between plant vegetation species and microbial
lineage-like bacteria in the ravine, windward, and leeward composition. The pattern similarities in the plant and bac-
habitats was 2.51, 2.39, and 2.46, respectively. Although the terial species can be easily explained by substrate-specific-
relative abundance of OTUs that contained alkB-lineage-like induced growth responses in the natural habitats. The data
bacteria in the ravine habitat was more than twice that in provided supporting evidence that diversity of bacteria in all
the windward and leeward habitats (Fig. 4), the Shannon– OTUs was affected by plant vegetation, not only in quantity
Wiener indices of the three habitats were similar, suggest- but also in species. In Figs. 2, 4, and 6, an increase in n-
ing that the effective species numbers of alkB-lineage-like alkane productivity is demonstrated to increase the number
bacteria were almost identical. The results indicate the pre- of alkB-gene-containing bacteria. In Fig. 7, we showed that
existence of diverse alkB-gene-containing bacteria in natu- a substrate-specific relationship may exist between plant veg-
ral habitats, with some bacteria so small in number that they etation and microbial communities. Thus, a leaf in a natural
are undetectable using normal PCR. They could, however, habitat may upregulate some alkB-gene-containing bacteria
proliferate in the habitats with the appropriate substrate sup- while downregulating other types of alkB-gene-containing
plements. This finding is consistent with the results from a bacteria. A future study could include a litter bag study that
previous study using a laboratory-controlled system and an would enable better understanding of the relationship be-
agricultural research farm (Schulz et al., 2012; Giebler et al., tween individual factors within plant and bacterial species;
2013). for instance, one could study the interaction of a specific leaf
species with a particular genus of n-alkane-degrading bacte-
3.8 Empirical testing of bacteria carrying alkB gene ria or microbial community in different habitats.
In the bacterial community amplicon sequencing study, equal
amounts of DNA were amplified to estimate the bacterial
communities in each habitat. To compare the productivity
of the alkB-gene-containing bacteria in different habitats, we
conducted semi-quantitative PCR to determine relative alkB
www.biogeosciences.net/15/1815/2018/ Biogeosciences, 15, 1815–1826, 20181824 T.-Y. Huang et al.: Litterfall altered alkane-degrading-bacteria structure
(a) (b)
300
Relative quantification of AlkB gene amplicon (%)
250
30 cycles
200
*
27 cycles 150
*
100
24 cycles
50
PCR cycles Ravine Windward Leeward
0
Ravine Windward Leeward
Figure 6. Semi-quantitative PCR of alkB gene results from samples of three habitats in Nanjenshan Reserve. (a) Agarose electrophoresis of
alkB genes in different amplified cycles. Standard markers were loaded at both sides of samples. The samples from different habitats were
separated by dash line. (b) The statistic results of semi-quantitative PCR after amplifying 30 cycles. The read numbers of alkB gene were
significantly higher in the ravine habitat than in the other two habitats (* p < 0.05).
Figure 7. Heat map analysis of read number of OTUs and annual litterfall productions of each plant species in three habitats. (a) Heat map
of read number of OTUs in three habitats. (b) Heat map of litterfall productions of plants in three habitats.
4 Conclusions Taiwan. Plant vegetation not only affects n-alkane produc-
tivity; it also changes litter layer microbial communities. In
We confirmed that the annual litterfall productivity of the the ravine habitat, high litter-leaf n-alkane productivity re-
ravine habitat was approximately 30 % higher than that of sulted in an increase in the n-alkane-degrading bacteria in
the windward and leeward habitats, whereas the long-chain the litterfall. Increases in alkB-gene-containing bacteria were
n-alkane productivity in the ravine habitat was twice that identified primarily in the Proteobacteria and Actinobacte-
in the other habitats in a lowland subtropical rainforest of ria phyla, with NGS-based analysis and semi-quantitative
Biogeosciences, 15, 1815–1826, 2018 www.biogeosciences.net/15/1815/2018/T.-Y. Huang et al.: Litterfall altered alkane-degrading-bacteria structure 1825
PCR employed for determining alkB gene concentrations. References
Biodiversity analyses showed that the diversity of bacteria
containing the alkB gene was similar among the different Afzal, M., Yousaf, S., Reichenauer, T. G., and Sessitsch, A.: Ecol-
habitats, suggesting that natural habitats harbor diverse alkB- ogy of Alkane-Degrading Bacteria and Their Interaction with
the Plant, Molecular Microbial Ecology of the Rhizosphere, 92,
lineage-like bacteria with some species existing in very low
975–989, https://doi.org/10.1002/9781118297674.ch92, 2013.
copy numbers. Practical testing of alkB gene concentration Beilen, J. B. V., Li, Z., Duetz, W. A., Smits, T. H. M., and With-
by semi-quantitative PCR with primer coverage over Pro- olt, B.: Diversity of Alkane Hydroxylase Systems in the Envi-
teobacteria and Actinobacteria shows results consistent with ronment, Oil Gas Sci. Technol., 58 427–440, 2003.
the bioinformatics data, suggesting this method is helpful for Chao, K.-J., Chao, W.-C., Chen, K.-M., and Hsieh, C.-F.: Vegetation
future study on alkane bacteria activity assays from the en- Dynamics of a Lowland Rainforest at the Northern Border of the
vironmental samples. Cross analyses regarding the quantity Paleotropics at Nanjenshan, Southern Taiwan, Taiwan Journal of
and quality of plant vegetation and structures of the micro- Forest Science, 25, 29–40, 2010.
bial communities revealed that n-alkane-induced increases Chao, W.-C., Chao, K.-J., Song, G.-Z. M., and Hsieh, C.-F.: Species
in alkB-gene-containing bacteria might have been substrate Composition and Structure of the Lowland Subtropical Rainfor-
specific. To our knowledge, this is the first report on the reg- est at Lanjenchi, Southern Taiwan, Taiwania, 52, 253–269, 2007.
Chao, W.-C., Wu, S.-H., Fan, S.-W., Lin, H.-Y., Hsieh, C.-F., and
ulation of n-alkane-degrading bacteria in litterfall in natural
Chao, K.-J.: Distribution Patterns of Tree Species in a Lowland
habitats. Rainforest at Nanjen Lake, Southern Taiwan, Taiwania, 53, 124–
133, 2008.
Chen, Y.-F. and Huang, T.-C.: Vegetation analysis in Nanjenshan
Data availability. Data presented in this study are available area, Ann. Taiwan Mus., 29, 189–258, 1986.
at https://doi.org/10.6084/m9.figshare.6026462 (Fan, 2018) and Chin, C.-C.: Study on the Spatial and Temporal Change of Litter-
https://doi.org/10.6084/m9.figshare.6026159 (Huang, 2018). fall in Nanjenshan Lowland Rain Forest, master thesis, National
Pingtung University of Science and Technology, Taiwan, 2008.
Conklin-Brittain, N. L., Knott, C. D., and Wrangham, R. W.: Feed-
ing Ecology in Apes and Other Primates, Ecological, Physical
The Supplement related to this article is available online
and Behavioral Aspects, Energy intake by wild chimpanzees
at https://doi.org/10.5194/bg-15-1815-2018-supplement.
and orangutans: methodological considerations and a prelimi-
nary companson, 17, edited by: Hohmann, G., Robbins, M. M.,
and Boesch, C., Cambridge University Press, Cambridge, UK,
445–465, 2006.
Competing interests. The authors declare that they have no conflict Degnan, P. H. and Ochman, H.: Illumina-based analysis
of interest. of microbial community diversity, ISME J., 6, 183–194,
https://doi.org/10.1038/ismej.2011.74, 2012.
Fan, C.-W.: Litterfall and n-alkane, available at:
Acknowledgements. The authors would like to express their https://doi.org/10.6084/m9.figshare.6026462, last access:
gratitude to the anonymous reviewers for their kind and useful 27 March 2018.
criticism of the manuscript. The authors are grateful to Chin Li, Fan, S.-W., Chao, W.-C., and Hsieh, C.-F.: Woody Floris-
Cheng-Yu Wu, and Chun-Ping Huang for their technical support. tic Composition, Size Class Distribution and Spatial
This work is sponsored by the Ministry of Science and Technology Pattern of a Subtropical Lowland Rainforest at Nan-
of Taiwan (MOST 105-2116-M-194-013 and MOST 105-2116- jen Lake, Southernmost Taiwan, Taiwania, 50, 307–326,
M-194-014). We would like to thank National Core Facility for https://doi.org/10.6165/tai.2005.50(4).307, 2005.
Biopharmaceuticals (NCFB, MOST 106-2319-B-492-002) and Feakins, S. J., Peters, T., Wu, M. S., Shenkin, A., Sali-
National Center for High-performance Computing (NCHC) of nas, N., Girardin, C. A. J., Bentley, L. P., Blonder, B.,
National Applied Research Laboratories (NARLabs) of Taiwan Enquist, B. J., Martin, R. E., Asner, G. P., and Malhi,
for providing computational resources and storage resources. We Y.: Production of leaf wax n-alkanes across a tropical
also acknowledge the technical services (support) provided by forest elevation transect, Org. Geochem., 100, 89–100,
High-throughput Genome and Big Data Analysis Core Facility of https://doi.org/10.1016/j.orggeochem.2016.07.004, 2016.
the National Yang-Ming University VGH Genome Research Cen- Giebler, J., Wick, L. Y., Chatzinotas, A., and Harms, H.: Alkane-
ter (VYMGC). High-throughput Genome and Big Data Analysis degrading bacteria at the soil-litter interface: comparing iso-
Core Facility is supported by National Core Facility Program for lates with T-RFLP-based community profiles, FEMS Micro-
Biotechnology (NCFPB), Ministry of Science and Technology. biol. Ecol., 86, 45–58, https://doi.org/10.1111/1574-6941.12097,
2013.
Edited by: Denise Akob Gomez-Coca, R. B., Perez-Camino Mdel, C., and Moreda,
Reviewed by: Boris Jansen and two anonymous referees W.: Saturated hydrocarbon content in olive fruits and crude
olive pomace oils, Food Addit. Contam. A, 33, 391–402,
https://doi.org/10.1080/19440049.2015.1133934, 2016.
Guo, J. H.: The Estimation of Total Soil Organic Carbon Storage
under three Habitat Types in Nanjenshan Lowland Rain Forest,
www.biogeosciences.net/15/1815/2018/ Biogeosciences, 15, 1815–1826, 20181826 T.-Y. Huang et al.: Litterfall altered alkane-degrading-bacteria structure master thesis, National Pingtung University of Science and Tech- Quinton, J. N., Catt, J. A., Wood, G. A., and Steer, J.: Soil carbon nology, Taiwan, available at: http://hdl.handle.net/11296/279pcy, losses by water erosion: Experimentation and modeling at field 2010. and national scales in the UK, Agriculture, Ecosyst. Environ., Hoffmann, B., Kahmen, A., Cernusak, L. A., Arndt, S. K., and 112, 87–102, https://doi.org/10.1016/j.agee.2005.07.005, 2006. Sachse, D.: Abundance and distribution of leaf wax n-alkanes Rasheed, M. A., Kalpana, M. S., Veena Prasanna, M., Lak- in leaves of Acacia and Eucalyptus trees along a strong humid- shmi, M., Madhavi, T., Devleena Mani, T., Patil, D. J., ity gradient in northern Australia, Org. Geochem., 62, 62–67, Dayal, A. M., and Raju, S. V.: Geo-microbial and light https://doi.org/10.1016/j.orggeochem.2013.07.003, 2013. gaseous hydrocarbon anomalies in the near surface soils Hsieh, C.-F. Sun, I.-F., and Yang, C.-C.: Species Composition and of Deccan Syneclise Basin, India: Implications to hydrocar- Vegetation Pattern of a Lowland Rain Forest at the Nanjen- bon resource potential, J. Petrol. Sci. Eng., 84–85, 33–41, shan L TER Site, Southern Taiwan, Taiwania, 45, 107–119, https://doi.org/10.1016/j.petrol.2012.01.010, 2012. https://doi.org/10.6165/tai.2000.45(1).107, 2000. Rojo, F.: Degradation of alkanes by bacteria, Environ. Mi- Huang, T.-Y.: Metagenomic fastq files from differ- crobiol., 11, 2477–2490, https://doi.org/10.1111/j.1462- ent habitats of subtropical rainforest, available at: 2920.2009.01948.x, 2009. https://doi.org/10.6084/m9.figshare.6026159, last access: Rojo, F.: Enzymes for Aerobic Degradation of Alkanes, Hand- 27 March 2018. book of Hydrocarbon and Lipid Microbiology, 2, 781–797, Jetter, R. and Schäffer, S. S.: Chemical Composition of the Prunus https://doi.org/10.1007/978-3-540-77587-4_59, 2010. laurocerasus Leaf Surface. Dynamic Changes of the Epicuticular Sachse, D., Billault, I., Bowen, G. J., Chikaraishi, Y., Dawson, Wax Film during Leaf Development, Plant Physiol., 126, 1725– T. E., Feakins, S. J., Freeman, K. H., Magill, C. R., McIner- 1737, https://doi.org/10.1104/pp.126.4.1725, 2001. ney, F. A., van der Meer, M. T. J., Polissar, P., Robins, R. J., Jurelevicius, D., Alvarez, V. M., Peixoto, R., Rosado, Sachs, J. P., Schmidt, H.-L., Sessions, A. L., White, J. W. C., A. S., and Seldin, L.: The Use of a Combination of West, J. B., and Kahmen, A.: Molecular Paleohydrology: Inter- alkB Primers to Better Characterize the Distribution preting the Hydrogen-Isotopic Composition of Lipid Biomark- of Alkane-Degrading Bacteria, PLoS One, 8, e66565, ers from Photosynthesizing Organisms, Annu. Rev. Earth Pl. https://doi.org/10.1371/journal.pone.0066565, 2013. Sc., 40, 221–249, https://doi.org/10.1146/annurev-earth-042711- Kahmen, A., Dawson, T. E., Vieth, A., and Sachse, D.: Leaf wax 105535, 2012. n-alkane deltaD values are determined early in the ontogeny Schmidt, S. K.: A substrate-induced growth-response method for of Populus trichocarpa leaves when grown under controlled en- estimating the biomass of microbial functional groups in soil vironmental conditions, Plant Cell Environ., 34, 1639–1651, and aquatic systems, FEMS Microbiol. Ecol., 101, 197–206, https://doi.org/10.1111/j.1365-3040.2011.02360.x, 2011. https://doi.org/10.1111/j.1574-6941.1992.tb01656.x, 1992. Kirkels, F. M. S. A., Cammeraat, L. H., and Kuhn, N. Schulz, S., Giebler, J., Chatzinotas, A., Wick, L. Y., Fetzer, I., Welzl, J.: The fate of soil organic carbon upon erosion, trans- G., Harms, H., and Schloter, M.: Plant litter and soil type drive port and deposition in agricultural landscapes – A re- abundance, activity and community structure of alkB harbouring view of different concepts, Geomorphology, 226, 94–105, microbes in different soil compartments, ISME J., 6, 1763–1774, https://doi.org/10.1016/j.geomorph.2014.07.023, 2014. https://doi.org/10.1038/ismej.2012.17, 2012. Kloos, K., Munch, J. C., and Schloter, M.: A new method for the Singh, S. N., Kumari, B., and Mishra, S.: Microbial Degradation detection of alkane-monooxygenase homologous genes (alkB) in of Alkanes, 439–469, https://doi.org/10.1007/978-3-642-23789- soils based on PCR-hybridization, J. Microbiol. Meth., 66, 486– 8_17, 2012. 496, https://doi.org/10.1016/j.mimet.2006.01.014, 2006. Tsui, C.-C., Chen, Z.-S., and Hsieh, C.-F.: Relationships be- Koch, K., Bhushan, B., and Barthlott, W.: Multifunc- tween soil properties and slope position in a lowland tional surface structures of plants: An inspiration rain forest of southern Taiwan, Geoderma, 123, 131–142, for biomimetics, Prog. Mater. Sci., 54, 137–178, https://doi.org/10.1016/j.geoderma.2004.01.031, 2004. https://doi.org/10.1016/j.pmatsci.2008.07.003, 2009. Wentzel, A., Ellingsen, T. E., Kotlar, H. K., Zotchev, S. Kostka, J. E., Prakash, O., Overholt, W. A., Green, S. J., Freyer, G., B., and Throne-Holst, M.: Bacterial metabolism of long- Canion, A., Delgardio, J., Norton, N., Hazen, T. C., and Huet- chain n-alkanes, Appl Microbiol. Biot., 76, 1209–1221, tel, M.: Hydrocarbon-degrading bacteria and the bacterial com- https://doi.org/10.1007/s00253-007-1119-1, 2007. munity response in gulf of Mexico beach sands impacted by the Xu, K., Tang, Y., Ren, C., Zhao, K., and Sun, Y.: Diversity and abun- deepwater horizon oil spill, Appl. Environ. Microb., 77, 7962– dance of n-alkane-degrading bacteria in the near-surface soils of 7974, https://doi.org/10.1128/AEM.05402-11, 2011. a Chinese onshore oil and gas field, Biogeosciences, 10, 2041– Nie, Y., Chi, C. Q., Fang, H., Liang, J. L., Lu, S. L., Lai, G. 2048, https://doi.org/10.5194/bg-10-2041-2013, 2013. L., Tang, Y. Q., and Wu, X. L.: Diverse alkane hydroxylase genes in microorganisms and environments, Sci. Rep., 4, 4968, https://doi.org/10.1038/srep04968, 2014. Biogeosciences, 15, 1815–1826, 2018 www.biogeosciences.net/15/1815/2018/
You can also read