DNA methylation patterns identify subgroups of pancreatic neuroendocrine tumors with clinical association - Minerva Access
←
→
Page content transcription
If your browser does not render page correctly, please read the page content below
ARTICLE
                  https://doi.org/10.1038/s42003-020-01469-0                  OPEN

                  DNA methylation patterns identify subgroups of
                  pancreatic neuroendocrine tumors with clinical
                  association
1234567890():,;

                  Vanessa Lakis 1, Rita T. Lawlor2, Felicity Newell 1, Ann-Marie Patch 1, Andrea Mafficini 2,
                  Anguraj Sadanandam 3,4, Lambros T. Koufariotis1, Rebecca L. Johnston 1, Conrad Leonard 1,
                  Scott Wood 1, Borislav Rusev2, Vincenzo Corbo2,5, Claudio Luchini 2,5, Sara Cingarlini6,7, Luca Landoni       6,8,

                  Roberto Salvia6,8, Michele Milella6,7, David Chang 9,10,11, Peter Bailey9,12, Nigel B. Jamieson 9,10,11,
                  Fraser Duthie9,13, Marie-Claude Gingras 14,15, Donna M. Muzny14, David A. Wheeler 14,
                  Richard A. Gibbs14,16, Massimo Milione17, APGI*, ARC-Net*, Paolo Pederzoli18, Jaswinder S. Samra19,
                  Anthony J. Gill19,20, Amber L. Johns20, John V. Pearson1, Andrew V. Biankin 9, Sean M. Grimmond 21,
                  Nicola Waddell 1,22, Katia Nones 1,38 ✉ & Aldo Scarpa 2,5,6,38 ✉

                  Here we report the DNA methylation profile of 84 sporadic pancreatic neuroendocrine
                  tumors (PanNETs) with associated clinical and genomic information. We identified three
                  subgroups of PanNETs, termed T1, T2 and T3, with distinct patterns of methylation. The
                  T1 subgroup was enriched for functional tumors and ATRX, DAXX and MEN1 wild-type
                  genotypes. The T2 subgroup contained tumors with mutations in ATRX, DAXX and MEN1 and
                  recurrent patterns of chromosomal losses in half of the genome with no association between
                  regions with recurrent loss and methylation levels. T2 tumors were larger and had lower
                  methylation in the MGMT gene body, which showed positive correlation with gene expres-
                  sion. The T3 subgroup harboured mutations in MEN1 with recurrent loss of chromosome 11,
                  was enriched for grade G1 tumors and showed histological parameters associated with better
                  prognosis. Our results suggest a role for methylation in both driving tumorigenesis and
                  potentially stratifying prognosis in PanNETs.

                  A full list of author affiliations appears at the end of the paper.

                  COMMUNICATIONS BIOLOGY | (2021)4:155 | https://doi.org/10.1038/s42003-020-01469-0 | www.nature.com/commsbio     1
ARTICLE COMMUNICATIONS BIOLOGY | https://doi.org/10.1038/s42003-020-01469-0
P
ancreatic neuroendocrine tumours (PanNETs) are rare Methylation subgroups. To identify cancer-specific DNA
epithelial neoplasms derived from neuroendocrine cells of methylation that could potentially stratify PanNETs, we selected
pancreatic islets whose incidence has collectively increased CpG sites located in promoter regions, which were not methy-
over the last decades1. The overall 5-year survival rate for Pan- lated (β-value < 0.3) across all 11 normal adjacent pancreata
NET patients is 54%, but varies greatly according to stage at samples. Out of 411,159 CpG sites that passed quality filtering,
diagnosis. For patients with local disease, the 5-year survival rate 161,299 sites were not methylated in the normal pancreata (β-
is 93%, whereas patients with locally advanced disease it is 77% value < 0.3), 111,113 of which were located in gene promoter
and for those with distant metastatic disease it is 27% (www. regions (TSS1500, TSS200, 5′-untranslated region (5′-UTR), or
cancer.net/cancer-types/neuroendocrine-tumor-pancreas/statistics; 1stExon). From the latter 111,113 sites, a total of 3378 CpGs had
https://www.cancer.org/cancer/pancreatic-neuroendocrine-tumor/ a β-value SD > 0.20 of the DNA methylation levels across all
detection-diagnosis-staging/survival-rates.html). Recent genome, tumours. With the probe selection described above, we expected
transcriptome and methylome studies have disclosed PanNETs to reduce potential confounding signal from non-tumour cells
molecular heterogeneity that reflects their variable clinical present in the tumour samples. The methylation levels of these
course2–9. PanNETs are either functional or non-functional 3378 most variable promoter CpG sites were dichotomized and
with the latter being more prevalent. Functional PanNETs are unsupervised clustering identified three distinct clusters across
associated with hormone secretion-associated symptoms that lead the tumour samples, suggesting potential subgroups of PanNETs
to early diagnosis. Non-functional PanNETs, due to the lack (Supplementary Fig. 1). Similar subgroups were identified when
of early symptoms, are normally detected at later stages selecting probes across the entire genome (Supplementary Fig. 2)
with locally advanced or metastatic disease. Non-functional
PanNETs are a more heterogeneous group of tumours with
Association of methylation subgroups with commonly mutated
unpredictable and varying degrees of malignancy1,10. The best
genes MEN1, DAXX and ATRX, and with clinical features. The
predictor of clinical outcome of PanNETs is the fraction of
three PanNETs subgroups (termed T1, T2 and T3) identified by
proliferating neoplastic cells, with high-grade (G3) tumours being
methylation patterns (Supplementary Fig. 1) showed potential
more aggressive disease and with molecular alterations that often
associations with clinical and genomic features (Fig. 1a). Sub-
align them with neuroendocrine carcinomas1. Conversely, low-
group T1 represents 26.2% of the cohort and harboured sig-
grade (G1) and intermediate-grade (G2) PanNETs have a distinct
nificantly fewer mutations in the three most commonly mutated
molecular pathology and lack reliable biomarkers to assist pre-
genes in PanNETs (ATRX, DAXX and MEN1) (p-adj ≤ 0.02,
diction of malignancy and selection of treatment11.
Fig. 1b). This subgroup was enriched for functional tumours (7
Previous studies have examined DNA methylation and geno-
out 11 functional tumours, Supplementary Data 1). Subgroup T2
mic patterns in an attempt to further subclassify PanNETs. DNA
represented 42.9% of the cohort; tumours in this subgroup were
methylation has been shown to play an important role in
enriched for mutations in ATRX and DAXX (p-adj ≤ 0.003,
tumorigenesis in many cancers. Studies evaluating DNA methy-
Fig. 1c), were significantly larger than tumours in the other two
lation of candidate genes in PanNETs have shown aberrant
subgroups (p-adj ≤ 0.0003, Fig. 1d), had longer telomeres
methylation of specific genes in subsets of tumours12–14. Studies
(p-adj ≤ 0.00008, Fig. 1e) and presented a high frequency of
have suggested that methylation might contribute to the identi-
alternative lengthening of telomeres (p-adj ≤ 0.0001, Fig. 1a).
fication of PanNETs subgroups and these subgroups could
Tumours in the T2 subgroup also had a higher tumour mutation
potentially be associated with clinical features7–9. More recently,
burden (point mutations per Mb) (p-adj ≤ 0.03, Fig. 1f) and
studies have suggested that methylation can identify cell of origin
harboured 80% of the mutations in mTOR pathway genes
for PanNETs15–17. A few studies have suggested that recurrent
(Supplementary Data 1). There was no difference in age of the
patterns of copy number alterations observed in PanNETs, such
patients or gender distribution between the subgroups; however,
as whole chromosome gains or losses including loss of hetero-
tumour content was slightly lower in tumours in the T1 subgroup
zygosity (LOH), have an association with clinical
than the other two subgroups (p-adj = 0.018, Fig. 1a and Sup-
parameters2,18,19. Sequencing efforts have identified ATRX,
plementary Data 1). Tumours in subgroup T3 harboured muta-
DAXX and MEN1 as the most commonly mutated genes in
tions in MEN1 (contained 30.9% of the cohort), had a higher
PanNETs and genes within the mammalian target of rapamycin
proportion of G1 tumours (p-adj = 0.001, Fig. 1a) and a lower
(mTOR) pathway have been reported at a lower frequency2,20.
frequency of extra-pancreatic spread, perineural and vascular
Here we evaluated a large cohort of sporadic PanNETs with
invasion (Fig. 1g–i), suggesting a subgroup of tumours with better
whole-genome methylation analysis combined with clinical and
prognosis.
other genomic features to provide a more comprehensive picture
of molecular features of PanNETs with potential clinical
implications. Association of methylation subgroups with somatic copy
number changes. Previous studies have reported subgroups of
PanNETs associated with copy number changes2,5. To investigate
Results how copy number alterations relate to the methylation subgroups
Clinical and mutation information. A total of 84 clinically (T1–T3), we compared copy number data generated by Scarpa
sporadic primary PanNETs and 11 normal adjacent pancreata et al.2 with the methylation data (Fig. 2). Subgroup T1 had het-
were profiled using the Illumina 450K methylation arrays. The erogeneous profiles of copy number and were mainly wild-type
clinical and genomic information from Scarpa et al.2 (Supple- for ATRX/DAXX/MEN1. Subgroup T2 was enriched for tumours
mentary Data 1) was used to gain insights into potential Pan- with recurrent LOH in chromosomes 1, 2, 3, 6, 8, 10, 11, 15, 16,
NETs subgroups identified by methylation patterns. There were 21 and 22. Tumours in the T3 subgroup had mainly diploid
32 females and 52 males, 34 G1, 48 G2, 2 G3 (WHO, 2019) and genomes with recurrent loss of chromosome 11. We next inves-
11 functional tumours in the cohort. The cohort included 9 tigated whether clustering using tumour methylation could be
tumours harbouring somatic mutations in the ATRX gene, 21 in influenced by the different profile of copy number observed
DAXX and 31 in MEN1. There were also four tumours with between the groups, more precisely if loss of copy number would
MEN1 germline variants (Supplementary Data 1). result in loss of methylation. We evaluated the methylation levels
2 COMMUNICATIONS BIOLOGY | (2021)4:155 | https://doi.org/10.1038/s42003-020-01469-0 | www.nature.com/commsbioCOMMUNICATIONS BIOLOGY | https://doi.org/10.1038/s42003-020-01469-0 ARTICLE
Methylation Subgroups T1 T2 T3
a MEN1 Mutation
DAXX Mutation
ATRX Mutation
ALT Status
Telomere Ratio
Cellularity
Functional PanNETs
AJCC pT Stage
AJCC Stage
Grade WHO2019
Extra Pancreatic Spread
Perineural Invasion
Vascular Invasion
Surgical Margin
Age
Smoker
Gene Mutation ALT Status Telomere Ratio Cellularity Functional AJCC pT Stage AJCC Stage Grade WHO2019
Germline ALT +ve >2 >=95% PanNETs 4 IV G3
Frame_Shift_Ins ALT −ve 1.35−2 90%−94.99% 3 III G2
Frame_Shift_Del not tested 1−1.35 80%−89.99% Yes 2 IIB G1
In_Frame_Del 0.65−1 70%−79.99% No 1 IIA
Missense_Mutation 0.35−0.65 60%−69.99% IB
Nonsense_Mutation 80 41−50
71−80 31−40 Still
Absent Absent Clear Stopped
NA NA 61−70 21−30
51−60ARTICLE COMMUNICATIONS BIOLOGY | https://doi.org/10.1038/s42003-020-01469-0
Fig. 1 PanNET subgroups identified by methylation profile and unsupervised hierarchical clustering across 84 primary tumours. Tumours (columns)
are presented in the same order as dichotomized clustering presented in Supplementary Fig. 1. a Relationship of subgroups with genomic and clinical
features. b T1 subgroup shows significant enrichment of tumours wild-type for MEN1/DAXX/ATRX genes (Fisher’s exact test). c T2 subgroup tumours are
enriched for mutations in ATRX and DAXX genes (Fisher’s exact test). d T2 subgroup tumours were larger than those in the other two subgroups
(Wilcoxon’s rank-sum test). e T2 subgroup tumours had significant longer telomeres (Wilcoxon’s rank-sum test). f T2 subgroup tumours harboured more
mutations per megabase (Mb) than tumours in other subgroups (Wilcoxon’s rank-sum test). g T3 subgroup tumours presented significant less extra-
pancreatic spread than tumours in the other subgroups (Fisher’s exact test). h T3 subgroup tumours had a trend towards less perineural invasion.
i T3 subgroup tumours had less vascular invasion than the other two subgroups. ALT status: alternative lengthening of telomeres assessed using C-Tailing
qPCR2; ALT+ve: positive for ALT, ALT−ve: negative for ALT; Telomere Ratio: reads with telomeric repeats were counted in both the tumour and matched
normal sample and normalized to the mean genomic coverage of the sample using qMotif2 for both the tumour and matched normal sample and the ratio
gives us an indication of shortening or lengthening in relation to normal sample. Functional PanNETs: tumours that overproduce biologically active
hormone. The box within the boxplots represents a range of values from the first to third quantile and the line within represents the median value of the
distribution. The whiskers represent the maximum and minimum values of the distribution excluding outliers and an asterisk represents any outlier.
a
T1 T2 T3
MEN1 Mutation
DAXX Mutation
ATRX Mutation
ALT Status
Telomere Ratio
12q
12p
17q
14q
20q
20p
17p
19p
19q
13q
4q 1
Proportion of LOH
4p
5p 0.8
5q
7p 0.6
7q
b 9q
9p
0.4
18q
18p 0.2
22q
6q 0
6p
11p
11q
8q
8p
21q
3q
3p
10p
10q
16p
16q
15q
1q
1p
2q
2p
12q
12p
17q
14q
20q
20p
c 17p
19p
19q
13q
4q
4p 1
5p
Median LogR
5q 0.5
7p
7q 0
9q
9p −0.5
18q
18p −1
22q
6q
6p
11p
11q
8q
8p
21q
3q
3p
10p
10q
16p
16q
15q
1q
1p
2q
2p
Tumours
Methylation Subgroups Gene Mutation ALT Status Telomere Ratio
T1 Germline Missense_Mutation ALT +ve >2
T2 Frame_Shift_Ins Nonsense_Mutation ALT −ve 1.35−2
T3 Frame_Shift_Del Splice_Site not tested 1−1.35
0.65−1
In_Frame_Del SV
0.35−0.65COMMUNICATIONS BIOLOGY | https://doi.org/10.1038/s42003-020-01469-0 ARTICLE of average β-value ≥ 0.20), with 1884 of those CpGs in gene pro- The PDX1 gene had 19 CpG sites differentially methylated moter regions (Supplementary Data 2). CpG sites (4044) were between the 3 subgroups, with 6 of those presenting a significant differentially methylated between T1 and T3 (with 1563 CpGs in negative correlation with gene expression (Supplementary Data 5 promoter regions, Supplementary Data 3), and 3586 between T2 and Supplementary Fig. 7a). CpG sites with correlation to and T3 (with 1113 CpGs in promoter regions, Supplementary RNASeq data were located, at TSS1500 (n = 2), in the body (n = Data 4). When evaluating the number of genes affected by differ- 2) and at 3′-UTR (n = 2) of the gene (Supplementary Fig. 7b, c). entially methylated CpG sites, 2630 genes harboured CpG sites In our cohort, the PDX1 gene presented hypermethylated CpG differentially methylated between subgroups T1 and T2 with 1401 sites in the tumours in subgroups T2 and T3 (mutant genes, with promoter regions differentially methylated. When ATRX/DAXX/MEN1) compared to tumours in the subgroup comparing methylation between T1 and T3, 1907 genes harboured T1, which are mainly wild-type for those genes and this subgroup differentially methylated CpG sites with 1025 genes, with promoter was enriched for functional tumours (Supplementary Fig. 7d, e). differentially methylated. Between T2 and T3, 1731 genes har- There was only a trend for higher gene expression of PDX1 in boured sites differentially methylated with 834 of those with probes subgroup T1 (Supplementary Fig. 7f). These results need to be in the CpG “CpG sites” promoter region (Supplementary Data 5). treated with caution, as we had gene expression for only 47 cases We then performed a correlation of methylation levels and (8 cases in the T1 subgroup). Chan et al.4 suggested two genes gene expression for the 47 cases where RNA sequencing that differentiate ATRX/DAXX/MEN1 mutants from wild-type (RNASeq) data were available. CpG sites that mapped to genes PanNETs, Aristaless-related homeobox (ARX) and PDX1. As and were differentially methylated between at least one pair of ARX gene is located in the X chromosome, which is normally subgroups were tested with the aim to gain insights into removed from methylation analysis, we evaluated ARX methyla- potential biological mechanisms that could be impacted by tion patterns separately. We observed no differences in the aberrant methylation. From the 11,042 CpG sites differentially methylation levels between the groups (Supplementary Fig. 8) methylated between at least 1 pair of subgroups, 7303 CpG sites even when evaluating males and females separately (Supplemen- mapped to the footprint of 4317 genes (regions TSS1500, tary Data 7). However, we observed a higher gene expression in TSS200, 5′-UTR, First Exon, gene body or 3′-UTR). Out of T2 and T3 compared to T1 (wild-type tumour). This is in those genes, 987 genes were considered expressed below the agreement with previous studies4,22, and suggests that the detection limits in all 47 cases (876 genes had
ARTICLE COMMUNICATIONS BIOLOGY | https://doi.org/10.1038/s42003-020-01469-0
Methylation Subgroups T1 T2 T3
Location
a MGMT Expression
Avg LoH Chr10q
Beta Values
Probe
1
Gene Locus Copy Number
0.8
Functional PanNET Normal 0.6
0.4
cg24420981
0.2
0
Probe Location
TSS1500
TSS200
Body
cg18811130
cg02634492 3'UTR
MGMT RNA Exp
cg07828472 6
cg13171643
cg16159175
cg23465978 4
cg11302655
cg16648911
2
cg09154334
cg11309842
0
−2
cg19806483
cg04473030
Avg LoH Chr10.5
cg00904483
cg16942891 1
cg20778669
cg11216456
0.8
0.6
cg06952798
cg22939703
cg27041381 0.4
0.2
cg02981064
0
cg07448909
Gene Locus
cg04436810
Copy Number
cg03751055
cg18502933
cnLoH
cg17380475
cg18148349 loss
cg09858782
cg02803836
gain(LoH)
cg19680672
cg17686260
diploid
cg16698623
cg26102564 gain(het)
cg25557018
cg11019008
cg14485787
cg18460575
cg26528551
Functional PanNETs
Yes
cg14273607
No
cg27531642
cg15658262
cg26529877
cg27429313
cg07554771
cg07367735
cg25145165
b Correlation between MGMT Expression and c Methylation in the gene body of MGMT d Expression of MGMT
Median Body Methylation
R = 0.76 , p = 4.5e−10 1.00 Wilcoxon Rank Sum test; p = 3e−05
6 Wilcoxon Rank Sum test; , p = 6.7e−05
MGMT Expression (log2)
0.75
MGMT Expression (log2)
4 4
Beta value
0.50
2 2
0.25
0
0
0.00
0.4 0.6 0.8 T2 T1 & T3 T2 T1 & T3
MGMT Median Body Beta Value
Methylation Subgroups T1 T2 T3
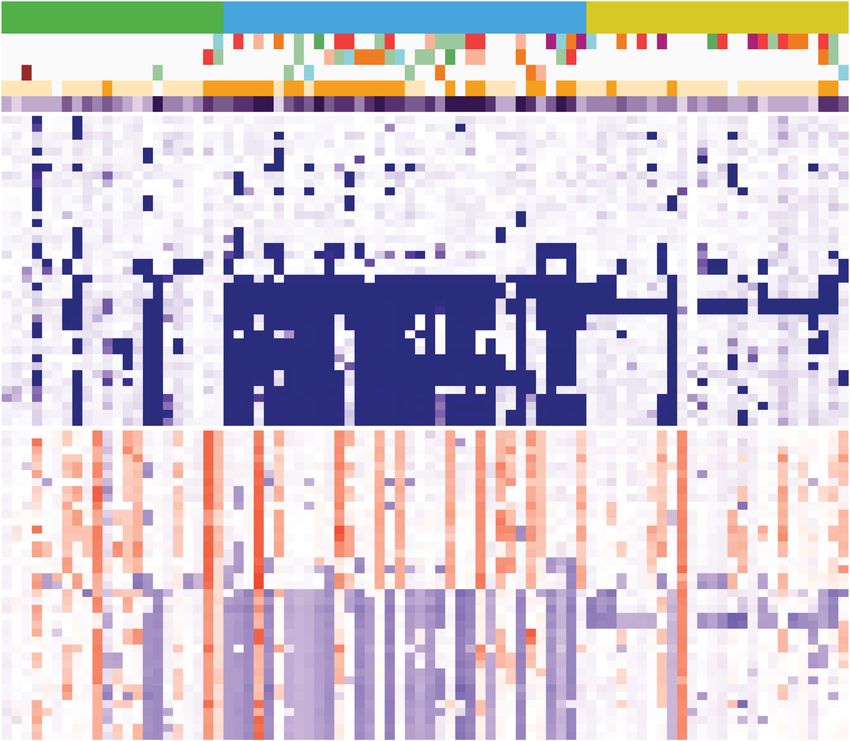
Fig. 3 Methylation levels of the MGMT gene. Tumour (columns) are presented in the same order as dichotomized clustering presented in Supplementary
Fig. 1. a Heat map showing methylation levels across 156 CpG sites mapped to the MGMT gene, which passed the filters. Probes are plotted by genomic
coordinates from 5′ to 3′ direction. Forty-six CpGs sites indicated on the left were differentially methylated between tumour subgroups and correlated with
MGMT gene expression as assessed in 47 cases with RNASeq data. Levels of methylation in normal adjacent pancreata of CpG sites mapped to the MGMT
gene is presented on the right. b Correlation of methylation median levels of 44 CpG sites located in the MGMT gene body and MGMT expression in the 47
cases with RNASeq data. c Average levels of methylation of MGMT gene body CpG sites for tumours in subgroup T2 (n = 36) vs. subgroups T1 and T3
(n = 48). d Gene expression levels of MGMT gene across 47 cases with RNASeq data (T2 n = 17, T1 and T3 n = 30). The box within the boxplots
represents a range of values from the first to third quantile and the line within represents the median value of the distribution. The whiskers represent the
maximum and minimum values of the distribution excluding outliers and an asterisk represents any outlier.
6 COMMUNICATIONS BIOLOGY | (2021)4:155 | https://doi.org/10.1038/s42003-020-01469-0 | www.nature.com/commsbioCOMMUNICATIONS BIOLOGY | https://doi.org/10.1038/s42003-020-01469-0 ARTICLE
number alterations and somatic mutations, adding another islet amyloid polypeptide, and glucose transporter type 2. PDX1
important element to our knowledge of the genetic landscape of plays a major role in glucose-dependent regulation of insulin gene
these neoplasms. expression. Interestingly subgroup T1 was enriched for the
The subgroup T1 included tumours that were mainly wild-type majority of functional tumours in the cohort including five of six
for the commonly mutated genes ATRX, DAXX and MEN1. This insulinomas. Boons et al.15 have used methylation probes in the
subgroup presented tumours with heterogeneous patterns of copy PDX1 loci to identify two PanNETs subtypes (A and B), which
number alteration, agreeing with Chan et al.4 who reported gene they reported similar to α- and β-islet cells, respectively. Subtype
expression and methylation profiles to be more homogenous in A had a significant worse prognosis compared to subtype B, with
mutant ATRX/DAXX/MEN1 tumours than in wild-type tumours. most insulinomas in the latter group. Subtype B was mostly
Subgroup T1 was also enriched for functional tumours (7 of 11 wild-type for ATRX/DAXX/MEN1 genes, which is in agreement
represented in the cohort). with our T1 subgroup. In our study, we further identified two
Tumours in subgroup T2 harboured more mutations in ATRX, groups with different clinical and genomic features. Gene
DAXX and MEN1 with recurrent loss/LOH across 11 chromo- expression and methylation patterns of these groups (T2 and T3)
somes. This is the first study that highlights a correlation of DNA suggests potential similarity with α-islet cells. In Boons et al.15,
methylation profiles with mutations affecting DAXX/ATRX genes subtype A seems to have a further branching in their cluster
and recurrent chromosomal losses, which have been associated with analysis that suggests a potential difference in metastatic disease,
reduced survival in PanNETs2,3,5,25. We investigated the levels of but the authors did not further discuss that. Here we speculate
methylation at CpG sites associated with genes mapping in regions that further subgrouping in their subtype A could be related to
of recurrent loss and LOH and we did not observe lower levels of the two groups (T2 and T3) seen in our study. T2 and T3 mostly
methylation in those regions in tumours harbouring recurrent loss are non-functional PanNETs but showed significant differences
compared to other subgroups, suggesting that together LOH and in histological parameters indicative of prognosis, with T2 asso-
methylation could potentially affect tumorigenesis in PanNETs. ciated with markers of worse prognosis.
Tumours in this subgroup were larger and harboured more somatic Tumours in the T2 subgroup had lower methylation in CpGs
point mutations than the other two subgroups. Lawrence et al.5 located in the body of MGMT gene, which showed positive cor-
have suggested that haploinsufficiency by somatic LOH could be a relation with gene expression. These data are in agreement with
plausible mechanism contributing to PanNETs development by previous studies, suggesting that MGMT gene body methylation
affecting gene expression of a range of tumour suppressors. Our has a role in MGMT expression26,27, and places this phenomenon
data suggest an extra layer of complexity, by an orchestrated in a specific subgroup of PanNETs. Lower expression of MGMT
alteration of patterns of methylation that could potentially explain has been suggested to increase tumour sensitivity to Temozolo-
the similarity of the subgroups observed in the present study and mide, which is frequently used for treatment of advanced Pan-
that of Lawrence et al.5, supporting the hypothesis of a joint NETs. However, studies have presented contradictory results
mechanism (copy number/LOH plus methylation) driving tumor- between expression of MGMT and response to Temozolomide in
igenesis in this cancer. PanNETs21,28,29. A clinical trial for well-differentiated advanced
T3 tumours harboured mutations in MEN1 and had no major duodeno-pancreatic, lung, or unknown primitive NETs is cur-
recurrent copy number changes in their genomes except loss or rently evaluating if MGMT promoter methylation could predict
LOH of the chromosome 11. T3 tumours had a lower incidence response to alkylating agents (NCT03217097)30. In our study,
of perineural, vascular invasion and extra-pancreatic spread, and only one CpG site located in the promoter region of MGMT was
a higher proportion of grade G1 tumours compared to the other differentially methylated between the subgroups, and unexpect-
groups (T1 and T2), suggesting that these tumours have less edly showed a positive correlation with expression. The role of
aggressive behaviour10. MEN1 mutations also play a role in methylation in the body of genes and its relationship with gene
inherited PanNETs. A previous study7 evaluating methylation of expression is not fully understood. Studies have suggested
nine sporadic and ten inherited MEN1-related PanNETs sug- potential mechanisms such as regulation of alternative promoters,
gested that MEN1 mutated tumours in both settings are more regulation of retrotransposon elements influencing alternative
similar than VHL inherited tumours (n = 10). However, sporadic transcription and regulation of other functional elements that
and inherited MEN1-related PanNETs have distinct patterns of maintain efficiency of transcription31–33. MGMT gene body
methylation. It would be interesting in the near future to evaluate methylation would require further investigation due to its
how MEN1-related inherited PanNETs compare to the two sub- potential clinical impact as a predictive marker for treatment of
groups, harbouring MEN1 mutations identified here, which have PanNETs.
distinct histological parameters indicative of prognosis. In summary, this study reports a genome-wide scan of DNA
Overall, the results presented here advance the comprehension methylation in PanNETs, providing evidence that aberrant DNA
of the genetic and epigenetic landscape of PanNETs, indicating methylation plays an important role in their tumorigenesis. This
also that patterns of methylation have the potential to stratify is the largest cohort with integration of methylation with genomic
PanNETs prognosis. Our findings are the initial report of the and clinical information suggesting that an orchestrated epige-
potential for DNA methylation as a biomarker in PanNETs, netic deregulation plays a role together with somatic LOH/copy
which needs to be validated in other cohorts. If validated, the next number changes in this disease. DNA methylation might con-
step towards the use in clinical practice is the identification of a tribute to the heterogeneity in clinical presentation and behaviour
smaller number of CpG sites with PanNET-specific methylation of these tumours. Our findings may also have future clinical
compared to other tissues that can specifically distinguish the implications for stratifying the prognosis and assisting ther-
subtypes and could in the future influence how the patients are apeutic choices for PanNETs patients.
managed in the clinic for treatment and surveillance.
PDX1 presented hypermethylation and lower expression in
tumours with mutations in the ATRX/DAXX/MEN1 genes (T2 Methods
and T3) than in wild-type tumours (T1). This is in agreement Cohort and samples. A total of 84 clinically sporadic primary PanNETs and 11
normal pancreata samples from cancer patients were evaluated for their whole-
with findings from Chan et al.4, supporting the trend in gene genome DNA methylation profile using the Illumina 450 K arrays. Tissue pro-
expression observed in our study. PDX1 is a transcriptional factor cessing and DNA extraction were as previously described34. Methylation data were
for several genes, including insulin, somatostatin, glucokinase, generated using the same DNA extraction that was used for the whole-genome
COMMUNICATIONS BIOLOGY | (2021)4:155 | https://doi.org/10.1038/s42003-020-01469-0 | www.nature.com/commsbio 7ARTICLE COMMUNICATIONS BIOLOGY | https://doi.org/10.1038/s42003-020-01469-0
landscape of these tumours that has previously been characterized by Scarpa et al.2. on the subgroups identified from methylation data with clinical and genomic
Their study included a description of the tumour content, copy number profiles, features. For continuous variables, Kruskal–Wallis tests with post hoc analyses were
somatic and germline mutations, together with clinical parameters. Here we used performed using a Wilcoxon’s rank-sum test and p-values were adjusted for
this publicly available information to complement analysis of methylation patterns multiple testing using Benjamini and Hochberg method with the R function p.
across tumours. adjust. For the categorical variables, Fisher’s exact tests were performed to compare
the relative proportions of the variables between the subgroups. R (version 3.5.1)
was used for all analyses and visualizations. Differential methylation between five
Ethics. Written informed consent was obtained from all patients enroled in this islet cell24 and each subgroup was performed, and probes with an average differ-
study, with approval from: ence > 0.3 between α- and β-islet cells were compared in a heat map to give
potential insight about cell of origin of the subgroups identified.
ARC-Net, University of Verona. Approval number 1885 from the Integrated Uni- RNA sequencing. RNASeq data were available for a subset of 47 cases in the
versity Hospital Trust (AOUI) Ethics Committee (Comitato Etico Azienda Ospe- present cohort. RNASeq data of 27 cases were previously published by Scarpa et al.2
daliera Universitaria Integrata) approved in their meeting of 17 November 2010, and a new extra set of 20 cases formed the set of 47 cases with gene expression data
and documented by the ethics committee 52070/CE on 22 November 2010 and under https://www.ebi.ac.uk/ega/search/site/EGAD00001006063. Sequence reads
formalized by the Health Director of the AOUI on the order of the General were trimmed for adapter sequences using Cutadapt (version 1.9)41 and aligned
Manager with protocol 52438 on 23 November 2010. The specific study was using STAR (version 2.5.2a)42 to the GRCh37 human reference genome assembly
approved with approval (number 2173) by the Ethics Committee with protocol using the gene, transcript and exon features model of Ensembl (release 70).
25979 dated 29/95/2012 and ratified by the Health Director of the AOUI with Quality-control metrics were computed using RNA-SeQC (version 1.1.8)43 and
protocol 26775 dated 01/06/2012. transcript abundances were quantified using RSEM (version 1.2.30)44. Further
analyses of the RNASeq data were carried out in R (version 3.5.1). Genes were
Australian Pancreatic Genome Initiative. Central approval. Sydney Local Health considered expressed if they had 3 CPM in at least 5% of cases (n = 2). Trimmed
District Human Research Ethics Committee (X16-0293); Royal Adelaide Hospital mean of M-values normalization was performed using the edgeR package45. The
Human Research Ethics Committee (091107a); Metro South Human Research batch effect between the two RNASeq data sets (27 published and 20 new cases)
Ethics Committee (09/QPAH/220); South Metropolitan Area Health Service was corrected using ComBat from the “sva” R package (version 3.30.1)46
Human Research Ethics Committee (09/324); Southern Adelaide Health Service/ (Supplementary Fig. 12). Correlations between methylation and gene expression
Flinders University Human Research Ethics Committee (167/10); The University were calculated using a Pearson’s correlation and p-values were adjusted for
of Queensland Medical Research Ethics Committee (2009000745); Greenslopes multiple testing using Benjamini–Hochberg method using the R function p.adjust.
Private Hospital Ethics Committee (09/34); North Shore Private Hospital Ethics
Committee (2016/016). Reporting summary. Further information on research design is available in the Nature
Research Reporting Summary linked to this article.
Baylor College of Medicine. Institutional Review Board protocol numbers H-29198
(Baylor College of Medicine tissue resource), H-21332 (Genomes and Genetics at
the BCM-HGSC) and H-32711 (Cancer Specimen Biobanking and Genomics). Data availability
Methylation data used in this study has been deposited in the NCBI Gene Expression
QIMR Berghofer Medical Research Institute. P3462 (QIMR Berghofer Human Omnibus (GEO) under the accession number GSE149395 and ICGC portal
Research Ethics Committee). (International Cancer Genome Consortium (ICGC) https://icgc.org/ under projects
PAEN-AU and PAEN-IT). RNASeq data are available on EGA (https://www.ebi.ac.uk/
ega/search/site/EGAD00001006063). Source data for figures presented in the manuscript
Bisulfite conversion, 450 K methylation arrays. Genomic DNA (500 ng) was are available as Supplementary Data 8.
bisulfite converted using EZ DNA methylation Kits (Zymo Research) according to
the manufacturer’s protocol for Illumina Methylation arrays. Bisulfite converted
DNA was whole-genome amplified and hybridized to Infinium Human Methyla- Received: 29 April 2020; Accepted: 2 November 2020;
tion 450 K BeadChips (Illumina) according to the manufacturer’s protocol. Arrays
were scanned using an iScan (Illumina).
DNA methylation analysis. Raw IDAT files were imported35, filtered and nor-
malized using the ChAMP36 package implemented in R. Probes were primarily
filtered out if detection p-value > 0.01 or there were fewer than three beads in at
References
1. Klöppel, G. et al. in WHO Classification of Tumours. Digestive System
least 5% of samples. A β-mixture quantile normalization (BMIQ)37 was performed
to account for probe type1 and type 2 biases, followed by a quantile normalisation Tumours (ed. World Health Organization) 5th edn, 343–372 (International
(QN). Further filtering was performed to remove probes in non-CpG sites, X or Y Agency for Research on Cancer, 2019).
chromosome, single-nucleotide polymorphism-related polymorphisms as per Zhou 2. Scarpa, A. et al. Whole-genome landscape of pancreatic neuroendocrine
et al.38 and probes that map to multiple locations as per Nordlund et al.39 (Sup- tumours. Nature 543, 65–71 (2017).
plementary Table 1). After the filtering process, 411,159 probes were used for 3. Marinoni, I. et al. Hypo-methylation mediates chromosomal instability in
further analysis. A single value decomposition40 analysis determined no significant pancreatic NET. Endocr. Relat. Cancer 24, 137–146 (2017).
batch effects (Supplementary Fig. 11). Tumour methylation arrays were provided 4. Chan, C. S. et al. ATRX, DAXX or MEN1 mutant pancreatic neuroendocrine
by the International Cancer Genome Consortium (ICGC, https://icgc.org/ under tumors are a distinct alpha-cell signature subgroup. Nat. Commun. 9, 4158
projects PAEN-AU and PAEN-IT). DNA methylation array data generated for (2018).
normal adjacent samples was deposited in Gene Expression Omnibus 5. Lawrence, B. et al. Recurrent loss of heterozygosity correlates with clinical
(GSE149395). outcome in pancreatic neuroendocrine cancer. NPJ Genome Med. 3, 18 (2018).
6. Roy, S. et al. Loss of chromatin-remodeling proteins and/or CDKN2A
associates with metastasis of pancreatic neuroendocrine tumors and reduced
Statistics and reproducibility. To identify CpG sites (CG positions in the genome patient survival times. Gastroenterology 154, 2060–2063 e2068 (2018).
assayed by arrays) with potential cancer-specific DNA methylation, we selected 7. Tirosh, A. et al. Distinct genome-wide methylation patterns in sporadic and
probes in promoter regions (indicated in the vendor annotation file as TSS1500,
hereditary nonfunctioning pancreatic neuroendocrine tumors. Cancer 125,
TSS200, 5′-UTR or 1stExon). Next, we identified CpG sites located in promoter
1247–1257 (2019).
regions with low levels of methylation (β-value < 0.3) in all normal adjacent pan-
8. Pipinikas, C. P., Berner, A. M., Sposito, T. & Thirlwell, C. The evolving (epi)
creata and from those selected the most variable probes with a SD > 0.20 of DNA
genetic landscape of pancreatic neuroendocrine tumours. Endocr. Relat.
methylation levels across all tumours. The CpG sites with the most variable
Cancer 26, R519–R544 (2019).
methylation levels across tumours were then dichotomized (representing a pre-
sence β-value ≥ 0.3 or absence β-value < 0.3 of methylation) and clustered to obtain 9. Mafficini, A. & Scarpa, A. Genetics and epigenetics of gastroenteropancreatic
potential subgroups of tumour samples. The unsupervised clustering used a binary neuroendocrine neoplasms. Endocr. Rev. 40, 506–536 (2019).
distance measure and Ward’s clustering method. The approaches described above 10. Kim, H. et al. Time-trend and recurrence analysis of pancreatic
were taken to minimize potential confounding signal from non-tumour cells in neuroendocrine tumors. Endocr. Connect. 8, 1052–1060 (2019).
tumour samples. The differential methylation analyses between subgroups identi- 11. Falconi, M. et al. ENETS Consensus Guidelines Update for the Management
fied by clustering were performed using t-tests for 411,159 probes with adjustment of Patients with Functional Pancreatic Neuroendocrine Tumors and Non-
for multiple testing using Benjamini and Hochberg method using the R function p. Functional Pancreatic Neuroendocrine Tumors. Neuroendocrinology 103,
adjust. Significance was defined if the adjusted p-value < 0.05 and the difference in 153–171 (2016).
the average β-values between subgroups > 0.2. Differential methylation analysis 12. Conemans, E. B. et al. DNA methylation profiling in MEN1-related
between identified subgroups aimed to gain biological insights about the differences pancreatic neuroendocrine tumors reveals a potential epigenetic target for
in those groups. An investigation to identify potential associations was performed treatment. Eur. J. Endocrinol. 179, 153–160 (2018).
8 COMMUNICATIONS BIOLOGY | (2021)4:155 | https://doi.org/10.1038/s42003-020-01469-0 | www.nature.com/commsbioCOMMUNICATIONS BIOLOGY | https://doi.org/10.1038/s42003-020-01469-0 ARTICLE
13. House, M. G. et al. Aberrant hypermethylation of tumor suppressor genes in 43. DeLuca, D. S. et al. RNA-SeQC: RNA-seq metrics for quality control and
pancreatic endocrine neoplasms. Ann. Surg. 238, 423–431 (2003). process optimization. Bioinformatics 28, 1530–1532 (2012).
14. Stefanoli, M. et al. Prognostic relevance of aberrant DNA methylation in g1 and 44. Li, B. & Dewey, C. N. RSEM: accurate transcript quantification from RNA-Seq
g2 pancreatic neuroendocrine tumors. Neuroendocrinology 100, 26–34 (2014). data with or without a reference genome. BMC Bioinformatics 12, 323 (2011).
15. Boons, G. et al. PDX1 DNA methylation distinguishes two subtypes of 45. Robinson, M. D. & Oshlack, A. A scaling normalization method for differential
pancreatic neuroendocrine neoplasms with a different prognosis. Cancers 12, expression analysis of RNA-seq data. Genome Biol. 11, R25 (2010).
https://doi.org/10.3390/cancers12061461 (2020). 46. Johnson, W. E., Li, C. & Rabinovic, A. Adjusting batch effects in microarray
16. Di Domenico, A. et al. Epigenetic landscape of pancreatic neuroendocrine expression data using empirical Bayes methods. Biostatistics 8, 118–127 (2007).
tumours reveals distinct cells of origin and means of tumour progression.
Commun Biol. 3, 740 (2020).
17. Simon, T. et al. An integrative genetic, epigenetic and proteomic Acknowledgements
characterization of pancreatic neuroendocrine neoplasms (PanNENs) defines We thank all patients and funding below that made this study possible. Associazione
distinct molecular features of α- and β-cell like subgroups. Preprint at https:// Italiana Ricerca Cancro (AIRC 5×1000 n. 12182 and Start up n. 18718); Fondazione Italiana
doi.org/10.1101/2020.06.12.146811 (2020). Malattie Pancreas–Ministero Salute [FIMPCUP_J38D19000690001]; Fondazione Cariver-
18. Lawrence, B. et al. The epidemiology of gastroenteropancreatic neuroendocrine ona: Oncology Biobank Project “Antonio Schiavi” (prot. 203885/2017); European Com-
tumors. Endocrinol. Metab. Clin. North Am. 40, 1–18 (2011). vii. munity ERANET PMTR-pNET, cod. D18TR5, B46C17000260001; National Health and
19. Pea, A. et al. Genetic analysis of small well-differentiated pancreatic Medical Research Council of Australia (NHMRC; 631701, 535903, CDF 1112113, PRF
neuroendocrine tumors identifies subgroups with differing risks of liver 1025427, SRF 455857, 535903); The Queensland State Government Smart State National
metastases. Ann. Surg. 271, 566–573 (2020). and International Research Alliances Program (NIRAP); Institute for Molecular Bioscience/
20. Jiao, Y. et al. DAXX/ATRX, MEN1, and mTOR pathway genes are frequently University of Queensland; Australian Government: Department of Innovation, Industry,
altered in pancreatic neuroendocrine tumors. Science 331, 1199–1203 (2011). Science and Research (DIISR); Australian Cancer Research Foundation (ACRF); Cancer
21. Girot, P. et al. Short article: evaluation of O6-methylguanine-DNA Council NSW (SRP06-01, SRP11-01. ICGC); Cancer Institute NSW (10/ECF/2-26; 06/ECF/
methyltransferase as a predicting factor of response to temozolomide-based 1-24; 09/CDF/2-40; 07/CDF/1-03; 10/CRF/1-01, 08/RSA/1-15, 07/CDF/1-28, 10/CDF/2-
chemotherapy in well-differentiated metastatic pancreatic neuroendocrine 26,10/FRL/2-03, 06/RSA/1-05, 09/RIG/1-02, 10/TPG/1-04, 11/REG/1-10, 11/CDF/3-26);
tumors. Eur. J. Gastroenterol. Hepatol. 29, 826–830 (2017). Garvan Institute of Medical Research; Avner Nahmani Pancreatic Cancer Research Foun-
22. Cejas, P. et al. Enhancer signatures stratify and predict outcomes of non- dation; R.T. Hall Trust; Petre Foundation; Philip Hemstritch Foundation; Gastro-
functional pancreatic neuroendocrine tumors. Nat. Med. 25, 1260–1265 (2019). enterological Society of Australia (GESA Senior Research Fellowship); Royal Australasian
23. Muraro, M. J. et al. A single-cell transcriptome atlas of the human pancreas. College of Surgeons (RACS); Royal Australasian College of Physicians (RACP); Royal
Cell Syst. 3, 385–394 e383 (2016). College of Pathologists of Australasia (RCPA); QIMR Berghofer Medical Research; The
24. Neiman, D. et al. Islet cells share promoter hypomethylation independently of Keith Boden Fellowship supporting KN; NHGRI U54 HG003273; CPRIT grant RP101353-
expression, but exhibit cell-type-specific methylation in enhancers. Proc. Natl P7; Wellcome Trust Senior Investigator Award (103721/Z/14/Z); CRUK Programme
Acad. Sci. USA 114, 13525–13530 (2017). (C29717/A17263 and C29717/A18484); CRUK Glasgow Centre (C596/A18076); CRUK
25. Singhi, A. D. et al. Alternative lengthening of telomeres and loss of DAXX/ Clinical Training Award (C596/A20921); Pancreatic Cancer UK Future Research Leaders
ATRX expression predicts metastatic disease and poor survival in patients with Fund; The Howat Foundation; University of Glasgow. N.W. was supported by National
pancreatic neuroendocrine tumors. Clin. Cancer Res. 23, 600–609 (2017). Health and Medical Research Council of Australia (NHMRC; SRF 1139071).
26. Moen, E. L., Stark, A. L., Zhang, W., Dolan, M. E. & Godley, L. A. The role of
gene body cytosine modifications in MGMT expression and sensitivity to Author contributions
temozolomide. Mol. Cancer Ther. 13, 1334–1344 (2014). V.L., K.N., A.S., N.W., A.V.B., and S.M.G.: concept and design. K.N., V.L., A.S., N.W.,
27. Costello, J. F., Futscher, B. W., Tano, K., Graunke, D. M. & Pieper, R. O. R.T.L., C. Luchini, and V.C.: writing team. V.L., K.N., F.N., and A.M.P.: methylation ana-
Graded methylation in the promoter and body of the O6-methylguanine lysis. V.L., L.T.K., R.L.J., R.T.L., A.M.P., A.M., A. Sadanandam, D.C., and P.B.: RNASeq data
DNA methyltransferase (MGMT) gene correlates with MGMT expression in and analysis. V.L., K.N., APGI, ARC-Net, B.R., C. Leonard, S.W., K.N., A.M.P., R.T.L., A.M.,
human glioma cells. J. Biol. Chem. 269, 17228–17237 (1994). M. Milella, F.D., R.S., S.C., L.L., P.P., N.B.J., M.C.G., D.M.M., D.A.W., R.A.G., J.S.S., A.J.G.,
28. Cros, J. et al. MGMT expression predicts response to temozolomide in A.L.J., J.V.P., A.V.B., S.M.G.: sample collection, processing, quality control and clinical
pancreatic neuroendocrine tumors. Endocr. Relat. Cancer 23, 625–633 annotation, and pathology assessment. A.S., M. Milione, A.V.B., and S.M.G.: attracted
(2016). funding. All authors have read and approved the final manuscript.
29. Thomas, A. et al. Temozolomide in the era of precision medicine. Cancer Res.
77, 823–826 (2017).
30. Lemelin, A. et al. O6-methylguanine-DNA methyltransferase (MGMT) status Competing interests
in neuroendocrine tumors: a randomized phase II study (MGMT-NET). Dig. N.W. and J.V.P are co-founders and Board of genomiQa pty ltd. The other authors
Liver Dis. 51, 595–599 (2019). declare no competing interests.
31. Maunakea, A. K. et al. Conserved role of intragenic DNA methylation in
regulating alternative promoters. Nature 466, 253–257 (2010).
32. Wolff, E. M. et al. Hypomethylation of a LINE-1 promoter activates an
Additional information
Supplementary information is available for this paper at https://doi.org/10.1038/s42003-
alternate transcript of the MET oncogene in bladders with cancer. PLoS
020-01469-0.
Genet. 6, e1000917 (2010).
33. Yang, X. et al. Gene body methylation can alter gene expression and is a
Correspondence and requests for materials should be addressed to K.N. or A.S.
therapeutic target in cancer. Cancer Cell 26, 577–590 (2014).
34. Biankin, A. V. et al. Pancreatic cancer genomes reveal aberrations in axon
Reprints and permission information is available at http://www.nature.com/reprints
guidance pathway genes. Nature 491, 399–405 (2012).
35. Aryee, M. J. et al. Minfi: a flexible and comprehensive Bioconductor package
Publisher’s note Springer Nature remains neutral with regard to jurisdictional claims in
for the analysis of Infinium DNA methylation microarrays. Bioinformatics 30,
published maps and institutional affiliations.
1363–1369 (2014).
36. Morris, T. J. et al. ChAMP: 450k chip analysis methylation Pipeline.
Bioinformatics 30, 428–430 (2014).
37. Teschendorff, A. E. et al. A beta-mixture quantile normalization method for Open Access This article is licensed under a Creative Commons
correcting probe design bias in Illumina Infinium 450 k DNA methylation Attribution 4.0 International License, which permits use, sharing,
data. Bioinformatics 29, 189–196 (2013). adaptation, distribution and reproduction in any medium or format, as long as you give
38. Zhou, W., Laird, P. W. & Shen, H. Comprehensive characterization, appropriate credit to the original author(s) and the source, provide a link to the Creative
annotation and innovative use of Infinium DNA methylation BeadChip Commons license, and indicate if changes were made. The images or other third party
probes. Nucleic Acids Res. 45, e22 (2017). material in this article are included in the article’s Creative Commons license, unless
39. Nordlund, J. et al. Genome-wide signatures of differential DNA methylation indicated otherwise in a credit line to the material. If material is not included in the
in pediatric acute lymphoblastic leukemia. Genome Biol. 14, r105 (2013). article’s Creative Commons license and your intended use is not permitted by statutory
40. Teschendorff, A. E. et al. An epigenetic signature in peripheral blood predicts regulation or exceeds the permitted use, you will need to obtain permission directly from
active ovarian cancer. PLoS ONE 4, e8274 (2009). the copyright holder. To view a copy of this license, visit http://creativecommons.org/
41. Martin, M. Cutadapt removes adapter sequences from high-throughput licenses/by/4.0/.
sequencing reads. EMBnet J. 17, 10–12 (2011).
42. Dobin, A. et al. STAR: ultrafast universal RNA-seq aligner. Bioinformatics 29,
15–21 (2013). © The Author(s) 2021
COMMUNICATIONS BIOLOGY | (2021)4:155 | https://doi.org/10.1038/s42003-020-01469-0 | www.nature.com/commsbio 9ARTICLE COMMUNICATIONS BIOLOGY | https://doi.org/10.1038/s42003-020-01469-0 1 QIMR Berghofer Medical Research Institute, 300 Herston Road, Brisbane, Queensland 4006, Australia. 2ARC-Net Centre for Applied Research on Cancer, University and Hospital Trust of Verona, Verona 37134, Italy. 3Division of Molecular Pathology, The Institute of Cancer Research, London, UK. 4The Royal Marsden Hospital, London, UK. 5Section of Pathology, Department of Diagnostics and Public Health, University of Verona, Verona, Italy. 6ENETS Center of Excellence, University and Hospital Trust of Verona, Verona, Italy. 7Section of Oncology, Department of Medicine, University and Hospital Trust of Verona, Verona, Italy. 8The Pancreas Institute, University and Hospital Trust of Verona, Verona, Italy. 9 Wolfson Wohl Cancer Research Centre, Institute of Cancer Sciences, University of Glasgow, Garscube Estate, Switchback Road, Bearsden, Glasgow G61 1BD, UK. 10Academic Unit of Surgery, School of Medicine, College of Medical, Veterinary and Life Sciences, University of Glasgow, Glasgow Royal Infirmary, Glasgow G4 OSF, UK. 11West of Scotland Pancreatic Unit, Glasgow Royal Infirmary, Glasgow G31 2ER, UK. 12Department of General Surgery, University of Heidelberg, Im Neuenheimer Feld 110, 69120 Heidelberg, Baden-Württemberg, Germany. 13Department of Pathology, Queen Elizabeth University Hospital, Greater Glasgow & Clyde NHS, Glasgow G51 4TF, UK. 14Department of Molecular and Human Genetics, Human Genome Sequencing Center, Baylor College of Medicine, One Baylor Plaza, MS226, Houston, Texas 77030-3411, USA. 15 Michael E. DeBakey Department of Surgery and The Elkins Pancreas Center, Baylor College of Medicine, One Baylor Plaza, Houston, Texas 77030-3411, USA. 16Human Genome Sequencing Center, Baylor College of Medicine, Houston, Texas 77030, USA. 17Department of Pathology, Fondazione IRCCS Istituto Nazionale dei Tumori di Milano, Milan, Italy. 18Ospedale Pederzoli, Peschiera del Garda, Verona, Italy. 19University of Sydney, Sydney, New South Wales 2006, Australia. 20The Kinghorn Cancer Centre, Garvan Institute of Medical Research, 370 Victoria Street, Darlinghurst, Sydney, New South Wales 2010, Australia. 21University of Melbourne Centre for Cancer Research, Victorian Comprehensive Cancer Centre, 305 Grattan Street, Melbourne, Victoria 3000, Australia. 22Institute for Molecular Bioscience, The University of Queensland, St Lucia, Brisbane, Queensland 4072, Australia. 23Royal North Shore Hospital, Westbourne Street, St Leonards, New South Wales 2065, Australia. 24 Bankstown Hospital, Eldridge Road, Bankstown, New South Wales 2200, Australia. 25Liverpool Hospital, Elizabeth Street, Liverpool, New South Wales 2170, Australia. 26St Vincent’s Hospital, 390 Victoria Street, Darlinghurst, New South Wales 2010, Australia. 27Westmead Hospital, Hawkesbury and Darcy Roads, Westmead, New South Wales 2145, Australia. 28Royal Prince Alfred Hospital, Missenden Road, Camperdown, New South Wales 2050, Australia. 29Prince of Wales Hospital, Barker Street, Randwick, New South Wales 2031, Australia. 30Fremantle Hospital, Alma Street, Fremantle, Western Australia 6959, Australia. 31Epworth HealthCare, 89 Bridge Road, Richmond, Victoria 3121, Australia. 32Royal Adelaide Hospital, North Terrace, Adelaide, South Australia 5000, Australia. 33Flinders Medical Centre, Flinders Drive, Bedford Park, South Australia 5042, Australia. 34Envoi Pathology, 1/49 Butterfield Street, Herston, Queensland 4006, Australia. 35Princess Alexandra Hospital, Cornwall Street & Ipswich Road, Woolloongabba, Queensland 4102, Australia. 36Austin Hospital, 145 Studley Road, Heidelberg, Victoria 3084, Australia. 37Johns Hopkins Medical Institute, 600 North Wolfe Street, Baltimore, Maryland 21287, USA. 38These authors jointly supervised this work: Katia Nones, Aldo Scarpa. *Lists of authors and their affiliations appear at the end of the paper. ✉email: Katia.Nones@qimrberghofer.edu.au; aldo.scarpa@univr.it APGI Garvan Institute of Medical Research Lorraine A. Chantrill9,18, Paul Timpson20, Angela Chou20,21, Marina Pajic20, Angela Murphy20, Tanya Dwarte20, David Hermann20, Claire Vennin20, Thomas R. Cox20, Brooke Pereira20, Shona Ritchie20, Daniel A. Reed20, Cecilia R. Chambers20, Xanthe Metcalf20 & Max Nobis20 QIMR Berghofer Medical Research Institute Pamela Mukhopadhyay1, Venkateswar Addala1, Stephen Kazakoff1, Oliver Holmes1, Qinying Xu1 & Scott Wood 1 University of Melbourne: Centre for Cancer Research Oliver Hofmann21 Royal North Shore Hospital Jaswinder S. Samra23, Nick Pavlakis23, Jennifer Arena23 & Hilda A. High23 Bankstown Hospital Ray Asghari24, Neil D. Merrett24, Darren Pavey24 & Amitabha Das24 Liverpool Hospital Peter H. Cosman25, Kasim Ismail25 & Chelsie O’Connnor25 St Vincent’s Hospital Alina Stoita26, David Williams26 & Allan Spigellman26 Westmead Hospital Vincent W. Lam27, Duncan McLeod27 & Judy Kirk27 Royal Prince Alfred Hospital Chris O’Brien Lifehouse James G. Kench28, Peter Grimison28, Charbel Sandroussi28 & Annabel Goodwin25,28 Prince of Wales Hospital R. Scott Mead9, Katherine Tucker29 & Lesley Andrews29 10 COMMUNICATIONS BIOLOGY | (2021)4:155 | https://doi.org/10.1038/s42003-020-01469-0 | www.nature.com/commsbio
COMMUNICATIONS BIOLOGY | https://doi.org/10.1038/s42003-020-01469-0                                           ARTICLE

Fiona Stanley Hospital Michael Texler30, Cindy Forest30, Mo Ballal30 & David R. Fletcher30

Epworth Health Care Nikolajs Zeps31

Royal Adelaide Hospital Nan Q. Nguyen32, Andrew R. Ruszkiewicz32 & Chris Worthley32

Flinders Medical Centre John Chen33, Mark E. Brooke-Smith33 & Virginia Papangelis33

Envoi Pathology Andrew D. Clouston34

Princess Alexandra Hospital Andrew P. Barbour35, Thomas J. O’Rourke35, Jonathan W. Fawcett35,
Kellee Slater35, Michael Hatzifotis35 & Peter Hodgkinson35

Austin Hospital Mehrdad Nikfarjam36

Johns Hopkins Medical Institutes James R. Eshleman37, Ralph H. Hruban37 & Christopher L. Wolfgang37

University of Glasgow Judith Dixon9

ARC-Net
Maria Scardoni2,5, Claudio Bassi2,8, Sonia Grimaldi2, Cinzia Cantù2,5, Giada Bonizzato2, Samantha Bersani5,
Davide Antonello8, Liliana Piredda2, Nicola Sperandio2, Stefano Barbi5 & Paola Merlini2

COMMUNICATIONS BIOLOGY | (2021)4:155 | https://doi.org/10.1038/s42003-020-01469-0 | www.nature.com/commsbio        11
Minerva Access is the Institutional Repository of The University of Melbourne

Author/s:
Lakis, V; Lawlor, RT; Newell, F; Patch, A-M; Mafficini, A; Sadanandam, A; Koufariotis, LT;
Johnston, RL; Leonard, C; Wood, S; Rusev, B; Corbo, V; Luchini, C; Cingarlini, S; Landoni,
L; Salvia, R; Milella, M; Chang, D; Bailey, P; Jamieson, NB; Duthie, F; Gingras, M-C; Muzny,
DM; Wheeler, DA; Gibbs, RA; Milione, M; Pederzoli, P; Samra, JS; Gill, AJ; Johns, AL;
Pearson, J; Biankin, A; Grimmond, SM; Waddell, N; Nones, K; Scarpa, A

Title:
DNA methylation patterns identify subgroups of pancreatic neuroendocrine tumors with
clinical association

Date:
2021-02-03

Citation:
Lakis, V., Lawlor, R. T., Newell, F., Patch, A. -M., Mafficini, A., Sadanandam, A., Koufariotis,
L. T., Johnston, R. L., Leonard, C., Wood, S., Rusev, B., Corbo, V., Luchini, C., Cingarlini, S.,
Landoni, L., Salvia, R., Milella, M., Chang, D., Bailey, P. ,... Scarpa, A. (2021). DNA
methylation patterns identify subgroups of pancreatic neuroendocrine tumors with clinical
association. COMMUNICATIONS BIOLOGY, 4 (1), https://doi.org/10.1038/s42003-020-
01469-0.

Persistent Link:
http://hdl.handle.net/11343/273310

File Description:
Published version
License:
CC BY
You can also read