Improved prediction and characterization of anticancer activities of peptides using a novel flexible scoring card method - Nature
←
→
Page content transcription
If your browser does not render page correctly, please read the page content below
www.nature.com/scientificreports
OPEN Improved prediction
and characterization of anticancer
activities of peptides using a novel
flexible scoring card method
Phasit Charoenkwan1, Wararat Chiangjong2, Vannajan Sanghiran Lee3,
Chanin Nantasenamat4, Md. Mehedi Hasan5 & Watshara Shoombuatong4*
As anticancer peptides (ACPs) have attracted great interest for cancer treatment, several approaches
based on machine learning have been proposed for ACP identification. Although existing methods
have afforded high prediction accuracies, however such models are using a large number of descriptors
together with complex ensemble approaches that consequently leads to low interpretability and
thus poses a challenge for biologists and biochemists. Therefore, it is desirable to develop a simple,
interpretable and efficient predictor for accurate ACP identification as well as providing the means
for the rational design of new anticancer peptides with promising potential for clinical application.
Herein, we propose a novel flexible scoring card method (FSCM) making use of propensity scores
of local and global sequential information for the development of a sequence-based ACP predictor
(named iACP-FSCM) for improving the prediction accuracy and model interpretability. To the best
of our knowledge, iACP-FSCM represents the first sequence-based ACP predictor for rationalizing
an in-depth understanding into the molecular basis for the enhancement of anticancer activities of
peptides via the use of FSCM-derived propensity scores. The independent testing results showed
that the iACP-FSCM provided accuracies of 0.825 and 0.910 as evaluated on the main and alternative
datasets, respectively. Results from comparative benchmarking demonstrated that iACP-FSCM
could outperform seven other existing ACP predictors with marked improvements of 7% and 17% for
accuracy and MCC, respectively, on the main dataset. Furthermore, the iACP-FSCM (0.910) achieved
very comparable results to that of the state-of-the-art ensemble model AntiCP2.0 (0.920) as evaluated
on the alternative dataset. Comparative results demonstrated that iACP-FSCM was the most
suitable choice for ACP identification and characterization considering its simplicity, interpretability
and generalizability. It is highly anticipated that the iACP-FSCM may be a robust tool for the rapid
screening and identification of promising ACPs for clinical use.
Anticancer peptides (ACPs) are small peptides exerting selective and toxic properties toward cancer cells. Owing
to its inherent high penetration, high selectivity and ease of modification, synthetic peptide-based drugs and
vaccines1–3 represents a promising class of therapeutic agents. Designed ACPs can improve affinity, selectivity
and stability for enhancing cancer cell elimination. The influence of amino acid residues towards the anticancer
activity of ACPs is dependent on cationic, hydrophobic and amphiphilic properties with helical structure to drive
cell permeability. Particularly, cationic amino acid residues (i.e., lysine, arginine, and histidine) can disrupt and
penetrate the cancer cell membrane to induce cytotoxicity whereas anionic amino acids (i.e., glutamic and aspar-
tic acids) affords antiproliferative activity against cancer cells. Furthermore, hydrophobic amino acid residues
(i.e., phenylalanine, tryptophan, and tyrosine) exerts their effect on the cancer cytotoxic a ctivity1,4,5. Moreover,
the secondary structure of ACPs that is formed by cationic and hydrophobic amino acids, plays a crucial role in
1
Modern Management and Information Technology, College of Arts, Media and Technology, Chiang Mai
University, Chiang Mai 50200, Thailand. 2Pediatric Translational Research Unit, Department of Pediatrics, Faculty
of Medicine, Ramathibodi Hospital, Mahidol University, Bangkok 10400, Thailand. 3Department of Chemistry,
Centre of Theoretical and Computational Physics, Faculty of Science, University of Malaya, 50603 Kuala Lumpur,
Malaysia. 4Center of Data Mining and Biomedical Informatics, Faculty of Medical Technology, Mahidol University,
Bangkok 10700, Thailand. 5Department of Bioscience and Bioinformatics, Kyushu Institute of Technology, 680‑4
Kawazu, Iizuka, Fukuoka 820‑8502, Japan. *email: watshara.sho@mahidol.ac.th
Scientific Reports | (2021) 11:3017 | https://doi.org/10.1038/s41598-021-82513-9 1
Vol.:(0123456789)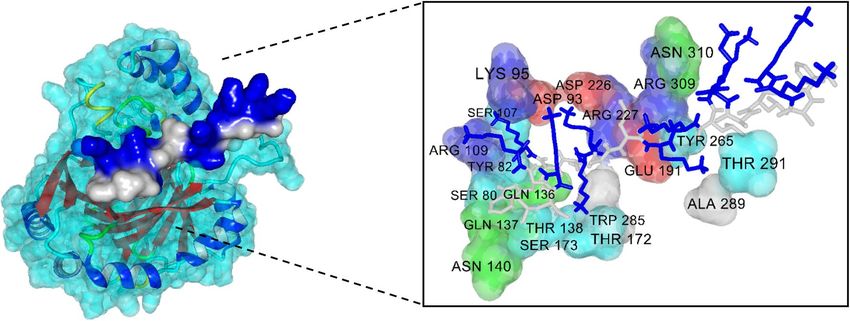
www.nature.com/scientificreports/
Figure 1. System flowchart of the proposed iACP-FSCM. There are five main steps are involved in the
development of proposed iACP-FSCM as follows: (i) preparing the training and independent datasets, (ii)
calculating the initial propensity score (init-PS) using a statistical approach, (iii) estimating the optimized
propensity score (opti-PS) using a genetic algorithm (GA), (iv) evaluating the prediction ability of iACP-FSCM,
(v) ACPs characterization using the propensity scores and docking approach.
peptide-cancer cell membrane interaction that inherently leads to cancer cell disruption and death1,6. Therefore,
it is desirable to develop a simple, interpretable and efficient predictor for achieving accurate ACP identification
as well as facilitating the rational design of new anticancer peptides with promising clinical applications.
In the past few years, most methods in existence were developed via the use of machine learning (ML) and
statistical methods as applied on peptide sequence information for discriminating ACPs from non-ACPs7–23.
More details of those existing methods are summarized in two comprehensive review papers2,3. Amongst the
various types of ML approaches, both support vector machine (SVM) (i.e. A ntiCP8, Hajisharifi et al.’s method9,
ACPP24, iACP10, Li and Wang’s m ethod11, iACP-GAEnsC12, TargetACP14 and A CPred19) and the ensemble
approach (i.e. M LACP13, ACPred19, PTPD21, ACP-DL22, PEPred-Suite20, ACPred-FL15, ACPred-Fuse18, PPTPP23
and AntiCP_2.025) were widely used to develop ACP predictors. As summarized in a recent r eview2, we could
see that TargetACP has been developed by integrating the split amino acid composition and pseudo position-
specific scoring matrix descriptors14, which was shown to outperform SVM-based predictors8–12,19,24. In the
meanwhile, the state-of-the-art ensemble methods comprising PEPred-Suite20 and ACPred-Fuse18 provided
the highest prediction accuracies as evaluated on the dataset collected by Rao et al.18. In ACPred-Fuse, it was
developed using random forest (RF) model in conjunction with 114 feature descriptors. And then, a total of 114
RF models were trained to generate class information and probabilistic information used for developing a final
model. Most recently, Agrawal et al. proposed an updated version of AntiCP called AntiCP2.0 and also provided
two high-quality benchmark datasets (i.e. main and alternative datasets) having the largest number of pep-
tides. AntiCP2.0 was developed by extremely randomized trees (ETree) algorithm with amino acid composition
(AAC) and dipeptide composition (DPC). On the basis of independent test results reported by the prior work of
AntiCP2.0, it can be noticed that AntiCP2.0 was superior to other existing ACP predictors (e.g. A ntiCP8, iACP10,
ACPred19, ACPred-FL15, ACPred-Fuse18, PEPred-Suite20). All in all, much progress has been achieved in existing
methods. Nevertheless, two potential drawbacks of existing ACP predictors motivated us to develop a new ACP
predictor in this study. First, their interpretable mechanisms are not easily understood and implemented by the
viewpoint of biologists and biochemists. Existing ACP models do not provide a straight-forward explanation
on the underlying mechanism of the biological activity of what constitute ACPs. Meanwhile, a simple and easily
interpretable models is more useful in a further analysis of characteristics of anticancer activities of peptides.
Second, their accuracy and generalizability still require improvement.
In consideration of these problems, we propose herein the development of a novel ML-based predictor
called the iACP-FSCM for further improving the prediction accuracy as well as shedding light on characteristics
governing anticancer activities of peptides. The conceptual framework of the iACP-FSCM approach proposed
herein for predicting and analyzing ACPs is summarized in Fig. 1. The major contributions of iACP-FSCM for
predicting and characterizing ACPs can be summarized as follows. Firstly, we proposed herein a novel, flexible
scoring card method (FSCM) for effective and simple prediction and characterization of peptides affording
anticancer activity using only sequence information. The FSCM method is an updated version of the SCM
method developed by Huang et al.26 and Charoenkwan et al.27 by making use of propensity scores of both local
and global sequential information. Secondly, unlike the rather complex classification mechanisms as afforded
Scientific Reports | (2021) 11:3017 | https://doi.org/10.1038/s41598-021-82513-9 2
Vol:.(1234567890)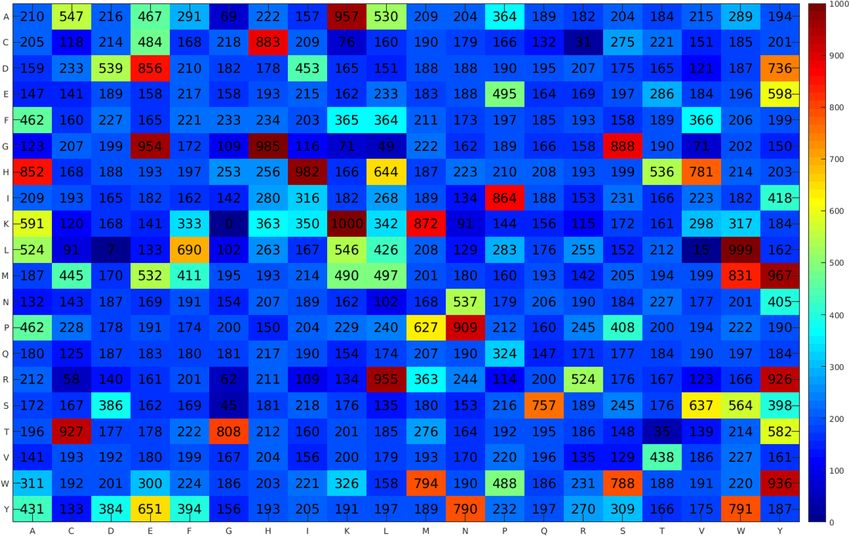
www.nature.com/scientificreports/
by state-of-the-art ensemble a pproaches15,18,20, the iACP-FSCM method proposed herein identifies ACPs using
only weighted-sum scores between the composition and propensity scores, which is easily understood and imple-
mented by biologists and biochemists. Thirdly, the FSCM-derived propensity scores can be adopted to identify
informative physicochemical properties (PCPs) that may provide crucial information pertaining to local and
global properties of ACPs. Finally, comparative results revealed that iACP-FSCM outperformed those of state-
of-the-art ACP predictors for ACP identification and characterization. The iACP-FSCM webserver presented
herein has been demonstrated to be robust as deduced from its superior prediction accuracy, interpretability
and publicly availability, which is instrumental in helping biologists in their identification of ACPs with potential
bioactivities. Furthermore, the proposed FSCM method has great potential for estimating the propensity scores
of amino acids and dipeptides that can be used to predict and analyze various bioactivities of peptides such as
haemolytic peptides28, antihypertensive p eptides29 and antiviral p
eptides20,23.
Materials and methods
Benchmark datasets. In order to make a fair comparison with existing methods, the most recent and
high-quality benchmark datasets (i.e. main and alternative datasets) collected from the work of AntiCP_2.025
were used in the development and validation of the iACP-FSCM model proposed herein. Both datasets can
be downloaded from https://webs.iiitd.edu.in/raghava/anticp2/download.php. The main dataset consists of
861 experimentally validated ACPs and 861 AMPs while the alternative dataset consists of 970 experimentally
validated 970 ACPs and 970 random peptides from protein in SwissProt. All peptides on main and alternative
datasets were unique. To avoid overestimation in the prediction model, the main and alternative dataset were
randomly divided as the training (named MAIN-TR and ALTER-TR) and independent sets (named MAIN-TS
and ALTER-TS) using the 80:20 ratio. Further details regarding the construction of the main and alternative
datasets is provided in the original work of AntiCP_2.025.
Protein feature representation. In this study, we employed 11 feature classes generated from 3 different
feature encodings using AAC, DPC and terminus compositions for representing peptide sequences as feature
vectors with fixed length. Herein, we briefly describe each feature encoding definition in forthcoming subsec-
tions.
Amino acid composition. AAC is the proportion of any amino acid in a given peptide P. AAC descriptor can
be represented as formulated by:
AAC(P) = (aac1 , aac2 , . . . , aac20 ) (1)
where aaci is the normalized composition of the ith amino acid ( aai). The dimension of AAC descriptor is 20.
Dipeptide composition. DPC is the proportion of any two adjacent amino acids (aai, aaj) in a given peptide P.
DPC descriptor can be represented as formulated by:
DPC(P) = (dpc1 , dpc2 , . . . , dpc400 ) (2)
where dpci is the normalized composition of the ith dipeptide ( dpi). The dimension of DPC descriptor is 400.
Composition on terminal region. Keeping in mind that the information on N- and C-terminus are important
in the biological activity of peptides7,8,19,30–33, we thus calculated the DPC information using the first 5, 10 and
15 residues from the N (i.e. N5, N10 and N15, respectively) and C terminus (i.e. C5, C10 and C15, respectively).
In addition, we also joined these terminus sequence and their DPC as follows: N5C5, N10C10 and N15C15. The
dimension of DPC on terminal region descriptor is 400.
Flexible scoring card method. The original SCM method uses only the global sequential information (i.e.
20 amino acids (APS) and 400 dipeptides (DPS) propensity scores) for prediction and analysis of proteins26,27.
Inspired by this method, we developed and implemented a novel flexible SCM-based method called FSCM
to further improve the prediction accuracy and interpretability by utilizing both local and global sequential
information of peptides. DPS was used to provide local sequence information as they were found to yield bet-
ter prediction performance and provide more information than APS. Particularly, the FSCM method estimated
the propensity scores of 400 dipeptides on N- (N5PS, N10PS and N15PS) and C- (C5PS, C10PS and C15PS)
terminus as well as their joint terminus sequences (N5C5PS, N10C10PS and N15C15PS). In the proposed iACP-
FSCM, we built 11 FSCM models obtained using different 11 propensity scores of amino acids, dipeptides and
dipeptide on N- and C-terminus for main and alternative dataset each. Below, we briefly describe the basic con-
cepts and the optimization procedures of C15PS on main dataset, since the other types of propensity scores can
be estimated in the same procedure without significant modifications.
Phase 1: Preparing the training (MAIN-TR) and independent (MAIN-TS) datasets for the development and
evaluation of the proposed model as described above.
Phase 2: Calculating the initial propensity score of 400 dipeptides on the first 15 residues from the C terminus
(init-C15PS). According to Charoenkwan et al.34–37, the init-C15PS is estimated, as follows:
Step 1: Computing the frequency of all 400 dipeptides found in ACP and non-ACP. For example, the frequency
of KK presented in ACP and non-ACP classes consisted of 280 and 40, respectively.
Step 2: Calculating the ratio between each dipeptide by the total number of dipeptides for ACP and non-ACP
classes. For example, the total number of dipeptides in ACP and non-ACP classes were 450 and 200, respectively.
Scientific Reports | (2021) 11:3017 | https://doi.org/10.1038/s41598-021-82513-9 3
Vol.:(0123456789)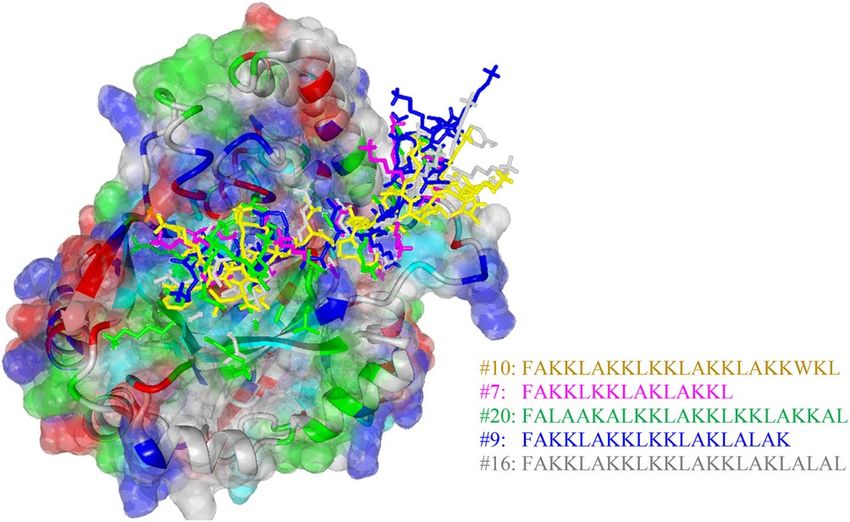
www.nature.com/scientificreports/
Therefore, normalized compositions of KK dipeptide in ACP and non-ACP classes (called NPS+ and NPS-,
respectively) were 0.622 and 0.2, respectively.
Step 3: Computing the score of each dipeptide by subtracting NPS+ from NPS-. For example, the score of DE
dipeptide is 0.422 (0.622–0.2).
Step 4: Normalizing the score of each dipeptide into the range of 0–1000.
Phase 3: Estimating the optimized propensity score of 400 dipeptides (opti-C15PS) and the threshold value
using the GA algorithm37. More details of the GA algorithm used in this study can be found in the Supplementary
information S1. To obtain the best opti-C15PS, the corresponding threshold value are subjected to the fitness
function26,27 whereby the prediction performance in terms of the AUC (W1) and the Pearson’s correlation coef-
ficient (W2) between init-C15PS and opti-C15PS are linearly combined and assessed by a tenfold cross-validation
procedure:
(3)
F opti − C15PS = W1 × AUC + W2 × R
where values of W1 and W2 are 0.9 and 0.1, respectively. Furthermore, weights for W1 and W2 were set based on
our previous studies27,34–37.
Phase 4: Computing the propensity scores of 20 amino acids using the opti-C15PS from Phase 3. Taking
Lys as an example, the propensity score for Lys is calculated by averaging the propensity scores of 40 dipeptides
containing Lys.
Phase 5: Predicting an unknown peptide (P) by using the scoring function S(P) and the opti-C15PS from
Phase 3. A query peptide P is predicted to be ACP if S(P) is greater than the threshold value, otherwise P is
predicted to be a non-ACP.
400
S(P) = DPi PSi (4)
i=1
where DPi and PSi represent the occurrence frequency and propensity score of the ith dipeptide from the opti-
C15PS, respectively, where i = 1, 2, 3, …, 400.
Phase 6: Evaluating the prediction ability of the model by using four widely used metrics for binary classifica-
tion problems consisting of accuracy (Ac), sensitivity (Sn), specificity (Sp) and Matthew’s coefficient correlation
(MCC)38,39. Receiver operating characteristic (ROC) curves were plotted to further investigate the prediction
performance of the proposed model using threshold-independent parameters. Further details on the definition
of these metrics can be found in the Supplementary data S1.
Characterization of anticancer activities of peptides. The propensity score of 20 amino acids are
informative PCPs that were employed for providing an in-depth understanding on the basis and important
factors governing the anticancer activity. Particularly, propensity scores of each amino acid reflect its influence
on the biological, functional and structural properties of peptides. It is well-known that PCPs are one of the
most intuitive feature descriptors associated with biophysical and biochemical reactions. Informative PCPs were
determined from the iACP-FSCM method according to three main steps. Firstly, PCPs having not applicable
(NA) as their amino acid indices were excluded and this resulted in a total of 531 PCPs40 that were further used
in this study. Secondly, the Pearson’s correlation coefficient (R) value between the propensity scores of amino
acids with those of 531 PCPs were calculated. Finally, PCPs with an absolute R value greater than 0.5 will be
selected as candidate PCPs for further analysis.
Reproducible research. To ensure the repeatability and reproducibility of proposed models, all codes and
the benchmark datasets (i.e. main and alternative datasets) are available on GitHub at https://github.com/Shoom
buatong/Dataset-Code/tree/master/iACP-FSCM.
Results and discussion
Performance evaluation on main dataset. In this study, we employed 11 feature classes generated
from 3 different feature encodings using AAC, DPC and terminus compositions (i.e. N5, C5, N5C5, N10, C10,
N10C10, N15, C15 and N15C15). Particularly, this led to the generation of 11 types of propensity scores (i.e.
APS, DPS, N5PS, C5PS, N5C5PS, N10PS, C10PS, N10C10PS, N15PS, C15PS and N15C15PS). To examine which
types of propensity scores are beneficial for distinguishing ACPs from non-ACPs, we performed performance
comparisons of different types of propensity scores via tenfold cross-validation and independent tests on main
dataset. For each type of propensity scores, 10 sets of propensity scores were generated by the GA algorithm and
then used in the development of 10 different FSCM classifiers. Tables 1 and 2 lists the best prediction results as
derived from optimal sets for each type of propensity scores via tenfold cross-validation and independent tests,
respectively (Fig. 2).
As can be seen from Table 1 and Supplementary Table S1, the best Ac of 0.754 with an MCC of 0.496 and
AUC of 0.762 was achieved by using C15PS (Fig. 3A). Meanwhile, the use of N5C5PS and N5PS performed
well with correspondingly second and third highest Ac/MCC of 0.750/0.508 and 0.750/0.504, respectively. As
noticed in Table 1, the performance of the widely used DPS (affording an Ac of 0.726 and AUC of 0.754) was
comparable to that of the C15PS with regards to all of the five evaluation indices. In the case of independent test
results, Table 2 showed that the C15PS also achieved better performance than other types of propensity scores
and provided an Ac of 0.825 and an MCC of 0.646 (Fig. 3B). In the meanwhile, N15C15PS and N15PS performed
well with the second and third highest independent test with Ac of 0.796 and 0.783, respectively. Hence, we
Scientific Reports | (2021) 11:3017 | https://doi.org/10.1038/s41598-021-82513-9 4
Vol:.(1234567890)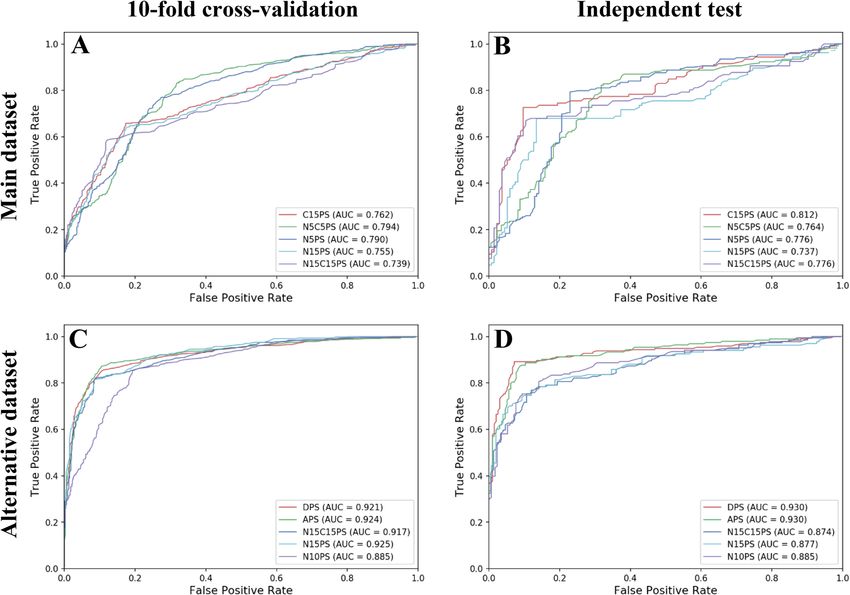
www.nature.com/scientificreports/
Method Threshold Fitness score Ac Sn Sp MCC AUC
APS 399 0.742 0.668 0.624 0.711 0.338 0.686
DPS 285 0.420 0.726 0.675 0.778 0.456 0.754
N5PS 218 0.660 0.752 0.794 0.710 0.507 0.791
C5PS 266 0.566 0.710 0.715 0.705 0.421 0.729
N5C5PS 224 0.568 0.750 0.831 0.671 0.508 0.794
N10PS 219 0.429 0.736 0.733 0.739 0.473 0.771
C10PS 248 0.444 0.739 0.739 0.739 0.480 0.766
N10C10PS 225 0.482 0.732 0.728 0.736 0.465 0.764
N15PS 394 0.478 0.746 0.638 0.829 0.480 0.755
C15PS 311 0.401 0.754 0.656 0.829 0.496 0.762
N15C15PS 394 0.424 0.743 0.570 0.877 0.478 0.739
Table 1. Cross-validation results of FSCM models with various types of sequence features as evaluated on the
main dataset.
Method Threshold Fitness score Ac Sn Sp MCC AUC
APS 399 0.742 0.701 0.669 0.733 0.402 0.706
DPS 285 0.420 0.773 0.744 0.802 0.547 0.786
N5PS 218 0.660 0.726 0.763 0.688 0.453 0.791
C5PS 266 0.566 0.740 0.763 0.718 0.481 0.762
N5C5PS 224 0.568 0.752 0.822 0.682 0.510 0.764
N10PS 219 0.429 0.762 0.758 0.766 0.524 0.756
C10PS 248 0.444 0.749 0.770 0.728 0.499 0.769
N10C10PS 225 0.482 0.771 0.764 0.778 0.542 0.744
N15PS 394 0.478 0.783 0.679 0.866 0.559 0.737
C15PS 311 0.401 0.825 0.726 0.903 0.646 0.812
N15C15PS 394 0.424 0.796 0.670 0.896 0.587 0.776
Table 2. Independent test results of FSCM models with various types of sequence features as evaluated on the
main dataset.
selected the FSCM-based classifier in conjunction with propensity scores of 400 dipeptides on the C15 terminus
(C15PS) as the optimal classifier for ACP identification using the main dataset. These results implied that the
local sequential information plays a crucial role in distinguishing ACPs from non-ACPs than that of the global
sequential information.
Performance evaluation on alternative dataset. In this section, the same experimental setting as
those used in the main dataset (from the original work from which it was taken) was utilized to determine which
types of propensity scores were the most effective for distinguishing ACPs from random peptides in the alter-
native dataset. A series of performance comparison experiments using various types of propensity scores was
carried out and their results were compared via a tenfold cross-validation and independent test as summarized
in Tables 3 and 4.
From Table 3, it could be seen that the model affording the highest Ac had a value of 0.884 with a corre-
sponding MCC of 0.770 and an AUC of 0.924 that was achieved using APS (Fig. 3C), while models affording
the second and third highest Ac had values of 0.872 and 0.867, respectively, which were obtained using DPS and
N15C15PS, respectively. As for results from the independent test (Table 2), both APS and DPS were amongst the
2 top-ranked classifiers also having the highest prediction results. Furthermore, it was found that DPS achieved
slightly better performances than APS (0.910 vs 0.889 for Ac and 0.820 vs 0.779 for MCC). In the meanwhile, APS
was found to achieve very comparable than that of the DPS feature as deduced from the AUC value (Fig. 3D).
Hence, we selected the FSCM-based classifier in conjunction with the propensity scores of 20 amino acids from
the whole sequence (APS) as the optimal classifier for ACP identification on alternative dataset. For convenience,
the FSCM method in conjunction with the selected propensity scores (C15PS and APS for main and alternative
datasets, respectively) will be referred to as the iACP-FSCM. Based on the observations described above, it could
be demonstrated that the iACP-FSCM could provide the satisfied results for both main and alternative datasets
because the composition information on ACPs influenced the interaction on cancer cell membrane, penetration
the cell membrane, and then cancer cell cytotoxicity via their physicochemical properties (e.g. amphipathicity,
hydrophobicity, and secondary structures)1.
Scientific Reports | (2021) 11:3017 | https://doi.org/10.1038/s41598-021-82513-9 5
Vol.:(0123456789)www.nature.com/scientificreports/
Figure 2. Heatmap of amino acids propensity scores obtained from the proposed iACP-FSCM.
Comparisons of iACP‑FSCM with existing methods. To further assess the predictive efficiency and
effectiveness of the proposed iACP-FSCM, we compared its performances against existing methods on the same
benchmark dataset. Table 5 lists performance comparisons of iACP-FSCM with existing methods on main and
alternative datasets over independent test. The prediction results of existing methods (i.e. A ntiCP8, iACP10,
ACPred19, PEPred-Suite20, ACPred-FL15, ACPred-Fuse18 and AntiCP_2.025) recorded in Table 5 come directly
from the work25.
By observing the results listed in Table 5, it is clearly that the performance of iACP-FSCM is superior to that
of existing methods with the highest Ac (0.825), Sp (0.903) and MCC (0.646). Improvements of 7%, 17% and
14% for Ac, Sp and MCC on main dataset, respectively, were observed when compared with the state-of-the-art
method AntiCP_2.0. In addition, iACP-FSCM achieved a greater than 14% increase in Ac compared with the
existing ensemble methods containing PEPred-Suite, ACPred-FL and ACPred-Fuse. Although, AntiCP and
ACPred were higher Sn values than the proposed iACP-FSCM, the corresponding Sp and MCC were significantly
lower. In case of the comparative results on alternative dataset, we noticed that AntiCP_2.0 provided the high-
est accuracy of 0.920 with an MCC of 0.840 (Table S3). Meanwhile, the second- and third-best ACP predictors
(Ac, MCC) were obtained from AntiCP (0.900, 0.800) and iACP-FSCM (0.889, 0.779), respectively. Although,
AntiCP_2.0 obtained better prediction results than our proposed iACP-FSCM, AntiCP_2.0 is limited in terms of
interpretability and practical utility for biologists and biochemists. On the other hand, the iACP-FSCM provides
the propensity scores that might provide the crucial information relating to local and global properties of ACPs,
which is easily understood and implemented. Furthermore, the interpretability of the proposed iACP-FSCM
with impressive prediction performance is a more useful and practical approach. Taken together, these results
revealed that iACP-FSCM provided more impressive prediction performances on both main and alternative
datasets in terms of simplicity, interpretability and generalizability.
Characterization of anticancer activities of peptides using propensity scores. Unlike black-box
modeling methods such as SVM and ensemble methods, the advantage of iACP-FSCM are that the estimated
propensity scores of amino acids and dipeptides derived from the FSCM method could easily identify informa-
tive PCPs for gaining a more in-depth understanding on the characteristics of anticancer activities peptides. The
propensity scores of 20 amino acids to be ACPs derived from the DPS (Fig. 2) are recorded in Table 6, which
were calculated using Matlab (R2020a). The five amino acids with the highest propensity scores contained Tyr,
Trp, His, Met and Lys (355.55, 328.60, 317.03, 311.58 and 296.78, respectively), whereas the five amino acids with
the lowest propensity scores contained Gln, Val, Gly, Cys and Arg (198.45, 212.55, 225.08, 226.38 and 229.63,
respectively). In case of the propensity scores of 400 dipeptides to be ACPs, Fig. 2 shows that the five top-ranked
Scientific Reports | (2021) 11:3017 | https://doi.org/10.1038/s41598-021-82513-9 6
Vol:.(1234567890)www.nature.com/scientificreports/
Figure 3. ROC curves of top-five types of propensity scores over tenfold cross-validation (A,C) and
independent test (B,D) on main (A,B) and (C,D) alternative dataset.
Method Threshold Fitness score Ac Sn Sp MCC AUC
APS 418 0.942 0.884 0.870 0.898 0.770 0.924
DPS 198 0.626 0.872 0.852 0.893 0.746 0.921
N5PS 178 0.910 0.823 0.806 0.841 0.649 0.873
C5PS 111 0.947 0.786 0.836 0.736 0.576 0.858
N5C5PS 201 0.943 0.819 0.794 0.845 0.640 0.880
N10PS 199 0.840 0.834 0.858 0.809 0.669 0.885
C10PS 171 0.859 0.795 0.789 0.802 0.592 0.863
N10C10PS 195 0.860 0.831 0.855 0.805 0.662 0.890
N15PS 228 0.853 0.865 0.807 0.912 0.727 0.925
C15PS 161 0.821 0.798 0.777 0.818 0.596 0.864
N15C15PS 234 0.871 0.867 0.815 0.909 0.731 0.917
Table 3. Cross-validation results of FSCM models with various types of sequence features as evaluated on the
alternative dataset.
dipeptides with the highest propensity scores contained KK, LW, GH, HI and MY, whereas the five top-ranked
dipeptides with the lowest propensity scores contained KG, LD, LV, CR and TT.
In biological process, cancer cell development is mostly caused by free radicals damaged on cells via ionizing
radiation mechanism, especially DNA damage5. Meanwhile, reactive oxygen species can promote cancer, growth
arrest, cytotoxicity and irreversible damage. The amino acid composition on ACPs can act as antioxidant and
dietary source of the cells4. Interestingly, the five amino acids with the highest propensity scores were reported as
the important factor for the antioxidant activity. Because electron-rich aromatic rings in side chains of Tyr and
Trp, sulfur atoms with two lone electron pairs in side chains of Met, and nitrogen atoms with one lone electron
in side chain of His are easily oxidized41. Among anti-oxidative amino acids, Trp is low abundant in natural
peptides, but, it is crucial role of biomolecule activity and easy chemical modification42. Although, His is one of
Scientific Reports | (2021) 11:3017 | https://doi.org/10.1038/s41598-021-82513-9 7
Vol.:(0123456789)www.nature.com/scientificreports/
Method Threshold Fitness score Ac Sn Sp MCC AUC
APS 418 0.942 0.889 0.876 0.902 0.779 0.930
DPS 198 0.626 0.910 0.892 0.928 0.820 0.930
N5PS 178 0.910 0.796 0.756 0.838 0.596 0.867
C5PS 111 0.947 0.725 0.756 0.692 0.450 0.807
N5C5PS 201 0.943 0.791 0.751 0.832 0.585 0.858
N10PS 199 0.840 0.829 0.812 0.847 0.658 0.885
C10PS 171 0.859 0.787 0.812 0.759 0.572 0.854
N10C10PS 195 0.860 0.829 0.828 0.829 0.657 0.876
N15PS 228 0.853 0.824 0.769 0.873 0.647 0.877
C15PS 161 0.821 0.807 0.778 0.835 0.614 0.864
N15C15PS 234 0.871 0.827 0.769 0.880 0.655 0.874
Table 4. Independent test results of FSCM models with various types of sequence features as evaluated on the
alternative dataset.
Main dataset Alternative dataset
Methodsa Ac Sn Sp MCC Ac Sn Sp MCC
AntiCP 0.506 1.000 0.012 0.070 0.900 0.897 0.902 0.800
iACP 0.551 0.779 0.322 0.110 0.776 0.784 0.768 0.550
ACPred 0.535 0.856 0.214 0.090 0.853 0.871 0.835 0.710
PEPred-Suite 0.535 0.331 0.738 0.080 0.575 0.402 0.747 0.160
ACPred-FL 0.448 0.671 0.225 -0.120 0.438 0.602 0.256 -0.150
ACPred-Fuse 0.689 0.692 0.686 0.380 0.789 0.644 0.933 0.600
AntiCP_2.0 0.754 0.775 0.734 0.510 0.920 0.923 0.918 0.840
iACP-FSCM 0.825 0.726 0.903 0.646 0.889 0.876 0.902 0.779
Table 5. Independent test results of the proposed method ACPred-FSCM with state-of-the-art methods as
evaluated on main and alternative datasets. a Results obtained from the published findings of AntiCP_2.025.
Amino acid PS- DPPVI (rank) MITS020101a (rank) QIAN880113b (rank) JOND750101c (rank)
Y-Tyr 355.55 (1) 5.06 (2) 0 (9) 2.67 (5)
W-Trp 328.60 (2) 6.93 (1) 0.36 (2) 3.77 (1)
H-His 317.03 (3) 1.45 (5) 0.29 (3) 0.87 (12)
M-Met 311.58 (4) 0 (15) 0.11 (5) 1.67 (8)
K-Lys 296.78 (5) 3.67 (3) 0.45 (1) 1.64 (9)
A-Ala 295.15 (6) 0 (8) − 0.08 (11) 0.87 (11)
L-Leu 288.23 (7) 0 (14) 0.28 (4) 2.17 (6)
P-Pro 276.55 (8) 0 (17) − 0.42 (20) 2.77 (4)
E-Glu 272.83 (9) 1.27 (6) − 0.19 (15) 0.67 (14)
S-Ser 268.65 (10) 0 (18) 0.07 (6) 0.07 (18)
I-Ile 247.03 (11) 0 (13) − 0.01 (10) 3.15 (2)
D-Asp 244.80 (12) 0 (10) − 0.24 (16) 0.66 (15)
F-Phe 243.43 (13) 0 (11) 0 (8) 2.87 (3)
T-Thr 242.05 (14) 0 (19) − 0.33 (19) 0.07 (19)
N-Asn 232.70 (15) 0 (16) − 0.08 (12) 0.09 (17)
R-Arg 229.63 (16) 2.45 (4) 0.05 (7) 0.85 (13)
C-Cys 226.38 (17) 0 (9) − 0.25 (17) 1.52 (10)
G-Gly 225.08 (18) 0 (12) − 0.1 (13) 0.1 (16)
V-Val 212.55 (19) 0 (20) − 0.13 (14) 1.87 (7)
Q-Gln 198.45 (20) 1.25 (7) − 0.28 (18) 0 (20)
Correlation (R) 1.000 0.577 0.569 0.541
Table 6. Important physicochemical properties (PCPs) as derived from the iACP-FSCM.
a
MITS020101 = Amphiphilicity index (Mitaku et al., 2002). b QIAN880113 = Weights for alpha-helix at the
window position of 6 (Qian-Sejnowski, 1988). c JOND750101 = Hydrophobicity (Jones, 1975).
Scientific Reports | (2021) 11:3017 | https://doi.org/10.1038/s41598-021-82513-9 8
Vol:.(1234567890)www.nature.com/scientificreports/
the five top-ranked amino acids, His-containing dipeptides such as GH and HI, had no anticancer activity in
in vitro study. Furthermore, AH and LH showed antiangiogenic activity without great anticancer potential in
zebrafish embryo model43.
It is well recognized that cancer metabolism has focused on glycolysis and tricarboxylic acid (TCA) cycle.
Many cancer cells are highly dependent on Gln and Ser uptake for a proliferation and these two amino acids are
the most highly consumed nutrients44. Choi and Coloff proposed that Gln serves as anaplerosis metabolite and
plays a crucial role in the TCA cycle to maintain mitochondrial ATP production45. Meanwhile, the tumor’s evolu-
tion utilizes Gln, as alternative fuels to optimize a nutrient utilization. Similarly, Val, which is one of branched-
chain amino acid, can fuel in the TCA c ycle46. Gln and Gly, which provide essential carbon and nitrogen sources
for the nucleobase synthesis, are beneficial in the energy-consuming process via DNA/RNA synthesis in cells47.
Although, Gly is one of the five top-ranked amino acids having lowest propensity scores, dipeptide containing
Gly or Pro performed good cytotoxicity in vitro tumor human cell lines such as A549 lung cancer cell line48. After
analyzing the FSCM-derived propensity scores, these results suggest that amino acids having high propensity
scores could be important in exhibiting the anticancer activity via the oxidation protection process, while amino
acids having low propensity scores could be important in serving as dietary source of the cancer cells as well as
provide a contradictory effect on anticancer activity.
Characterization of anticancer activities using informative physicochemical properties. In
this section, the iACP-FSCM method was utilized to provide a more in-depth understanding of the basis
and important factors for the anticancer activity. In the previous studies, the physicochemical properties (i.e.
amino acid sequence, length, net charge, secondary structure, amphipathicity, and hydrophobicity) of peptides
play crucial role in their hemolytic activity, penetration ability and anticancer/antitumor activity1,19,49–52. The
three importantly selected PCPs derived from iACP-FSCM consist of MITS020101 (Amphiphilicity index),
QIAN88011 (Weights for alpha-helix at the window position of 6) and JOND750101 (Hydrophobicity) were
showed in Table 6. In addition, Supplementary Table S4 presents further details of the top-twenty informative
PCPs.
It is well-known that Trp with a propensity score of 328.20 is a common amino acid in amphiphilicity, alpha-
helix, and hydrophobicity. Lee et al. investigated the relationship between the anticancer activities of Pep27
analogues and their hemolytic activity and hydrophobicity. They found that Pep27 analogue peptides substituting
with Trp was increased hydrophobicity based on the RP-HPLC retention time. The substitutions of (11Ser → Trp)
and (13Qln → Trp) in Pep27anal2 had the greatest hydrophobicity with a RP-HPLC retention time of 22.50 min
as well as exhibited the most anticancer activity with the IC50 (10–28 μM) and IC90 (35–55 μM) in five cancer
cell lines41. This observation was quite consistent with the previous work o f53,54, implying that end-capping and
cyclization of hexameric peptide sequences of RRWQWR and RRWWRF or end-tagging of short peptides KNK10
(KNKGKKNGKH) and GKH17 (GKHKNKGKKNGKHNGWK) with hydrophobic Trp or Phe stretches could
enhance the stability of ACPs and against proteolytic degradation.
Table 6 shows that Lys, His and Arg (i.e. the cationic amino acids) provide acceptable propensity scores for
both amphiphilicity index (MITS020101) and alpha-helix (QIAN88011) properties. These three amino acids are
described by the amphipathic alpha-helical structure transformation that segregates Lys on one face and Ile on the
opposite side to interact with the negatively-charged membrane that consequently gives rise to high anticancer
activity53,55. Furthermore, the octahistidine-octaarginine ( H8R8) peptide is a common cationic cell penetrating
peptide with endosomal escape capabilities. The modified H8R8 as a lipid-modified cationic peptide (i.e. stearyl-
H8R8 and vitamin E succinate-H8R8) with the functions of amphiphilic, biodegradable and lipid structure, can
increase reactive oxygen species production, reduce cell bioenergetics and drug efflux, trigger apoptosis and
G1 cell cycle arrest, and mitochondria depolarization thereby leading to cancer cell toxicity and d eath56. Owing
to the fact that the indole side chains of Trp exhibits a preference to interact with the interfacial region of lipid
bilayers while Lys and Arg side chains on peptides provide positive charges and hydrogen bonding capabilities
to attract negatively-charged phospholipid headgroups of cell m embranes54,57,58. Furthermore, side chains of
aromatic residues (i.e. Trp and Phe) in which one side of the backbone ring forms a hydrophobic face to engage
in interaction with the micelle6. Such interaction between ACPs containing Trp, Phe, Lys, His, or Arg and cancer
cell membranes are often found in situations of cancer cell eradication. The aforementioned results as obtained
from iACP-FSCM are in accordance with previous s tudies6,53–59 in which physicochemical properties of ACPs
(i.e. amphiphilicity, helical structure and hydrophobicity) pertains to the interaction between ACPs and the cell
surface. This interaction causes ACPs to transform into a helical structure to confer the spatial arrangement of
aliphatic side chains for membrane insertion. The turn stabilization of the helical conformation promotes the
intra-chain hydrogen-bonding and mediates the backbone hydrophobicity thereby causing a deeper insertion
of peptides into the lipid b ilayer59.
Case study. A key advantage of iACP-FSCM is its interpretability to biologists in which mechanistic insights
into the origin of anticancer activity of investigated ACPs as deduced from the scoring function S(P) for ACPs
that have not yet been experimentally verified26,27,37. The top 20 peptides with the highest and lowest scores
are reported in Supplementary Tables S5 and S6, respectively. We noticed that scores for the top 20 ACPs with
the highest ACP scores (S(P)) were in ranges of 636.59–700.64 whereby the threshold value was 311 (Table 1).
Interestingly, the peptide sequence of KAKLF having an ACP score of 645 was found in the top 9 peptides hav-
ing a high docking score of -29.75 kJ/mol towards the hypoxia inducible factor 1α (HIF-1α) as reported in the
previous study60.
Inspired by this s tudy60, the top 20 ACPs (ID: 1–20) derived from the iACP-FSCM were then docked with
the predicted binding sites of HIF-1α in order to estimate their interaction energies (kcal/mol) for finding a new
Scientific Reports | (2021) 11:3017 | https://doi.org/10.1038/s41598-021-82513-9 9
Vol.:(0123456789)www.nature.com/scientificreports/
Figure 4. Three-dimensional complex structure of the top 5 ACPs having maximum interaction energies. The
binding pocket was colored according to residue type by YASARA coloring scheme, where grey, green, blue, red
and cyan colors represent non-polar, amidic, basic, acidic hydroxylic amino acids, respectively.
potential peptide-based drug for HIF-1α. In order to make a fair comparison, the same experimental setup was
used for estimating interaction energies of the top 9 ACPs as proposed by the previous study60. In this study,
HIF-1α was prepared for docking using the protein preparation features in the Chimera software, which was
performed using the default protocol for PDB2PQR and Dock Prep. Protonation states were assigned using
PROPKA at a pH of 7.0 and Gasteiger charges were assigned to the protein61. Protein-peptide similarity-based
docking was performed using the GalaxyPepDock web server (http://galaxy.seoklab.org/pepdock) by utilizing
the information provided by the database to perform the docking procedure that entails the search for suitable
templates from a database of experimentally determined structures and building models using the energy-based
optimization method that allows for structural flexibility. The calculation of protein-peptide binding and interac-
tion energy were performed using the NOVA force field62 while the visualization of the structures was carried
out using YASARA (Yet Another Scientific Artificial Reality Application; http://www.yasara.org/index.html) .
The three-dimensional complexed structure for the top 5 potential ACPs is provided in Fig. 4 while the inter-
action energy scores are listed in Table 7 and it was found that values ranged from -9.39 kcal/mol to -6.53 kcal/
mol (i.e. consisting of peptides ID 10, 7, 20, 9 and 16). Particularly, the peptide sequence, ACP score and their
corresponding interaction energy (i.e. as reported in parenthesis) for peptides ID 10, 7, 20, 9 and 16 are as follows:
(FAKKLAKKLKKLAKKLAKKWKL, 655.29, − 9.39), (FAKKLKKLAKLAKKL, 663.93, − 8.71), (FALAAKALK-
KLAKKLKKLAKKAL, 636.59, − 7.21), (FAKKLAKKLKKLAKLALAK, 657.22, − 6.73) and (FAKKLAKKLK-
KLAKKLAKLALAL, 646.64, − 6.53), respectively. A visualization of the molecular surface of peptide ID: 10
(peptide sequence FAKKLAKKLKKLAKKLAKKWKL) that was found to exhibit maximal interaction energy
of − 9.39 kcal/mol (i.e. and within 3 Å distance) with the HIF-1α receptor is depicted in Fig. 5. As seen from
Table 5, the interaction energies of ACPs ID: 21–29 are ranging from − 4.81 kcal/mol to 11.98 kcal/mol. Amongst
the 9 ACPs as reported by a previous study60, peptide ID: 25 (i.e. having a peptide sequence KAKLF) displayed
the highest interaction energy score of − 4.81 kcal/mol with the HIF-1α receptor. These results indicated that
peptide ID: 10 as derived from this study is a promising ACP with promising potential against breast cancer
when compared to peptide ID: 10 as proposed by the previous s tudy60. However, additional in vitro and in vivo
approaches will be needed for further development of novel ACPs against breast cancer. It is highly anticipated
that iACP-FSCM can serve as an important tool for the rapid screening of promising ACPs against breast cancer
as well as other types of cancer cell prior to their synthesis.
Conclusions
In this study, we have proposed for the first time a computational model called the iACP-FSCM for ACP iden-
tification and characterization via the use of propensity scores of local and global sequential information as
obtained using the novel FSCM method. It was demonstrated that the iACP-FSCM could easily identify ACPs
using only a weighted-sum score and a single threshold value. This was compared with the complex ensemble
classifiers as developed using a large number of ML classifiers and feature descriptor schemes. Furthermore, the
FSCM-derived propensity scores can be adopted to identify informative physicochemical properties that might
provide crucial information relating to local and global properties of ACPs. Results from the benchmarked com-
parison validated the effectiveness and robustness of the proposed iACP-FSCM approach. We further applied the
iACP-FSCM to identify potential peptide-based drugs against HIF-1α and obtained a list of potential peptides
against HIF-1α. With these promising results, it is highly anticipated that iACP-FSCM can serve as an important
tool for the rapid screening of promising ACPs against various types of cancer cells prior to their synthesis. In
order to develop a convenient bioinformatics tool, the proposed model is deployed as a web server that is made
publicly available at http://camt.pythonanywhere.com/iACP-FSCM. Owing to the high potential of the FSCM
method as proposed in this study, the method could be easily applied for predicting and characterizing other
therapeutic peptides without any major modifications, such as cell-penetrating p eptides63, antiviral p
eptides20,23
and predicting antihypertensive20,23, hemolytic peptide31.
Scientific Reports | (2021) 11:3017 | https://doi.org/10.1038/s41598-021-82513-9 10
Vol:.(1234567890)www.nature.com/scientificreports/
ID Peptide sequence ACP Scorec Interaction Energy d
a
1 FALAKKALKKAKKAL 700.64 − 3.69
2 FAKKLAKKLKKLAKKLAKa 692.71 3.94
3 FAKKLAKKLAKALa 682.17 2.10
4 FAKKLAKKLKKLAKKLAKLAKKLa 679.14 − 1.95
5 FAKKLAKLAKKLa 673.36 − 2.04
6 FAKKLAKLAKKLAKALa 667.27 0.21
7 FAKKLKKLAKLAKKLa 663.93 − 8.71
8 FAKKLAKLAKKALALa 660.00 − 2.58
9 FAKKLAKKLKKLAKLALAKa 657.22 − 6.73
10 FAKKLAKKLKKLAKKLAKKWKLa 655.29 − 9.39
11 FAKLWAKLAKKLa 653.91 − 5.58
12 FALAKLAKKAKAKLKKALKALa 653.40 − 2.58
13 FAKKLAKKLAKLLa 652.75 1.59
14 FAKKLAKKLAKLALa 650.85 − 2.75
15 FAKLLAKLAKKa 649.10 − 4.52
16 FAKKLAKKLKKLAKKLAKLALALa 646.64 − 6.53
17 KAKLFa 645.00 − 4.81
18 FAKKALKALKKLa 645.00 0.00
19 FAKKLAKLAKKLAKLALa 642.75 − 4.92
20 FALAAKALKKLAKKLKKLAKKALa 636.59 − 7.21
21 FALALKAb 530.50 − 2.96
22 RYLGYLb 314.40 − 2.01
23 FALAb N/A 0.17
24 FAKLAb 571.25 3.29
25 KAKLFb 645.00 − 4.81
26 ERRPb 269.00 11.98
27 WALALb 473.75 − 1.69
28 MTLTGb 349.75 − 0.44
31 KWKLFb N/A − 4.60
Table 7. Top 20 ACPs having high score derived from iACP-FSCM and top 9 ACPs having maximum
docking scores derived from the work53 along with their ACP scores and interaction energies. a The peptide
sequences are the top 20 ACPs having high score derived from iACP-FSCM derived from this study. b The
peptide sequences are the top 9 ACPs having maximum docking interactions scores derived from the w ork53.
c
ACP scores are calculated using the scoring function S(P) and N/A means that the peptide is not found in the
benchmark dataset. d Interaction Energy is Interaction Energy Yasara Nova Force Field (kcal/mol).
Figure 5. Molecular surface of docking complex between the HIF-1α receptor (left) and the peptide ID: 10
(right), in stick model, where amino acids in 3 Å binding, where Phe, Ala, Leu and Trp are non-polar residues
(grey) and Lysis basic residue (blue).
Scientific Reports | (2021) 11:3017 | https://doi.org/10.1038/s41598-021-82513-9 11
Vol.:(0123456789)www.nature.com/scientificreports/
Received: 12 October 2020; Accepted: 18 January 2021
References
1. Chiangjong, W., Chutipongtanate, S. & Hongeng, S. Anticancer peptide: Physicochemical property, functional aspect and trend
in clinical application. Int. J. Oncol. 57(3), 678–696 (2020).
2. Basith, S., Manavalan, B., Hwan Shin, T., & Lee, G. Machine intelligence in peptide therapeutics: A next‐generation tool for rapid
disease screening. Med. Res. Rev. (2020).
3. Shoombuatong, W., Schaduangrat, N. & Nantasenamat, C. Unraveling the bioactivity of anticancer peptides as deduced from
machine learning. EXCLI J. 17, 734 (2018).
4. Marquez-Rios, E. & Del-Toro-Sanchez, C. L. Antioxidant peptides from terrestrial and aquatic plants against cancer. Curr. Protein
Pept. Sci. 19(4), 368–379 (2018).
5. Klaunig, J. E. Oxidative stress and cancer. Curr. Pharm. Des. 24(40), 4771–4778 (2018).
6. Cardell, R.R., Jr. Subcellular alterations in rat liver following hypophysectomy. Biochimica et Biophysica Acta (BBA)-General Subjects
148(2), 539–552 (1967).
7. Gautam, A. et al. In silico approaches for designing highly effective cell penetrating peptides. J. Transl. Med. 11(1), 74 (2013).
8. Tyagi, A. et al. In silico models for designing and discovering novel anticancer peptides. Sci. Rep. 3, 2984 (2013).
9. Hajisharifi, Z., Piryaiee, M., Beigi, M. M., Behbahani, M. & Mohabatkar, H. Predicting anticancer peptides with Chou’s pseudo
amino acid composition and investigating their mutagenicity via Ames test. J. Theor. Biol. 341, 34–40 (2014).
10. Chen, W., Ding, H., Feng, P., Lin, H. & Chou, K.-C. iACP: a sequence-based tool for identifying anticancer peptides. Oncotarget
7(13), 16895 (2016).
11. Li, F.-M. & Wang, X.-Q. Identifying anticancer peptides by using improved hybrid compositions. Sci. Rep. 6, 33910 (2016).
12. Akbar, S., Hayat, M., Iqbal, M. & Jan, M. A. iACP-GAEnsC: Evolutionary genetic algorithm based ensemble classification of
anticancer peptides by utilizing hybrid feature space. Artif. Intell. Med. 79, 62–70 (2017).
13. Manavalan, B. et al. MLACP: machine-learning-based prediction of anticancer peptides. Oncotarget 8(44), 77121 (2017).
14. Kabir, M. et al. Intelligent computational method for discrimination of anticancer peptides by incorporating sequential and evo-
lutionary profiles information. Chemometr. Intell. Lab. Syst. 182, 158–165 (2018).
15. Wei, L., Zhou, C., Chen, H., Song, J. & Su, R. ACPred-FL: a sequence-based predictor using effective feature representation to
improve the prediction of anti-cancer peptides. Bioinformatics 34(23), 4007–4016 (2018).
16. Xu, L., Liang, G., Wang, L. & Liao, C. A novel hybrid sequence-based model for identifying anticancer peptides. Genes 9(3), 158
(2018).
17. Boopathi, V. et al. mACPpred: A support vector machine-based meta-predictor for identification of anticancer peptides. Int. J.
Mol. Sci. 20(8), 1964 (2019).
18. Rao, B., Zhou, C., Zhang, G., Su, R., & Wei, L. ACPred-Fuse: fusing multi-view information improves the prediction of anticancer
peptides. Brief. Bioinf. (2019).
19. Schaduangrat, N., Nantasenamat, C., Prachayasittikul, V. & Shoombuatong, W. ACPred: a computational tool for the prediction
and analysis of anticancer peptides. Molecules 24(10), 1973 (2019).
20. Wei, L., Zhou, C., Su, R. & Zou, Q. PEPred-Suite: improved and robust prediction of therapeutic peptides using adaptive feature
representation learning. Bioinformatics 35(21), 4272–4280 (2019).
21. Wu, C., Gao, R., Zhang, Y. & De Marinis, Y. PTPD: predicting therapeutic peptides by deep learning and word2vec. BMC Bioinf.
20(1), 1–8 (2019).
22. Yi, H.-C. et al. ACP-DL: a deep learning long short-term memory model to predict anticancer peptides using high-efficiency
feature representation. Mol. Ther. Nucleic Acids 17, 1–9 (2019).
23. Zhang, Y. P., & Zou, Q. PPTPP: A novel therapeutic peptide prediction method using physicochemical property encoding and
adaptive feature representation learning. Bioinformatics (2020).
24. Vijayakumar, S. & Lakshmi, P. ACPP: A web server for prediction and design of anti-cancer peptides. Int. J. Pept. Res. Ther. 21(1),
99–106 (2015).
25. Agrawal, P., Bhagat, D., Mahalwal, M., Sharma, N., & Raghava, G. P. S. AntiCP 2.0: an updated model for predicting anticancer
peptides. Brief. Bioinf. (2020).
26. Huang, H.-L. et al. Prediction and analysis of protein solubility using a novel scoring card method with dipeptide composition.
BMC Bioinf. 13(S17), S3 (2012).
27. Charoenkwan, P. et al. SCMCRYS: predicting protein crystallization using an ensemble scoring card method with estimating
propensity scores of P-collocated amino acid pairs. PLoS ONE 8(9), e72368 (2013).
28. Win, T. S. et al. HemoPred: a web server for predicting the hemolytic activity of peptides. Future Med. Chem. 9(3), 275–291 (2017).
29. Win, T. S., Schaduangrat, N., Prachayasittikul, V., Nantasenamat, C. & Shoombuatong, W. PAAP: A web server for predicting
antihypertensive activity of peptides. Future Med. Chem. 10(15), 1749–1767 (2018).
30. Laengsri, V. et al. TargetAntiAngio: A sequence-based tool for the prediction and analysis of anti-angiogenic peptides. Int. J. Mol.
Sci. 20(12), 2950 (2019).
31. Hasan, M. M. et al. HLPpred-Fuse: Improved and robust prediction of hemolytic peptide and its activity by fusing multiple feature
representation. Bioinformatics 36(11), 3350–3356 (2020).
32. Ramaprasad, A. S. E., Singh, S. & Venkatesan, S. AntiAngioPred: a server for prediction of anti-angiogenic peptides. PLoS ONE
10(9), e0136990 (2015).
33. Gupta, S. et al. In silico approach for predicting toxicity of peptides and proteins. PLoS ONE 8(9), e73957 (2013).
34. Charoenkwan, P., Kanthawong, S., Nantasenamat, C., Hasan, M. M. & Shoombuatong, W. iDPPIV-SCM: A sequence-based predic-
tor for identifying and analyzing dipeptidyl peptidase IV (DPP-IV) inhibitory peptides using a scoring card method. J. Proteome
Res. 19(10), 4125–4136 (2020).
35. Charoenkwan, P., Kanthawong, S., Schaduangrat, N., Yana, J. & Shoombuatong, W. PVPred-SCM: improved prediction and analysis
of phage virion proteins using a scoring card method. Cells 9(2), 353 (2020).
36. Charoenkwan, P., Yana, J., Nantasenamat, C., Hasan, M. M., & Shoombuatong, W. iUmami-SCM: A novel sequence-based predic-
tor for prediction and analysis of umami peptides using a scoring card method with propensity scores of dipeptides. J. Chem. Inf.
Model. (2020).
37. Charoenkwan, P., Yana, J., Schaduangrat, N., Nantasenamat, C., Hasan, M. M., & Shoombuatong, W. iBitter-SCM: identification
and characterization of bitter peptides using a scoring card method with propensity scores of dipeptides. Genomics (2020).
38. Hasan, M. M., Khatun, M. S., & Kurata, H. iLBE for computational identification of linear B-cell epitopes by integrating sequence
and evolutionary features. Genom. Proteom. Bioinf. (2020).
39. Khatun, M. S., Hasan, M. M., Shoombuatong, W. & Kurata, H. ProIn-Fuse: improved and robust prediction of proinflammatory
peptides by fusing of multiple feature representations. J. Comput. Aided Mol. Des. 34(12), 1229–1236 (2020).
40. Kawashima, S. & Kanehisa, M. AAindex: amino acid index database. Nucleic Acids Res. 28(1), 374–374 (2000).
41. Xu, N., Chen, G. & Liu, H. Antioxidative categorization of twenty amino acids based on experimental evaluation. Molecules 22(12),
2066 (2017).
Scientific Reports | (2021) 11:3017 | https://doi.org/10.1038/s41598-021-82513-9 12
Vol:.(1234567890)www.nature.com/scientificreports/
42. Mendive-Tapia, L. et al. New peptide architectures through C-H activation stapling between tryptophan–phenylalanine/tyrosine
residues. Nat. Commun. 6, 7160 (2015).
43. Warżajtis, B. et al. Mononuclear gold (iii) complexes with l-histidine-containing dipeptides: tuning the structural and biological
properties by variation of the N-terminal amino acid and counter anion. Dalton Trans. 46(8), 2594–2608 (2017).
44. Tsun, Z.-Y., & Possemato, R. Amino acid management in cancer.in Seminars in cell and developmental biology, vol. 43, pp. 22–32:
Elsevier (2015).
45. Choi, B.-H. & Coloff, J. L. The diverse functions of non-essential amino acids in cancer. Cancers 11(5), 675 (2019).
46. Lieu, E. L., Nguyen, T., Rhyne, S., & Kim, J. Amino acids in cancer. Exp. Mol. Med. 1–16 (2020).
47. Kang, J.-S. Dietary restriction of amino acids for Cancer therapy. Nutr. Metab. 17(1), 1–12 (2020).
48. Gutiérrez, A., Marzo, I., Cativiela, C., Laguna, A. & Gimeno, M. C. Highly Cytotoxic bioconjugated gold (I) complexes with
cysteine-containing dipeptides. Chem. A Eur. J. 21(31), 11088–11095 (2015).
49. Chen, C. et al. Surface physical activity and hydrophobicity of designed helical peptide amphiphiles control their bioactivity and
cell selectivity. ACS Appl. Mater. Interfaces. 8(40), 26501–26510 (2016).
50. Lee, D. G. et al. Functional and structural characteristics of anticancer peptide Pep27 analogues. Cancer Cell Int. 5(1), 21 (2005).
51. Huang, Y.-B., Wang, X.-F., Wang, H.-Y., Liu, Y. & Chen, Y. Studies on mechanism of action of anticancer peptides by modulation
of hydrophobicity within a defined structural framework. Mol. Cancer Ther. 10(3), 416–426 (2011).
52. Yang, Q.-Z. et al. Design of potent, non-toxic anticancer peptides based on the structure of the antimicrobial peptide, temporin-
1CEa. Arch. Pharmacal Res. 36(11), 1302–1310 (2013).
53. Hu, J. et al. Designed antimicrobial and antitumor peptides with high selectivity. Biomacromol 12(11), 3839–3843 (2011).
54. Nguyen, L. T. et al. Serum stabilities of short tryptophan-and arginine-rich antimicrobial peptide analogs. PLoS ONE 5(9), e12684
(2010).
55. Chen, C. et al. Molecular mechanisms of anticancer action and cell selectivity of short α-helical peptides. Biomaterials 35(5),
1552–1561 (2014).
56. Czupiel, P. P., Delplace, V. & Shoichet, M. S. Cationic block amphiphiles show anti-mitochondrial activity in multi-drug resistant
breast cancer cells. J. Control. Rel. 305, 210–219 (2019).
57. Chan, D. I., Prenner, E. J., Vogel, H. J. Tryptophan-and arginine-rich antimicrobial peptides: structures and mechanisms of action.
Biochimica et Biophysica Acta (BBA) Biomembranes 1758(9), 1184–1202 (2006).
58. Jing, W., Hunter, H., Hagel, J. & Vogel, H. The structure of the antimicrobial peptide Ac-RRWWRF-NH2 bound to micelles and
its interactions with phospholipid bilayers. J. Peptide Res. 61(5), 219–229 (2003).
59. Blondelle, S. E. & Houghten, R. A. Design of model amphipathic peptides having potent antimicrobial activities. Biochemistry
31(50), 12688–12694 (1992).
60. Manimaran, D. et al. Molecular insights of newly identified potential peptide inhibitors of hypoxia inducible factor 1α causing
breast cancer. J. Mol. Struct. 1177, 558–563 (2019).
61. Pettersen, E. F. et al. UCSF Chimera—a visualization system for exploratory research and analysis. J. Comput. Chem. 25(13),
1605–1612 (2004).
62. Krieger, E., Koraimann, G. & Vriend, G. “Increasing the precision of comparative models with YASARA NOVA—a self-parame-
terizing force field,” Proteins: Structure. Funct. Bioinf. 47(3), 393–402 (2002).
63. Qiang, X. et al. CPPred-FL: a sequence-based predictor for large-scale identification of cell-penetrating peptides by feature rep-
resentation learning. Brief. Bioinform. 21(1), 11–23 (2020).
Acknowledgements
This work was fully supported by the TRF Research Grant for New Scholar (No. MRG6180222) and College of
Arts, Media and Technology, Chiang Mai University, and partially supported by Chiang Mai University and the
TRF Research Career Development Grant (No. RSA6280075) from the Thailand Research Fund, the Office of
Higher Education Commission.
Author contributions
W.S. conceived, designed and analyzed the study. P.C. performed the experiments. W.C. and W.S took part in
discussion and analysis of results. P.C contributed the code for constructing iACP-FSCM model and the web
server. V.S.E., M.H. and C.N. took part in analysis of results. V.S.E., W.C. and W.S. drafted the manuscript. W.S.
vetted and finalized the manuscript. All authors read and approved the manuscript.
Competing interests
The authors declare no competing interests.
Additional information
Supplementary Information The online version contains supplementary material available at https://doi.
org/10.1038/s41598-021-82513-9.
Correspondence and requests for materials should be addressed to W.S.
Reprints and permissions information is available at www.nature.com/reprints.
Publisher’s note Springer Nature remains neutral with regard to jurisdictional claims in published maps and
institutional affiliations.
Open Access This article is licensed under a Creative Commons Attribution 4.0 International
License, which permits use, sharing, adaptation, distribution and reproduction in any medium or
format, as long as you give appropriate credit to the original author(s) and the source, provide a link to the
Creative Commons licence, and indicate if changes were made. The images or other third party material in this
article are included in the article’s Creative Commons licence, unless indicated otherwise in a credit line to the
material. If material is not included in the article’s Creative Commons licence and your intended use is not
permitted by statutory regulation or exceeds the permitted use, you will need to obtain permission directly from
the copyright holder. To view a copy of this licence, visit http://creativecommons.org/licenses/by/4.0/.
© The Author(s) 2021
Scientific Reports | (2021) 11:3017 | https://doi.org/10.1038/s41598-021-82513-9 13
Vol.:(0123456789)You can also read