Methods for conversion of high dynamic range content to standard dynamic range content and vice-versa - Report ITU-R BT.2446-0 (04/2019) - BT ...
←
→
Page content transcription
If your browser does not render page correctly, please read the page content below
Report ITU-R BT.2446-0
 (04/2019)

 Methods for conversion of high dynamic
range content to standard dynamic range
 content and vice-versa

 BT Series
 Broadcasting service
 (television)
ii Rep. ITU-R BT.2446-0 Foreword The role of the Radiocommunication Sector is to ensure the rational, equitable, efficient and economical use of the radio- frequency spectrum by all radiocommunication services, including satellite services, and carry out studies without limit of frequency range on the basis of which Recommendations are adopted. The regulatory and policy functions of the Radiocommunication Sector are performed by World and Regional Radiocommunication Conferences and Radiocommunication Assemblies supported by Study Groups. Policy on Intellectual Property Right (IPR) ITU-R policy on IPR is described in the Common Patent Policy for ITU-T/ITU-R/ISO/IEC referenced in Resolution ITU-R 1. Forms to be used for the submission of patent statements and licensing declarations by patent holders are available from http://www.itu.int/ITU-R/go/patents/en where the Guidelines for Implementation of the Common Patent Policy for ITU-T/ITU-R/ISO/IEC and the ITU-R patent information database can also be found. Series of ITU-R Reports (Also available online at http://www.itu.int/publ/R-REP/en) Series Title BO Satellite delivery BR Recording for production, archival and play-out; film for television BS Broadcasting service (sound) BT Broadcasting service (television) F Fixed service M Mobile, radiodetermination, amateur and related satellite services P Radiowave propagation RA Radio astronomy RS Remote sensing systems S Fixed-satellite service SA Space applications and meteorology SF Frequency sharing and coordination between fixed-satellite and fixed service systems SM Spectrum management Note: This ITU-R Report was approved in English by the Study Group under the procedure detailed in Resolution ITU-R 1. Electronic Publication Geneva, 2019 ITU 2019 All rights reserved. No part of this publication may be reproduced, by any means whatsoever, without written permission of ITU.
Rep. ITU-R BT.2446-0 1

 REPORT ITU-R BT.2446-0

 Methods for conversion of high dynamic range content to standard dynamic
 range content and vice-versa
 (2019)

Summary
High dynamic range (HDR) content may be converted to a significantly lower dynamic range so that it may
be displayed on a standard dynamic range (SDR) display device. As the dynamic range mismatch between
content and display capabilities can be significant, the manner in which the dynamic range is reduced impacts
the visual quality that can be achieved. Likewise, SDR content, such as for instance legacy content, may be
converted to HDR content to enable display on a HDR display device, or to bring such content into a HDR
video workflow. This Report provides guidance toward the design of methods that achieve such conversions,
which are referred to as tone mapping and inverse tone mapping, and it presents example methods along with
their evaluation.

Keywords
Standard dynamic range, high dynamic range, tone mapping, inverse tone mapping
Abbreviations/Glossary
HDR High dynamic range
HDR-TV High dynamic range television
HDTV High definition television
ITMO Inverse tone mapping operator
SDR Standard dynamic range
TMO Tone mapping operator
UHDTV Ultra-high definition television
Related ITU Recommendations, Reports
Recommendation ITU-R BT.1886 – Reference electro-optical transfer function for flat panel displays used in
 HDTV studio production
Recommendation ITU-R BT.2020 – Parameter values for ultra-high definition television systems for
 production and international programme exchange
Recommendation ITU-R BT.2087 – Colour conversion from Recommendation ITU-R BT.709 to
 Recommendation ITU-R BT.2020
Recommendation ITU-R BT.2100 – Image parameter values for high dynamic range television for use in
 production and international programme exchange
Report ITU-R BT.2245 – HDTV and UHDTV including HDR-TV test materials for assessment of picture
 quality
Report ITU-R BT.2390 – High dynamic range television for production and international programme exchange
Report ITU-R BT.2408 – Operational practices in HDR television production

1 Introduction
This Report describes methods for conversion of standard dynamic range (SDR) content to high
dynamic range (HDR) content and vice-versa. In this context, SDR content may be defined as a signal
2 Rep. ITU-R BT.2446-0

that is nominally produced to be viewed at a peak luminance of 100 cd/m2 (nits) in the reference
viewing environment, a black level close to zero and a bit-depth of 8 or 10 bits. As defined in
Recommendation ITU-R BT.2100, High Dynamic Range Television (HDR-TV) provides viewers
with an enhanced visual experience by providing images that have been produced to look correct on
brighter displays, that provide much brighter highlights, and that provide improved detail in dark
areas.
An important aspect of an HDR eco-system involves the meaningful conversion between SDR
content and HDR, for example to enable existing content to be brought into an HDR workflow, or to
check SDR content on an HDR display device. Likewise, HDR content may have to be converted to
SDR for monitoring purposes, or for distribution. Conversions whereby SDR content is placed into
an HDR container without changing the dynamic range is generally termed ‘mapping’, and this is
discussed in Report ITU-R BT.2390.
Instead, the focus of this Report is on conversion methods whereby the dynamic range is changed,
either from SDR levels to HDR, or vice-versa. The goal of such methods is to reproduce content at a
different dynamic range without altering the visual experience to the extent possible. One goal of tone
mapping HDR content is to allow the output to be intercut with natively produced SDR content,
whereas a goal of inverse tone mapping of SDR content is to allow the output to be intercut with
natively produced HDR content1.
In this Report reducing the dynamic range of content will be termed “tone mapping”. Similarly,
increasing the dynamic range of content will be termed “inverse tone mapping”. This is consistent
with the academic literature on these topics [12].
The ability to perform round-tripping, i.e. to convert SDR content to HDR and then back to SDR
again, whilst minimising the change to the visual experience, is an important requirement. Likewise,
round-tripping from HDR to SDR and then back to HDR may also be useful. While such ability is
very useful, it is advised to limit the number of such repeated conversions as much as possible, as
some signal degradation is likely.
Tone mapping and inverse tone mapping are inherently methods that require trade-offs between, for
example, computational complexity, handling of visual artefacts such as over-exposed areas, as well
as the general mapping of luminance values, which may be different between live and graded content.
The selection of an appropriate method should therefore be made bearing in mind any specific use
case, or the nature of the content. To help such a selection to be made, this Report contains three
methods that each make different trade-offs, as discussed in the introductory paragraphs of the
sections in which they are described. The methods have in common, however, that they are static,
offering a fixed processing independent of content or viewing environment. When evaluating the
subjective performance of these methods it becomes clear that, depending on the particular video
content, a different method may be preferred. It should be noted that adaptive, dynamic and spatially
varying methods also exist, and it is possible that a suitable dynamic method could provide better
performance across a wider range of video content.
The structure of this Report is as follows. Section 2 describes general guidelines for HDR to SDR
conversion, SDR to HDR conversion, and round-trip performance. Section 3 discusses a pair of tone
mapping and inverse tone mapping methods that map between 100 and 1 000 cd/m2 under the
assumption that the input data is of sufficiently high quality. When the quality of the input data is
lower, for example in the presence of large over-exposed areas, less strong mappings may be
favourable. Section 4 describes such methods for tone mapping and inverse tone mapping. Section 5
presents a method that is designed to preserve skin tones, and to adhere to reference levels (see Report

1 The term ‘intercut’ broadly refers to intermixing natively produced and converted content temporally, but
 also refers to spatial montages such as for example picture-in-picture applications.
Rep. ITU-R BT.2446-0 3

ITU-R BT.2408). Section 6 offers a feature comparison between the three methods presented in this
Report. Finally, Annex 1 presents an evaluation of the round-trip performance of the methods
presented in § 3.

2 Guidelines for conversion between SDR and HDR

2.1 Guidelines for SDR to HDR conversion
Recommendation ITU-R BT.2100 specifies methods for encoding HDR content, enabling effective
programme interchange. The perceptual quality (PQ) and hybrid log-gamma (HLG) systems
documented in that Recommendation require an HDR linear light signal to be present as input. The
origins of such signals are not described. Section 5 of Report ITU-R BT.2408-0 describes methods for
placing SDR content in PQ and HLG containers without changing the actual dynamic range of the
content.
SDR content comes from a variety of sources, with different levels of quality, for example as function
of the technologies available at the time of production, or the presence of compression. As inverse tone
mapping is designed to expand the dynamic range of content, such expansion may amplify artefacts,
dependent on their presence and severity. As a consequence, some content may best be mapped without
expanding the dynamic range, as described in Report ITU-R BT.2408.
Generally, however, a non-linear expansion may be preferred, thereby offering a different trade-off
between management of artefacts and visual appearance. Such inverse tone mapping methods may take
inspiration from knowledge about non-linearities in human visual perception, and thereby produce
results that better match human vision.
The desire in such cases would be to increase the dynamic range of the content to effectively enhance
its visual appearance. This requirement may be translated into several objectives that any SDR to
HDR conversion process should adhere to:
1) maintain details in the shadows;
2) ensure that mid-tones are not unduly expanded;
3) expand highlights up to the peak display luminance, insofar the quality of the content allows
 (see discussion below);
4) ensure chromatic content is adjusted appropriately;
5) maintain temporal stability.
The motivations for these requirements are as follows. First, much of the look-and-feel of the content
is encoded in the shadows and the mid-tones. By applying a non-linear function to the content may
change the contrast between pixels. As a result, care should be taken that changing pixel relationships
between pixels in the darks and mid-tones do not unacceptably alter the appearance of the image.
On the other hand, darks and mid-tones cannot be processed in exactly the same way, as shadow
details would become relatively less visible, especially when viewed adjacent to much brighter
highlights as a result of veiling glare. As such, dark tones would have to be expanded slightly more
than the mid-tones. The mid-tones cannot be expanded by a large amount, because this would raise
the mean luminance level too much, leading to the potential for significant viewer discomfort.
Furthermore, account should be taken of the changes in perception of relative tones as the eye adapts
to brighter inverse tone-mapped images.
The brightest parts of the image can receive the greatest amount of expansion, striking a balance
between creating the increased impact associated with HDR imaging and maintaining the director’s
intent. Note that expanding non-graded content, for instance live broadcast content captured with an
SDR camera would benefit from the same considerations.
4 Rep. ITU-R BT.2446-0

The design of an SDR to HDR conversion process should, however, take into consideration that very
strong expansions may reveal artefacts. Even if a well-designed inverse tone mapping method does
not introduce artefacts by itself, it may amplify artefacts that were already present in the input
material. For instance, while aggressive compression schemes may introduce quantization that at
SDR display levels may be sub-threshold, at HDR display levels such artefacts may end up
supra-threshold. Such content should not be scaled to high luminance levels. However, compression
in production and interchange environments is often light or absent, leaving much content which
could be expanded with little worry for the visible appearance of quantization artefacts.
Further, over-exposed areas in the SDR content should be carefully considered, as under certain
circumstances expanding those to high luminance levels may lead to visually objectionable results.
SDR content exhibiting large over-exposed areas may be processed in one of several ways. First, it
may be possible to apply image restoration techniques to such areas. In particular, de-clipping
operators may restore some of the lost detail [1]. Second, over-exposed SDR content may be placed
in an HDR container without increasing the luminance range, to at least enable such content to be
incorporated into an HDR workflow.
Chromatic content needs to be tuned, as human visual perception of chromatic content is dependent
on luminance levels [5] [9]. Premier among such luminance induced appearance effects is the Hunt
effect, which states that as luminance levels increase, the associated colourfulness also increases [6].
In addition, chromatic content should be scaled in accordance with the amount of luminance
expansion, as saturation would otherwise be off.
Finally, no method should introduce temporal artefacts.
With these requirements in mind, current proposals may be assessed. For example, to prepare SDR
content for HDR displays, reverse or inverse tone mapping operators (ITMO) can be employed. Such
algorithms process the luminance information in the image with the aim of recovering or recreating
the appearance of the original scene. Typically, ITMOs take an SDR image as input, expand the
luminance range of the image in a global manner, and subsequently process highlights or bright
regions locally to enhance the HDR appearance of the result. This is at least in part consistent with
the above requirements. Separate consideration of dark tones, however, is rare.
Although several ITMO solutions exist within the academic literature [2] [3] [4] [7] [8] [10], they
focus on perceptually reproducing the appearance of the original scene and rely on strict assumptions
about the content. Many such techniques propose spatially varying processing, which, if used with
care, can indeed produce superior results. However, in the context of programme production and
interchange, limits on processing time would prohibit the introduction of such computationally
demanding techniques. Additionally, existing solutions are rarely created with video in mind, and
therefore have the potential for being temporally unstable.
An obvious way in which inverse tone reproduction may be achieved is to begin by taking standard
content which may, for instance, follow Recommendation ITU-R BT.709 (BT.709) or
Recommendation ITU-R BT.2020 (BT.2020). In such example case, it would be possible to linearize
the signal by applying an appropriate electro-optical transfer function (EOTF). This would produce a
normalised relative signal, as information on absolute luminance levels at recording time is not
available. An HDR signal may be derived by scaling this content in some way, for instance by linear
scaling. However, there are a few concerns with such a simple approach.
First, experience has shown that linear scaling does not produce the best possible visual experience,
as this would increase the mean luminance too much. In essence, the mid-tones become too high for
comfortable viewing. Such a linear scaling would only work if the illumination of the viewing
environment were also increased by the same amount. As this is not the case, linear scaling is
inappropriate for luminance expansion. Second, human visual perception does not treat luminance
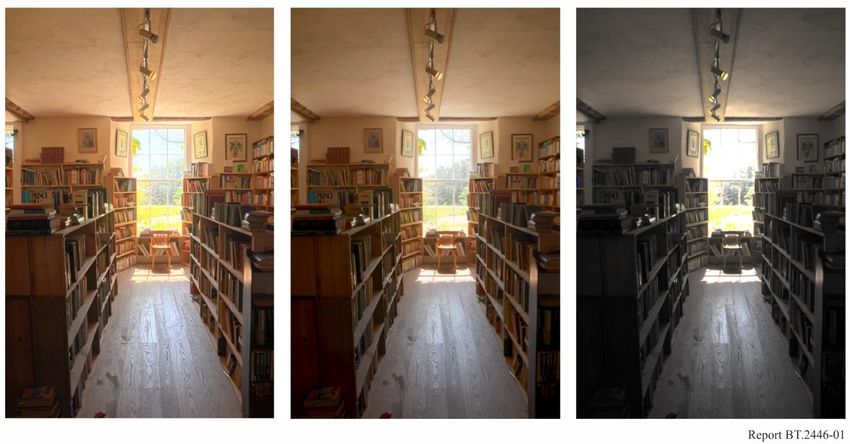
Rep. ITU-R BT.2446-0 5

and chrominance independently [5] [6] [9], which means that linear scaling in any colour space would
create issues with chroma/saturation.
As a consequence, a better approach would be to apply a non-linear transform. This could take the
form of a simple power function, where the exponent would be a constant (i.e. a gamma curve). This
would exclude processing in RGB space, as this might introduce hue shifts. Once again, experience
has shown that such solution does not yield the best possible visual experience, especially not for
graded content where processing of dark tones requires extra care and precision.
In sum, converting SDR to HDR involves requirements that are not met by the simplest approaches
such as linear scaling or gamma-like transfer functions. Spatially varying methods, on the other hand,
tend to be too computationally demanding for a production environment. A well-designed middle
ground between these two extremes would be desirable.
Bearing in mind these guidelines, as well as the need for methods that are highly predictable, the
following two conversions are proposed.

2.2 HDR to SDR conversion
Tone mapping, i.e. the non-linear mapping between HDR to SDR content is a well-researched topic
(see for example [12] and its references). There is a general notion that a reduction of the dynamic range
needs to be governed by at least one secondary goal, i.e. the visual quality needs to be preserved in
some way. It has not been clear, however, what aspect(s) of visual quality need to be preserved.
Different approaches to tone mapping have aimed to preserve for example brightness, local contrast or
visual appearance, each leading to imagery with a different look and feel. An example of how different
tone mapping methods can produce different results is shown in Fig. 1.

 FIGURE 1
 Different tone mapping algorithms tend to produce images with a different look and feel

Despite several decades of research and hundreds of published papers on tone reproduction, an
important observation remains that most available methods for tone mapping inherently incorporate
some personal preference of the designers. The methods described in this Report, however, aim to
6 Rep. ITU-R BT.2446-0

limit this by offering designs that produce SDR content that, to the extent possible, is visually matched
to its HDR origins under comparable viewing conditions.

2.3 Round-trip conversion
Currently, SDR and HDR productions occur side-by-side, a situation that will last for the foreseeable
future. As a consequence, content may have to undergo conversions back and forth between SDR and
HDR. While in general it is advisable that the number of such conversions is limited as much as
possible, there are cases where they cannot be avoided. In those cases, it is highly desirable that
methods for tone mapping and methods for inverse tone mapping are chosen that are
matched/complementary, as this brings the possibility of limiting the loss of visual quality due to
round-trip conversions. Examples of matched tone mapping/inverse tone mapping pairs are presented
in §§ 3, 4 and 5. Method A, presented in § 3, is evaluated in terms of round-trip conversion quality in
Annex 1.

3 Conversion Method A
Content produced for broadcast may originate from a variety of sources including episodic content,
movies, ads, as well as live content. Especially movies and episodic content are produced to a high
visual quality, as full control can be exerted over the scene, its lighting, as well as the camera settings.
Moreover, in a post-production studio, content is typically colour graded to produce the highest
possible visual quality. In such use cases, conversion between SDR and HDR content (and vice-versa)
can be successfully achieved with methods that do not explicitly anticipate issues related to the quality
of the input content. The tone mapping and inverse tone mapping techniques described in this section
map content between 100 cd/m2 and 1 000 cd/m2 and vice-versa. These levels were chosen because
most SDR content is nominally produced at 100 cd/m2, while HDR content may require further
conversions between the PQ and HLG systems, which is most straightforward to accomplish for
signals that do not exceed 1 000 cd/m2, as discussed in Report ITU-R BT.2390, § 7.
For both tone mapping and inverse tone mapping, methods suitable for this use case are presented in
the following sub-sections. The tone mapping and inverse tone mapping methods (§§ 3.1 and 3.2,
respectively) are intended to be complementary, allowing a conversion back and forth with only a
minimum of quality loss, as evaluated and discussed in Annex 1.

3.1 HDR to SDR conversion
The purpose of this method is to convert HDR content, which is captured or produced at 1 000 cd/m2,
to content suitable for display on an SDR display device with a peak luminance of 100 cd/m2. The
choice of using a 1 000 cd/m2 input signal is motivated by the bridge point used in the conversion
between PQ and HLG signals (and vice-versa), as discussed in Report ITU-R BT.2390-2, § 7.2. The
method allows HDR content to be used in SDR BT.2020 productions, or to be distributed in SDR. In
addition, the method works in conjunction with the inverse tone mapping method described in § 3.2,
allowing round-tripping, the performance of which is documented in § 3.3.
A normalized full-range linear display-light HDR signal RGB using colorimetry specified in Table 2
of Recommendation ITU-R BT.2100, which is assumed to be produced at 1 000 cd/m2, may be tone
mapped to an SDR luminance signal TMO according to the specification presented in Table 1.
As human colour perception interacts with brightness, changing the overall level of an image as
displayed will cause the perception of colour to be altered. In particular, saturation is affected, for
example as described by the Hunt effect. As a consequence, a correction needs to be applied so that
colours before and after tone mapping are perceived similarly. Here, colour correction is applied using
as input the HDR ′ ′ ′ signal, as well as the luma signals ′ and ′SDR . As this correction and
corresponding reconstruction of a colour signal is carried out on an SDR signal, the output is an SDR
Rep. ITU-R BT.2446-0 7

signal specified in ′ ′ ′ space. It may be displayed directly, or it may be converted to RGB using
the information contained in Table 4 of Recommendation ITU-R BT.2020. The colour correction
reference is given in Table 2.

 TABLE 1
 HDR to SDR conversion reference functions2
 Parameter Values
 1
 ′ = 2.4
 Non-linear transfer 1
 function ′ = 2.4
 1
 ′ = 2.4
 Luma ′ = 0.2627 ′ + 0.6780 ′ + 0.0593 ′
 log(1 + ( HDR − 1) ′)
 ′ =
 log( HDR )
 Tone mapping step 1 1
 HDR 2.4
 HDR = 1 + 32 ( )
 10000
 1.0770 ′ 0 ≤ ′ ≤ 0.7399
 Tone mapping step 2 c′ = {−1.1510 ′ 2 + 2.7811 ′ − 0.6302 0.7399 < ′ < 0.9909
 0.5000 ′ + 0.5000 0.9909 ≤ ′ ≤ 1
 ′
 c −1
 ′
 SDR = SDR
 SDR − 1
 Tone mapping step 3 1
 SDR 2.4
 SDR = 1 + 32 ( )
 10000
 Peak mastering display HDR is the assumed peak mastering display luminance.
 luminance HDR = 1000 / 2
 Peak target display
 SDR = 100 / 2 is the assumed peak target display luminance.
 luminance

2 Note that the processing described in this table may be implemented using one 1D look-up table.
8 Rep. ITU-R BT.2446-0 TABLE 2 Colour correction reference functions Parameter Values ′ ′ ′ ) − ′ ,TMO = ( SDR 1.8814 Colour difference signals ′ ′ ′ − ′ ,TMO = ( SDR ) 1.4746 ′ ′ ) SDR Colour scaling function ( SDR = 1.1 ′ ′ ′ ′ Adjusted luma component TMO = SDR − max(0.1 ,TMO , 0) ′ ′ ′ ′ ′ ′ TMO ,TMO ,TMO values may be converted to TMO TMO TMO according Colour space conversion to Recommendation ITU-R BT.2020. 3.2 SDR to HDR conversion The purpose of the method described in this section is to provide a baseline conversion taking as input SDR signals following BT.2020 colorimetry that are intended to be displayed in a reference viewing environment at 100 cd/m2. Signals using BT.709 colorimetry may also serve as input, albeit that they should first be mapped or converted to use BT.2020 colorimetry. These signals are then converted to HDR signals suitable for use according to Recommendation ITU-R BT.2100. This method aims to provide visual similarity between input and output content. A target luminance of 1 000 cd/m2 is chosen to provide compatibility with the ‘bridge point’ of 1 000 cd/m2 proposed to guide conversions between PQ and HLG systems (and vice-versa), see § 6 in Report ITU-R BT.2408 as well as § 7.2 of Report ITU-R BT.2390-2 (or later). This enables SDR content to be brought into an HDR workflow, without the need to commit to a specific workflow. The method is intended for SDR content that does not contain overly large areas near maximum signal level. This method is compatible with the tone mapping method described in § 3.1, in that the two methods together facilitate round-trip performance. In this regard, the round-trip performance of the two methods is assessed in § 3.3. Starting with an SDR signal encoded in the Recommendation ITU-R BT.2020 colour space, conversion to HDR proceeds by first converting this signal to ′ ′ ′ , as specified in Table 4 of Recommendation ITU-R BT.2020. Then, the (previously normalised) ′ channel is expanded, and the ′ and ′ channels are adjusted to match the visual perception of chromatic content at different luminance levels. The peak luminance max is specified to be 1 000 cd/m2. Note that both input and output signals are assumed to be full range. If required, legal or limited range input signals should be converted to full range. The inverse tone mapping process is described in Table 3.
Rep. ITU-R BT.2446-0 9

 TABLE 3
 SDR to HDR conversion reference functions
 Parameter Values
 Range of input signal ′ ∈ [0, 1]
 Range adjustment ′′ = 255.0 ′
 ′
 SDR to HDR luma mapping HDR = ′′
 ′′2 + 1 ′′ + 1 , ′′ ≤
 = { 1 ′′2
 Exponent 2 + 2 ′′ + 2 , ′′ >
 = 70
 Constants 1 = 1.8712 − 5 2 = 2.8305 − 6
 1 = −2.7334 − 3 2 = −7.4622 − 4
 1 = 1.3141 2 = 1.2528
 ′
 Chroma mapping ,HDR = ′
 ′
 ,HDR = ′
 ′
 Chroma scaling factor HDR
 = { 1.075 if ′ > 0
 ′
 1 if ′ = 0
 Maximum display luminance max = 1000 / 2
 ′ ′ ′ ′ ′ ′
 Absolute HDR3 ( abs , abs , abs ) = −1 ( HDR , ,HDR , ,HDR ) max
 ′ ′ ′ 2.4
 −1 ( HDR , ,HDR , ,HDR ) '
 clamp( HDR ′
 + 1.4746 ,HDR , 0, 1000)
 ( )
 1000
 ' ′ ′ 2.4
 clamp( HDR − 0.16455 ,HDR − 0.57135 ,HDR , 0, 1000)
 ( )
 1000
 ' ′ 2.4
 clamp( HDR + 1.8814 ,HDR , 0, 1000)
 ( )
 { 1000
 if <
 clamp( , , ) = { if >
 otherwise

4 Conversion Method B
Notably in live broadcast, but also in other use cases, the quality of captured SDR content may exhibit
certain flaws that require mapping to HDR to be tailored to minimise amplification of such flaws. In
particular large over-exposed areas, which are common in certain SDR content, may become overly
bright under inverse tone mapping, unless the method is tailored to reduce the visual impact of such
areas. This section presents a tone mapping / inverse tone mapping pair of methods, whereby the
inverse tone mapping is designed to avoid producing objectionably bright large areas. This is achieved
with a global curve that limits the peak luminance, relative to the method presented in § 3.
The inverse tone mapping method is presented in § 4.1, whereas the corresponding tone mapping
method is discussed in § 4.2.

3 The signal produced here ranges between 0 and max, and can be used for encoding into the PQ system, as
 defined in Recommendation ITU-R BT.2100. It may subsequently be encoded into the HLG system
 following the procedure outlined in § 7.2 of Report ITU-R BT.2390.
10 Rep. ITU-R BT.2446-0 4.1 SDR to HDR conversion Where a single non-adaptive method of SDR to HDR conversion is required to work well across a wide range of SDR content, including archive and live material which may contain large areas near maximum signal level, a smaller amount of highlight expansion may be more appropriate. The method described below attempts to reverse the highlight compression commonly applied in SDR cameras using a “knee” function, or that is implicit in SDR graded material. The initial parameters for the inverse tone mapping operator were derived through analysing the distribution of displayed luminance levels across seventy-five SDR programmes, spanning a wide range of genres. By assuming an even distribution of luminance levels within the scene, the typical “knee” breakpoint and compression factor (or equivalent) were deduced by looking for an increase in the distribution of code values. Those initial estimates were then optimised through a series of expert subjective assessments, using a wide range of content that included 8-bit archive material, compressed and interlaced content. Each of these limits the degree of highlight expansion that can be applied. As the goal of the inverse tone mapping process is to maintain the “look” of the SDR material, a display light conversion is described. A similar scene-light conversion may be used where the goal is to match SDR and HDR cameras. See Report ITU-R BT.2390, § 10. An overview of the generalised inverse tone mapping process for both PQ and HLG output is illustrated in Fig. 2. The steps of the method are described in the sub-sections that follow. FIGURE 2 Processing steps for inverse tone mapping method B 4.1.1 Linearise SDR input to RGB display light The incoming SDR BT.709 or BT.601 signal is first converted to SDR display light using the Recommendation ITU-R BT.1886 (BT.1886) display EOTF at 100 cd/m2 peak luminance. The SDR display light is then converted to CIE 1931 XYZ, and subsequently to CIE 1976 Yu'v'. The transformation allows the luminance component (Y) to be modified to increase the signal’s contrast ratio, without affecting the image chrominance (u′ and v′). 4.1.2 Gamma compensation and scaling A scaling factor is applied to the luminance signal to double the SDR displayed light, to be consistent with the HDR Reference White of 203 cd/m2 (see Report ITU-R BT.2408) for a 1 000 cd/m2 HLG display. In order to maintain the level of detail in the shadows and the appearance of mid-tones, an OOTF gamma adjustment must also be applied to compensate for the increase in displayed luminance. The gamma adjustment for SDR content has been found to be quite close to that for HDR content, so the extended range gamma formula in footnote 2 of Recommendation BT.2100-2 can also be adapted to calculate the change in gamma for the scaled SDR. For a doubling of displayed luminance, from 100 to 200 cd/m2, the formula becomes,
Rep. ITU-R BT.2446-0 11

 Gamma adjustment = k ^ (log2 (200/100)), where k = 1.111
Thus, from the formula, a good estimation of the gamma adjustment necessary is approximately 1.1.
Slightly different values might be used in practice, to achieve the desired artistic effect.

4.1.3 Inverse tone mapping
In its most basic form, all pixel values above a specified breakpoint are increased by a multiplier, in
effect expanding the highlights to more natural levels in relation to the shadows and mid-tones. In
order to meet the criteria of being simple and robust, a fixed breakpoint is used, rather than a variable
one that is dependent on the content. A fixed breakpoint also makes the process easier to reverse (for
round-tripping) as no metadata is required. Subjective tests found that the exact breakpoint is less
critical than the scaling multiplier. Therefore, a value of ~80% SDR signal (equivalent to ~60 cd/m 2
SDR displayed light on a 100 cd/m2 BT.1886 display) is recommended as that is very close to the
average breakpoint found in the analysis of programme content.
Camera knees can compress the highlights significantly, so a simple reversal may not be appropriate.
In choosing the multiplier one must be careful to ensure that the image is natural in appearance,
without adding any banding in the highlights introduced during the SDR production process. Initial
testing showed that a value of 2.3 (display light) gave a subtle increase in highlights without causing
banding. It also ensured that large over-exposed and clipped areas of the SDR image were not
reproduced at too high a luminance level on HDR screens. This value was found to work well for
both 8-bit and 10-bit content as even 8-bit video has fine enough quantisation in the upper signal
ranges to allow some expansion of highlights.
In practice, to avoid artefacts at the intersection of the unity scaler and highlight expansion function,
a Bezier curve or similar can be used to blend between the two.

4.1.4 Convert to RGB and apply the inverse EOTF
The modified display luminance and u'v' chrominance signals are then converted back to XYZ, to
allow conversion to RGB displayed light with Recommendation ITU-R BT.2100 colour primaries.
The HLG signal is obtained by applying the inverse HLG EOTF at 1 000 cd/m2 peak luminance. A
PQ signal is obtained by applying the PQ inverse EOTF.

4.1.5 Simplification for HLG output
Where only an HLG output signal is required, the inverse tone mapping process can be simplified by
exploiting the ability of the HLG EOTF to operate at different peak luminance levels. Through careful
choice of LW, the HLG EOTF nominal peak luminance, a 1:1 mapping of SDR luminance to HDR
luminance can be achieved over a large portion of the signal range, thereby avoiding the need for any
luminance scaling and compensating OOTF adjustment. The simplified processing steps are shown
in Fig. 3.
For graded SDR content, for which display light conversions are most often used, “diffuse white”
(equivalent to the “HDR Reference White” defined in Report ITU-R BT.2408) is usually set at around
90% signal level. So the value of LW used for the HLG inverse EOTF is chosen such that a 90% SDR
achromatic signal (with no inverse tone mapping) would deliver the “HDR Reference White” of 75%
signal for HLG.
Using this formula, the 1:1 mapping of SDR to HDR luminance is achieved by setting the SDR
BT.1886 nominal peak luminance LW, to 100 cd/m2, the HLG nominal peak luminance, LW to
291 cd/m2 with a HLG gamma value of 0.994. Once inverse tone mapping has been applied, 90%
SDR signal is mapped to 77% HLG and the image brightness slightly increased. So marginally better

4 Calculated using the extended range gamma formula in footnote 2 of Recommendation ITU-R BT.2100.
12 Rep. ITU-R BT.2446-0

results are achieved with this inverse tone mapper by using a slightly higher gamma value of 1.03,
thereby compensating for the increase in average luminance as a result of the inverse tone mapping
process.
The simplified inverse tone mapping process also makes it easier to calculate a complementary tone
mapper, to minimise round-tripping losses.

 FIGURE 3
 Simplified inverse tone mapping for HLG output

A suitable inverse tone mapping curve is illustrated in Fig. 4. The function provides a 1:1 mapping
of SDR display light to HDR display light up to the breakpoint, ensuring that shadow details and mid-
tones are faithfully reproduced in the HDR image. In this example, the breakpoint is set to 78% SDR
signal (55 cd/m2) as it closely matches the average breakpoint of SDR cameras and has been found
to offer a good balance between image brightness, and the portrayal of highlights in the
complementary tone mapper described in § 4.2.
Beyond the breakpoint an exponential function, rather than the basic linear function and Bezier curve
(described in § 4.1.3) is used to expand the highlights.
The curve is extended into the SDR “super-white” region (up to the maximum of 123 cd/m2) to exploit
any SDR highlights which may be present in the signal.
The gradient of the exponential function is set to unity at the breakpoint to ensure a smooth transition
between the linear and exponential portions. Other parameters are adjusted to ensure that a 100%
achromatic SDR signal delivers ~83% HLG signal (114 cd/m2 for HLG LW = 291 cd/m2 with the
increased gamma of 1.03).
Other functions are possible, provided a smooth transition is ensured at the breakpoint and the amount
of highlight expansion is limited to similar levels.
Rep. ITU-R BT.2446-0 13

 FIGURE 4
 Example inverse luminance tone mapping curve

4.2 HDR to SDR conversion
An alternative method of tone mapping is described below, which has been designed to complement
the inverse tone mapping algorithm described in § 4.1, whilst also delivering a high quality SDR
BT.709 image from natively produced BT.2100 HDR content. To achieve these goals, the method:
– is display-referred, to ensure the HDR and SDR images have a similar “look”;
– uses a tone-mapping curve that, over a large part of the signal range, is the complement of
 the inverse tone-mapping curve described in § 4.1.5, thereby reducing round-tripping losses;
– maps the “HDR Reference White” level (75% HLG or 58% PQ) to approximately 90% of
 the SDR signal, to ensure consistent image brightness between tone-mapped and natively
 produced SDR content, whilst also allowing some headroom in the SDR signal for
 compressed highlights;
– provides a hard clip of out-of-gamut colours to BT.709 colour volume to minimise “round-
 tripping” chrominance losses.
The processing blocks for HLG signals, are illustrated in Fig. 5. As the method exploits the ability to
configure the HLG EOTF to different peak luminance levels, PQ signals should first be converted to
HLG using one of the methods specified in Report ITU-R BT.2390, § 7.

 FIGURE 5
 HDR to SDR tone-mapping method B

The algorithm is described in the following sub-sections.
14 Rep. ITU-R BT.2446-0

4.2.1 Conversion to HDR linear RGB display light
The HLG display EOTF (comprising an inverse HLG Opto-Electronic Transfer Function (OETF-1)
and the Opto-Optical Transfer Function (OOTF)) is applied to the input signal to create linear RGB
display light signals.
In graded SDR content, diffuse white is often set at around 90% of the SDR signal, which allows a
small amount of “headroom” for highlights. So, to ensure similar brightness between tone-mapped
HDR and native SDR content, the tone-mapping algorithm should also map “HDR Reference White”
(75% HLG) to around 90% of the SDR signal.
Rather than using the usual bridge condition of 1 000 cd/m2 for format conversions, the HLG display
EOTF is conveniently set to a nominal peak luminance, , of 291 cd/m2, as that renders “HDR
Reference White” at 78 cd/m2, which is equivalent to 90% of the SDR signal on a BT.1886 reference
display with nominal peak luminance of 100 cd/m2. By doing so, the brightness of the tone mapped
images are comparable to SDR graded content, and a direct 1:1 mapping between HDR displayed
light and SDR displayed light can be used for the conversion, over most of the signal range.
The exact HLG gamma display gamma may be adjusted slightly from the value specified for HDR
images in Recommendation ITU-R BT.2100, to achieve the desired artistic effect. But a gamma value
of 1.03 for an EOTF of 291 cd/m2 has been found to work well and complements the inverse tone
mapper described in § 4.1.5.

4.2.2 Convert to Yu'v'
To ensure that the hue and saturation of the signals are unaffected by the highlight compression, the
tone mapping is only applied to the luminance component (Y), and the chrominance components (u'
and v') bypass the process and remain unaltered. The conversion comprises two steps:
1) RGB with BT.2100 primaries to CIE 1931 XYZ
2) CIE 1931 XYZ to CIE 1976 Yu'v'

4.2.3 Tone Mapping
A 1:1 mapping between HDR and SDR display light is used over most of the signal range, thereby
ensuring the consistent portrayal of shadow detail and mid-tones between the HDR and SDR images.
A compression function is then applied to the higher luminance level signals.
To both complement the inverse tone mapping described in § 4.1, and provide a good balance between
the brightness of the SDR signal and the portrayal of highlights, the breakpoint between the linear 1:1
mapping and the compression function is set to 78% of the SDR signal level (~55 cd/m2). The gradient
of the compression portion of the curve should be unity at the breakpoint, in order to match the
gradient of the lower linear portion and minimise banding artefacts.
In this example, luminance highlights are compressed using a logarithmic curve, similar to the inverse
of the exponential curve used for the inverse tone mapper described in § 4.1.5. Following tone
mapping, HDR Reference White (75% HLG) is mapped to 86% SDR signal.
The example luminance tone mapping curve is shown in Fig. 6.
Rep. ITU-R BT.2446-0 15

 FIGURE 6
 Example luminance tone-mapping curve

4.2.4 Colour volume reduction
Following the highlight compression, some colours in the video signal will be outside the target
BT.709 colour volume. These colours must be “reduced” so that they lie on or within the colour
volume boundary. Careful hard clipping of out-of-gamut colours to the target colour volume surface
improves the round-tripping performance when used in conjunction with the inverse tone-mapping
algorithm described in § 4.1. It was also found to work well when developing the more sophisticated
conversion techniques reported in Report ITU-R BT.2407, Colour gamut conversion from
Recommendation ITU-R BT.2020 to Recommendation ITU-R BT.709.
The hard clipping is achieved by desaturating out-of-gamut colours so that they lie on the BT.709
colour volume surface. Care should be taken when choosing the working colour space, to avoid hue
shifts.
Tests have shown that using CIE 1976 Yu'v' causes saturated reddish-orange colours, to desaturate
towards pink. Similarly, saturated yellowish-green changes hue towards green. A small hue shift also
occurred in blue.
Further tests performed using CIE L*a*b* found that there were significant hue shifts from blue to
purple in saturated water and sky scenes. A small hue shift also occurred in the reddish-orange colours
of saturated sunset scenes.
No hue shifts were seen when desaturating colours using the ICTCP colour representation,
standardised in Recommendation ITU-R BT.2100.

4.2.5 Convert to RGB and apply the inverse BT.1886 EOTF
An SDR non-linear signal is created by first converting CIE 1976 Yu'v' to XYZ, then converting XYZ
to RGB with BT.709 colour and applying the inverse SDR EOTF described in Recommendation
ITU-R BT.1886. The resulting output should be a perceptually close match (without the high contrast
and brightness perceived in HDR) to the original HDR video without hue shifts.
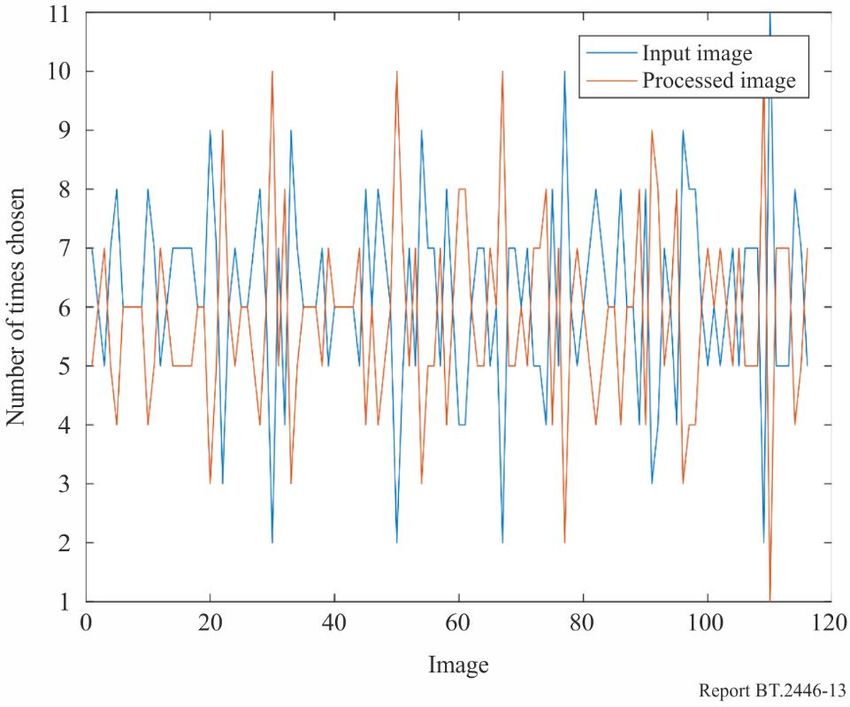
16 Rep. ITU-R BT.2446-0

4.3 Round-tripping
The tone and inverse tone mappers described in §§ 4.1 and 4.2 are not the exact inverse of one another.
When tone mapping, SDR images benefit from exploiting the full HDR signal range, to avoid hard
clipping in the converted signal. The inverse tone mapper, however, only extends to around 83% of
the HLG signal (for SDR nominal peak white signals) to avoid large overly bright clipped areas in
the HDR image. Through careful design of the tone and inverse tone mappers it is, however, still
possible to reduce round-tripping losses to acceptable levels.
Figure 7 shows the round-tripping signal losses for the cascaded SDR to HDR and HDR to SDR
conversions described in § 4, for achromatic signals. Figure 8 shows the same signal losses, as they
would appear if shown on a 100 cd/m2 reference display. As the tone mapping and inverse tone
mapping curves follow one another precisely up to the breakpoint (78% SDR signal), excellent round-
tripping performance is achieved for the majority of the signal range, which includes the ranges
commonly used for SDR skin tones. The highlight expansion and compression functions then slowly
begin to diverge above the breakpoint, and some small losses can be seen thereafter. The peak
luminance of signals following the double conversion is slightly reduced.

 FIGURE 7
 SDR-HDR-SDR round-tripping signal losses
Rep. ITU-R BT.2446-0 17

 FIGURE 8
 SDR-HDR-SDR round-tripping signal losses, shown on a 100 cd/m2 reference display

5 Conversion Method C
This conversion method is designed as a parametric representation to ensure that the optimum
conversion can be adjusted depending on the content. In designing the conversion, the following
considerations were made:
– A tone-mapping function is composed of a linear mapping function and a log function. Below
 highlight parts, HDR signals are linearly mapped to SDR signals to preserve the look of mid-
 tone. The gain of the linear mapping is determined from the relationship between the skin
 tones in the HDR and SDR content. The highlight parts of the HDR signals are compressed
 using the log function to fit within the SDR range while retaining as much gradation as
 possible.
– HDR Reference White (75%HLG) should be mapped to approximately 95% SDR signal level
 to ensure consistency with SDR original content, assuming that the peak luminance of HDR
 and SDR displays are 1 000 cd/m2 and 100 cd/m2, respectively.
– The hues of highlights in the original HDR content should be maximally retained after tone-
 mapping. To avoid hue shifts caused by the clipping of compressed highlight parts, pre- and
 post-processing are applied, in which a crosstalk matrix reduces saturation before tone-
 mapping and an inverse crosstalk matrix recovers the saturation after tone-mapping.
– In SDR production, highlight parts are sometimes intentionally expressed as achromatic.
 Thus, an optional processing step is included to change highlight parts to achromatic.
– Display-referred mapping is adopted so that the converted SDR content looks similar (except
 in dynamic range) to the original HDR content.
– Inverse conversion can be used for SDR to HDR conversion.

5.1 HDR to SDR conversion
A block diagram for HDR to SDR conversion is illustrated in Fig. 9. The conversion method assumes
HLG input signals, however, similar conversion might be possible for PQ input signals. When colour
18 Rep. ITU-R BT.2446-0

conversion from BT.2020 to BT.709 is required, one of the methods described in Report ITU-R
BT.2407 may be used after HDR to SDR conversion.
The details of the algorithms used are described in the following sub-sections. The processing may
be implemented using one 3D look-up table.

 FIGURE 9
 Block diagram of HDR to SDR conversion

5.1.1 Conversion to linear display light signals
The input HLG video signals are converted to linear display light signals by applying the HLG EOTF
as specified in Table 5 of Recommendation ITU-R BT.2100, where the system gamma of 1.2 may be
used.
 ′

 ′
 [ ] = EOTFHLG [ ] (1)
 ′

5.1.2 Crosstalk matrix
The crosstalk matrix is applied such that saturations of linear signals are reduced to achromatic to
avoid hue changes caused by clipping of compressed highlight parts.
 1 − 2α α α
 [ ] = [ α 1 − 2α α ] ∙ [ ], (2)
 α α 1 − 2α
where α determines the degree of de-saturation and should be set to a value in the range of 0 ≤ α ≤
0.33.

5.1.3 Conversion to Yxy
The linear RGB signals after the crosstalk matrix are converted to CIE 1931 XYZ signals, and
subsequently to Yxy signals. This conversion makes the luminance signal separated from the colour
components, and the successive tone mapping is applied only to the luminance signal.
 0.6370 0.1446 0.1689
 [ ] = [0.2627 0.6780 0.0593] ∙ [ ] (3)
 0.0000 0.0281 1.0610

 = , = (4)
 + + + +

5.1.4 Tone mapping
The tone-mapping function is composed of a linear mapping function below highlight parts and a log
function for the highlight parts:
 1 ∙ < ,
 = { (5)
 2 ∙ ln ( − 3 ) + 4 ≥ ,
 ,
Rep. ITU-R BT.2446-0 19
where parameters 1 to 4 determine the tone mapping characteristics and , is the inflection
point corresponding to the knee point of SDR. The tone-mapping function can be uniquely specified
by determining the gain of the linear mapping, the inflection point at which the function is changed
from the linear mapping function to the log function, and the SDR white level corresponding to the
HDR Reference White.
The parameter 1 is determined by the gain of linear mapping below the inflection point, for example,
from the relationship between the skin tones in SDR and HDR content.
The inflection point , corresponds to the knee point of SDR. Because the highlight part above
the inflection point is compressed using the log function, the inflection point should be higher than
the skin tone to maintain fresh tones. The inflection point may be set to 80% SDR; that is, equivalent
to 58.5 cd/m2 on a 100 cd/m2 SDR display, which has been found to work well. The inflection point
, is calculated as follows:
, = 58.5⁄ 1 (6)
The parameters 2 and 4 are determined by the continuous condition at the inflection point, which
is the continuous condition of the value and the first derivation, using the following equations:
2 = 1 (1 − 3 ) ∙ , (7)
4 = 1 ∙ , − 2 ∙ ln(1 − 3 ) (8)
The parameter 3 is determined by the condition that the increment of SDR linear signal from the
inflection point to the white point corresponds to that of the log function.
, − 1 ∙ , = { 2 ∙ ln ( , − 3 ) + 4 } − { 2 ∙ ln ( , − 3 ) + 4 } (9)
, ,
where , indicates the HDR linear signal corresponding to the HDR Reference White
(75%HLG) and , indicates the SDR linear signal for the white point corresponding to the HDR
Reference White.
In the condition that the gain of linear mapping is determined by the relationship of HDR and SDR
skin tones described in Annex 4 of Report ITU-R BT.2408, which is 50% HLG and 70% SDR, the
inflection point is set to 80% SDR, and the SDR white level corresponding to the HDR Reference
White is set to 96% SDR, as shown in Fig. 10, the following parameter values can be derived:
1 = 0.83802, 2 = 15.09968, 3 = 0.74204, 4 = 78.99439 (10)
By setting a different condition on the relationship of HDR and SDR levels according to different
production intent, a different set of parameter values for 1 to 4 can be derived.20 Rep. ITU-R BT.2446-0 FIGURE 10 Tone-mapping function in luminance domain 5.1.5 Conversion to RGB linear signal The tone-mapped SDR luminance signal is converted to RGB linear signals using the xy values calculated in § 5.1.3. = ( ) ∙ (11) 1− − = ( ) ∙ (12)
Rep. ITU-R BT.2446-0 21

 1.7167 −0.3557 −0.2534
 [ ] = [−0.6667 1.6165 0.0158 ] ∙ [ ] (13)
 0.0176 −0.0428 0.9421
5.1.6 Inverse crosstalk matrix
The inverse crosstalk matrix is applied to ensure that the original hues of input HDR images are
recovered.
 −1
 1 − 2α α α
 [ ] = [ α 1 − 2α α ] ∙ [ ]
 α α 1 − 2α
 1 − α −α −α
 1
 = 1−3 [ −α 1 − α −α ] ∙ [ ] (14)
 −α −α 1 − α
5.1.7 Inverse SDR EOTF
The output SDR video signals are obtained by applying the inverse SDR EOTF, as described in
Recommendation ITU-R BT.1886.
 ′

 ′
 [ ] = .1886 −1 [ ] (15)
 ′

5.1.8 Optional processing of chroma correction above HDR Reference White
In SDR production, highlight parts are sometimes intentionally expressed as white. The processing
described in this section is optionally used to shift chroma above HDR Reference White to achromatic
when the converted SDR content requires a degree of consistency for SDR production content. This
processing is applied as needed before the tone-mapping processing.
(1) Conversion of Yxy to CIE L*a*b*
The linear Yxy signals derived from the HDR input are converted into CIE L*a*b* signals. In this
conversion, the XYZ tristimulus values of the reference white point are defined by the HDR
Reference White, that is [ , , ] = [192.93, 203, 221.05].
 ∗ = 116 ∙ ( ⁄ ) − 16 (16)
 ∗ = 500 ∙ [ ( ⁄ ) − ( ⁄ )] (17)
 ∗ = 200 ∙ [ ( ⁄ ) − ( ⁄ )] (18)
where:

 = ( ) ∙ (19)
 1− −
 = ( ) ∙ (20)

 1
 3 > δ3
 ( ) = { 1 3 (21)
 (δ) ∙ ℎ

 δ = 6/29 (22)
22 Rep. ITU-R BT.2446-0
(2) Chroma correction above HDR Reference White
∗
Chroma correction is applied only on the chroma above HDR Reference White. The chroma and
∗
hue ℎ are derived from the values of a* and b*, and the correction value of chroma , is
calculated using the correction factor .
∗
= √ ∗2 + ∗2 (23)
ℎ = tan−1( ∗ ⁄ ∗ ) (24)
∗ ∗
, = ∙ (25)
1 ∗ ≤ ∗
= { ∗ − ∗ (26)
(1 − σ ⋅ ∗ − ∗ ) ∗ > ∗
where ∗ is the lightness corresponding to the HDR Reference White, ∗ is the lightness
corresponding to the HDR peak level, and σ is a user parameter that determines the degree of white
shift. When σ = 1, the corrected chroma value corresponding to ∗ is to be 0, which means that
the colour of the HDR peak level has completely shifted to white. When < 0, is set to 0.
∗ ∗ ∗
Using the above corrected value of , , the correction values of and are calculated as
follows:
∗ cos ℎ
( ∗
∗ ) = , ∙ ( ) (27)
sin ℎ
(3) Conversion of CIE L*a*b* to Yxy
The correction values of L*a*b* are converted back to linear Yxy signals. When converting to RGB
linear signals as described in § 5.1.5, the values of x and y are replaced with the values calculated in
this section.
∙ 3 > δ
= { 16 (28)
( − 116) ∙ 3δ2 ℎ
∙ 3 > δ
= { 16 (29)
( − 116) ∙ 3δ2 ℎ
∙ 3 > δ
= { 16 (30)
( − 116) ∙ 3δ2 ℎ
where:
∗ +16
= (31)
116
∗
= + (32)
500
∗
= − (33)
200
x and y are then derived as follows:
= (34)
+ +
= (35)
+ + Rep. ITU-R BT.2446-0 23 5.2 SDR to HDR conversion The conversion from SDR to HDR may be implemented as the inverse conversion described in § 5.1. Under the assumption that the optional processing described in § 5.1.8 is not included in the HDR to SDR conversion, the SDR to HDR conversion will be the mathematical inverse and therefore the round-trip conversion will be exact. 6 Feature-based comparison Methods A, B and C for tone mapping and inverse tone mapping, as discussed in §§ 3 to 5, exhibit different features that would each given them a different performance, which may benefit different use cases. To facilitate the comparison between them, Table 4 provides a brief comparison to highlight the main features of each method. TABLE 4 Features of the methods presented in this Report TMO/ITMO Feature A B C Intended primarily for Graded content Live broadcast; SDR Live broadcast content with possibly clipped areas Curve Fixed Fixed Fixed (per-session adjustable parameters) Round-trip performance Good (see Annex A1) Good Mathematical inverse Colorimetry BT.2020/2100 BT.2020/2100 / BT.709 BT.2020/2100 TMO Feature A B C 2 2 Conversion peak 1 000 cd/m 291 cd/m 1 000 cd/m2 luminance Output peak luminance 100 cd/m2 100 cd/m2 120 cd/m2 SDR signal range 0 – 100% 0 – 100% 0 – 109% Perceptual colour Yes, in No Yes, in Yxy and management optionally in CIE L*a*b* Colour volume No Yes ( ) No management Key features Produce visual match Produce a visual match Produce a visual match with HDR input with graded SDR with graded SDR content content ITMO Feature A B C 2 2 Input peak luminance 100 cd/m 120 cd/m 120 cd/m2 Conversion peak 1 000 cd/m2 291 cd/m2 1 000 cd/m2 luminance
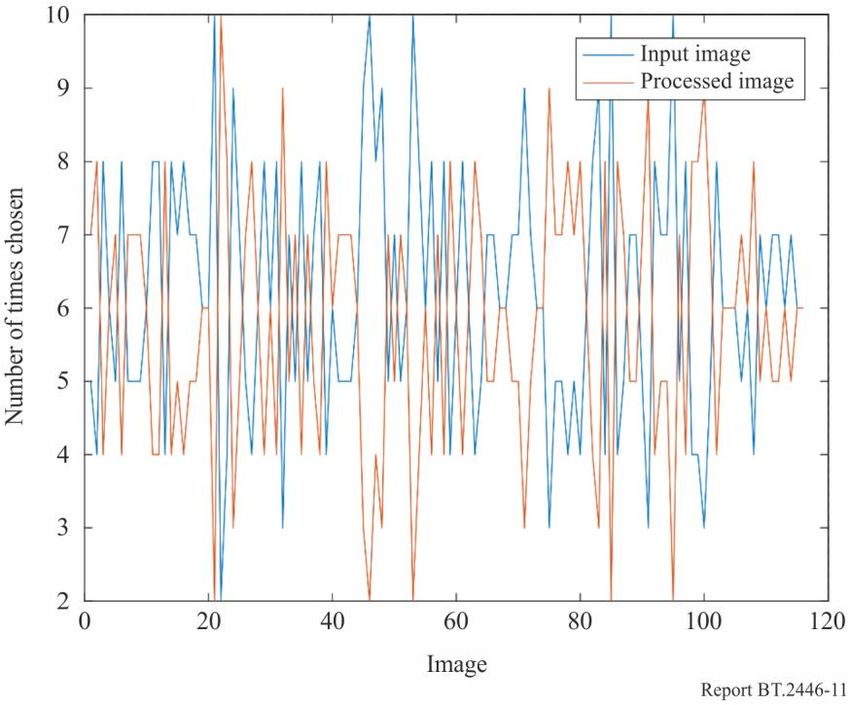
24 Rep. ITU-R BT.2446-0

 TABLE 4 (end)
 TMO/ITMO Feature A B C
 Input signal range 0-100% −7 – 109% 0 – 109%
 Related to TMO Approximate inverse of Approximate inverse of Mathematical inverse of
 TMO TMO TMO
 Perceptual colour Yes, in No Yes, in Yxy
 management
 Colour volume No No No
 management
 Key features Black level Robust to SDR content Robust to round-tripping
 management, mid-tone with large clipped areas
 preservation, visual
 match with SDR input

 Annex 1

 Evaluation of Round-Trip Performance

A1 Round-trip performance of Method A
This section reports on two psychophysical experiments that were designed to understand if observers
would be capable to observe degradation of the images under tone mapping followed by inverse tone
mapping, and under inverse tone mapping followed by tone mapping using the methods described in
§§ 3.1 and 3.25.

A1.1 Database of HDR images
A set of 115 exposure stacks sized 1920 by 1080 were obtained with a variety of cameras (Minolta,
Nikon D2h, Nikon D7100), and combined into HDRs with standard multiple exposure techniques, as
described below. Some exposure stacks were captured manually using a tripod, whereas most
exposure stacks were captured using auto-bracketing on tripod or hand-held. Auto-bracketing for the
images taken with the Nikon D2h involved 9 exposures taken one f/stop apart. A small selection of
images taken with the Nikon D7100 were captured with 3 exposures spaced 2 f/stops apart. The
Minolta camera is older than the other two cameras and did not include viable auto-bracketing
technology. Thus, each scene captured with this camera involved a variable number of exposures.
The exposures were saved as JPG images. Some more recent captures were saved in RAW format.
The exposures were captured in the Adobe RGB colour space or converted to this colour space in
post-processing. The exposures were merged into HDR images using either Greg Ward’s Photosphere

5 Note that the inverse tone mapping algorithm presented in § 3.2 is a slightly updated version from the one
 evaluated in this section. The parameter values used in this section are: = 155,
 1 = 6.3170 − 6, 1 = −1.6080 − 3, 1 = 1.2996, 2 = −6.8603 − 7, 2 = 6.6047 − 4 and 2 =
 1.1162.
You can also read