Connecting humanity Assessing investment needs of connecting humanity to the Internet by 2030 August 2020 - ITU
←
→
Page content transcription
If your browser does not render page correctly, please read the page content below
ITUPublications            International Telecommunication Union
                                              Development Sector

    Connecting humanity
    Assessing investment needs of connecting
    humanity to the Internet by 2030
    August 2020
Connecting humanity
Assessing investment needs
 of connecting humanity to
       the Internet by 2030
Acknowledgement
This study was prepared under the leadership of Doreen Bogdan-Martin, Director of the
Development Bureau of the International Telecommunication Union (ITU) and the direction of
an ITU team composed of Nancy Sundberg, Senior Programme Officer; Catalin Marinescu, Head
of the Strategy and Planning Division; and Vaggelis Igglesis, Strategy and Planning Advisor. The
study was written by A4AI (Sonia Jorge, Executive Director, with support from Nathalia Foditsch,
Senior Policy Specialist, Anju Mangal, Asia/Pacific Regional Coordinator, and Maiko Nakagaki,
Senior Strategic Partnerships Manager) based on research and analysis they conducted with Xalam
Analytics. The team would like to acknowledge the valuable contributions of Aminata Garba,
Martin Schaaper, Sofie Maddens, Esperanza Magpantay, Tomas Lamanauskas and Alex Wong.
The study is a contribution of ITU as the lead Knowledge Partner of the G20 Digital Economy Task
Force. It was developed with the kind support of the Kingdom of Saudi Arabia.
Disclaimer
The designations employed and the presentation of the material in this publication, including
maps and infographics, do not imply the expression of any opinion whatsoever on the part of
ITU and of the secretariat of ITU concerning the legal status of any country, territory, city or area
or of its authorities, or concerning the delimitation of its frontiers or boundaries.
The mention of specific companies or of certain manufacturers’ products does not imply that
they are endorsed or recommended by ITU in preference to others of a similar nature that are
not mentioned.
All reasonable precautions have been taken by ITU to verify the information contained in this
publication. However, the published material is being distributed without warranty of any kind,
either expressed or implied. The responsibility for the interpretation and use of the material lies
with the reader.
The opinions, findings and conclusions expressed in this publication do not necessarily reflect
the views of ITU or its membership.
© ITU 2020
International Telecommunication Union Place des Nations CH-1211 Geneva, Switzerland
Some rights reserved. This work is licensed to the public through a Creative Commons Attribution-
Non-Commercial-Share Alike 3.0 IGO licence (CC BY-NC-SA 3.0 IGO).
Under the terms of this licence, you may copy, redistribute and adapt the work for non-commercial
purposes, provided the work is appropriately cited. In any use of this work, there should be no
suggestion that ITU endorse any specific organization, products or services. The unauthorized use of
the ITU names or logos is not permitted. If you adapt the work, then you must license your work under
the same or equivalent Creative Commons licence. If you create a translation of this work, you should
add the following disclaimer along with the suggested citation: “This translation was not created by
the International Telecommunication Union (ITU). ITU is not responsible for the content or accuracy
of this translation. The original English edition shall be the binding and authentic edition”. For more
information, please visit https://creativecommons.org/licenses/by-nc-sa/3.0/igo/
Foreword

For those living in the world’s handful of highly-connected countries, it can come as a shock
to learn that nearly half the global population aged 10 years and over – equating to some
three billion people – has never used the Internet. Many of the unconnected live in rural and
remote areas, where connectivity remains a challenge. A disproportionate number are women,
particularly in Africa and South Asia, where the digital gender divide is particularly marked. And
of course most are poor, lack basic literacy, and, with only limited digital exposure, see little
value in getting online.

In a post-COVID world, this dire state of affairs is no longer something the world can live with.
With the pandemic pushing so many essential services online, we face a real and present danger
of those without broadband access being left ever further behind. This was not the vision global
leaders signed up to we committed to meet the SDGs by 2030.

With just ten years remaining, this timely new report asks: What will it take to connect the world?
How much investment is needed, where are the global ‘pain points’, and how can we mobilize
the unprecedented levels of financing needed to extend networks to unserved communities?

Dramatically changing the picture will mean dramatically changing the way we work. Business-
as-usual is not going to connect the remaining half of humanity. Cooperation is a must but
it is not enough. We need innovative ways of connecting people, fostering innovation, and
promoting new technologies. It is up to us to find new ways of collaborating on solutions to
chronic financing barriers, investment brakes, and implementation hurdles.

As this report argues, enlightened, enabling regulatory frameworks can play a big part. So can
a more cooperative approach between the many different players in the digital ecosystem. And
if we are to stimulate, rather than stymie, network deployment, government policies need to
prioritize broadband as basic infrastructure, as essential for development in the digital age as
transport, energy and water networks.

This comprehensive new report estimates that achieving universal access to broadband will
require bringing over three billion people online in the next ten years, at an estimated cost of
USD428 billion. While this is an ambitious aim, it is in no way an unachievable one. It is my hope
that as part of ITU’s Connect 2030 Agenda efforts, this major new ITU contribution will provide
clear, coherent evidence-based guidance for countries that will help them accelerate efforts
to reach unconnected communities, so that equality of opportunity is finally within reach of all.

                                                                     Doreen Bogdan-Martin
                                                                                  Director
                                                 Telecommunication Development Bureau, ITU

                                                                                                 iii

Table of Contents
Acknowledgement����������������������������������������������������������������������������������������������������������������������������� ii

Foreword�������������������������������������������������������������������������������������������������������������������������������������������� iii

Index of boxes, figures and table����������������������������������������������������������������������������������������������������vi

1.      Introduction and background ������������������������������������������������������������������������������������������������ 1

2.      Approach and methodology �������������������������������������������������������������������������������������������������� 3

3.      Investment requirements to connect humanity: Global outlook��������������������������������������� 4

4.      Investment requirements to connect the unconnected: Regional outlook���������������������� 7

        4.1.      Investment requirements by regions and income groups�������������������������������������� 7
        4.2.      The structure of investment requirements by regions��������������������������������������������� 8
        4.3       Beyond infrastructure needs: Affordability, digital skills and local content ��������� 9

5.      Next steps: What should be done next?������������������������������������������������������������������������������12

        5.1.      Fostering an Enabling Policy and Regulatory Environment ���������������������������������12
        5.2       Developing a clear roadmap �������������������������������������������������������������������������������������14
        5.3       Securing financing�������������������������������������������������������������������������������������������������������15

6.      Conclusion��������������������������������������������������������������������������������������������������������������������������������17

Abbreviations �����������������������������������������������������������������������������������������������������������������������������������18

Annexes���������������������������������������������������������������������������������������������������������������������������������������������19

Annex A: Key model parameters and methodology����������������������������������������������������������������19

Annex B: A Closer look at the investments needed in the G20 countries������������������������������25

                                                                                                                                                        v
Index of boxes, figures and table

Boxes

     Box 1 — Device costs in low and middle-income countries remain a key barrier������������ 11
     Box 2 — ICT regulatory maturity worldwide��������������������������������������������������������������������������� 12

Figures

     Figure 1 — The unconnected: Where they were in 2019������������������������������������������������������� 2
     Figure 2 — 4G broadband penetration in 2019 (based on unique users)�������������������������� 2
     Figure 3 — Investment needed to achieve universal access to broadband
     connectivity by 2030������������������������������������������������������������������������������������������������������������������� 4
     Figure 4 — Percentage of required CAPEX that is greenfield investments������������������������� 5
     Figure 5 — ITU broadband map ����������������������������������������������������������������������������������������������� 6
     Figure 6 — Investment needed by regions and income groups������������������������������������������ 7
     Figure 7 — Top 25 countries based on the size of investment requirements (in
     USD billion)���������������������������������������������������������������������������������������������������������������������������������� 8
     Figure 8 — Investment requirements by key category and region��������������������������������������� 9
     Figure 9 — 4G Coverage of population by region (2019)��������������������������������������������������� 10
     Figure 10 — ITU generations of regulation���������������������������������������������������������������������������� 13
     Figure 11 — Roadmap for universal access to affordable and good quality
     broadband �������������������������������������������������������������������������������������������������������������������������������� 15
     Figure 12 — Financing the investment needs: Indicative cost sharing ����������������������������� 16
     Figure A.1 — Model logical flow���������������������������������������������������������������������������������������������� 22
     Figure A.2 — Key drivers of differences in investment requirements �������������������������������� 22
     Figure A.3 —Model structure���������������������������������������������������������������������������������������������������� 23
     Figure A.4 — Example of model structure calculations for Sub-Saharan Africa �������������� 24
     ������������������������������������������������������������������������������������������������������������������������������������������������������ 24
     Figure B.1. Total Investments needed in the G20 countries���������������������������������������������� 25
     Figure B.2. Investments across the G20 countries (USD billion)���������������������������������������� 25

Table

     Table 1 — The “golden rules” for fixed and mobile broadband adoption ����������������������� 14

vi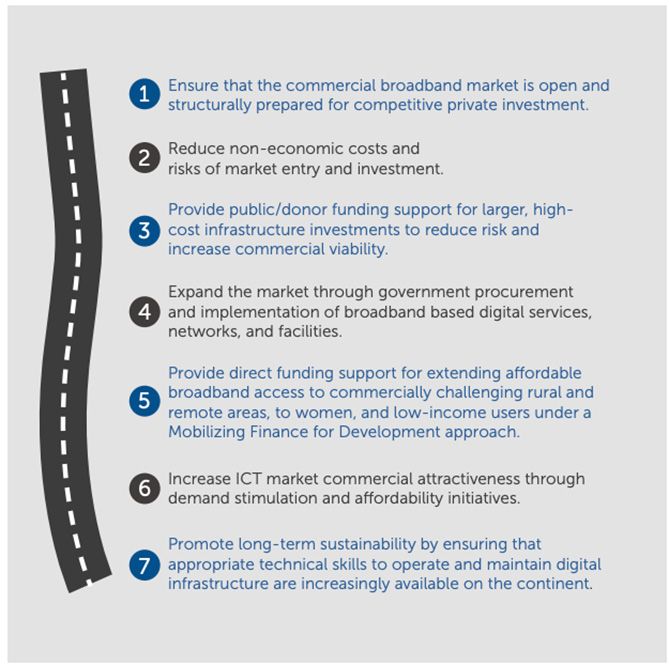
Connecting humanity
1. Introduction and background
Assessing the investment needed to provide universal and affordable access to the Internet for
all of humanity by 2030 is a considerable challenge. The good news is the clear commitment of
the G20 countries to prioritize “connectivity of individuals, households, businesses, industries
and the public sector, taking into particular consideration remote areas and vulnerable groups”,1
as set out in the G20 Digital Economy Ministerial Declaration of 2018. The Declaration has,
indeed, explicitly highlighted the importance of such a goal2 and the role of the G20 Digital
Economy Task Force (DETF), since its inception in 2017. Connectivity has become an even
greater priority over the past months, as the world has faced an unprecedented pandemic
(COVID-19) which has exposed different types of inequalities within and across countries and
regions, including those related to quality of access, affordability and use of the Internet. Thus,
assessing investment requirements to reach affordable universal connectivity matters to the G20
countries and to any country concerned with the ability to achieve the Sustainable Development
Goals (SDGs).
In this study, the International Telecommunication Union (ITU), the official Knowledge Partner
of the G20 Digital Economy Task Force, analyses the investment needed to achieve universal,
affordable broadband for all of humanity by 2030. For the purposes of this analysis, and
throughout this study, reference to broadband should be understood to mean a 4G equivalent
connection, and the target population as those aged 10 years and above. The study provides
an overview on the investment required for all countries of the world3, examining costs at both
the global and regional levels associated with infrastructure needs, policy and regulatory reform
and basic digital skills and local content.
In 2019, approximately three billion people (aged 10 years and above) around the world
were still unconnected to broadband, which is nearly half of the global adult population.4
Over 12 per cent of the unconnected population lives in remote, rural locations where traditional
networks are not easily accessible. Furthermore, the digital gender gap is still a major challenge.
Across the globe, more men than women use the Internet with only 48 per cent of women
compared to 58 per cent of men.5 This is further amplified in developing regions, where
the mobile Internet gender gap is as high as 51 per cent and 37 per cent in South Asia and
Sub-Saharan Africa, respectively.6 Taking all of this into account, achieving the 2030 goal of
connecting everyone in the world will require bringing over three billion people online in the
next 10 years, of which the majority are in Africa and South Asia7 (see Figures 1 and 2 below).
1
G20 Argentina. 2018. G20 Digital Economy Ministerial Declaration. https://g20digitalrepo.org/G20%20DETF
%20Ministerial%20Declaration%20Salta.pdf, pg. 5.
2
The goal established in the G20 Digital Economy Ministerial Declaration (Salta Declaration) was to provide
universal and affordable connectivity to all people by 2025, not 2030 (see G20 Argentina, 2018).
3
The latest World Bank country and income group classifications were used for this study. See: World Bank
Country and Lending Groups, https://datahelpdesk.worldbank.org/knowledgebase/articles/906519-world
-bank-country-and-lending-groups.
4
Using a broadband definition based on average download speeds > 10 Mbit/s, with 4G as the primary proxy;
target population defined as aged 10 and above.
5
International Telecommunication Union (ITU). 2019. Measuring digital development: Facts and figures 2019.
https://www.itu.int/en/ITU-D/Statistics/Documents/facts/FactsFigures2019.pdf, pg 3-6.
6
GSMA, The Mobile Gender Gap Report 2020. https://www.gsma.com/mobilefordevelopment/wp-content/
uploads/2020/05/GSMA-The-Mobile-Gender-Gap-Report-2020.pdf
7
Estimates based on GSMA, ITU, United Nations (UN) population data.
1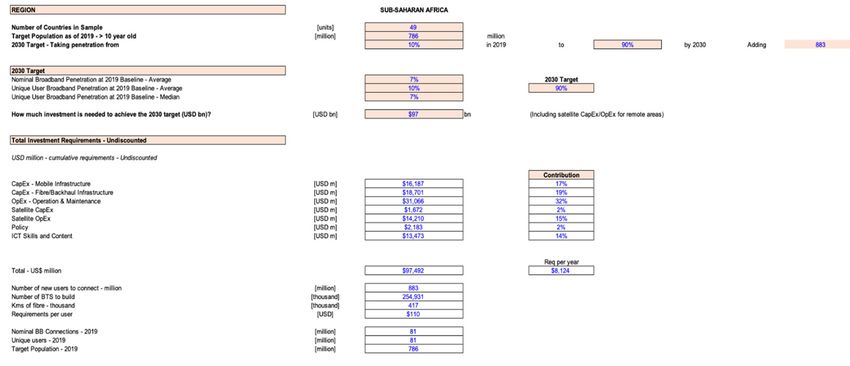
Connecting humanity
Figure 1 — The unconnected: Where they were in 2019
Sources: Estimates based on GSMA, ITU, UN population data
Figure 2 — 4G broadband penetration in 2019 (based on unique users)
Sources: Estimates based on GSMA and UN population data, with Xalama analysis
This study expands upon the Broadband Commission for Sustainable Development report,
Connecting Africa Through Broadband: A Strategy for doubling connectivity by 2021 and
reaching universal access by 20308, which looks at the investment needs to achieve universal,
affordable broadband access by 2030 for all of Africa. The work presented hereunder uses
the same approach and methodology while exploring additional primary and secondary data
sources to examine investment needs of the entire world.9
8
Broadband Commission for Sustainable Development (Broadband Commission). 2019. Connecting Africa
Through Broadband: A Strategy for doubling connectivity by 2021 and reaching universal access by 2030.
https://www.broadbandcommission.org/Documents/working-groups/DigitalMoonshotforAfrica_Report.pdf
9
The report uses the following data sources: GSMA, UN, World Bank, Alliance for Affordable Internet (A4AI),
Xalam Analytics, World Economic Forum and ITU.
2Connecting humanity
2. Approach and methodology
To analyse the investment required to achieve universal access to broadband connectivity for the
entire world by 2030, this study examines investment estimates for infrastructure, skills, content
and policy. The model takes a country-level approach, using the number of unconnected users as
a foundational baseline to estimate the level of investment required to achieve universal access
to broadband connectivity. The number of unconnected refers to total users not connected
to a 4G or equivalent connection (for mobile and fixed broadband if relevant) according to
the assumptions outlined below.
Once the number of unconnected users is determined, the model estimates the scale of
infrastructure requirements needed to serve this population in terms of radio base stations
and supporting backhaul infrastructure, and adjusting for individual country or regional
considerations (based, for example, on coverage, the number of customers to be served per
base transceiver station (BTS) and on given country traffic patterns)).
These infrastructure requirements are then translated into estimates of capital expenditure
(CAPEX), operating expenditure (OPEX) and maintenance costs, based on prevailing market
numbers available from telecommunication operators around the world, with the necessary
calibration for market differences; existing levels of infrastructure deployment; inflation and
other factors. Related but separate estimates are generated for fibre backbone deployment
costs, where such infrastructure is still required to achieve universal access to broadband;
satellite costs for reaching remote populations; and policy, skills and content costs to provide
the optimal context for the infrastructure to be deployed and utilized.
The key assumptions used for this study are:
• Good quality broadband Internet, defined as an average download speed of at least 10
Mbit/s and as technology neutral (meaning that data may be transmitted via cable, fibre,
satellite, radio, or other technologies).
• 4G, used as the proxy for mobile broadband, and fixed broadband applied where
most relevant.
• The target population aged 10 and older, used as the baseline for calculating broadband
penetration — and universal access to connectivity, defined as 90 per cent penetration of
the population aged 10 and older.
• The model, while based on estimates on a country-by-country basis across a sample of 218
countries and economies, carries some constraints with respect to country-level granularity
and makes occasional region-wide, or cluster-based assumptions. For key network OPEX
and CAPEX assumptions, the model relies on data from a sample of “anchor countries”.
Annex A on key model parameters and methodology provides further details.
For this study, the population of 10 years of age and older was set as a parameter for estimating
the levels of broadband penetration and is different from ITU’s calculations of unconnected
population (which take into account zero-year-olds and above).10 This parameter was also
selected bearing in mind the many legal and regulatory frameworks around the world that aim
to protect children’s privacy and data.11
10
ITU, Measuring digital development: Facts and figures 2019.
11
Broadband Commission, 2019, Connecting Africa Through Broadband: A Strategy for doubling connectivity
by 2021 and reaching universal access by 2030. https://www.broadbandcommission.org/Documents/
working-groups/DigitalMoonshotforAfrica_Report.pdf
3Connecting humanity
3. Investment requirements to connect humanity: Global outlook
Nearly USD 428 billion is required to achieve universal access to broadband connectivity
by 2030 at the global level (see Figure 3). This amount includes significant investment in
infrastructure, investments to design and implement policy and regulatory frameworks that
incentivize and promote growth in broadband connectivity and investments to support and
equip populations around the world with the necessary basic digital skills (the skills necessary
to navigate the Internet and to use commonly available local applications) and the content
needed to benefit meaningfully from broadband access and use.
Achieving the target of connecting all of humanity to broadband Internet by 2030 is, above all,
an infrastructure investment challenge. Around 2.6million 4G BTS and700 000 km of backbone
fibre transmission infrastructure would have to be rolled out on top of the existing broadband
network capabilities. Around 90 per cent of the required investments are directly tied to the
need to roll out and maintain broadband networks to support the additional connected user
base and related traffic. In addition, 40 per cent of total investments would have to be allocated
to CAPEX buildout for last mile broadband and transmission networks capable of reaching and
serving at least 90 per cent of the target population.
Figure 3 — Investment needed to achieve universal access to broadband
connectivity by 2030
~USD428 billion is needed to achieve universal access to
broadband connectivity across the world
450
ICT skills and content ~USD40 billion
400
Policy and regulation ~USD6 billion
350 Remote Area Coverage
~USD70 billion
300
250 Network operation and maintenance
USD billion
~USD140 billion
200
150
Metro and backbone fibre
~USD70 billion
100
50 Mobile infrastructure CAPEX
~USD104 billion
0
Sources: Estimates based on ITU, GSMA, A4AI, operator and regulator data
4Connecting humanity
This shows that deploying new infrastructure and upgrading the existing one will be necessary
to guarantee a 4G equivalent connection to everyone. While in some regions bridging the
connectivity gap predominantly means upgrading existing coverage and capacity sites, nearly
half of the required radio access network (RAN) infrastructure investment in Sub-Saharan Africa,
South Asia and East Asia/Pacific will be greenfield (see Figures 4 and 5). This increases the
overall weight of investments in such regions to a large extent, especially given the fact that
greenfield CAPEX often demands equity premium. Moreover, considerably more capacity would
be needed as technology evolves and demand grows, and this means existing infrastructure
reach and capacity will constantly need to be expanded12.
Figure 4 — Percentage of required CAPEX that is greenfield investments
Sources: Estimates based on ITU, GSMA, A4AI, operator and regulator data
12
Refer to Annex B for investment breakdown for G20 countries, which account for 50 per cent of global
investment requirements.
5Connecting humanity
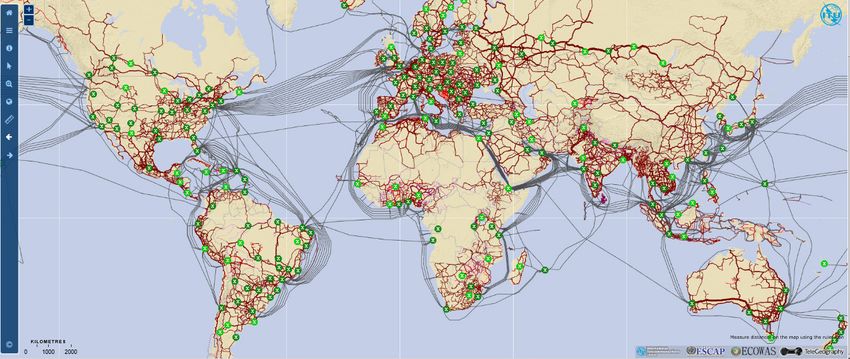
Figure 5 — ITU broadband map
Note: The Interactive Transmission Maps are a cutting-edge ICT-data mapping platform to take stock of
national backbone connectivity (optical fibre, microwaves and satellite Earth stations) as well as of other key
metrics of the ICT sector. The map is validated by network operators and administrations through the ITU
regional offices and recorded in the Validation Framework. Underlying the map is a database, containing
records of each individual link.
The following indicators are either compiled or calculated from this database: i) Transmission network length
(route kilometress); ii) Node locations; iii) Equipment type of terrestrial transmission network; iv) Network
capacity (bit rate); v) Number of optical fibre within the cable; vi) Operational status of the transmission
network indicator; vii-a) Percentage of population within reach of transmission networks; vii-b) Percentage of
area within reach of transmission networks.
Source: ITU13
13
https://www.itu.int/itu-d/tnd-map-public/
6Connecting humanity
4. Investment requirements to connect the unconnected:
Regional outlook
4.1. Investment requirements by regions and income groups
The challenges described above present a situation in which new types of global investments
will be needed, as well as new ways of thinking about them. To scale operations and to achieve
economic benefits offered by universal and affordable broadband Internet access, significant
investment is undoubtedly required for the Sub-Saharan Africa, South Asia, and East Asia/Pacific
regions (see Figure 6). Nearly 70 per cent of the investment required will need to be allocated to
low and lower middle-income economies, particularly the unconnected population living in rural
and remote areas (see Figure 6). At a broad level, the distribution of investment requirements
is a function of the overall size of the unconnected population. The regions just cited account
for around half of the unconnected population and 55 per cent of required investments. At
the same time, the economic and social contexts vary across regions, with unique realities that
must be addressed to achieve universal meaningful connectivity.
Figure 6 — Investment needed by regions and income groups
*Country and ncome groups based on World Bank classification.
SSA (Sub-Saharan Africa) and MENA (Middle East and North Africa)
Sources: Xalam estimates based on ITU, GSMA, A4AI, operator and regulator data
When examined at the country level, the top 25 countries in need of investment account for
nearly 75 per cent of all the investment requirements at USD 312 billion. Further, 20 of these
25 countries are in Sub-Saharan Africa, East Asia/Pacific and South Asia and all are low and
lower-middle income countries.
7Connecting humanity
Figure 7 — Top 25 countries based on the size of investment requirements
(in USD billion)
Sources: Estimates based on ITU, GSMA, A4AI, operators and regulators data
4.2. The structure of investment requirements by regions
Investment requirements vary according to each country and region, and greatly depend on
the level of economic development of the country; the level of its investment in infrastructure,
the policy framework in place and the different geographical and demographic conditions.14 A
number of characteristics were selected (see Figure 8) to examine the structure of investments
by region. The weight of CAPEX requirements is most significant in South Asia, East Asia and
the Pacific and Africa, and requires long-term investments. In contrast, the OPEX requirements
are relatively more significant in other regions with ongoing and/or recurring costs primarily
associated operations and maintenance of existing networks, such as electricity supply costs.
In addition to affordability issues, the need to boost investments for improving or building
Internet user ICT skills and support the development of relevant content is most pressing in
Sub-Saharan Africa.
Connecting populations in remote and rural areas accounts for around a fifth to a quarter
of investment requirements in Africa and in East Asia/Pacific. Reaching remote and rural
communities poses added obstacles and challenges, including demographic and geographic
barriers. Small landlocked countries and Pacific Island countries and territories require larger
OPEX and CAPEX due to different factors such as reduced economies of scale, higher
international transit costs and interconnection rates (See A4AI, 2018).15 This warrants a new
approach to address the challenges of remote rural areas, from sound policy and regulatory
frameworks to innovative public-private partnerships (PPPs) to support the investments needed
to secure universal access to broadband in those regions.16
14
Refer to Annex A for more details on key drivers of differences in investment requirements.
15
A4AI. Affordability Report 2018. See https://a4ai.org/affordability-report/report/2018/
16
For more information and recommendations specific to rural digital development see A4AI’s Rural Broadband
Policy Framework and ITU’s Broadband development and connectivity solutions for rural and remote areas .
8Connecting humanity
Figure 8 — Investment requirements by key category and region
Sources: Estimates based on ITU, GSMA, A4AI, operator and regulator data
4.3 Beyond infrastructure needs: Affordability, digital skills and
local content
It is important to highlight that approximately 85 per cent of the global population is already
covered by global broadband networks, and around 70 per cent of the global unconnected
are within a 4G coverage area (see Figure 9). Yet, in Sub-Saharan Africa, around 80 per cent of
those covered by a 4G network are not connected because of lack of affordable access,17 limited
relevant content and the skills to benefit from Internet access. Such realities disclose economic
and social disparities which affect the rate of adoption, use and ultimately the opportunity to
benefit from broadband access. While only 15 per cent of the global population might be in
areas that are not covered by broadband, the reality is that the percentage of persons without
“meaningful connectivity” is much higher, and for this reason it is also crucial to think beyond
infrastructure.
As the Broadband Commission highlighted in the 2019 State of Broadband report, the concept
of meaningful universal connectivity “encompasses broadband adoption that is not just available,
accessible, relevant and affordable, but that is also safe, trusted, empowering users and leading
to positive impact”.18
17
According to A4AI’s Affordability Report 2019, only 10 out of 45 African countries have affordable internet,
calculated as 1 GB of mobile prepaid data of 2% or less of average monthly income. See: A4AI, 2019.
Affordability Report 2019, Africa Regional Snapshot, https://1e8q3q16vyc81g8l3h3md6q5f5e-wpengine
.netdna-ssl.com/wp-content/uploads/2019/12/AR2019_Africa-Regional_Screen_AW.pdf.
18
Broadband Commission. 2019. The State of Broadband 2019: Broadband as a Foundation for Sustainable
Development. https://www.itu.int/dms_pub/itu-s/opb/pol/S-POL-BROADBAND.20-2019-PDF-E.pdf
9Connecting humanity
Figure 9 — 4G Coverage of population by region (2019)
Sources: estimates based on GSMA, Xalam, UN population data
In order to build on and benefit from broadband infrastructure it is, therefore, imperative to
focus on and invest in complementary initiatives that will support billions to be connected. This
requires a more holistic approach to broadband investment, one which encompasses innovative
and collaborative policy and regulatory approaches as well as strategies to stimulate demand
for broadband services — increase and support device affordability; affordability of data and
services; as well as digital skills programmes and content, with a special focus on closing the
digital gender divide given that the majority of people offline today are women19.
19
ITU, Measuring digital development: Facts and figures 2019.
10Connecting humanity
Box 1 — Device costs in low and middle-income countries remain
a key barrier
The Alliance for Affordable Internet (A4AI)’s new study Estimated cost of a new
of device costs in low- and middle-income countries1 smartphone as a fraction
estimates that nearly 2.5 billion people live in countries of average monthly
where the cost of a smartphone is a quarter or more of income (March 2020).
the average monthly income. This is equal to what the
average European household spends on housing and Region Cost
utilities as a fraction of their monthly income.
Africa 62.8%
The report benchmarks the cost of a smartphone
across different countries in the “Global South”. This Americas 11.7%
barrier remains high across different regions (see table
right); however, at the country level, consumers can Asia–Pacific 16.2%
face completely different markets, with extremely wide (excluding
smartphone price ranges. Several factors influence India*)
the retail price that a user can expect to pay for a new
smartphone – in many cases, that price is still too high. *Estimated at 206 per cent in
India.
Source: A4AI, 2020
Estimated cost of an Feature phones/Internet-capable devices and other
Internet-capable device as a entry devices can help scale the affordability problem.
fraction of average monthly These devices offer a number of the key functionalities
income (March 2020). of a smartphone, along with several of the benefits of
Internet access.
Region Cost
They also lower the price threshold for a first-time
user who may have yet to build extensive digital skills
Africa 49.5%
or experiences that would justify the expense of a
Americas 10.0% more high-end device. These numbers more readily
approach parity at the price level; however, when we
Asia–Pacific 16.9% understand these prices as percentages of average
(excluding India) monthly income, the disparities of affordability are
evident (see table left).
Source: A4AI, 2020
Some countries see enormous jumps in affordability with feature phones. While
they are not found in all analysed markets, the cheapest feature phones offer, on
average, an Internet-capable device at 50 per cent or less of the cost of the cheapest
smartphone available in the market. One extreme example is India, where one
particular phone model represented 23.9 per cent of average monthly income
compared to the cheapest smartphone on sale by the operator, sold at more than
twice the average monthly income in the country.
1
Alliance for Affordable Internet (2020). From luxury to lifeline: Reducing the cost of mobile
devices to reach universal internet access. Web Foundation. https://a4ai.org/research/from
-luxury-to-lifeline-reducing-the-cost-of-mobile-devices-to-reach-universal-internet-access/
11Connecting humanity
5. Next steps: What should be done next?
A number of key actions are critical to secure the investment needed to achieve the 2030 target.
It is also crucial to undergo constant re-evaluation as demand increases, technology evolves
and social and political scenarios change.
5.1. Fostering an Enabling Policy and Regulatory Environment
Establishing an enabling policy and regulatory environment is essential to foster predictability
and consequently attract long-term investment and support the digital economy, especially in
low and lower and middle income countries. As this study highlights, having innovative policy
and regulatory frameworks is critical to achieving the 2030 targets. ITU has provided extensive
guidance to policy-makers around the world on how to approach policy and regulatory
challenges and opportunities. The study stresses the importance of collaboration in all aspects
of policy-making and regulatory support (see Figure 10).
Box 2 — ICT regulatory maturity worldwide
ITU regulatory metrics sets out the levels of maturity of regulatory frameworks for the
ICT sector and for the digital economy itself. The analysis shows that while digital has
been gaining ground and shaping regulatory response, more remains to be done.
Today, 8 per cent of countries have holistic, forward-looking regulatory frameworks
in place enabling digital transformation across their economies (G5) and more than
50 additional countries have achieved G4 (integrated ICT regulation led by social
and economic goals), being the countries with the lowest proportion of unconnected
population and having thriving markets for ICT services. In stark contrast, as many as
40 per cent of countries languish in G1 or G2, missing development opportunities
and running the risk of remaining disconnected from global digitization and how
this can transform their economies and attract greater investment. More than half of
the world’s population is concentrated in G2 and G3 countries, poised to leapfrog to
near-universal digital inclusion and lead vibrant ICT markets. A quarter of countries is
only half way through the journey, still in the G3 category: making steady progress in
strengthening policy and regulatory frameworks but unable to unlock the full potential
of ICT markets.
Source: Adapted from ITU. 2020. Global ICT Regulatory Outlook 2020 - Pointing the way forward to
collaborative regulation.
https://itu.foleon.com/itu/global-ict-regulatory-outlook-2020/home/
12Connecting humanity
Figure 10 — ITU generations of regulation
Source: ITU
The golden rules for fixed and mobile broadband adoption outlined in Table 1 were developed
by ITU (2020) and were designed as “regulatory recipes” for successful fixed and mobile
deployment and adoption. Analysis shows how the golden rules are accelerating take-up of
mobile broadband and fixed broadband alike removing barriers and incentivizing various
stakeholders and market players. These rules highlight the actions and decisions that are likely to
support sector growth and development, and provide evidence of their impact across regions.20
21
Chapter 3 of the Global ICT Regulatory Outlook 2020 (ITU, 2020) provides a concise summary
of the golden rules.
20
ITU. 2020. Global ICT Regulatory Outlook 2020 - Pointing the way forward to collaborative regulation. https://
itu.foleon.com/itu/global-ict-regulatory-outlook-2020/home/
21
ITU’s ICT Regulatory Tracker https://www.itu.int/net4/itu-d/irt/#/tracker-by-country/regulatory-tracker/2018
13Connecting humanity
Table 1 — The “golden rules” for fixed and mobile broadband adoption
Golden rules
Fixed broadband Mobile broadband
Market approach General authorization regime Band migration allowed
Infrastructure sharing Infrastructure sharing mandated Co‐location/site sharing
mandated
Competition Full competition in cable modem, Number portability available to
DSL, fixed wireless broadband consumers and required from
mobile operators
Legal concept of dominance or Full competition in IMT (3G, 4G,
significant market power (SMP) etc.) services
Full competition in international Full competition in
gateways international gateways
Foreign Foreign participation/ownership in No restrictions to foreign
participation/ Internet service providers (ISPs) participation/ownership in
ownership spectrum-based operators
Quality of service Quality of service monitoring required
Source: Adapted from ITU, 2020
5.2 Developing a clear roadmap
Developing a clear roadmap is key to turning high-level strategies and plans into concrete
steps that can be followed by decision-makers, policy-makers and regulators. The golden rules
presented above provide valuable “recipes” defined through ITU’s vast experience in assisting
governments to strengthen their policy and regulatory frameworks. Further, several studies have
already provided in-depth analysis of goals, best practice, guidelines and roadmaps upon which
this study builds.22 While general roadmaps provide critical guidance, it is important that these
be adapted and adjusted to meet the needs and realities of the country and environment where
they are being applied. To achieve the 2030 target, in addition to the estimated investment costs,
a clear strategy and roadmap are needed. The main features of the broadband development
roadmap by 2030 may include a similar sequence of objectives, as those suggested in the
Broadband Commission’s report, Connecting Africa Through Broadband (see Figure 11). It is also
critical for policy-makers to embrace a “whole-of-government approach,” one which is holistic,
includes a whole-of-government investment strategy and integrates planning, design and
delivery of services through well-coordinated efforts across all relevant ministries in a country.23
22
Examples are the ITU Best Practices Guidelines and the UN Secretary-General’s Roadmap for Digital
Cooperation.
23
For a detailed discussion of this approach, see ITU, 2020, Building Smart Villages: A Blueprint.
14Connecting humanity
Figure 11 — Roadmap for universal access to affordable and good quality
broadband
Source: Broadband Commission, 2019
5.3 Securing financing
With an estimated USD 428 billion needed to connect all of humanity to the Internet by 2030,
an unprecedented multi-stakeholder effort will be required to finance this goal. In line with the
recommendations from the report of the Broadband Commission for Sustainable Development,
this study also recommends drawing mostly private investments for infrastructure and public
investments for skills and policy24.
Public investment and financing sources should include government funds, development aid
and multilateral banks. Additional sources and financing mechanisms are also being considered
by the Broadband Commission for Sustainable Development’s Working Group on 21st Century
Financing Models for Sustainable Broadband Development 25 and Working Group on School
Connectivity,26 both created in September 2019. Such groups understand it is crucial to
develop investment, funding and financing mechanisms that go beyond the traditional ones
outlined above. Further, public-private partnerships have also been instrumental in expanding
infrastructure and strengthening affordability through the absorption of early stage risks and
24
Broadband Commission, 2019, Connecting Africa Through Broadband: A Strategy for doubling connectivity
by 2021 and reaching universal access by 2030.
25
Broadband Commission’s Working Group on 21st Century Financing Models for Sustainable Broadband
Development. See https://broadbandcommission.org/workinggroups/Pages/WG6-2019.aspx
26
Broadband Commission’s Working Group on School Connectivity. See https://broadbandcommission.org/
workinggroups/Pages/WG5-2019.aspx
15Connecting humanity
building infrastructure to be used by new entrants, as the experience of Sao Tome and Principe,
Nigeria, Uganda and South Africa show27.
An indicative cost sharing for the estimated USD 428 billion investment needs suggests that
about USD 288 billion in infrastructure investment may be covered by the private sector, while
about USD 140 billion in investment will be required by public sources (see Figure 12). These
amounts and percentages were calculated based on the same rationale proposed by the “World
Bank Group’s Mobilizing Finance for Development (MFD) approach”28, which assumes that
public resources should be targeted at areas that are not perceived as viable to the private
sector. As Figure 12 illustrates, private investments should be primarily focused on infrastructure
while public investments should be focused on both infrastructure and skills development.
This does not mean that all other parts of society should not be involved in investing in digital
skills, but rather that the public sector needs to be responsible for providing basic skills to all
citizens, allowing them to use applications that are common in their locations and to navigate
the Internet to their benefit.
Figure 12 — Financing the investment needs: Indicative cost sharing
Source: A4AI (2020)
27
Id.
28
See World Bank’ Group’s Mobilising Finance for Development (MFD): https://w ww. worldbank. org/e
n/a
bout/
partners/maximizing-finance-for-development#:~:text=Maximizing%20Finance%20for%20Development
%20(MFD) % 20is % 20the % 20World % 20Bank % 20Group's , support % 20developing % 20countries'
%20sustainable%20growth.
16Connecting humanity
6. Conclusion
No single actor alone can achieve the ambitious goal of connecting everyone to universal,
affordable broadband connectivity by 2030. As this study outlines, different stakeholders should
come together to tackle the challenge. The investment should take a regional approach — with
a special focus on Sub-Saharan Africa and South Asia — to bring the unconnected online in the
next 10 years. While infrastructure investment is the main challenge, investing in policy and
regulatory reform and digital skills and local content development are also critical. What is more,
complementary efforts on improving affordability — of data, devices and services — will be key
to helping close the global digital divide. As ITU is committed to connecting all the world's
people, wherever they live and whatever their means, through these analysis, together with ITU’s
Connect 2030 Agenda efforts, connecting all of humanity will get closer to becoming a reality.
17Connecting humanity Abbreviations A4AI Alliance for Affordable Internet BTS Base transceiver station CAPEX Capital expenditure GSMA GSM Association ICT Information and communication technologies IMT International Mobile Telecommunications ITU International Telecommunication Union LATAM Latin America MENA Middle East and North Africa OPEX Operational expenditure PPP Public- private partnerships RAN Radio access network SSA Sub-Saharan Africa UN United Nations 3G Third-generation mobile telecommunication technology 4G Fourth-generation mobile telecommunication technology 5G Fifth-generation mobile telecommunication technology All dollar amounts are US dollars unless otherwise indicated. 18
Connecting humanity

Annexes

Annex A: Key model parameters and methodology                                          29

Model parameters
•      The focus and scope of the modelling exercise are strictly on estimating the cost to achieve
       the stated targets – namely anticipated capital expenditures, infrastructure operation and
       maintenance costs, and policy and skills CAPEX. While other components of feasibility
       are acknowledged to warrant strong consideration (notably service affordability, economic
       feasibility, sources of funding and a broad assessment of the sustainability of the proposed
       investments), they are beyond the scope of this particular modelling exercise. These
       additional factors can be assessed in more detail in separate, dedicated phases of analysis.
•      While based on estimates on a country-by-country basis across a sample of 218 countries
       and economies, the model carries some constraints with respect to country-level granularity,
       and makes occasional region-wide, or cluster-based assumptions. The resulting estimates
       should thus be considered high-level and directional in nature. More detailed country
       modelling must be carried out to get a deeper picture of individual country investment
       requirements and constraints.
•      The modelling for this exercise uses a variety of data sources, principally the ITU datasets,
       GSMA Intelligence, A4AI’s Affordability Drivers Index, The World Bank database, the United
       Nations, The World Economic Forum and extensive data collected by Xalam Analytics.

Defining broadband
•      The definition of broadband across countries continues to evolve as technologies improve,
       new generations of wireline and wireless broadband emerge and baseline expectations
       continue to be raised of what constitutes minimum download speeds for the optimal end-
       user experience. The quantitative forecast model used in the present study seeks to adhere
       to these changes by applying a definition of broadband that is consistent with the minimum
       levels of download (and upload) speeds expected to prevail during the period under
       assessment. For the purposes of achieving the 2030 universal access to broadband target,
       it is anticipated that the definition of what constitutes a basic level of broadband speed is
       likely to evolve. In turn, “broadband” speeds are defined as 10 Mbit/s or above (download).
•      While this assessment is broadly technology agnostic, the model uses 4G technology as a
       broad proxy for preferred minimum download speeds, and in recognition of the fact that
       mobile networks will be central to achieving the proposed targets.

Target population
•      For the purposes of this analysis, the population aged 10 and above is used as the baseline
       for calculating broadband penetration. In addition, connectivity penetration numbers are
       based on the estimated number of “unique” broadband connections – i.e. adjusted where
       applicable for multi-SIM usage. Finally, universal access to connectivity is defined as 90
       per cent penetration of the population aged 10 and above.
•      The target age is set at 10 years and older in recognition of data protection and privacy
       laws of various countries that seek to protect children when accessing the Internet. The 90
       per cent penetration target is used to define universality to take account of that segment

29
     The key parameters and methodology used for this study are similar to the ones employed in the Broadband
     Commission’s report, Connecting Africa Through Broadband: A Strategy for doubling connectivity by 2021
     and reaching universal access by 2030, with additional data sources used.

                                                                                                           19
Connecting humanity
of the population which chooses not to use personal ICTs, those who are prevented from
doing so (for example, prisoners) and those who use shared facilities.
Infrastructure investment requirements
• Infrastructure investment requirements are estimated for three main network segments:
mobile radio, network backhaul (metro and backbone) and satellite access.
• Mobile radio network CAPEX: Mobile network infrastructure costs are based on the
capital expenditure needed (1) to extend coverage to the unconnected population and
(2) provide adequate capacity and allow for network upgrades once new users have been
connected and traffic expands. Estimates include a mix of greenfield and upgraded sites,
along with existing levels of broadband network buildout and coverage.
• Network backhaul: Infrastructure capital investment estimates integrate the need to invest
in adequate transmission infrastructure based on metro fibre, microwave or satellite. The
forecast model assumes that a countrywide fibre backbone must be in place to achieve
universal access to connectivity, using 4G speeds. For this, the model assumes that at
least 50 per cent of the population must be within 10 km of a fibre backbone node.
CAPEX estimates are based on the total fibre backbone kilometres required to meet this
overarching objective, based on available data and/or minimum fibre density target levels.
These estimates further assume that a proportion of 4G sites will need to be connected to
optical fibre.
• Satellite for remote areas: It is generally anticipated that due to a variety of reasons, a
proportion of the rural population in remote locations will typically be out of the reach
of traditional mobile networks. The forecast model assumes this proportion at between
10 and 20 per cent of the rural population in most countries, with variations depending
on population density levels. Populations in remote locations will generally need to be
covered by localized solutions consisting of satellite backhaul and fixed wireless access
(predominantly Wi-Fi) for the last mile. In turn, infrastructure investment estimates include
a satellite/Wi-Fi requirement for remote communities.
• Network operational expenditure (OPEX) assumptions: For the purposes of this analysis,
infrastructure investment requirements include estimates of network operating expenses,
applied on an annual basis. Network operating expenses typically include repair and
maintenance, site leases and other site operating costs. For satellite/Wi-Fi infrastructure,
network OPEX includes support, user management platform and bandwidth capacity
recurring costs.
• Policy and regulation costs: The forecast model assumes that most countries will require
some form of policy and regulatory intervention to develop and strengthen frameworks that
promote cost-effective roll-outs, lower connectivity retail prices and increased broadband
usage. This includes fostering the availability of adequate spectrum, infrastructure sharing,
open access fibre and other relevant regulations. Top line policy and regulation investment
requirements are estimated using assessments of policy support needed in each country
and based on the policy and regulation components of the Affordability Driver Index (ADI)
score as developed by A4AI.
• Skills and content costs: The availability of local, relevant content and adequate end-
user skills are vital to a broader, more inclusive adoption of broadband connectivity
services. Investments in skills and content may take the form of establishing tech hubs,
local content ecosystems, or Internet literacy training programmes. The model integrates
these components by including per-user costs for training and content. Baseline estimates
are based on a broad framework as outlined by the World Economic Forum.
20Connecting humanity
Using anchor markets for CAPEX and OPEX estimates
• While based on estimates on a country-by-country basis across a sample of 218 countries
and territories, the model carries some constraints with respect to country-level granularity,
and makes occasional region-wide, or cluster-based assumptions. For key network OPEX
and CAPEX assumptions, the model relies on data from a sample of anchor countries.
Anchor countries are selected within each sub-region, typically based on their size. Site
CAPEX and OPEX estimates are generated within each anchor market, based on operator
financial data and other reports. These estimates are then applied within the sub-region.
Sample anchor countries include China, India, Nigeria and South Africa.
Data sources
The model uses the following sources of data:
Category Indicator Sources
Population Population UN database (2019)
Country land area, population UN database
density, % rural
Broadband Broadband Connections GSMA, ITU, Xalam Analytics
connections
Connections/user ratio GSMA
Network Connections per 4G BTS Mobile network operator data
indicators
Number of active BTS (2019) Mobile network operator data
2G/3Gsites Mobile network operator and regulator
data
4G sites Mobile network operator and regulator
data
Population covered by 4G Mobile network operator and regulator
data
% of Population within 10 km of ITU
backbone
Kilometres of backbone available ITU, Xalam Analytics
OPEX and CAPEX per site (upgrades and Mobile network operator data
CAPEX greenfield)
% sites connected to fibre Mobile network operator data
Network OPEX/site Mobile network operator data
CAPEX per Km of backbone fibre Operator data, Xalam Analytics
Skills/content cost per user World Economic Forum
Connected user per satellite Based on Intelsat, OneWeb estimates
terminal unit
CAPEX per satellite terminal unit Based on Intelsat, OneWeb estimates
Satellite monthly capacity costs Based on Intelsat, OneWeb estimates
21Connecting humanity Figure A.1 — Model logical flow Figure A.2 — Key drivers of differences in investment requirements 22
Figure A.3 —Model structure
                                   Connecting humanity

23
24
Figure A.4 — Example of model structure calculations for Sub-Saharan Africa
Connecting humanityConnecting humanity
Annex B: A Closer look at the investments needed in the G20 countries
When the investment needs are grouped by the G20 members30, it becomes evident that a
significant portion of the required investments involve G20 countries. The following is a summary
of investments grouped by G20 countries.
Figure B.1. Total Investments needed in the G20 countries
Sources: Xalam estimates based on ITU, GSMA, A4AI, operator and regulator data
Figure B.2. Investments across the G20 countries (USD billion)
Sources: Xalam estimates based on ITU, GSMA, A4AI, operator and regulator data
30
See the official list of G20 members here: https://g20.org/en/about/Pages/Participants.aspx
25You can also read