STATISTICS 1 PEARSON EDEXCEL INTERNATIONAL A LEVEL

Page created by Alfredo Brown
 
CONTINUE READING
STATISTICS 1 PEARSON EDEXCEL INTERNATIONAL A LEVEL
Uncorrected proof, all content subject to change at publisher discretion. Not for resale, circulation or distribution in whole or in part. ©Pearson 2019

                                                                                                                                                                        PEARSON EDEXCEL INTERNATIONAL A LEVEL

                                                                                                                                                                        STATISTICS 1

                                                                                                                                                                                                                          E
                                                                                                                                                                        Student Book

                                                                                                                                                                                                  PL
                                                                                                                                                                         Series Editors: Joe Skrakowski and Harry Smith
                                                                                                                                                                         Authors: Greg Attwood, Ian Bettison, Alan Clegg, Ali Datoo, Gill Dyer, Jane Dyer,
                                                                                                                                                                         Keith Gallick, Susan Hooker, Michael Jennings, John Kinoulty, Mohammed Ladak,
                                                                                                                                                                         Jean Littlewood, Bronwen Moran, James Nicholson, Su Nicholson, Laurence Pateman,
  M
                                                                                                                                                                         Keith Pledger, Joe Skrakowski, Harry Smith
SA

                                                                                                                                                           F01_IAL_S1_45140_PRE_i-x.indd 1                                                               08/02/2019 09:47
STATISTICS 1 PEARSON EDEXCEL INTERNATIONAL A LEVEL
Uncorrected proof, all content subject to change at publisher discretion. Not for resale, circulation or distribution in whole or in part. ©Pearson 2019

                                                                                                                                                                     Published by Pearson Education Limited, 80 Strand, London, WC2R 0RL.                   Endorsement Statement
                                                                                                                                                                                                                                                            In order to ensure that this resource offers high-quality support for the associated
                                                                                                                                                                     www.pearsonglobalschools.com                                                           Pearson qualification, it has been through a review process by the awarding body.
                                                                                                                                                                                                                                                            This process confirms that this resource fully covers the teaching and learning
                                                                                                                                                                     Copies of official specifications for all Pearson qualifications may be found on the   content of the specification or part of a specification at which it is aimed. It also
                                                                                                                                                                     website: https://qualifications.pearson.com                                            confirms that it demonstrates an appropriate balance between the development
                                                                                                                                                                                                                                                            of subject skills, knowledge and understanding, in addition to preparation for
                                                                                                                                                                     Text © Pearson Education Limited 2019                                                  assessment.
                                                                                                                                                                     Edited by Eric Pradel
                                                                                                                                                                     Typeset by Tech-Set Ltd, Gateshead, UK                                                 Endorsement does not cover any guidance on assessment activities or processes
                                                                                                                                                                     Original illustrations © Pearson Education Limited 2019                                (e.g. practice questions or advice on how to answer assessment questions)
                                                                                                                                                                     Illustrated by © Tech-Set Ltd, Gateshead, UK                                           included in the resource, nor does it prescribe any particular approach to the
                                                                                                                                                                     Cover design by © Pearson Education Limited 2019                                       teaching or delivery of a related course.

                                                                                                                                                                     The rights of Greg Attwood, Ian Bettison, Alan Clegg, Ali Datoo, Gill Dyer, Jane       While the publishers have made every attempt to ensure that advice on the

                                                                                                                                                                                                                                                                           E
                                                                                                                                                                     Dyer, Keith Gallick, Susan Hooker, Michael Jennings, John Kinoulty, Mohammed           qualification and its assessment is accurate, the official specification and
                                                                                                                                                                     Ladak, Jean Littlewood, Bronwen Moran, James Nicholson, Su Nicholson,                  associated assessment guidance materials are the only authoritative source of
                                                                                                                                                                     Laurence Pateman, Keith Pledger, Joe Skrakowski and Harry Smith to be identified       information and should always be referred to for definitive guidance.
                                                                                                                                                                     as the authors of this work have been asserted by them in accordance with the
                                                                                                                                                                     Copyright, Designs and Patents Act 1988.                                               Pearson examiners have not contributed to any sections in this resource relevant to
                                                                                                                                                                                                                                                            examination papers for which they have responsibility.
                                                                                                                                                                     First published 2019
                                                                                                                                                                                                                                                            Examiners will not use endorsed resources as a source of material for any
                                                                                                                                                                     22 21 20 19                                                                            assessment set by Pearson. Endorsement of a resource does not mean that the

                                                                                                                                                                                                                               PL
                                                                                                                                                                     10 9 8 7 6 5 4 3 2 1                                                                   resource is required to achieve this Pearson qualification, nor does it mean that it
                                                                                                                                                                                                                                                            is the only suitable material available to support the qualification, and any resource
                                                                                                                                                                     British Library Cataloguing in Publication Data                                        lists produced by the awarding body shall include this and other appropriate
                                                                                                                                                                     A catalogue record for this book is available from the British Library                 resources.

                                                                                                                                                                     ISBN 978 1 292245 14 0

                                                                                                                                                                     Copyright notice
                                                                                                                                                                     All rights reserved. No part of this may be reproduced in any form or by any means
                                                                                                                                                                     (including photocopying or storing it in any medium by electronic means and
                                                                                                                                                                     whether or not transiently or incidentally to some other use of this publication)
                                                                                                                                                                     without the written permission of the copyright owner, except in accordance with
                                                                                                                                                                     the provisions of the Copyright, Designs and Patents Act 1988 or under the terms
                                                                                                                                                                     of a licence issued by the Copyright Licensing Agency, Barnard's Inn, 86 Fetter
                                                                                                                                                                     Lane, London, EC4A 1EN (www.cla.co.uk). Applications for the copyright owner’s
                                                                                                                                                                     written permission should be addressed to the publisher.
  M
                                                                                                                                                                     Printed in Slovakia by Neografia

                                                                                                                                                                     Picture Credits
                                                                                                                                                                     The authors and publisher would like to thank the following individuals and
                                                                                                                                                                     organisations for permission to reproduce photographs:

                                                                                                                                                                     Alamy Stock Photo: Mark Levy 1, Cosmo Condina Stock Market 124; Getty
                                                                                                                                                                     Images: Billie Weiss/Boston Red Sox 54; Shutterstock.com: ifong 29,
                                                                                                                                                                     Anette Holmberg 95, Jeremy Richards 151, Stephen Marques 3, istidesign 3,
                                                                                                                                                                     Ecuadorpostales 5

                                                                                                                                                                     Cover images: Front: Getty Images: Werner Van Steen
SA

                                                                                                                                                                     Inside front cover: Shutterstock.com: Dmitry Lobanov

                                                                                                                                                                     All other images © Pearson Education Limited 2019
                                                                                                                                                                     All artwork © Pearson Education Limited 2019

                                                                                                                                                           F01_IAL_S1_45140_PRE_i-x.indd 2                                                                                                                                                     08/02/2019 09:47
STATISTICS 1 PEARSON EDEXCEL INTERNATIONAL A LEVEL
CONTENTS                   iii
Uncorrected proof, all content subject to change at publisher discretion. Not for resale, circulation or distribution in whole or in part. ©Pearson 2019

                                                                                                                                                                                       COURSE STRUCTURE                         iv
                                                                                                                                                                                       ABOUT THIS BOOK	                         vi
                                                                                                                                                                                       QUALIFICATION AND ASSESSMENT OVERVIEW   viii
                                                                                                                                                                                       EXTRA ONLINE CONTENT                      x

                                                                                                                                                                                                                          E
                                                                                                                                                                                       1 MATHEMATICAL MODELLING                  1
                                                                                                                                                                                       2 MEASURES OF LOCATION AND SPREAD         5

                                                                                                                                                                                                    PL
                                                                                                                                                                                       3 REPRESENTATIONS OF DATA
                                                                                                                                                                                       4 PROBABILITY
                                                                                                                                                                                       REVIEW EXERCISE 1
                                                                                                                                                                                       5 CORRELATION AND REGRESSION
                                                                                                                                                                                       6 DISCRETE RANDOM VARIABLES
                                                                                                                                                                                                                                29
                                                                                                                                                                                                                                54
                                                                                                                                                                                                                                88
                                                                                                                                                                                                                                95
                                                                                                                                                                                                                                124
  M
                                                                                                                                                                                       7 THE NORMAL DISTRIBUTION               151
                                                                                                                                                                                       REVIEW EXERCISE 2                       172
                                                                                                                                                                                       EXAM PRACTICE                           179
SA

                                                                                                                                                                                       NORMAL DISTRIBUTION TABLES              183
                                                                                                                                                                                       GLOSSARY                                185
                                                                                                                                                                                       ANSWERS                                 187
                                                                                                                                                                                       INDEX                                   207

                                                                                                                                                           F01_IAL_S1_45140_PRE_i-x.indd 3                                             08/02/2019 09:47
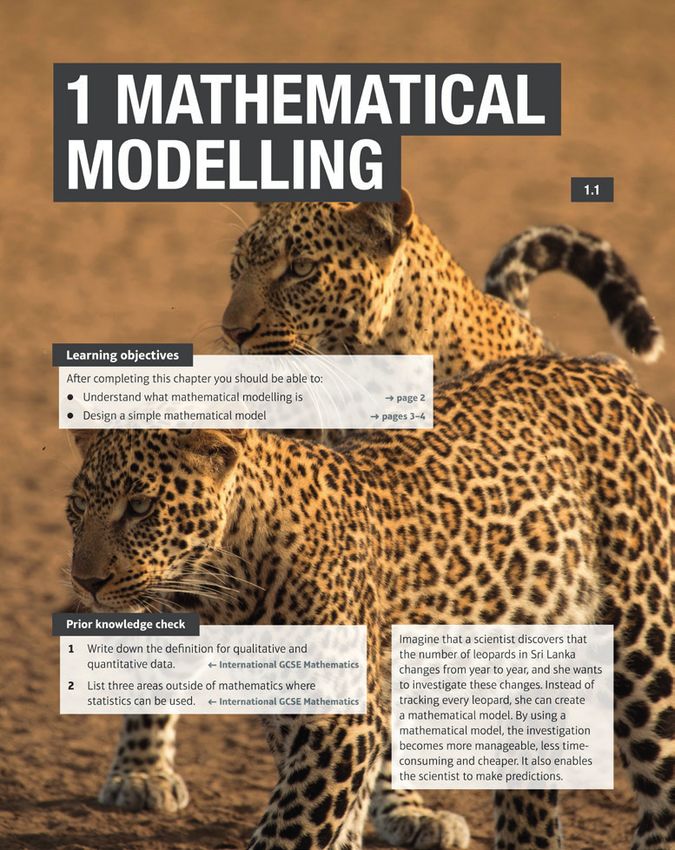
STATISTICS 1 PEARSON EDEXCEL INTERNATIONAL A LEVEL
iv    COURSE STRUCTURE
Uncorrected proof, all content subject to change at publisher discretion. Not for resale, circulation or distribution in whole or in part. ©Pearson 2019

                                                                                                                                                                         CHAPTER 1 MATHEMATICAL                      CHAPTER 4 PROBABILITY            54
                                                                                                                                                                         MODELLING                             1     4.1 UNDERSTANDING THE VOCABULARY
                                                                                                                                                                             1.1 MATHEMATICAL MODELS            2         USED IN PROBABILITY         55
                                                                                                                                                                             1.2 DESIGNING A MODEL              3    4.2 VENN DIAGRAMS                57
                                                                                                                                                                             CHAPTER REVIEW 1                   4    4.3 MUTUALLY EXCLUSIVE AND
                                                                                                                                                                                                                           INDEPENDENT EVENTS          60
                                                                                                                                                                                                                      4.4 SET NOTATION                 63
                                                                                                                                                                         CHAPTER 2 MEASURES OF

                                                                                                                                                                                                                               E
                                                                                                                                                                                                                      4.5 CONDITIONAL PROBABILITY      68
                                                                                                                                                                         LOCATION AND SPREAD                   5     4.6 CONDITIONAL PROBABILITIES
                                                                                                                                                                             2.1 TYPES OF DATA                  6         IN VENN DIAGRAMS            71
                                                                                                                                                                             2.2 MEASURES OF CENTRAL                 4.7 PROBABILITY FORMULAE         74
                                                                                                                                                                                  TENDENCY                      9

                                                                                                                                                                                                        PL
                                                                                                                                                                                                                      4.8 TREE DIAGRAMS                77
                                                                                                                                                                             2.3 OTHER MEASURES OF LOCATION   13    CHAPTER REVIEW 4                 82
                                                                                                                                                                             2.4 MEASURES OF SPREAD           16
                                                                                                                                                                             2.5 VARIANCE AND STANDARD
                                                                                                                                                                                 DEVIATION                     18   REVIEW EXERCISE 1                88
                                                                                                                                                                             2.6 CODING                        21
                                                                                                                                                                             CHAPTER REVIEW 2                  25   CHAPTER 5 CORRELATION AND
                                                                                                                                                                                                                     REGRESSION               95
                                                                                                                                                                         CHAPTER 3 REPRESENTATIONS                    5.1 SCATTER DIAGRAMS             96
  M
                                                                                                                                                                         OF DATA                 29                  5.2 LINEAR REGRESSION            99
                                                                                                                                                                             3.1 HISTOGRAMS                    30    5.3 CALCULATING LEAST SQUARES
                                                                                                                                                                             3.2 OUTLIERS                      35         LINEAR REGRESSION          103
                                                                                                                                                                             3.3 BOX PLOTS                     38    5.4 THE PRODUCT MOMENT
                                                                                                                                                                             3.4 STEM AND LEAF DIAGRAMS        40         CORRELATION COEFFICIENT    112
                                                                                                                                                                             3.5 SKEWNESS                      44    CHAPTER REVIEW 5                118
SA

                                                                                                                                                                             3.6 COMPARING DATA                48
                                                                                                                                                                             CHAPTER REVIEW 3                  49

                                                                                                                                                           F01_IAL_S1_45140_PRE_i-x.indd 4                                                                   08/02/2019 09:47
STATISTICS 1 PEARSON EDEXCEL INTERNATIONAL A LEVEL
COURSE STRUCTURE                                   v
Uncorrected proof, all content subject to change at publisher discretion. Not for resale, circulation or distribution in whole or in part. ©Pearson 2019

                                                                                                                                                                                       CHAPTER 6 DISCRETE RANDOM                       CHAPTER 7 THE NORMAL
                                                                                                                                                                                       VARIABLES              124                     DISTRIBUTION                      151
                                                                                                                                                                                             6.1 DISCRETE RANDOM VARIABLES      125    7.1 THE NORMAL DISTRIBUTION        152
                                                                                                                                                                                             6.2 FINDING THE CUMULATIVE                7.2 USING TABLES TO FIND
                                                                                                                                                                                                  DISTRIBUTION FUNCTION FOR A                PROBABILITIES OF THE STANDARD
                                                                                                                                                                                                  DISCRETE RANDOM VARIABLE      130         NORMAL DISTRIBUTION Z         155
                                                                                                                                                                                             6.3 EXPECTED VALUE OF A DISCRETE          7.3 USING TABLES TO FIND THE VALUE

                                                                                                                                                                                                                                          E
                                                                                                                                                                                                  RANDOM VARIABLE               133         OF z GIVEN A PROBABILITY      158
                                                                                                                                                                                             6.4 VARIANCE OF A DISCRETE                7.4 THE STANDARD NORMAL
                                                                                                                                                                                                  RANDOM VARIABLE               136         DISTRIBUTION                  161
                                                                                                                                                                                             6.5 EXPECTED VALUE AND VARIANCE           7.5 FINDING μ AND σ                164

                                                                                                                                                                                                               PL
                                                                                                                                                                                                  OF A FUNCTION OF X            138    CHAPTER REVIEW 7                   168
                                                                                                                                                                                             6.6 SOLVING PROBLEMS INVOLVING
                                                                                                                                                                                                  RANDOM VARIABLES              142
                                                                                                                                                                                                                                       REVIEW EXERCISE 2                 172
                                                                                                                                                                                             6.7 USING DISCRETE UNIFORM
                                                                                                                                                                                                  DISTRIBUTION AS A MODEL FOR
                                                                                                                                                                                                  THE PROBABILITY DISTRIBUTION         EXAM PRACTICE                     179
                                                                                                                                                                                                  OF THE OUTCOMES OF CERTAIN
                                                                                                                                                                                                  EXPERIMENTS                   144   NORMAL DISTRIBUTION
                                                                                                                                                                                             CHAPTER REVIEW 6                   146
  M
                                                                                                                                                                                                                                       TABLES                            183

                                                                                                                                                                                                                                       GLOSSARY                          185

                                                                                                                                                                                                                                       ANSWERS                           187
SA

                                                                                                                                                                                                                                       INDEX                             207

                                                                                                                                                           F01_IAL_S1_45140_PRE_i-x.indd 5                                                                                        08/02/2019 09:47
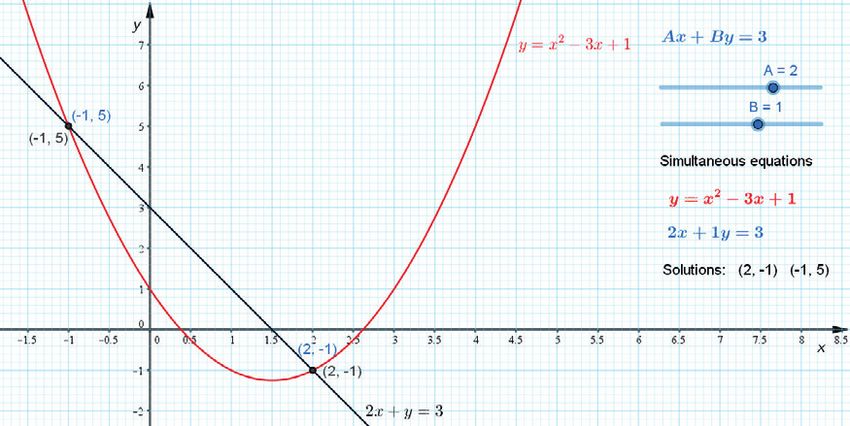
STATISTICS 1 PEARSON EDEXCEL INTERNATIONAL A LEVEL
vi    ABOUT THIS BOOK
Uncorrected proof, all content subject to change at publisher discretion. Not for resale, circulation or distribution in whole or in part. ©Pearson 2019

                                                                                                                                                                         ABOUT THIS BOOK
                                                                                                                                                                         The following three themes have been fully integrated throughout the Pearson Edexcel International
                                                                                                                                                                         Advanced Level in Mathematics series, so they can be applied alongside your learning.

                                                                                                                                                                         1. Mathematical argument, language and proof
                                                                                                                                                                         • Rigorous and consistent approach throughout
                                                                                                                                                                         • Notation boxes explain key mathematical language and symbols

                                                                                                                                                                                                                                             E
                                                                                                                                                                         2. Mathematical problem-solving                                The Mathematical Problem-Solving Cycle

                                                                                                                                                                         • Hundreds of problem-solving questions, fully integrated                      specify the problem

                                                                                                                                                                           into the main exercises
                                                                                                                                                                         • Problem-solving boxes provide tips and strategies            interpret results

                                                                                                                                                                                                           PL
                                                                                                                                                                                                                                                                        collect information
                                                                                                                                                                         • Challenge questions provide extra stretch
                                                                                                                                                                                                                                                          process and
                                                                                                                                                                         3. Transferable skills                                                      represent information

                                                                                                                                                                         • Transferable skills are embedded throughout this book, in the exercises and in some examples
                                                                                                                                                                         • These skills are signposted to show students which skills they are using and developing

                                                                                                                                                                         Finding your way around the book
  M
                                                                                                                                                                         Glossary terms will
                                                                                                                                                                         be identified by bold
                                                                                                                                                                         blue text on their first
                                                                                                                                                                         appearance.
                                                                                                                                                                                                                                                        Each chapter is mapped to the
                                                                                                                                                                                                                                                        specification content for easy
                                                                                                                                                                                                                                                        reference

                                                                                                                                                                         Each chapter starts with a
SA

                                                                                                                                                                         list of Learning objectives

                                                                                                                                                                         The Prior knowledge                                                            The real world applications of
                                                                                                                                                                         check helps make sure                                                          the maths you are about to learn
                                                                                                                                                                         you are ready to start the                                                     are highlighted at the start of the
                                                                                                                                                                         chapter                                                                        chapter.

                                                                                                                                                           F01_IAL_S1_45140_PRE_i-x.indd 6                                                                                                    08/02/2019 09:47
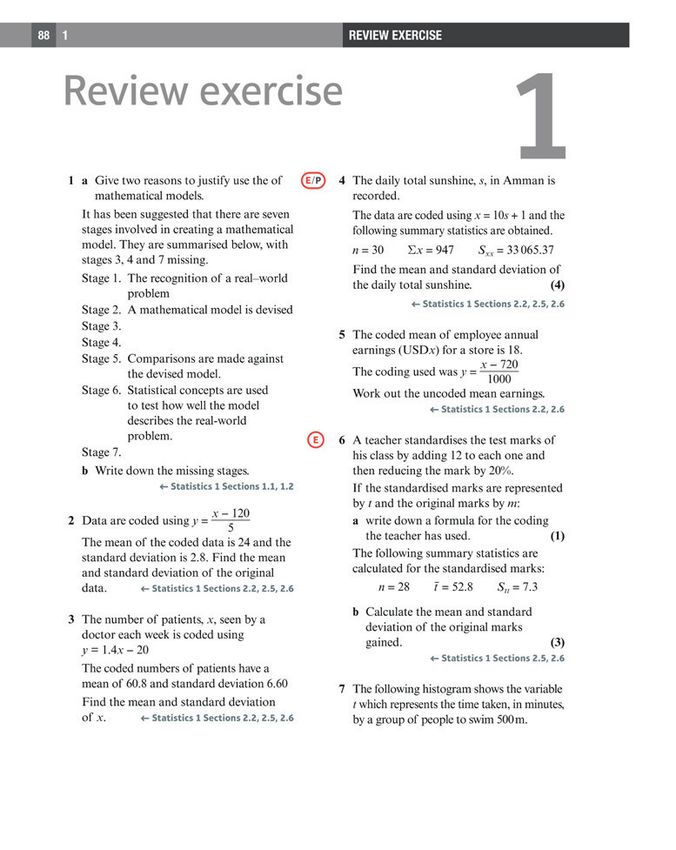
STATISTICS 1 PEARSON EDEXCEL INTERNATIONAL A LEVEL
ABOUT THIS BOOK                                                               vii
Uncorrected proof, all content subject to change at publisher discretion. Not for resale, circulation or distribution in whole or in part. ©Pearson 2019

                                                                                                                                                                                   Each section begins
                                                                                                                                                                                   with explanation and
                                                                                                                                                                                   key learning points

                                                                                                                                                                                    Step-by-step worked
                                                                                                                                                                                    examples focus on the
                                                                                                                                                                                    key types of questions
                                                                                                                                                                                    you’ll need to tackle

                                                                                                                                                                                                                                                                  E
                                                                                                                                                                                   Transferable skills are
                                                                                                                                                                                   signposted where
                                                                                                                                                                                   they naturally occur
                                                                                                                                                                                   in the exercises and
                                                                                                                                                                                   examples

                                                                                                                                                                                   Exercises are packed

                                                                                                                                                                                                                    PL
                                                                                                                                                                                   with exam-style
                                                                                                                                                                                   questions to ensure you
                                                                                                                                                                                   are ready for the exams

                                                                                                                                                                                                                                     Exercise questions are carefully graded                    Problem-solving boxes
                                                                                                                                                                                    Exam-style questions                             so they increase in difficulty and gradually               provide hints, tips and
                                                                                                                                                                                    are flagged with                                  bring you up to exam standard                              strategies, and Watch
                                                                                                                                                                                                             E
                                                                                                                                                                                                                                                                                                out boxes highlight areas
                                                                                                                                                                                    Problem-solving                                                                                             where students often lose
                                                                                                                                                                                    questions are flagged         Each chapter ends with a Chapter review                                        marks in their exams
                                                                                                                                                                                    with P                       and a Summary of key points
  M
                                                                                                                                                                                                                    After every few chapters, a Review exercise
                                                                                                                                                                                                                    helps you consolidate your learning with
                                                                                                                                                                                                                    lots of exam-style questions
SA

                                                                                                                                                                                                                                                                  A full practice paper at the back of
                                                                                                                                                                                                                                                                  the book helps you prepare for the
                                                                                                                                                                                                                                                                  real thing

                                                                                                                                                           F01_IAL_S1_45140_PRE_i-x.indd 7                                                                                                                                  08/02/2019 09:47
STATISTICS 1 PEARSON EDEXCEL INTERNATIONAL A LEVEL
viii QUALIFICATION AND ASSESSMENT OVERVIEW
Uncorrected proof, all content subject to change at publisher discretion. Not for resale, circulation or distribution in whole or in part. ©Pearson 2019

                                                                                                                                                                         QUALIFICATION AND
                                                                                                                                                                         ASSESSMENT OVERVIEW
                                                                                                                                                                         Qualification and content overview
                                                                                                                                                                         Statistics 1 (S1) is an optional unit in the following qualifications:
                                                                                                                                                                         International Advanced Subsidiary in Mathematics

                                                                                                                                                                                                                                                             E
                                                                                                                                                                         International Advanced Subsidiary in Further Mathematics
                                                                                                                                                                         International Advanced Level in Mathematics
                                                                                                                                                                         International Advanced Level in Further Mathematics

                                                                                                                                                                         Assessment overview

                                                                                                                                                                          S1: Statistics 1
                                                                                                                                                                          Paper code WST01/01
                                                                                                                                                                                                           Percentage
                                                                                                                                                                                                               _1

                                                                                                                                                                                                               _2        PL
                                                                                                                                                                         The following table gives an overview of the assessment for this unit.
                                                                                                                                                                         We recommend that you study this information closely to help ensure that you are fully prepared for
                                                                                                                                                                         this course and know exactly what to expect in the assessment.

                                                                                                                                                                          Unit
                                                                                                                                                                                                           33 ​​  3 ​​% of IAS
                                                                                                                                                                                                           16 ​​  3 ​​% of IAL
                                                                                                                                                                                                                                 Mark
                                                                                                                                                                                                                                 75
                                                                                                                                                                                                                                            Time
                                                                                                                                                                                                                                            1 hour 30 min

                                                                                                                                                                         IAS: International Advanced Subsidiary, IAL: International Advanced A Level.

                                                                                                                                                                         Assessment objectives and weightings
                                                                                                                                                                                                                                                                Availability
                                                                                                                                                                                                                                                                January, June and October
                                                                                                                                                                                                                                                                First assessment June 2019

                                                                                                                                                                                                                                                                                      Minimum
  M
                                                                                                                                                                                                                                                                                     weighting in
                                                                                                                                                                                                                                                                                     IAS and IAL
                                                                                                                                                                                     Recall, select and use their knowledge of mathematical facts, concepts and techniques in a
                                                                                                                                                                            AO1                                                                                                             30%
                                                                                                                                                                                     variety of contexts.
                                                                                                                                                                                     Construct rigorous mathematical arguments and proofs through use of precise statements,
                                                                                                                                                                                     logical deduction and inference and by the manipulation of mathematical expressions,
                                                                                                                                                                            AO2                                                                                                             30%
                                                                                                                                                                                     including the construction of extended arguments for handling substantial problems
                                                                                                                                                                                     presented in unstructured form.
                                                                                                                                                                                     Recall, select and use their knowledge of standard mathematical models to represent
SA

                                                                                                                                                                                     situations in the real world; recognise and understand given representations involving
                                                                                                                                                                            AO3                                                                                                             10%
                                                                                                                                                                                     standard models; present and interpret results from such models in terms of the original
                                                                                                                                                                                     situation, including discussion of the assumptions made and refinement of such models.
                                                                                                                                                                                     Comprehend translations of common realistic contexts into mathematics; use the results of
                                                                                                                                                                            AO4      calculations to make predictions, or comment on the context; and, where appropriate, read               5%
                                                                                                                                                                                     critically and comprehend longer mathematical arguments or examples of applications.
                                                                                                                                                                                     Use contemporary calculator technology and other permitted resources (such as formulae
                                                                                                                                                                            AO5      booklets or statistical tables) accurately and efficiently; understand when not to use such             5%
                                                                                                                                                                                     technology, and its limitations. Give answers to appropriate accuracy.

                                                                                                                                                           F01_IAL_S1_45140_PRE_i-x.indd 8                                                                                                          08/02/2019 09:47
STATISTICS 1 PEARSON EDEXCEL INTERNATIONAL A LEVEL
QUALIFICATION AND ASSESSMENT OVERVIEW                                            ix
Uncorrected proof, all content subject to change at publisher discretion. Not for resale, circulation or distribution in whole or in part. ©Pearson 2019

                                                                                                                                                                                       Relationship of assessment objectives to units
                                                                                                                                                                                                                                                                  Assessment objective
                                                                                                                                                                                        S1                            AO1                     AO2                         AO3               AO4                    AO5
                                                                                                                                                                                        Marks out of 75             20–25                   20–25                        15–20             5–10                    5–10
                                                                                                                                                                                                                        _2          _1          _2          _1                    _2        _2          _1
                                                                                                                                                                                                                                                                                                                6​_​  3 ​–​ 13​_​  3 ​​
                                                                                                                                                                                                                                                                                                                    2             1
                                                                                                                                                                                        %                         26​​  3 ​​–33​​  3 ​​   26​​  3 ​​–33​​  3 ​​         20–26​​  3 ​​    6​​  3 ​​–13​​  3 ​​

                                                                                                                                                                                       Calculators
                                                                                                                                                                                       Students may use a calculator in assessments for these qualifications. Centres are responsible for

                                                                                                                                                                                                                                                                         E
                                                                                                                                                                                       making sure that calculators used by their students meet the requirements given in the table below.
                                                                                                                                                                                       Students are expected to have available a calculator with at least the following keys: +, –, ×, ÷, π, x2,
                                                                                                                                                                                         __ 1
                                                                                                                                                                                       ​ x ​​, ​​ __
                                                                                                                                                                                       √
                                                                                                                                                                                                  x ​​, x , ln x, e , x!, sine, cosine and tangent and their inverses in degrees and decimals of a degree,
                                                                                                                                                                                                         y         x

                                                                                                                                                                                       and in radians; memory.

                                                                                                                                                                                                                     PL
                                                                                                                                                                                       Prohibitions
                                                                                                                                                                                       Calculators with any of the following facilities are prohibited in all examinations:
                                                                                                                                                                                       • databanks
                                                                                                                                                                                       • retrieval of text or formulae
                                                                                                                                                                                       • built-in symbolic algebra manipulations
                                                                                                                                                                                       • symbolic differentiation and/or integration
                                                                                                                                                                                       • language translators
                                                                                                                                                                                       • communication with other machines or the internet
  M
SA

                                                                                                                                                           F01_IAL_S1_45140_PRE_i-x.indd 9                                                                                                                                                08/02/2019 09:47
STATISTICS 1 PEARSON EDEXCEL INTERNATIONAL A LEVEL
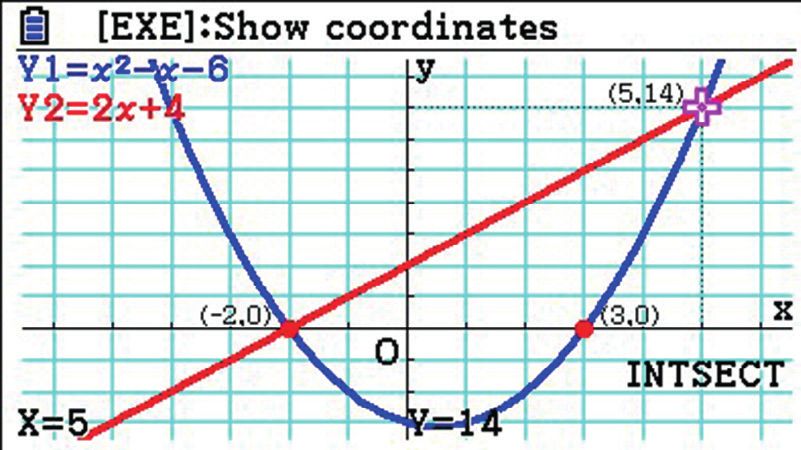
x     EXTRA ONLINE CONTENT
Uncorrected proof, all content subject to change at publisher discretion. Not for resale, circulation or distribution in whole or in part. ©Pearson 2019

                                                                                                                                                                                Extra online content
                                                                                                                                                                         Whenever you see an Online box, it means that there is extra online content available to support you.

                                                                                                                                                                                              SolutionBank
                                                                                                                                                                                              SolutionBank provides worked solutions for questions in the book. Download the
                                                                                                                                                                                              solutions as a PDF or quickly find the solution you need online.

                                                                                                                                                                                                                                                 E
                                                                                                                                                                         Use of technology                                                                                        y

                                                                                                                                                                                                                                                                                      x

                                                                                                                                                                         Explore topics in more detail, visualise                Online Find the point of intersection
                                                                                                                                                                         problems and consolidate your understanding.              graphically using technology.
                                                                                                                                                                         Use pre-made GeoGebra activities or Casio
                                                                                                                                                                         resources for a graphic calculator.

                                                                                                                                                                           GeoGebra-powered interactives

                                                                                                                                                                                                                PL              Graphic calculator interactives

                                                                                                                                                                                                                                                  Interact with the maths
                                                                                                                                                                                                                                                  you are learning using
                                                                                                                                                                                                                                                  GeoGebra's easy-to-use
                                                                                                                                                                                                                                                  tools
  M
                                                                                                                                                                              Interact with the mathematics you are learning          Explore the mathematics you are learning and
                                                                                                                                                                              using GeoGebra's easy-to-use tools                      gain confidence in using a graphic calculator

                                                                                                                                                                           Calculator tutorials
SA

                                                                                                                                                                           Our helpful video tutorials will
                                                                                                                                                                           guide you through how to use
                                                                                                                                                                           your calculator in the exams.
                                                                                                                                                                           They cover both Casio's scientific
                                                                                                                                                                           and colour graphic calculators.

                                                                                                                                                                             Online Work out each coefficient quickly using                Step-by-step guide with audio instructions
                                                                                                                                                                              the nCr and power functions on your calculator.            on exactly which buttons to press and what
                                                                                                                                                                                                                                         should appear on your calculator's screen

                                                                                                                                                           F01_IAL_S1_45140_PRE_i-x.indd 10                                                                                               08/02/2019 09:47
MATHEMATICAL MODELLING                                       CHAPTER 1                                                  1

                                                                                                                                                                          1 MATHEMATICAL
Uncorrected proof, all content subject to change at publisher discretion. Not for resale, circulation or distribution in whole or in part. ©Pearson 2019

                                                                                                                                                                          MODELLING                                                                                                 1.1

                                                                                                                                                                                                                                                E
                                                                                                                                                                          Learning objectives

                                                                                                                                                                                                              PL
                                                                                                                                                                          A�er completing this chapter you should be able to:
                                                                                                                                                                          ● Understand what mathematical modelling is
                                                                                                                                                                          ● Design a simple mathematical model
                                                                                                                                                                                                                                             → page 2
                                                                                                                                                                                                                                           → pages 3–4
  M
SA

                                                                                                                                                                          Prior knowledge check
                                                                                                                                                                                                                                                Imagine that a scientist discovers that
                                                                                                                                                                          1     Write down the definition for qualitative and                   the number of leopards in Sri Lanka
                                                                                                                                                                                quantitative data.      ← International GCSE Mathematics
                                                                                                                                                                                                                                                changes from year to year, and she wants
                                                                                                                                                                          2     List three areas outside of mathematics where                   to investigate these changes. Instead of
                                                                                                                                                                                statistics can be used. ← International GCSE Mathematics        tracking every leopard, she can create
                                                                                                                                                                                                                                                a mathematical model. By using a
                                                                                                                                                                                                                                                mathematical model, the investigation
                                                                                                                                                                                                                                                becomes more manageable, less time-
                                                                                                                                                                                                                                                consuming and cheaper. It also enables
                                                                                                                                                                                                                                                the scientist to make predictions.

                                                                                                                                                           M01_IAL_S1_45140_U01_001-004.indd 1                                                                                             04/02/2019 08:53
2     CHAPTER 1                                                 MATHEMATICAL MODELLING
Uncorrected proof, all content subject to change at publisher discretion. Not for resale, circulation or distribution in whole or in part. ©Pearson 2019

                                                                                                                                                                         1.1 Mathematical models
                                                                                                                                                                         A mathematical model is a simplification of a real-world situation. It can be used to make
                                                                                                                                                                         predictions and forecasts about real-world situations. This helps solve and improve the
                                                                                                                                                                         understanding of real-world situations by analysing the results and the model.

                                                                                                                                                                         The model will aim to include all the main features of the real-world situation but, given the
                                                                                                                                                                         difficulties of the real world, the model may have to be based on certain assumptions. As a result,
                                                                                                                                                                         these assumptions will need to be taken into consideration when analysing the results.

                                                                                                                                                                                                                                             E
                                                                                                                                                                         There are many advantages of mathematical models, and these include (but are not limited to):
                                                                                                                                                                         ■   they are relatively quick and easy to produce
                                                                                                                                                                         ■   they are usually a much more cost-effective way of analysing the real-world situation
                                                                                                                                                                         ■   they enable predictions to be made
                                                                                                                                                                         ■

                                                                                                                                                                                                               PL
                                                                                                                                                                             they help improve the understanding of our world
                                                                                                                                                                         ■   they help show how certain changes in variables will affect the outcomes
                                                                                                                                                                         ■   they help simplify complex situations.

                                                                                                                                                                         However, mathematical models do have disadvantages, and these include:
                                                                                                                                                                         ■ simplification of the real-world situation can cause errors, as the model does not include all
                                                                                                                                                                             aspects of the problem and may have included some assumptions
                                                                                                                                                                         ■ the model may work only in certain conditions that are difficult or expensive to fulfil in the
                                                                                                                                                                             real world.
  M
                                                                                                                                                                         Example           1     SKILLS   ANALYSIS

                                                                                                                                                                         Give two advantages and disadvantages of using a mathematical model:

                                                                                                                                                                                                 Advantages                                  Disadvantages
                                                                                                                                                                          They are relatively quick and easy to produce      Simplification of a real-world situation may
                                                                                                                                                                                                                             cause errors as the model is too simplistic
                                                                                                                                                                          They help enable predictions to be made            The model may work only in certain conditions
SA

                                                                                                                                                           M01_IAL_S1_45140_U01_001-004.indd 2                                                                                 04/02/2019 08:53
MATHEMATICAL MODELLING                                               CHAPTER 1                                           3
Uncorrected proof, all content subject to change at publisher discretion. Not for resale, circulation or distribution in whole or in part. ©Pearson 2019

                                                                                                                                                                                      1.2 Designing a model
                                                                                                                                                                                      The process of designing a model generally involves seven stages, outlined below.

                                                                                                                                                                                      Stage 1: The recognition of a real-world problem

                                                                                                                                                                                      Stage 2: A mathematical model is devised

                                                                                                                                                                                      Stage 3: Model used to make predictions about the
                                                                                                                                                                                               behaviour of the real-world problem

                                                                                                                                                                                                                                                       E
                                                                                                                                                                                      Stage 4: Experimental data are collected from the real world

                                                                                                                                                                                      Stage 5: Comparisons are made against the devised model

                                                                                                                                                                                      Stage 6: Statistical concepts are used to test how well the
                                                                                                                                                                                                model describes the real-world problem

                                                                                                                                                                                      Stage 7: Model is refined

                                                                                                                                                                                      Example        2

                                                                                                                                                                                      population variation.
                                                                                                                                                                                                                 PL
                                                                                                                                                                                                            SKILLS    EXECUTIVE FUNCTION

                                                                                                                                                                                      A scientist is investigating the population of owls and notices that the population varies year
                                                                                                                                                                                      to year. Give a summary of the stages that are needed to create a mathematical model for this

                                                                                                                                                                                      1 Some assumptions need to be made to ensure the model is manageable. Birth and death rates of
                                                                                                                                                                                        owls should be included, but food supply and environment changes should not.
  M
                                                                                                                                                                                      2 Plan a mathematical model which will include diagrams.
                                                                                                                                                                                      3 Use this model to predict the population of the owls over a period of years.
                                                                                                                                                                                      4 Include and collect fresh data that match the conditions of the predicted values. You may also
                                                                                                                                                                                        use historical data from the previous years.
                                                                                                                                                                                      5 Analyse the data using techniques you will meet in this course to compare the predicted data
                                                                                                                                                                                        with the experimental data.
                                                                                                                                                                                      6 Use statistical tests that will provide an objective means of deciding if the differences between
SA

                                                                                                                                                                                        the model’s predictions and experimental data are within acceptable limits.
                                                                                                                                                                                      If the predicted values do not match the experimental data closely enough, then the model can be
                                                                                                                                                                                      refined. This will involve repeating and refining steps 2­–6. This model is then constantly refined
                                                                                                                                                                                      making the model more and more accurate.

                                                                                                                                                                                      Exercise      1A      SKILLS    ANALYSIS; EXECUTIVE FUNCTION

                                                                                                                                                                                      1     Briefly explain the role of statistical tests in the process of mathematical modelling.
                                                                                                                                                                                      2     Describe how to refine the process of designing a mathematical model.

                                                                                                                                                           M01_IAL_S1_45140_U01_001-004.indd 3                                                                                              04/02/2019 08:54
4     CHAPTER 1                                                              MATHEMATICAL MODELLING
Uncorrected proof, all content subject to change at publisher discretion. Not for resale, circulation or distribution in whole or in part. ©Pearson 2019

                                                                                                                                                                         3     It is generally accepted that there are seven stages involved in creating a mathematical model.
                                                                                                                                                                               They are summarised below. Write down the missing stages.
                                                                                                                                                                               Stage 1:
                                                                                                                                                                               Stage 2: A mathematical model is devised
                                                                                                                                                                               Stage 3: Model used to make predictions
                                                                                                                                                                               Stage 4:
                                                                                                                                                                               Stage 5: Comparisons are made against the devised model
                                                                                                                                                                               Stage 6:

                                                                                                                                                                                                                                                             E
                                                                                                                                                                               Stage 7: Model is refined

                                                                                                                                                                         Chapter review            1        SKILLS     ANALYSIS; EXECUTIVE FUNCTION

                                                                                                                                                                             1 Mathematical models can simplify real-world problems and are a quick way to describe a real-

                                                                                                                                                                                                                     PL
                                                                                                                                                                               world situation. Give two other reasons why mathematical models are used.
                                                                                                                                                                             2 Give two advantages and two disadvantages of the use of mathematical models.
                                                                                                                                                                             3 Explain how mathematical modelling can be used to investigate climate change.
                                                                                                                                                                             4 A statistician is investigating population growth in Southeast Asia. Give a summary of the
                                                                                                                                                                               stages that are needed to create a mathematical model for this investigation.

                                                                                                                                                                             Summary of key points
                                                                                                                                                                              1 A mathematical model is a simplification of a real-world situation.
  M
                                                                                                                                                                              2 It is generally accepted that there are seven stages involved in creating a mathematical model.
                                                                                                                                                                                 • Stage 1: The recognition of a real-world problem
                                                                                                                                                                                 • Stage 2: A mathematical model is devised
                                                                                                                                                                                 • Stage 3: Model used to make predictions
                                                                                                                                                                                 • Stage 4: Experimental data collected
                                                                                                                                                                                 • Stage 5: Comparisons are made against the devised model
                                                                                                                                                                                 • Stage 6: Statistical concepts are used to test how well the model describes the
SA

                                                                                                                                                                                            real-world problem
                                                                                                                                                                                 • Stage 7: Model is refined
                                                                                                                                                                              3 There are advantages and disadvantages to mathematical models.
                                                                                                                                                                                Some of these are:
                                                                                                                                                                                                       Advantages                                           Disadvantages
                                                                                                                                                                                  They are relatively quick and easy to produce         Simplification of a real-world situation may cause
                                                                                                                                                                                                                                        errors as the model is too simplistic
                                                                                                                                                                                  They help enable predictions to be made               The model may work only in certain conditions

                                                                                                                                                           M01_IAL_S1_45140_U01_001-004.indd 4                                                                                               04/02/2019 08:54
2 MEASURES OF
Uncorrected proof, all content subject to change at publisher discretion. Not for resale, circulation or distribution in whole or in part. ©Pearson 2019

                                                                                                                                                                         LOCATION AND
                                                                                                                                                                         SPREAD

                                                                                                                                                                                                                                                    E
                                                                                                                                                                                                                                                                                          2.2
                                                                                                                                                                                                                                                                                          2.3

                                                                                                                                                                          Learning objectives

                                                                                                                                                                                                                 PL
                                                                                                                                                                          After completing this chapter you should be able to:
                                                                                                                                                                          ● Recognise different types of data
                                                                                                                                                                          ● Calculate measures of central tendency such as the mean,
                                                                                                                                                                            median and mode
                                                                                                                                                                          ● Calculate measures of location such as percentiles
                                                                                                                                                                          ● Calculate measures of spread such as range, interquartile
                                                                                                                                                                            range and interpercentile range
                                                                                                                                                                          ● Calculate variance and standard deviation
                                                                                                                                                                                                                                                    → pages 6−8

                                                                                                                                                                                                                                                   → pages 9−12

                                                                                                                                                                                                                                                  → pages 13−15

                                                                                                                                                                                                                                                  → pages 16−17

                                                                                                                                                                                                                                                  → pages 18−21
  M
                                                                                                                                                                          ● Understand and use coding                                             → pages 21−25

                                                                                                                                                                          Prior knowledge check

                                                                                                                                                                           1    Calculate the mean, mode and median of the following data:
SA

                                                                                                                                                                                10, 12, 38, 23, 38, 23, 21, 27, 38           ← International GCSE Mathematics

                                                                                                                                                                           2    A train runs for 3 hours at a speed of 65 km per hour, and for the next
                                                                                                                                                                                2 hours at a speed of 55 km per hour. Find the mean speed of the train
                                                                                                                                                                                for the 5 hour journey.                   ← International GCSE Mathematics

                                                                                                                                                                           3    Find the mean, median, mode and range of the data shown in this
                                                                                                                                                                                frequency table.                                                                  Wildlife biologists use
                                                                                                                                                                                                                                                                  statistics such as mean
                                                                                                                                                                                 Number of
                                                                                                                                                                                                   3    4    5       6   7                                        wingspan and standard
                                                                                                                                                                                 peas in a pod
                                                                                                                                                                                                                                                                  deviation to compare
                                                                                                                                                                                 Frequency         4    7    11 18       6                                        populations of endangered
                                                                                                                                                                                                                             ← International GCSE Mathematics     birds in different habitats.

                                                                                                                                                           M02_IAL_S1_45140_U02_005-028.indd 5                                                                                                   04/02/2019 08:55
6     CHAPTER 2                                                         MEASURES OF LOCATION AND SPREAD
Uncorrected proof, all content subject to change at publisher discretion. Not for resale, circulation or distribution in whole or in part. ©Pearson 2019

                                                                                                                                                                         2.1 Types of data
                                                                                                                                                                         In statistics, we collect observations or measurements of some variables. These observations are
                                                                                                                                                                         known as data. Variables associated with non-numerical data are qualitative variables, and variables
                                                                                                                                                                         associated with numerical data are quantitative variables. The flowchart below shows different
                                                                                                                                                                         types of data in more detail.

                                                                                                                                                                                                                                                         Hint     A variable that can take
                                                                                                                                                                                                  Types of data
                                                                                                                                                                                                                                                            only specific values in a given

                                                                                                                                                                                                                                                       E
                                                                                                                                                                                                                                                            range is a discrete variable.

                                                                                                                                                                               Qualitative                             Quantitative
                                                                                                                                                                           (Non-numerical data)                      (Numerical data)                    Hint     A variable that can take
                                                                                                                                                                                                                                                            any value in a given range is a
                                                                                                                                                                                                                                                            continuous variable.
                                                                                                                                                                             Examples include
                                                                                                                                                                            favourite colour or
                                                                                                                                                                             favourite animal

                                                                                                                                                                                                                  PL
                                                                                                                                                                                                         Discrete data -
                                                                                                                                                                                                      Takes specific values
                                                                                                                                                                                                        in a given range

                                                                                                                                                                                                        Examples include
                                                                                                                                                                                                        number of girls in
                                                                                                                                                                                                       a family or number
                                                                                                                                                                                                       of bowling pins le
                                                                                                                                                                                                            standing
                                                                                                                                                                                                                                 Continous data -
                                                                                                                                                                                                                                 Takes any value in
                                                                                                                                                                                                                                   a given range

                                                                                                                                                                                                                                 Examples include
                                                                                                                                                                                                                                 a person's weight
                                                                                                                                                                                                                                  or the distance
                                                                                                                                                                                                                                between two points
  M
                                                                                                                                                                         Example           1
                                                                                                                                                                         State whether each of the following variables is continuous or discrete.
                                                                                                                                                                         a Sprint times for a 100 m race
                                                                                                                                                                         b Length
                                                                                                                                                                         c Number of 10 cent coins in a bag
                                                                                                                                                                         d Number of boys in a family
SA

                                                                                                                                                                           a Sprint times are continuous                                Time can take any value, as determined by the
                                                                                                                                                                           b Length is continuous                                       accuracy of the measuring device. For example:
                                                                                                                                                                                                                                        9 seconds, 9.1 seconds, 9.08 seconds,
                                                                                                                                                                           c Number of 10 cent coins is discrete                        9.076 seconds, etc.
                                                                                                                                                                           d Number of boys in a family is discrete
                                                                                                                                                                                                                                        You can’t have 5.62 coins.

                                                                                                                                                                                                                                        You can’t have 2.45 boys in a family.

                                                                                                                                                           M02_IAL_S1_45140_U02_005-028.indd 6                                                                                                04/02/2019 08:55
MEASURES OF LOCATION AND SPREAD                                                   CHAPTER 2                                                                7
Uncorrected proof, all content subject to change at publisher discretion. Not for resale, circulation or distribution in whole or in part. ©Pearson 2019

                                                                                                                                                                                      Large amounts of discrete data can be written as a frequency table or as grouped data.
                                                                                                                                                                                      For example, the table below shows the number of students with a specific shoe size.

                                                                                                                                                                                          Shoe size(​x​)          Number of                        The number of anything is called its frequency,
                                                                                                                                                                                                                  students, f                      where f stands for frequency.
                                                                                                                                                                                                 39                      3
                                                                                                                                                                                                 40                      17                        A frequency table is a quick way of writing a long
                                                                                                                                                                                                 41                      29                        list of numbers. For instance, this table tells us that
                                                                                                                                                                                                                                                   3 students have a shoe size of 39, and 17 students
                                                                                                                                                                                                 42                      34
                                                                                                                                                                                                                                                   have a shoe size of 40, etc.

                                                                                                                                                                                                                                                                      E
                                                                                                                                                                                                 43                      12

                                                                                                                                                                                      Data can also be presented as a grouped frequency table. The specific data values are not
                                                                                                                                                                                      included in the table, instead they are grouped. You will need to know:
                                                                                                                                                                                      ■   the groups are commonly known as classes

                                                                                                                                                                                                                         PL
                                                                                                                                                                                      ■   how to find the class boundaries
                                                                                                                                                                                      ■   how to find the midpoint of a class
                                                                                                                                                                                      ■   how to find the class width.

                                                                                                                                                                                      Example            2        SKILLS          INTERPRETATION

                                                                                                                                                                                      The time, x seconds, taken by a random sample of females to run 400 m is measured
                                                                                                                                                                                      and is shown in two different tables.
                                                                                                                                                                                      a Write down the class boundaries for the first row of each table.
                                                                                                                                                                                      b Find the midpoint and class width for the first row for each table.
  M
                                                                                                                                                                                                             Table 1                                                               Table 2
                                                                                                                                                                                           Time to run                 Number of                                     Time to run             Number of
                                                                                                                                                                                            400 m (s)                   females f                                     400 m (s)               females f
                                                                                                                                                                                                 55–65                        2                                         55–65                     2
                                                                                                                                                                                                 65–70                       25                                         66–70                     25
                                                                                                                                                                                                 70–75                       30                                         71–75                     30
                                                                                                                                                                                                 75–90                       13                                         76–90                     13
SA

                                                                                                                                                                                        It may seem that the classes overlap. However,                            The data has gaps and therefore the class
                                                                                                                                                                                        this is not the case, as 55–65 is the shorthand                           boundaries are halfway between 55 and 65.
                                                                                                                                                                                        form of writing 55 < x , 65

                                                                                                                                                                                          a The class boundaries for Table 1 are 55 s,                          b The midpoint for Table 1 is ​​ __1
                                                                                                                                                                                                                                                                                                 2 ​​ (55 + 65) = 60
                                                                                                                                                                                            65 s as the data has no gaps and therefore                            The midpoint for Table 2 is __
                                                                                                                                                                                                                                                                                              ​​  21  ​​ (54.5 + 65.5) = 60
                                                                                                                                                                                            the class boundaries are the numbers of the                           The class width for Table 1 is ​65 − 55 = 10​
                                                                                                                                                                                            class. The class boundaries for Table 2 are                           The class width for Table 2 is ​65.5 − 54.5 = 11​
                                                                                                                                                                                            54.5 s, 65.5 s because the data has gaps.

                                                                                                                                                           M02_IAL_S1_45140_U02_005-028.indd 7                                                                                                                                04/02/2019 08:55
8     CHAPTER 2                                                         MEASURES OF LOCATION AND SPREAD
Uncorrected proof, all content subject to change at publisher discretion. Not for resale, circulation or distribution in whole or in part. ©Pearson 2019

                                                                                                                                                                         Exercise         2A      SKILLS       INTERPRETATION

                                                                                                                                                                         1     State whether each of the following variables is qualitative or quantitative:
                                                                                                                                                                               a The height of a building
                                                                                                                                                                               b The colour of a jumper
                                                                                                                                                                               c Time spent waiting in a queue
                                                                                                                                                                               d Shoe size
                                                                                                                                                                               e Names of students in a school

                                                                                                                                                                                                                                                       E
                                                                                                                                                                         2     State which of the following statements are true:
                                                                                                                                                                               a The weight of apples is discrete data.
                                                                                                                                                                               b The number of apples on the trees in an orchard is discrete data.
                                                                                                                                                                               c The amount of time it takes a train to make a journey is continuous data.

                                                                                                                                                                                                                    PL
                                                                                                                                                                               d Simhal collected data on car colours by standing at the end of her road and writing down
                                                                                                                                                                                 the car colours. The data she collected is quantitative.

                                                                                                                                                                         3     The distribution of the lifetimes of torch batteries are shown in the grouped frequency table below.
                                                                                                                                                                               a Write down the class boundaries for the second group.
                                                                                                                                                                               b Work out the midpoint of the fifth group.
                                                                                                                                                                                           Lifetime              Frequency
                                                                                                                                                                                    (Nearest 0.1 of an hour)
                                                                                                                                                                                             5.0–5.9                  5
                                                                                                                                                                                             6.0–6.9                  8
  M
                                                                                                                                                                                             7.0–7.9                 10
                                                                                                                                                                                             8.0–8.9                 22
                                                                                                                                                                                             9.0–9.9                 10
                                                                                                                                                                                            10.0–10.9                 2

                                                                                                                                                                         4     The grouped frequency table below shows the distributions of the weights of 16-week-old kittens.
                                                                                                                                                                               a Write down the class boundaries for the third group.
SA

                                                                                                                                                                               b Work out the midpoint of the second group.
                                                                                                                                                                                           Weight (kg)           Frequency
                                                                                                                                                                                             1.2–1.3                  8
                                                                                                                                                                                             1.3–1.4                  28
                                                                                                                                                                                             1.4–1.5                  32
                                                                                                                                                                                             1.5–1.6                  22

                                                                                                                                                                             Hint    Sometimes it is not possible or practical to count the number of all the objects
                                                                                                                                                                              in a set, but that number is still discrete. For example, counting the number of apples
                                                                                                                                                                              on all the trees in an orchard or the number of bricks in a multi-storey building might
                                                                                                                                                                              not be possible (or desirable!) but nonetheless these are still discrete numbers.

                                                                                                                                                           M02_IAL_S1_45140_U02_005-028.indd 8                                                                                        04/02/2019 08:55
MEASURES OF LOCATION AND SPREAD                                                  CHAPTER 2                                                            9
Uncorrected proof, all content subject to change at publisher discretion. Not for resale, circulation or distribution in whole or in part. ©Pearson 2019

                                                                                                                                                                                      2.2 Measures of central tendency
                                                                                                                                                                                      A measure of location is a single value which describes a position in a data set. If the single value
                                                                                                                                                                                      describes the centre of the data, it is called a measure of central tendency. You should already
                                                                                                                                                                                      know how to work out the mean, median and mode of a set of ungrouped data and from ungrouped
                                                                                                                                                                                      frequency tables.
                                                                                                                                                                                      ■ The mode or modal class is the value or class that occurs most often.
                                                                                                                                                                                      ■ The median is the middle value when the data values are put in order.

                                                                                                                                                                                                                                                                    E
                                                                                                                                                                                      ■ The mean can be calculated using the                             Notation
                                                                                                                                                                                                             Sx
                                                                                                                                                                                                  ​​  ¯ = ​​ ___ ​​
                                                                                                                                                                                          formula x ​​               n                                          x ​​ represents the mean of the data. You say ‘x bar’.
                                                                                                                                                                                                                                                           ●	​​ ¯
                                                                                                                                                                                                                                                           ●    Sx represents the sum of the data values.
                                                                                                                                                                                                                                                           ●    n is the number of data values.

                                                                                                                                                                                                                                    PL
                                                                                                                                                                                      Combining means
                                                                                                                                                                                                                        ​​ ¯1 and set B, of size ​n2​ , has a mean x ​​
                                                                                                                                                                                      If set A, of size n1, has mean x ​​                                          ​​ ¯2, then the mean of the combined
                                                                                                                                                                                      set of A and B is:
                                                                                                                                                                                                        ​  ¯1 + n2x ​
                                                                                                                                                                                                      n1x ​       ​  ¯2
                                                                                                                                                                                           ​​ x¯ = ​​ __________
                                                                                                                                                                                            ​​             n1 + n2 ​​

                                                                                                                                                                                      Example                  3             SKILLS   INTERPRETATION

                                                                                                                                                                                      The mean of a sample of 25 observations is 6.4. The mean of a second sample
                                                                                                                                                                                      of 30 observations is 7.2. Calculate the mean of all 55 observations.
  M
                                                                                                                                                                                         For the first set of observations:
                                                                                                                                                                                                    Σx                  Σx
                                                                                                                                                                                         ​​  ¯ = ​​ ___
                                                                                                                                                                                          ​​
                                                                                                                                                                                         x                             ___
                                                                                                                                                                                                     n ​​, so 6.4 = ​​  25 ​​
                                                                                                                                                                                         ​Σx​ = 6.4 × 25 = 160                                                  Sum of data values = mean × number of data values
                                                                                                                                                                                         For the second set of observations:
                                                                                                                                                                                                        Σy                  Σy
                                                                                                                                                                                          ​​y​​  ¯ = ​​ ___                ___
                                                                                                                                                                                                         m ​​, so 7.2 = ​​  30 ​​                              Notation       You can use x and y to represent
SA

                                                                                                                                                                                         ​Σy​ = 7.2 × 30 = 216                                                  two different data sets. You need to use different
                                                                                                                                                                                                                                                                letters for the number of observations in each
                                                                                                                                                                                                    160 + 216
                                                                                                                                                                                         Mean = __________
                                                                                                                                                                                                  
                                                                                                                                                                                                ​​           ​​ = 6.84 (3 s.f.)                                 data set.
                                                                                                                                                                                                     25 + 30

                                                                                                                                                                                      You need to decide on the best measure to use in particular situations.
                                                                                                                                                                                      ■ Mode	This is used when data are qualitative, or when quantitative with either a single mode or
                                                                                                                                                                                                            two modes (bimodal). There is no mode if each value occurs just once.
                                                                                                                                                                                      ■ Median	This is used for quantitative data. It is usually used when there are extreme values, as they
                                                                                                                                                                                                            do not affect it as much as they affect the mean.
                                                                                                                                                                                      ■ Mean	This is used for quantitative data and uses all the pieces of data. It therefore gives a true
                                                                                                                                                                                                            measure of the data. However, it is affected by extreme values.

                                                                                                                                                           M02_IAL_S1_45140_U02_005-028.indd 9                                                                                                                           04/02/2019 08:55
10     CHAPTER 2                                                        MEASURES OF LOCATION AND SPREAD
Uncorrected proof, all content subject to change at publisher discretion. Not for resale, circulation or distribution in whole or in part. ©Pearson 2019

                                                                                                                                                                         You can calculate the mean and median for discrete data presented in a frequency table.
                                                                                                                                                                         ■ For data given in a frequency table, the
                                                                                                                                                                                                                                                 Notation
                                                                                                                                                                            mean can be calculated using the formula
                                                                                                                                                                                                                                                  ●   Sxf   is the sum of the products of the
                                                                                                                                                                                       Sxf
                                                                                                                                                                            ​​  ¯ = ​​ ____ ​​
                                                                                                                                                                            x ​​                                                                      data values and their frequencies.
                                                                                                                                                                                        Sf                                                        ●   Sf   is the sum of the frequencies.

                                                                                                                                                                         Example           4      SKILLS   REASONING/ARGUMENTATION

                                                                                                                                                                                                                                                        E
                                                                                                                                                                         Li Wei records the shirt collar size, x,           Shirt collar size          15     15.5     16      16.5        17
                                                                                                                                                                         of the male students in his year.                   Frequency                  3       17      29       34         12
                                                                                                                                                                         The results are shown in the table.
                                                                                                                                                                         For these data, find:
                                                                                                                                                                         a the mode                  b the median                c the mean.

                                                                                                                                                                           a Mode = 16.5
                                                                                                                                                                           b There are 95 observations

                                                                                                                                                                               Median = 16

                                                                                                                                                                           c	​​ ¯
                                                                                                                                                                                                  95 + 1
                                                                                                                                                                             so the median is the _______
                                                                                                                                                                                                  ​​ 
                                                                                                                                                                                                      2
                                                                                                                                                                                                                PL
                                                                                                                                                                         d Explain why a shirt manufacturer might use the mode when planning production numbers.

                                                                                                                                                                                                         ​​ = 48th.

                                                                                                                                                                             There are 20 observations up to 15.5
                                                                                                                                                                             and 49 observations up to 16.

                                                                                                                                                                                          15 × 3 + 15.5 × 17 + 16 × 29 + 16.5 × 34 + 17 × 12
                                                                                                                                                                                x ​​ = ​​ _________________________________________________
                                                                                                                                                                                                                     ​​
                                                                                                                                                                                                                                                         16.5 is the collar size with the
                                                                                                                                                                                                                                                         highest frequency.

                                                                                                                                                                                                                                                         The 48th observation is therefore
                                                                                                                                                                                                                                                         16.
  M
                                                                                                                                                                                                                  95
                                                                                                                                                                                                                      1537.5
                                                                                                                                                                                       45 + 263.5 + 464 + 561 + 204 _______
                                                                                                                                                                                  = ​​ ______________________________
                                                                                                                                                                                                        ​​ = ​​            ​​ = 16.2
                                                                                                                                                                                                     95                 95
                                                                                                                                                                                                                                                         The mean is not one of the data
                                                                                                                                                                           d The mode is an actual data value and gives the                              values and the median is not
                                                                                                                                                                             manufacturer information on the most common size                            necessarily indicative of the most
                                                                                                                                                                             worn/purchased.                                                             popular collar size.
SA

                                                                                                                                                                         Exercise         2B      SKILLS   REASONING/ARGUMENTATION

                                                                                                                                                                         1 Priyanka collected wild mushrooms every day for a week. When she got home each day she
                                                                                                                                                                           weighed them to the nearest 100  g. The weights are shown below:
                                                                                                                                                                                500    700    400    300    900    700    700
                                                                                                                                                                           a Write down the mode for these data.
                                                                                                                                                                           b Calculate the mean for these data.
                                                                                                                                                                           c Find the median for these data.                                Hint Try to answer part d
                                                                                                                                                                            On the next day, Priyanka collected 650 g of wild mushrooms.                     without recalculating the
                                                                                                                                                                            d Write down the effect this will have                                           averages. You could recalculate
                                                                                                                                                                                                                                                             to check your answer.
                                                                                                                                                                              on the mean, the mode and the median.

                                                                                                                                                           M02_IAL_S1_45140_U02_005-028.indd 10                                                                                                  04/02/2019 08:55
MEASURES OF LOCATION AND SPREAD                                CHAPTER 2                                                      11
Uncorrected proof, all content subject to change at publisher discretion. Not for resale, circulation or distribution in whole or in part. ©Pearson 2019

                                                                                                                                                                                      2 Taha collects six pieces of data, x1, x2, x3, x4, x5 and x6. He works out that Sx is 256.2
                                                                                                                                                                                        a Calculate the mean for these data.
                                                                                                                                                                                        Taha collects another piece of data. It is 52.
                                                                                                                                                                                        b Write down the effect this piece of data will have on the mean.

                                                                                                                                                                                      3 The daily mean visibility, v metres, for Kuala Lumpur in May and June was recorded each day.
                                                                                                                                                                                        The data are summarised as follows:
                                                                                                                                                                                            May: n = 31, Sv = 724 000
                                                                                                                                                                                            June: n = 30, Sv = 632 000

                                                                                                                                                                                                                                                    E
                                                                                                                                                                                        a Calculate the mean visibility in each month.
                                                                                                                                                                                        b Calculate the mean visibility for the total recording period.

                                                                                                                                                                                      4 A small workshop records how long it takes, in minutes, for each of their workers to make a
                                                                                                                                                                                        certain item. The times are shown in the table.

                                                                                                                                                                                          a
                                                                                                                                                                                          b
                                                                                                                                                                                          c
                                                                                                                                                                                          d
                                                                                                                                                                                           Worker
                                                                                                                                                                                           Time in minutes
                                                                                                                                                                                                              A
                                                                                                                                                                                                               7

                                                                                                                                                                                                                   PL
                                                                                                                                                                                                                    B
                                                                                                                                                                                                                    12
                                                                                                                                                                                                                          C
                                                                                                                                                                                                                          10
                                                                                                                                                                                                                                D
                                                                                                                                                                                                                                8

                                                                                                                                                                                              Write down the mode for these data.
                                                                                                                                                                                              Calculate the mean for these data.
                                                                                                                                                                                              Find the median for these data.
                                                                                                                                                                                                                                      E
                                                                                                                                                                                                                                      6
                                                                                                                                                                                                                                            F
                                                                                                                                                                                                                                            8
                                                                                                                                                                                                                                                    G
                                                                                                                                                                                                                                                    5
                                                                                                                                                                                                                                                          H
                                                                                                                                                                                                                                                          26
                                                                                                                                                                                                                                                                 I
                                                                                                                                                                                                                                                                11
                                                                                                                                                                                                                                                                       J
                                                                                                                                                                                                                                                                       9

                                                                                                                                                                                              The manager wants to give the workers an idea of the average time they took.
                                                                                                                                                                                              Write down, with a reason, which of the answers to a, b and c she should use.

                                                                                                                                                                                      5 The frequency table shows the number of             Breakdowns    0     1   2     3     4           5
  M
                                                                                                                                                                                        breakdowns, b, per month recorded by a lorry         Frequency     8    11 12      3     1           1
                                                                                                                                                                                        firm over a certain period of time.
                                                                                                                                                                                        a Write down the modal number of breakdowns.
                                                                                                                                                                                        b Find the median number of breakdowns.
                                                                                                                                                                                        c Calculate the mean number of breakdowns.
                                                                                                                                                                                        d In a brochure about how many loads reach their destination on time, the firm quotes
                                                                                                                                                                                           one of the answers to a, b or c as the number of breakdowns per month for its vehicles.
                                                                                                                                                                                           Write down which of the three answers the firm should quote in the brochure.
SA

                                                                                                                                                                                      6 The table shows the frequency distribution for             Number of petals   5     6    7     8    9
                                                                                                                                                                                        the number of petals in the flowers of a group              Frequency          8    57    29    3    1
                                                                                                                                                                                        of celandines.
                                                                                                                                                                                        Calculate the mean number of petals.

                                                                                                                                                                                 P    7 A scientist is investigating how many eggs the endangered kakapo bird lays in each brood cycle.
                                                                                                                                                                                        The results are given in this frequency table.
                                                                                                                                                                                                                                                       Problem-solving
                                                                                                                                                                                           Number of eggs      1    2     3                                     Use the formula for the mean of
                                                                                                                                                                                           Frequency           7    p     2                                     an ungrouped frequency table to
                                                                                                                                                                                          If the mean number of eggs is 1.5, find the value of p.               write an equation involving p.

                                                                                                                                                           M02_IAL_S1_45140_U02_005-028.indd 11                                                                                                   04/02/2019 08:55
12     CHAPTER 2                                                                  MEASURES OF LOCATION AND SPREAD
Uncorrected proof, all content subject to change at publisher discretion. Not for resale, circulation or distribution in whole or in part. ©Pearson 2019

                                                                                                                                                                         You can calculate the mean, the class containing the median, and the modal class for continuous data
                                                                                                                                                                         presented in a grouped frequency table by finding the midpoint of each class interval.

                                                                                                                                                                         Example           5          SKILLS   INTERPRETATION

                                                                                                                                                                         The length, x mm, to the nearest                    Length of pine cone (mm)        30–31       32–33       34–36       37–39
                                                                                                                                                                         mm, of a random sample of pine                       Frequency                          2           25          30            13
                                                                                                                                                                         cones is measured. The data are
                                                                                                                                                                         shown in the table.

                                                                                                                                                                                                                                                              E
                                                                                                                                                                         a Write down the modal class.                   b Estimate the mean.                  c Find the median class.

                                                                                                                                                                                                                                                            The modal class is the class with the
                                                                                                                                                                           a Modal class = 34–36
                                                                                                                                                                                                                                                            highest frequency.
                                                                                                                                                                                        30.5 × 2 + 32.5 × 25 + 35 × 30 + 38 × 13
                                                                                                                                                                           b Mean = _________________________________________
                                                                                                                                                                                         
                                                                                                                                                                                    ​​                         ​​
                                                                                                                                                                                                           70                                                              Sxf

                                                                                                                                                                                                                       PL
                                                                                                                                                                                                                                                                ​​  ¯ = ​​ ____ ​​, taking the midpoint of
                                                                                                                                                                                                                                                            Use x ​​
                                                                                                                                                                                  = 34.54                                                                                   Sf
                                                                                                                                                                                                                                                            each class interval as the value of x.
                                                                                                                                                                           c There are 70 observations so the median is the 35.5th.
                                                                                                                                                                                                                                                            The answer is an estimate because
                                                                                                                                                                             The 35.5th observation will lie in the class 34–36.
                                                                                                                                                                                                                                                            you don’t know the exact data values.

                                                                                                                                                                         Exercise         2C          SKILLS    INTERPRETATION

                                                                                                                                                                         1 The weekly wages (to the nearest €) of the production                                     Weekly wage             Frequency
                                                                                                                                                                           line workers in a small factory are shown in the table.                                        (€)
                                                                                                                                                                            a Write down the modal class.                                                                175–225                  4
  M
                                                                                                                                                                            b Calculate an estimate of the mean wage.                                                    226–300                  8
                                                                                                                                                                            c Write down the interval containing the median.                                             301–350                 18
                                                                                                                                                                                                                                                                         351–400                 28
                                                                                                                                                                                                                                                                         401–500                  7

                                                                                                                                                                   E     2 The noise levels at 30 locations near an outdoor concert venue were measured
                                                                                                                                                                           to the nearest decibel. The data collected are shown in the grouped frequency table.
SA

                                                                                                                                                                              Noise (decibels)        65–69    70–74   75–79      80–84   85–89       90–94    95–99
                                                                                                                                                                              Frequency                 1        4        6          6      8           4         1

                                                                                                                                                                            a Calculate an estimate of the mean noise level.                                                                    (1 mark)
                                                                                                                                                                            b Explain why your answer to part a is an estimate.                                                                 (1 mark)

                                                                                                                                                                   E     3 The table shows the daily mean temperatures in Addis Ababa for the 30 days of June one year.
                                                                                                                                                                          Temperature 8 < t , 10 10 < t , 12 12 < t , 14 14 < t , 16 16 < t , 18 18 < t , 20 20 < t , 22
                                                                                                                                                                          (°C)
                                                                                                                                                                          Frequency               1              2               4              4               10                4                5

                                                                                                                                                                            a Write down the modal class.                                                                                       (1 mark)
                                                                                                                                                                            b Calculate an estimate for the mean daily mean temperature.                                                        (1 mark)

                                                                                                                                                           M02_IAL_S1_45140_U02_005-028.indd 12                                                                                                              04/02/2019 08:55
MEASURES OF LOCATION AND SPREAD                                     CHAPTER 2                                                                 13
Uncorrected proof, all content subject to change at publisher discretion. Not for resale, circulation or distribution in whole or in part. ©Pearson 2019

                                                                                                                                                                                 P    4 Two shops (A and B) recorded the ages of their workers.                                  Problem-solving
                                                                                                                                                                                           Age of worker     16–25   26–35     36–45     46–55       56–65        66–75            Since age is always
                                                                                                                                                                                           Frequency A         5       16       14         22         26           14              rounded down, the class
                                                                                                                                                                                                                                                                                   boundaries for the 16–25
                                                                                                                                                                                           Frequency B         4       12       10         28         25           13
                                                                                                                                                                                                                                                                                   group are 16 and 26. This
                                                                                                                                                                                          By comparing estimated means for each shop, determine which                              means that the midpoint
                                                                                                                                                                                          shop is better at employing older workers.                                               of the class is 21.

                                                                                                                                                                                                                                                           E
                                                                                                                                                                                      2.3 Other measures of location
                                                                                                                                                                                      The median describes the middle of the data set. It splits the data set into two equal (50%) halves.
                                                                                                                                                                                      You can calculate other measures of location such as quartiles and percentiles.

                                                                                                                                                                                        The lower quartile is
                                                                                                                                                                                        one-quarter of the way
                                                                                                                                                                                        through the data set.

                                                                                                                                                                                        Percentiles split the
                                                                                                                                                                                        data set into 100 parts.
                                                                                                                                                                                        The 10th percentile
                                                                                                                                                                                        lies one-tenth of the
                                                                                                                                                                                        way through the data.
                                                                                                                                                                                                                   PL Lowest
                                                                                                                                                                                                                       value

                                                                                                                                                                                                                         10%
                                                                                                                                                                                                                             25%
                                                                                                                                                                                                                                   This is the median value.

                                                                                                                                                                                                                                    Q1

                                                                                                                                                                                                                                         25%

                                                                                                                                                                                                                                          85%
                                                                                                                                                                                                                                                Q2

                                                                                                                                                                                                                                                     25%
                                                                                                                                                                                                                                                             Q3

                                                                                                                                                                                                                                                                   25%
                                                                                                                                                                                                                                                                        Highest
                                                                                                                                                                                                                                                                         value
                                                                                                                                                                                                                                                                                    The upper quartile is
                                                                                                                                                                                                                                                                                    three-quarters of the way
                                                                                                                                                                                                                                                                                    through the data set.

                                                                                                                                                                                                                                                                                       85% of the data values
                                                                                                                                                                                                                                                                                       are less than the 85th
                                                                                                                                                                                                                                                                                       percentile, and 15%
                                                                                                                                                                                                                                                                                       are greater.
  M
                                                                                                                                                                                      Use these rules to find the upper and lower quartiles for discrete data.
                                                                                                                                                                                      ■ To find the lower quartile for discrete data, divide n by 4.                          Notation          Q1 is the lower
                                                                                                                                                                                          If this is a whole number, the lower quartile is halfway                                quartile, Q2 is the median
                                                                                                                                                                                          between this data point and the one above. If it is not a                               and Q3 is the upper quartile.
                                                                                                                                                                                          whole number, round up and pick this data point.
                                                                                                                                                                                      ■ To find the upper quartile for discrete data, find ​​ _43 ​​ of n. If this is a whole number, the upper
                                                                                                                                                                                          quartile is halfway between this data point and the one above. If it is not a whole number,
SA

                                                                                                                                                                                          round up and pick this data point.

                                                                                                                                                                                      Example        6
                                                                                                                                                                                      The data below shows how far (in kilometres) 20 employees live from their place of work.

                                                                                                                                                                                                  1   3   3   3   4   4   6   7   7   7
                                                                                                                                                                                                  9  10  11  11  12  13  14  16  18  23

                                                                                                                                                                                      Find the median and quartiles for these data.

                                                                                                                                                           M02_IAL_S1_45140_U02_005-028.indd 13                                                                                                                   04/02/2019 08:55
14     CHAPTER 2                                                          MEASURES OF LOCATION AND SPREAD
Uncorrected proof, all content subject to change at publisher discretion. Not for resale, circulation or distribution in whole or in part. ©Pearson 2019

                                                                                                                                                                                                                                        Q2 is the median. It lies halfway between the
                                                                                                                                                                                        20 + 1
                                                                                                                                                                           Q2 = _______
                                                                                                                                                                                ​​           ​​ th value = 10.5th value                 10th and 11th data values (7 km and 9 km
                                                                                                                                                                                          2
                                                                                                                                                                                                                                        respectively).
                                                                                                                                                                                        7+9
                                                                                                                                                                           Q2 = ______
                                                                                                                                                                                    ​​      ​​ = 8 km
                                                                                                                                                                                         2
                                                                                                                                                                                                                                        ___20
                                                                                                                                                                                                                                        ​​   ​​ = 5 so the lower quartile is halfway between
                                                                                                                                                                           Q1 = 5.5th value                                              4
                                                                                                                                                                                                                                        the 5th and 6th data values.
                                                                                                                                                                           Q1 = 4 km

                                                                                                                                                                           Q3 = 15.5th value                                                3 × 20
                                                                                                                                                                                                                                        ______
                                                                                                                                                                                                                                        ​​       ​​ = 15 so the upper quartile is halfway
                                                                                                                                                                                                                                          4

                                                                                                                                                                                                                                                           E
                                                                                                                                                                           Q3 = 12.5 km                                                 between the 15th and 16th data values.

                                                                                                                                                                        When data are presented in a grouped                          Watch out     For grouped continuous data, or
                                                                                                                                                                        frequency table you can use a technique called                  data presented in a cumulative frequency table:
                                                                                                                                                                        interpolation to estimate the median, quartiles                                          n

                                                                                                                                                                                                                      PL
                                                                                                                                                                        and percentiles. When you use interpolation,                                 Q1 = __
                                                                                                                                                                                                                                                           ​​   ​​  th data value
                                                                                                                                                                                                                                                                 4
                                                                                                                                                                        you are assuming that the data values are                                                n
                                                                                                                                                                                                                                                     Q2 = __  ​​   ​​  th data value
                                                                                                                                                                        evenly distributed within each class.                                                    2
                                                                                                                                                                                                                                                                 3n
                                                                                                                                                                                                                                                     Q3 = ​​ ___ ​​ th data value
                                                                                                                                                                                                                                                                  4

                                                                                                                                                                         Example            7          SKILLS   INTERPRETATION

                                                                                                                                                                        The length of time (to the nearest minute)                 Time spent on the
                                                                                                                                                                        spent on the internet each evening by a                                               30–31       32–33       34–36       37–39
                                                                                                                                                                                                                                    internet (minutes)
                                                                                                                                                                        group of students is shown in the table.                    Frequency                     2          25          30          13
  M
                                                                                                                                                                        a Find an estimate for the upper quartile.               b Find an estimate for the 10th percentile.

                                                                                                                                                                                                 3 × 70                                 The endpoints on the line represent the class
                                                                                                                                                                           a Upper quartile: _______
                                                                                                                                                                                             ​​       ​​ = 52.5th value
                                                                                                                                                                                                   4                                    boundaries.
                                                                                                                                                                               Using interpolation:
                                                                                                                                                                                     33.5              Q3                 36.5
                                                                                                                                                                                                                                        The values on the bottom are the cumulative
                                                                                                                                                                                     27            52.5                   57
                                                                                                                                                                                                                                        frequencies for the previous classes and this class.
SA

                                                                                                                                                                                Q3 − 33.5
                                                                                                                                                                               ____________          52.5 − 27
                                                                                                                                                                                 
                                                                                                                                                                                 
                                                                                                                                                                               ​​           ​​ = __________
                                                                                                                                                                                                   
                                                                                                                                                                                                 ​​           ​​
                                                                                                                                                                               36.5 − 33.5            57 − 27                         Problem-solving
                                                                                                                                                                               Q3 − 33.5 _____  25.5                                        Use proportion to estimate Q3. The 52.5th value
                                                                                                                                                                           	​​ __________
                                                                                                                                                                                      ​​	 = ​​      ​​
                                                                                                                                                                                   3             30                                                  52.5 − 27
                                                                                                                                                                                                                                            lies ________
                                                                                                                                                                                                                                                 ​​              ​​of the way into the class, so Q3 lies
                                                                                                                                                                                            Q3 = 36.05                                                57 − 27
                                                                                                                                                                           b The 10th percentile is the 7th data value.                       Q3 − 33.5
                                                                                                                                                                                                                                        __________
                                                                                                                                                                                                                                        ​​                   ​​of the way between the class
                                                                                                                                                                                                                                        36.5 − 33.5
                                                                                                                                                                               P10 − 31.5
                                                                                                                                                                              ___________          7−2
                                                                                                                                                                                
                                                                                                                                                                                
                                                                                                                                                                              ​​          ​​ = ​​ _______ ​​                                boundaries. Equate these two fractions to form
                                                                                                                                                                              33.5 − 31.5 27 − 2
                                                                                                                                                                                                                                            an equation and solve to find Q3.
                                                                                                                                                                              P10 − 31.5
                                                                                                                                                                              __________         5
                                                                                                                                                                               ​​       ​​ = ___
                                                                                                                                                                                             ​​   ​​
                                                                                                                                                                                      2         25                                    Notation          You can write the 10th percentile as P10.
                                                                                                                                                                               P10 = 31.9

                                                                                                                                                           M02_IAL_S1_45140_U02_005-028.indd 14                                                                                                            04/02/2019 08:55
MEASURES OF LOCATION AND SPREAD                                          CHAPTER 2                                                                 15
Uncorrected proof, all content subject to change at publisher discretion. Not for resale, circulation or distribution in whole or in part. ©Pearson 2019

                                                                                                                                                                                      Exercise       2D         SKILLS   INTERPRETATION

                                                                                                                                                                                      1 The daily mean pressure (hPa) during the last 16 days of                           Notation          hPa (hectopascal)
                                                                                                                                                                                        July in Perth is recorded. The data are given below:
                                                                                                                                                                                                                                                                               is the SI unit used to measure
                                                                                                                                                                                                  1024   1022    1021    1013       1009     1018        1017       1024       atmospheric pressure in weather
                                                                                                                                                                                                  1027 1029      1031    1025       1017     1019        1017       1014       and meteorology.

                                                                                                                                                                                          a Find the median pressure for that period.
                                                                                                                                                                                          b Find the lower and upper quartiles.

                                                                                                                                                                                                                                                                    E
                                                                                                                                                                                      2 Zaynep records the number of books in the collections of                               Hint    This is an ungrouped
                                                                                                                                                                                        students in her year. The results are in the table below.
                                                                                                                                                                                                                                                                                 frequency table so you do not
                                                                                                                                                                                           Number of books        35      36         37        38         39                     need to use interpolation. Use
                                                                                                                                                                                           Frequency               3      17         29        34         12                     the rules for finding the median

                                                                                                                                                                                                                    PL
                                                                                                                                                                                                                                                                                 and quartiles of discrete data.
                                                                                                                                                                                          Find Q1, Q2 and Q3.

                                                                                                                                                                                 E    3 A hotel is worried about the reliability of its lift.                                   Number of            Frequency
                                                                                                                                                                                        It keeps a weekly record of the number of times                                          breakdowns
                                                                                                                                                                                        it breaks down over a period of 26 weeks.                                                     0–1                  18
                                                                                                                                                                                        The data collected are summarised in the                                                      2–3                   7
                                                                                                                                                                                        table opposite.                                                                               4–5                   1
                                                                                                                                                                                          Use interpolation to estimate the median
                                                                                                                                                                                          number of breakdowns.                                                                                           (2 marks)
  M
                                                                                                                                                                                      4 The weights of 31 cows were recorded to the nearest kilogram. The weights are shown in the table.
                                                                                                                                                                                          a Find an estimate for the                     Weight of
                                                                                                                                                                                            median weight.                                                300–349      350–399     400–449     450–499     500–549
                                                                                                                                                                                                                                          cow (kg)
                                                                                                                                                                                          b Find the lower quartile, Q1.                  Frequency             3          6          10          7             5
                                                                                                                                                                                          c Find the upper quartile, Q3.
                                                                                                                                                                                          d Interpret the meaning of the value you have found for the upper quartile in part c.
SA

                                                                                                                                                                                 E    5 A roadside assistance company kept a record over a week of the amount of time, in minutes,
                                                                                                                                                                                        people were kept waiting for assistance. The times are shown below.
                                                                                                                                                                                           Time waiting, t (minutes)     20 < t , 30         30 < t , 40        40 < t , 50      50 < t , 60     60 < t , 70
                                                                                                                                                                                           Frequency                            6                   10                18              13               2

                                                                                                                                                                                          a Find an estimate for the mean time spent waiting.                                                             (1 mark)
                                                                                                                                                                                          b Calculate the 65th percentile.                                                                                (2 marks)
                                                                                                                                                                                          The firm writes the following statement for an advertisement:

                                                                                                                                                                                                   Only 10% of our customers have to wait longer than 56 minutes.

                                                                                                                                                                                          c By calculating a suitable percentile, comment on the validity of this claim.                                  (3 marks)

                                                                                                                                                           M02_IAL_S1_45140_U02_005-028.indd 15                                                                                                                        04/02/2019 08:55
16     CHAPTER 2                                                        MEASURES OF LOCATION AND SPREAD
Uncorrected proof, all content subject to change at publisher discretion. Not for resale, circulation or distribution in whole or in part. ©Pearson 2019

                                                                                                                                                                   E     6 The table shows the recorded wingspans, in metres, of 100 endangered California condor birds.
                                                                                                                                                                              Wingspan, w (m)        1.0 < w , 1.5   1.5 < w , 2.0   2.0 < w , 2.5        2.5 < w , 3.0              3.0 < w
                                                                                                                                                                              Frequency                     4                20              37                   28                        11

                                                                                                                                                                            a Estimate the 80th percentile and interpret the value.                                                             (3 marks)
                                                                                                                                                                            b State why it is not possible to estimate the 90th percentile.                                                     (1 mark)

                                                                                                                                                                         2.4 Measures of spread

                                                                                                                                                                                                                                                         E
                                                                                                                                                                         A measure of spread is a measure of how spread out                       Notation      Measures of spread
                                                                                                                                                                         the data are. Here are two simple measures of spread.                       are sometimes called measures of
                                                                                                                                                                         ■ The range is the difference between the largest                           dispersion or measures of variation.
                                                                                                                                                                            and smallest values in the data set.

                                                                                                                                                                                                                  PL
                                                                                                                                                                         ■ The interquartile range (IQR) is the difference between
                                                                                                                                                                            the upper quartile and the lower quartile, Q3 − Q1.
                                                                                                                                                                         The range takes into account all of the data but can be affected by extreme values. The interquartile
                                                                                                                                                                         range is not affected by extreme values but only considers the spread of the middle 50% of the data.
                                                                                                                                                                         ■ The interpercentile range is the difference between the values for two given percentiles.
                                                                                                                                                                         The 10th to 90th interpercentile range is often used since it is not affected by extreme values but still
                                                                                                                                                                         considers 80% of the data in its calculation.
  M
                                                                                                                                                                         Example           8       SKILLS   INTERPRETATION

                                                                                                                                                                         The table shows the masses, in tonnes, of 120 African bush elephants.
                                                                                                                                                                          Mass, m (tonnes)        4.0 < m , 4.5   4.5 < m , 5.0   5.0 < m , 5.5        5.5 < m , 6.0           6.0 < m , 6.5
                                                                                                                                                                          Frequency                    13               23              31                      34                     19

                                                                                                                                                                         Find estimates for:
                                                                                                                                                                         a the range   b the interquartile range    c                  the 10th to 90th interpercentile range.
SA

                                                                                                                                                                                                                                      The largest possible value is 6.5 and the smallest
                                                                                                                                                                           a Range is 6.5 − 4.0 = 2.5 tonnes
                                                                                                                                                                                                                                      possible value is 4.0.
                                                                                                                                                                           b Q1 = 30th data value: 4.87 tonnes
                                                                                                                                                                             Q3 = 90th data value: 5.84 tonnes                                               Q1 − 4.5 _______    30 − 13
                                                                                                                                                                             The interquartile range is therefore                     Use interpolation: ________
                                                                                                                                                                                                                                                         ​​             ​​ = ​​        ​​
                                                                                                                                                                                                                                                             5.0 − 4.5             23
                                                                                                                                                                             5.84 − 4.87 = 0.97 tonnes
                                                                                                                                                                           c 10th percentile = 12th data value:                                              Q3 − 5.5 _______    90 − 67
                                                                                                                                                                                                                                      Use interpolation: ________
                                                                                                                                                                                                                                                         ​​             ​​ = ​​        ​​
                                                                                                                                                                             4.46 tonnes                                                                     6.0 − 5.5             34
                                                                                                                                                                             90th percentile = 108th data value:
                                                                                                                                                                             6.18 tonnes                                              Use interpolation to find the 10th and 90th
                                                                                                                                                                             The 10th to 90th interpercentile range is                percentiles, then work out the difference between
                                                                                                                                                                             therefore 6.18 − 4.46 = 1.72 tonnes                      them.

                                                                                                                                                           M02_IAL_S1_45140_U02_005-028.indd 16                                                                                                              04/02/2019 08:55
MEASURES OF LOCATION AND SPREAD                                     CHAPTER 2                                                           17
Uncorrected proof, all content subject to change at publisher discretion. Not for resale, circulation or distribution in whole or in part. ©Pearson 2019

                                                                                                                                                                                      Exercise      2E       SKILLS    INTERPRETATION

                                                                                                                                                                                 P    1 The lengths of a number of slow worms                                  Length of slow        Frequency
                                                                                                                                                                                        were measured, to the nearest mm.                                       worms (mm)
                                                                                                                                                                                        The results are shown in the table.                                       125–139                 4
                                                                                                                                                                                          a Work out how many slow worms were                                     140–154                 4
                                                                                                                                                                                            measured.                                                             155–169                 2
                                                                                                                                                                                          b Estimate the interquartile range for the                              170–184                 7
                                                                                                                                                                                            lengths of the slow worms.

                                                                                                                                                                                                                                                        E
                                                                                                                                                                                                                                                                  185–199                20
                                                                                                                                                                                          c Calculate an estimate for the mean length                             200–214                24
                                                                                                                                                                                            of the slow worms.                                                    215–229                10
                                                                                                                                                                                          d Estimate the number of slow worms                    Problem-solving
                                                                                                                                                                                            whose length is more than one
                                                                                                                                                                                                                                                                          ​​ ¯ + IQR, and determine which
                                                                                                                                                                                                                                                  For part d, work out x ​​
                                                                                                                                                                                            interquartile range above the mean.

                                                                                                                                                                                                                    PL
                                                                                                                                                                                                                                                  class interval it falls in. Then use proportion to work
                                                                                                                                                                                                                                                  out how many slow worms from that class interval
                                                                                                                                                                                                                                                  you need to include in your estimate.

                                                                                                                                                                                 E    2 The table shows the monthly income for workers in a factory.
                                                                                                                                                                                           Monthly income, x ($)      900 < x , 1000      1000 < x , 1100      1100 < x , 1200       1200 < x , 1300
                                                                                                                                                                                           Frequency                          3                   24                   28                     15

                                                                                                                                                                                          a Calculate the 34% to 66% interpercentile range.                                                   (3 marks)
                                                                                                                                                                                          b Estimate the number of data values that fall within this range.                                   (2 marks)
  M
                                                                                                                                                                                 E    3 A train travelled from Manchester to Liverpool. The times, to the nearest minute, it took for the
                                                                                                                                                                                        journey were recorded over a certain period. The times are shown in the table.
                                                                                                                                                                                           Journey time (minutes)     15–16       17–18   19–20        21–22
                                                                                                                                                                                           Frequency                    5          10       35          10

                                                                                                                                                                                          a Calculate the 5% to 95% interpercentile range.                                                    (3 marks)
                                                                                                                                                                                          b Estimate the number of data values that fall within this range.                                    (1 mark)
SA

                                                                                                                                                                               E/P    4 The daily mean temperature (°C) in Santiago for each of the first ten days of June is given below:
                                                                                                                                                                                             14.3  12.7  12.4  10.9  9.4  13.2  12.1  10.3  10.3  10.6
                                                                                                                                                                                        a Calculate the median and interquartile range.                                           (2 marks)
                                                                                                                                                                                        The median daily mean temperature in Santiago during the first 10 days of May
                                                                                                                                                                                        was 9.9 °C and the interquartile range was 3.9 °C.
                                                                                                                                                                                        b Compare the data for May with the data for June.                                        (2 marks)
                                                                                                                                                                                        The 10% to 90% interpercentile range for the daily mean temperature in Santiago
                                                                                                                                                                                        during July was 5.4 °C.
                                                                                                                                                                                        c Estimate the number of days in July on which the daily mean temperature fell
                                                                                                                                                                                          within this range.                                                                       (1 mark)

                                                                                                                                                           M02_IAL_S1_45140_U02_005-028.indd 17                                                                                                             04/02/2019 08:55
18     CHAPTER 2                                                              MEASURES OF LOCATION AND SPREAD
Uncorrected proof, all content subject to change at publisher discretion. Not for resale, circulation or distribution in whole or in part. ©Pearson 2019

                                                                                                                                                                         2.5 Variance and standard deviation
                                                                                                                                                                         Another measure that can be used to work out the spread of a data set is the variance.
                                                                                                                                                                                                                                                                  ​​  ¯.
                                                                                                                                                                         This makes use of the fact that each data point deviates from the mean by the amount x − x ​​

                                                                                                                                                                                             n ​​ = ​​  n ​​ − ​​(​  n ​)​​ = ​​  n ​​
                                                                                                                                                                                                    ​  ¯)2
                                                                                                                                                                                              S(x − x ​          Sx2       Sx     2
                                                                                                                                                                                                                                  xx   S
                                                                                                                                                                         ■ Variance = ​​ _________  ____            ___          ___
                                                                                                                                                                                                                                                             Notation      Sxx is a summary
                                                                                                                                                                                                                           (Sx)2                               statistic, which is used to make
                                                                                                                                                                                              ​​  ¯)2 = Sx2 − _____
                                                                                                                                                                            where Sxx = S(x − x ​​            ​​  n ​​                                         formulae easier to use and learn.

                                                                                                                                                                                                                     ​​  n ​​ − ​​(___
                                                                                                                                                                                                                                   ​  n ​)​​ , is easier to work with when given raw data.

                                                                                                                                                                                                                                                             E
                                                                                                                                                                                                                      Sx2            Sx 2
                                                                                                                                                                         The second version of the formula, ____
                                                                                                                                                                         It can be thought of as ‘the mean of the squares minus the square of the mean’.
                                                                                                                                                                                             Sxx
                                                                                                                                                                         The third version, ​​ ___
                                                                                                                                                                                                n ​​ , is easier to use if you can use your calculator to find Sxx quickly.
                                                                                                                                                                         The units of the variance are the units of the data squared. You can find a related measure of spread
                                                                                                                                                                         that has the same units as the data.

                                                                                                                                                                                  √      ​  ¯)2
                                                                                                                                                                                   S(x − x ​
                                                                                                                                                                            σ = ​​ _________

                                                                                                                                                                         Example
                                                                                                                                                                                   ​ 

                                                                                                                                                                                             9
                                                                                                                                                                                                     Sx
                                                                                                                                                                                                       √
                                                                                                                                                                                                     ____
                                                                                                                                                                                                         ___________
                                                                                                                                                                                                            2

                                                                                                                                                                                                       SKILLS
                                                                                                                                                                                                               Sx
                                                                                                                                                                                                               ___

                                                                                                                                                                                                                             PL
                                                                                                                                                                         ■ The standard deviation is the square root of the variance:
                                                                                                                                                                                   _________

                                                                                                                                                                                                                                √ xx
                                                                                                                                                                                                                                 ___
                                                                                                                                                                                                                                    ___

                                                                                                                                                                                       n ​ ​​ = ​​ ​  n ​− ​(​  n ​)​  ​​ = ​​ ​  n ​ ​​
                                                                                                                                                                                                                   2             S

                                                                                                                                                                                                                      EXECUTIVE FUNCTION

                                                                                                                                                                         The marks gained in a test by seven randomly selected students are:
                                                                                                                                                                                                                                                        Notation      σ is the symbol we use
                                                                                                                                                                                                                                                          for the standard deviation of a data
                                                                                                                                                                                                                                                          set. Hence σ 2 is used for the variance.
  M
                                                                                                                                                                                3  4  6  2  8  8  5
                                                                                                                                                                         Find the variance and standard deviation of the marks of the seven students.

                                                                                                                                                                           Sx = 3 + 4 + 6 + 2 + 8 + 8 + 5 = 36
                                                                                                                                                                           Sx2 = 9 + 16 + 36 + 4 + 64 + 64 + 25 = 218                          Use the ‘mean of the squares minus the square

                                                                                                                                                                                          ​​   ​​ − (​​ ___
                                                                                                                                                                                                        ​   ​)​​ = 4.69
                                                                                                                                                                                             218          36      2                            of the mean’:
                                                                                                                                                                           variance, σ2 = ____
                                                                                                                                                                                                                                                                      ​​  n ​​ − (​​ ___
                                                                                                                                                                                                                                                                                     ​  n ​)​​
                                                                                                                                                                                              7           7                                                              Sx2           Sx
                                                                                                                                                                                                                                                                                             2
                                                                                                                                                                                                                                                                σ 2 = ____
SA

                                                                                                                                                                                                                 _____
                                                                                                                                                                           standard deviation, σ = ​​√ 4.69 ​​ = 2.17

                                                                                                                                                                         ■ You can use these versions of the formulae for variance and standard deviation for grouped data
                                                                                                                                                                            that is presented in a frequency table:

                                                                                                                                                                                                                      ( Sf )
                                                                                                                                                                                                   ​  ¯)2 S fx2
                                                                                                                                                                                         S f  (x − x ​                     S fx 2
                                                                                                                                                                            ●   σ2 = __________
                                                                                                                                                                                     ​​            ​​ = _____
                                                                                                                                                                                                          ​​     ​​ − ​​ ____
                                                                                                                                                                                                                         ​   ​ ​​
                                                                                                                                                                                               Sf             Sf

                                                                                                                                                                                                             √
                                                                                                                                                                                                                 ______________

                                                                                                                                                                                      √
                                                                                                                                                                                          __________

                                                                                                                                                                                                                   ( Sf )
                                                                                                                                                                                                    ​  ¯)2
                                                                                                                                                                                          S f  (x − x ​    S fx      2 S fx   2
                                                                                                                                                                            ●   σ = ​​ __________
                                                                                                                                                                                       ​       ​ ​​ = ​​ _____
                                                                                                                                                                                                         ​      ​− ​ ____
                                                                                                                                                                                                                     ​   ​ ​  ​​
                                                                                                                                                                                           Sf               Sf
                                                                                                                                                                                where f is the frequency for each group and S f is the total frequency.

                                                                                                                                                           M02_IAL_S1_45140_U02_005-028.indd 18                                                                                                      04/02/2019 08:55
MEASURES OF LOCATION AND SPREAD                                            CHAPTER 2                                                                     19
Uncorrected proof, all content subject to change at publisher discretion. Not for resale, circulation or distribution in whole or in part. ©Pearson 2019

                                                                                                                                                                                      Example 10

                                                                                                                                                                                      Shamsa records the time spent out of school  Time spent out of school, x (min)                               35   36    37       38
                                                                                                                                                                                      during the lunch hour to the nearest minute, Frequency                                                        3    17    29       34
                                                                                                                                                                                      x, of the students in her year.
                                                                                                                                                                                      The results are shown in the table.
                                                                                                                                                                                      Calculate the standard deviation of the time spent out of school.

                                                                                                                                                                                         S fx2 = 3 ×
                                                                                                                                                                                                    352 + 17 × 362 + 29 × 372                             Hint   The values of S fx2, S fx and S f are

                                                                                                                                                                                                                                                                  E
                                                                                                                                                                                                   + 34 × 382 = 114 504                                       sometimes given with the question.
                                                                                                                                                                                         S fx = 3 ×
                                                                                                                                                                                                   35 + 17 × 36 + 29 × 37
                                                                                                                                                                                                  + 34 × 38 = 3082
                                                                                                                                                                                         S f = 3 + 17 + 29 + 34 = 83                                          σ 2 is the variance, and σ is the standard deviation.
                                                                                                                                                                                                         ​​ − ​​(______
                                                                                                                                                                                                                     83 )

                                                                                                                                                                                                                        PL
                                                                                                                                                                                                  114 504           30822

                                                                                                                                                                                                                                                                                      ( Sf )
                                                                                                                                                                                         σ2 = ________
                                                                                                                                                                                              ​​                 ​      ​​​ = 0.741 47…                                     S fx2          S fx 2
                                                                                                                                                                                                     83                                                       Use σ 2 = _____
                                                                                                                                                                                                                                                                        ​​       ​​ − ​​ ____
                                                                                                                                                                                                                                                                                         ​   ​ ​​
                                                                                                                                                                                                  ___________                                                                Sf
                                                                                                                                                                                         σ = ​​√ 0.741
                                                                                                                                                                                                       47… ​​ = 0.861 (3 s.f.)

                                                                                                                                                                                      If the data are given in a grouped frequency table, you can calculate estimates for the variance and
                                                                                                                                                                                      standard deviation of the data using the midpoint of each class interval.

                                                                                                                                                                                      Example 11                 SKILLS     EXECUTIVE FUNCTION

                                                                                                                                                                                      Akira recorded the length, in minutes, of each phone call she made for a month.
                                                                                                                                                                                      The data are summarised in the table below.
  M
                                                                                                                                                                                       Length of phone call, l (min)        0,l
You can also read