Color and cellular selectivity of retinal ganglion cell subtypes through frequency modulation of electrical stimulation
←
→
Page content transcription
If your browser does not render page correctly, please read the page content below
www.nature.com/scientificreports
OPEN Color and cellular selectivity
of retinal ganglion cell subtypes
through frequency modulation
of electrical stimulation
Javad Paknahad1,2*, Kyle Loizos2, Lan Yue3, Mark S. Humayun3,4 & Gianluca Lazzi1,2,4
Epiretinal prostheses aim at electrically stimulating the inner most surviving retinal cells—retinal
ganglion cells (RGCs)—to restore partial sight to the blind. Recent tests in patients with epiretinal
implants have revealed that electrical stimulation of the retina results in the percept of color of
the elicited phosphenes, which depends on the frequency of stimulation. This paper presents
computational results that are predictive of this finding and further support our understanding of the
mechanisms of color encoding in electrical stimulation of retina, which could prove pivotal for the
design of advanced retinal prosthetics that elicit both percept and color. This provides, for the first
time, a directly applicable “amplitude-frequency” stimulation strategy to “encode color” in future
retinal prosthetics through a predictive computational tool to selectively target small bistratified cells,
which have been shown to contribute to “blue-yellow” color opponency in the retinal circuitry. The
presented results are validated with experimental data reported in the literature and correlated with
findings in blind patients with a retinal prosthetic implant collected by our group.
Retinal and cortical visual prostheses have been developed to restore partial sight to the patients who have
been blinded for decades by neurodegenerative diseases, such as retinitis pigmentosa (RP), age-related macular
degeneration (AMD), and Primary Open-Angle Glaucoma (POAG). Restoration in vision lost has been gener-
ally attempted by either stimulating the surviving neurons in the degenerated retina to elicit visual percepts or
bypassing the visual pathway and directly stimulating the visual cortex. These approaches have proven effective
and led to the development of several visual prosthetic s ystems1–6.
The target of electrical stimulation in epiretinal prostheses is the innermost layer of the retina—the population
of retinal ganglion cells (RGCs)—which remain mostly intact in the early stages of degeneration. Research has
been conducted towards improving the efficacy and safety of such devices using computational and experimental
methods7–23. While these devices have shown to be effective at restoring some limited form of sight, several chal-
lenges still need to be addressed. A critical issue with current epiretinal prosthetic systems, for example, is the
limited ability to focally activate a population of RGCs. Reports from clinical studies have revealed that axonal
activation of RGCs can result in elongated p hosphenes7. Direct and indirect electrical stimulation of RGCs have
been attempted using long and short pulse durations to achieve more focalized response from a population of
RGCs10–15. However, percept fading and desensitization with indirect stimulation, and high required current
amplitude with direct stimulation of RGCs remained a c hallenge16.
Further understanding of how different subtypes of RGCs respond to electrical stimulation, and the mecha-
nisms underlying the preferential activation of each cell type, could significantly improve the efficacy of retinal
prostheses. A number of studies have focused on RGCs excitability to high frequency electrical stimulation (up
to 300 Hz)8,17–20. Further, there have been attempts towards preferentially targeting ON and OFF RGCs at very
high stimulation frequency (> 2 kHz)21–23. Despite these successes, to the best of our knowledge there has been
no specific work on analyzing the responsiveness of classified RGCs subtypes to high frequency of stimulation.
Prior studies have been mostly limited to the response to light stimuli of ON and OFF RGCs, or one morpho-
logical RGC type to electrical stimulation. However, there are subtypes of RGCs within each group (ON, OFF,
1
Department of Electrical Engineering, University of Southern California, Los Angeles, CA, USA. 2The Institute
for Technology and Medical Systems (ITEMS), Keck School of Medicine, University of Southern California, Los
Angeles, CA, USA. 3Roski Eye Institute, University of Southern California, Los Angeles, CA, USA. 4Departments
of Ophthalmology and Biomedical Engineering, University of Southern California, Los Angeles, CA, USA. *email:
paknahad@usc.edu
Scientific Reports | (2021) 11:5177 | https://doi.org/10.1038/s41598-021-84437-w 1
Vol.:(0123456789)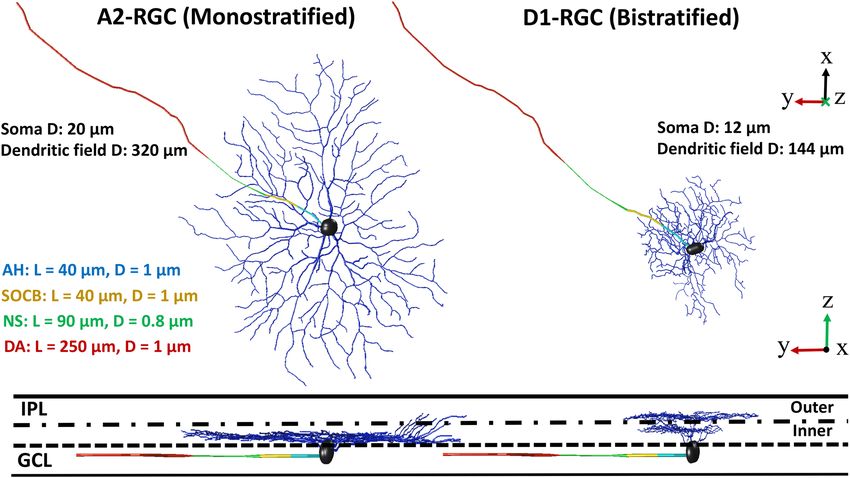
www.nature.com/scientificreports/
Figure 1. A2 and D1 realistic morphologies as implemented and coded in our multiscale Admittance Method/
NEURON computational platform61–73. Left: A2-monostratified RGC ramified in the inner part of inner
plexiform layer and has a larger soma and dendritic field diameters. Right: D1-bistratified, their dendrites are
placed in both inner and outer part of the inner plexiform layer and this cell has relatively smaller soma and
dendritic field diameters. GCL: ganglion cell layer; IPL: inner plexiform layer; AH: axon hillock; SOCB: sodium
channel band; NS: narrow segment; DA: distal axon; L: length of each band; D: diameter. The morphology of
RGCs was extracted from the NeuroMorpho dataset75–77.
and ON–OFF) that are characterized by physiological and morphological d ifferences24–27. These classified RGCs
carry specific types of visual information, such as color and contrast, features which may therefore be possible to
leverage in a prosthetic through selective stimulation. For example, previous studies have shown the contribution
of small bistratified ganglion cells to “blue-yellow” color opponency in the retinal circuitry28–31.
Recent clinical studies of patients with retinal prostheses have shown that electrical stimulation can result in
some variation of color p erception32–36. Specifically, these experiments revealed that color percept is dependent
upon stimulation parameters such as frequency of stimulation32. These findings suggest the possibility of encod-
ing color in retinal prostheses. Significant loss of spatial visual information in degenerate retina with respect to
normal vision is inevitable; indisputably, the addition of color vision would represent a tremendous improvement
to the efficacy of current devices.
In this work, we developed biophysically and morphologically detailed models of D1-bistratified and
A2-monostratified RGCs and validated their response with experimentally recorded s ignals37. We utilized our
combined Admittance method (AM)/NEURON multiscale computational method to determine whether differ-
ent RGCs exhibit different responses as a function of the stimulation frequency (up to 200 Hz). We found that
D1-bistratified cells are better able to follow high stimulus frequency compared to A2-monostratified cells. Our
computational platform helps gain further insights into the underlying mechanisms affecting the differential
excitability of RGCs at high frequency. This differential response of RGCs with the proper current amplitude
modulation can help identify the mechanisms linked to preferential activation of RGCs, and different color
percepts observed in clinical studies.
Results
Extracellular stimulation: frequency response of RGCs. The morphology of the two developed
RGCs, D1-bistratified versus A2-monostratified, and the levels of stratification in the inner plexiform layer of
the retina are depicted in Fig. 1. The stimulating electrode of diameter 200 μm is placed on the top-center of
the bulk retina tissue and is positioned 50 µm from the cell bodies of computational models of the RGCs. We
applied symmetric charge-balanced electrical stimulation waveforms to characterize RGCs responsiveness as a
function of stimulus frequency. We compared the responses of D1-bistratified versus A2-monostratified RGCs
to alterations in stimulation frequency. Figure 2A shows the firing rates of both A2 and D1 cells as a function of
stimulation frequency at 100 µA current amplitude. As shown in the figure, the firing rate of the D1 cell is greater
compared to the A2 cell at high frequency, and the spiking rate observed in the A2-monostratified cell cannot
follow the stimulus pulses with a similar rate. However, each stimulus pulse results in spiking of the D1-RGC.
Scientific Reports | (2021) 11:5177 | https://doi.org/10.1038/s41598-021-84437-w 2
Vol:.(1234567890)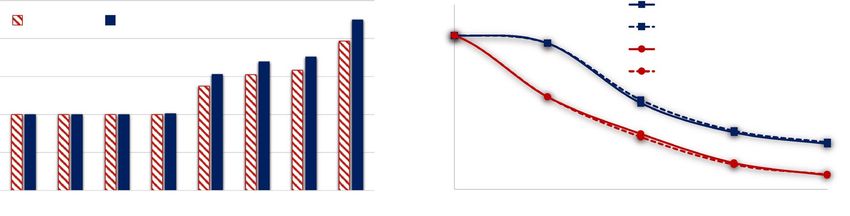
www.nature.com/scientificreports/
Figure 2. Responsiveness of RGCs at high stimulation frequency. (A) Computational results show the
difference in response between A2 and D1 retinal ganglion cells at high frequency. (B) Firing rate as a function
of pulse amplitude for both A2 and D1 cells at 200 Hz stimulus frequency. Data show the effects of stimulus
amplitude on the responsiveness of both cell types. Slower rate of changes in firing rates of A2-RGC with
increasing amplitude is shown which indicates less excitability of this RGC subtype at high frequency. The
greatest difference in rate of firing between A2 and D1 cells is observed at the point where D1 cell begins firing
at its maximum rate of 200 Hz. The difference in the computationally determined frequency response can
potentially help identifying the mechanism to selectively target RGCs.
The importance of this finding lies in the potential to exploit the differential RGCs response in retinal prosthetic
systems by varying stimulation frequency to controllably induce different percepts such as color.
Current modulation at high frequency. Figure 2B represents the rate of spikes as a function of cur-
rent amplitude ranging from 20 to 140 µA at 200 Hz. As shown, firing rate increases with increasing stimulus
strength up to 100% response probability (200 Hz firing rate) for each cell. However, slower rate of increase in
firing rate is observed for A2 cells compared to D1 cells. The differential excitation rates of the RGCs increases
with increasing the pulse amplitude. D1-RGC reaches its maximum firing rate at 86 µA, as noted in Fig. 2B. This
further indicates that the D1 cell is more responsive at high stimulus frequency over a range of current ampli-
tudes. Figure 2B also shows that with a proper choice of current amplitude, D1 cells can be selectively activated
at 200 Hz. The typical stimulus frequency used in epiretinal prosthetic systems is 20 Hz, and RGCs are capable
of firing at the same rate. One of the hypotheses is that we can control the cells’ firing rate to remain at 20 Hz by
tuning the current amplitude at 200 Hz stimulus frequency, and therefore increase the likelihood for selective
activation of D1 cells. For example, the intersections of the horizontal dashed line and the response curves in
Fig. 2B represents the current amplitude difference between the cells (~ 22 µA) required to achieve 20 Hz firing
rate. While the current amplitude to reach 20 Hz spiking rate for the A2-cell is 58 µA, this current is almost 22
µA smaller for the D1-cell, offering a current window for selective activation of this cell.
Many studies have investigated RGCs response to a single stimulus pulse12,14,38,39. However, the stimulation
threshold differences among RGCs are small at low frequencies, which makes the potential for preferential acti-
vation of RGCs c hallenging39. For instance, the difference in the stimulus thresholds of the A2 and D1 RGCs in
response to a single stimulation pulse is only 1.6 µA (The A2 cell threshold: 27.3 µA; the D1 cell threshold: 25.7
µA), reducing the current window for targeting the D1 cell. Therefore, this control of excitability of cells over a
range of stimulation frequencies is effective for selective activation of RGCs and is attainable with proper selec-
tion of stimulus frequency and current amplitude. Under the assumption that small bistratified retinal ganglion
cells play a significant role in the percept of the blue color, our findings correlate well with early experimental
results in patients with epiretinal i mplants32–36, perceiving blue as the dominant color in their visual percept at
high frequency of stimulation as discussed in the section discussing our results in a patient.
Time course response at high frequency. To better understand the physiological differences between
these two RGCs, the time course of the response was compared at 200 Hz using a symmetrical biphasic pulse
train with a stimulation duration of 250 ms, as indicated in Fig. 3. The results demonstrate that the spiking rate
observed in the A2-monostratified cell cannot follow the stimuli pulses at a similar rate. In contrast, each stimu-
lus pulse results in depolarization events in the D1-bistratified cell. There are electrophysiological properties
that are different between these two RGC subtypes. It can be clearly seen that the spike width of the D1-RGC
is shorter than that of the A2-RGC. In addition, there is a spike latency in the A2 cell response to some of the
stimulus pulses, offering an additional reason for lower responsiveness of this cell at high stimulus frequency.
This agrees with experiments on RGCs, showing that retinal ganglion cells with longer spike latency cannot sus-
tain repetitive firing at high frequency18. There are also morphological factors that can influence their response
to high rate of stimulus pulses.
Sensitivity and statistical analysis of RGCs morphology. We further investigated the effects of mor-
phological changes on response of RGCs to high stimulation frequency. We performed a parametric analysis for
Scientific Reports | (2021) 11:5177 | https://doi.org/10.1038/s41598-021-84437-w 3
Vol.:(0123456789)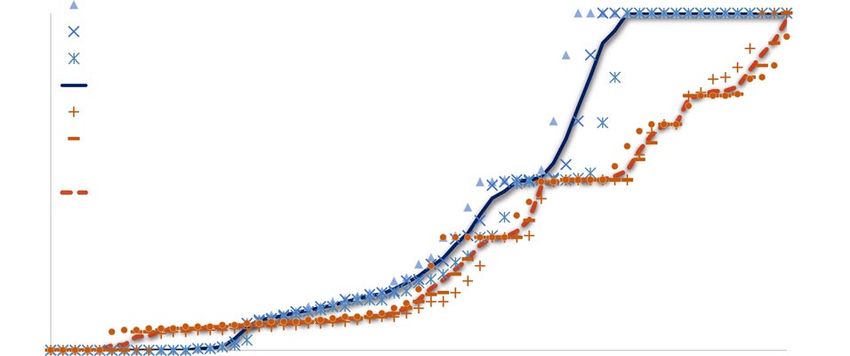
www.nature.com/scientificreports/
Figure 3. Time course of RGCs response. Membrane potential as a function of time at stimulation frequency
of 200 Hz and 100 µA current amplitude: (A) D1-bistratified. (B) A2-monostratified. D1 cells can better sustain
repetitive spikes at high frequency of stimulation compared to A2 cells.
RGC types
A2-monostratified D1-bistratified
Axon diameter (μm) Soma diameter (μm) Axon diameter (μm) mean Soma diameter (μm)
Measure mean ± SD mean ± SD ± SD mean ± SD
Morphological data 1 ± 0.2 23 ± 4 0.9 ± 0.1 14 ± 3
SF (Hz) 120 200 120 200 120 200 120 200
WAFR (Hz) 116 121 114.9 113.7 120 185.2 119.5 152.5
Table 1. RGCs quantitative data and responses at 120 Hz and 200 Hz. In case of modulations in the axon
diameter, the soma diameters of the A2 and D1 RGCs were set to 20 µm and 12 µm, respectively. The axon
diameters of A2 and D1 cells were fixed to 1 µm and 0.9 µm, respectively for the soma diameter modulations
analysis. SF Stimulus frequency, WAFR Weighted average firing rate.
a larger population of RGCs taking into account morphological variations within a single RGC type. We sepa-
rately altered the diameters of the soma and axon within one standard deviation of the mean for both cells based
upon the quantitative data available from the literature25,26. Then, the weighted average firing rates (WAFR) of
each cell at two stimulation frequencies of 120 Hz and 200 Hz were computed (Table 1). We focused our analysis
on RGCs response at high frequency because of our interests in excitability of cells at a high rate of stimulation.
While spiking activity in both cells follows the monotonous stimulus pulse at 120 Hz, the overall WAFR of
D1-bistratified cells is greater than A2-monostratified cells at 200 Hz considering changes in both soma and axon
diameters. Both soma and axon diameters influence RGCs firing rates, however the impact of soma diameter is
more pronounced at high frequency. We also considered the effects of the sodium channel band (SOCB) and axon
hillock (AH) length modulations on sensitivity of RGCs to high frequency electrical stimulation. Recent studies
have shown that cells with smaller soma size may have in average smaller SOCB and AH length39,40. Therefore,
we decreased the length of the SOCB and AH in D1 cells with 12 µm soma diameter (from 40 to 20 µm) and
compared the sensitivity of D1 cells to high stimulus frequency with D1 cells having the soma size of 17 µm as
shown in Fig. 4. Although the reduced length of the SOCB has lowered the stimulus threshold, we observed that
the contribution of soma size alterations to the sensitivity of RGCs to high stimulus frequency remains superior.
Given the positive correlations of the soma diameter, axon diameter, and axon initial segment (AIS) lengths,
we investigated the firing rates of these RGCs as a function of amplitude modulations at 200 Hz. We incorporated
modulations in soma diameter, axon diameter, and SOCB length within one standard deviation of the mean
for both cells (Fig. 5)25–27,39,40. The WAFR of D1 cells remained greater relative to A2 cells, suggesting the strong
contribution of the soma diameter to the responsiveness of RGCs at high frequency. We found a slower rate of
Scientific Reports | (2021) 11:5177 | https://doi.org/10.1038/s41598-021-84437-w 4
Vol:.(1234567890)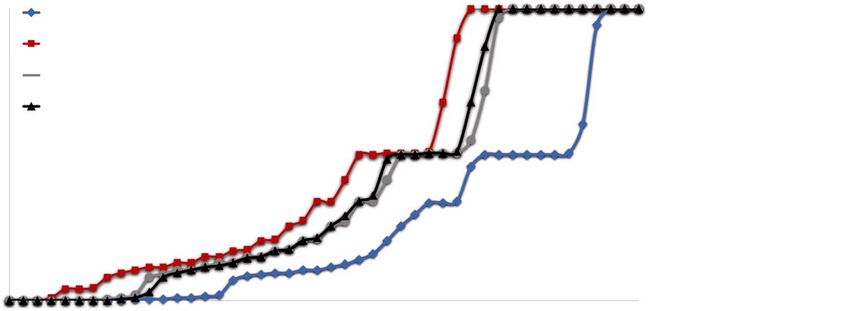
www.nature.com/scientificreports/
Figure 4. The impacts of the AH and SOCB length on D1-RGCs sensitivity to high frequency electrical
stimulation relative to the soma diameter. Firing rate is plotted as a function of modulations in current
amplitude at 200 Hz. Analysis of firing rate with the single variation of morphological parameters: soma
diameter, SOCB length, and AH and SOCB lengths. Results show that while reduction in the length of the
SOCB and AH decreases the responsiveness of D1 cells to high stimulus frequency, the influence of increase in
the soma diameter (from 12 to 17 µm) on the reduced sensitivity of the cell to high stimulus frequency is more
pronounced.
Figure 5. Response (firing rate) of A2 and D1 RGCs to electrical stimulation at 200 Hz with modulations
in morphometric parameters. The soma diameter (SD), axon diameter (AD), and SOCB length (SOCBL)
alterations of the two cells within one standard deviation of the mean have been investigated. A2 RGCs: SD = 23
± 4 μm; AD = 1 ± 0.2 μm; SOCBL = 30 ± 10 μm. D1 RGCs: SD = 14 ± 3 μm; AD = 0.9 ± 0.1 μm; SOCBL = 25 ±
5 μm. The weighted average firing rate (WAFR) of the cells indicates the higher excitability of D1 cells at high
frequency with relatively smaller SD, AD, and SOCBL.
change in the number of spikes of A2 cells compared to D1 cells, indicating the difference in the kinetics and
densities of ionic channels across RGCs may also influence the rate of spikes at high stimulation frequency. The
A2 cell response further shows lower sensitivity to modulations in morphological parameters than that of the
D1 cell at high firing rates (Fig. 5). In the next section, we validate our findings with experiments on epiretinal
electrical stimulation of A2-type R GCs8, showing that small cells can better maintain their response at high
stimulus frequency compared to large cells.
Verification of computational results with in‑vitro experiments. To consolidate our observations
on the impacts of morphological structure, we reproduced the experimental results on the responsiveness of
A2-RGC subtype to high epiretinal electrical stimulation frequency8 using our morphologically and biophysi-
cally realistic A2 cell model. We modified the A2-cell morphology to divide the cell size into small and large
based on both soma and dendritic field sizes. The small cell has soma and dendritic field diameters of 17 µm and
320 µm, respectively and the large cell has soma and dendritic field diameters of 26 µm and 500 µm, respectively.
We applied the same stimulus waveform used for the frequency response of RGCs in8, the asymmetric biphasic
pulse with a short cathodic phase of 60 µs and 120 µm interphase gap followed with a longer anodic phase of
480 µm duration. Similarly, the efficacy is defined as the minimum current amplitude to achieve more than 90%
spikes from the stimulus pulses. Figure 6A shows suprathreshold current normalized to threshold at 1 Hz for both
the small and large cells over a range of frequency as defined i n8. The stimulus threshold remains unchanged up
to 10 Hz as expected since the membrane voltage settles back at resting potential prior to the following stimulus
pulse. Increasing stimulus frequency increases suprathreshold current required to maintain the same efficacy,
and the level of increase in current is higher for large A2-cells at high frequency (Fig. 6A). This indicates the
highest threshold percentage difference between low and high frequencies for large cells, which directly affects
the probability of generating spikes at high frequency.
There are electrophysiological and morphological factors affecting the responsiveness of RGCs at high stimu-
lus frequency. In this section, similar to the performed experiment, we analyzed effects of cell size on maintaining
Scientific Reports | (2021) 11:5177 | https://doi.org/10.1038/s41598-021-84437-w 5
Vol.:(0123456789)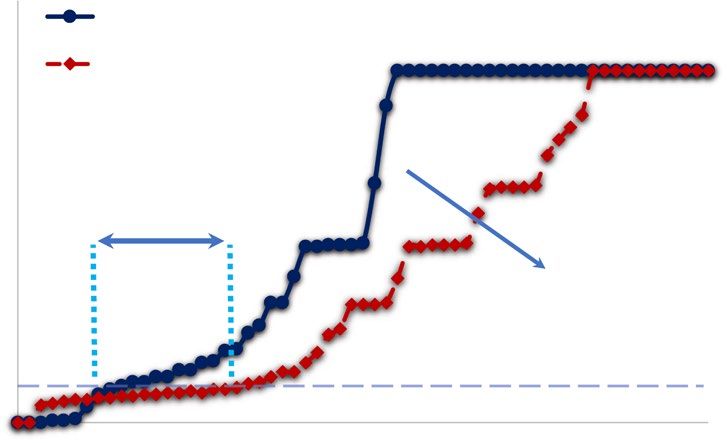
www.nature.com/scientificreports/
Figure 6. The model verification with in-vitro experimental results f rom8. (A) Suprathreshold current required
to reach at least 90% efficacy as alterations in stimulus frequency for both small and large A2-cells using an
asymmetric cathodic-first stimulus waveform (normalized to 1 Hz). The solid and shaded bars demonstrate
the normalized stimulus threshold of large and small cells, respectively. The figure clearly shows the greatest
stimulus threshold difference between small and large cells at high frequency. (B) Impacts of soma and dendritic
field sizes on efficacy for a given pulse amplitude (435 µA cathodic phase amplitude). Small cells are able to
maintain their response at higher efficacy compared to large cells.
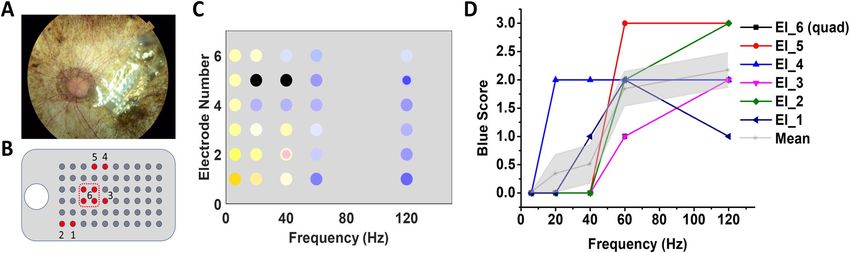
Figure 7. Color perception in a blind RP patient fitted with the Argus II retinal prosthesis. (A) Fundus image
showing the location of the electrode array on the retina; (B) Mapping of the electrodes selected for testing
in the visual field; (C) Color sensations elicited by different electrodes under frequency modulation; (D) Blue
scores of the color sensations calculated by the following scaling system: 0—no blue or purple perception; 1—
blue or purple sensation reported, but the color is highly unsaturated (saturation ≤ 0.2); 2—more significant
blue or purple sensation reported (0.2 < saturation ≤ 0.5); 3—strong blue or purple sensation reported
(saturation > 0.5). The gray shaded area represents the standard error.
excitability of cells at high rate of stimulation. Figure 6B demonstrates changes in efficacy as alterations in
stimulus frequency. Efficacy reduces as frequency is increased, and large cells have lower efficacy at high repeti-
tive stimulus pulses compared to small cells. This agrees with experiments on A2-RGCs, showing smaller cells
can better sustain high stimulation f requency8. Using our computational platform, we were able to consider the
impact of dendritic field size separately from the soma size. We changed the size of the dendritic field for the
given soma diameters of the small and large RGCs (17 µm and 26 µm), comparing solid and dash lines in Fig. 6B.
Alterations in the dendritic field size have a negligible effect on the efficacy of both small and large A2 RGCs,
which explains the dominant effect of soma size on the excitability of these cells.
Clinical testing in a patient with retinal implant. Earlier studies in blind RP subjects fitted with
the Argus II and the IMI retinal prosthesis demonstrated that color sensation could be elicited by electrical
stimulation of the photoreceptor-less retina and that the colors perceived may be shifted by the stimulation
frequency32,33. More recently, Yue et al. found that when phosphene brightness was maintained, increased stimu-
lation frequency consistently shifted phosphene perception to blue tinted colors in 5/7 Argus II subjects t ested32.
These subjects were visually deprived by RP since adolescence or early-to-middle adulthood, having been blind
for decades without light or color perception32. An example of the changes in color perception in one subject is
shown in Fig. 7. The electrode array was implanted in the parafoveal locations superior temporal to the optic disc
(Fig. 7A). Color perception was tested in five individual electrodes (Electrodes 1–5) and one group of 4 neigh-
Scientific Reports | (2021) 11:5177 | https://doi.org/10.1038/s41598-021-84437-w 6
Vol:.(1234567890)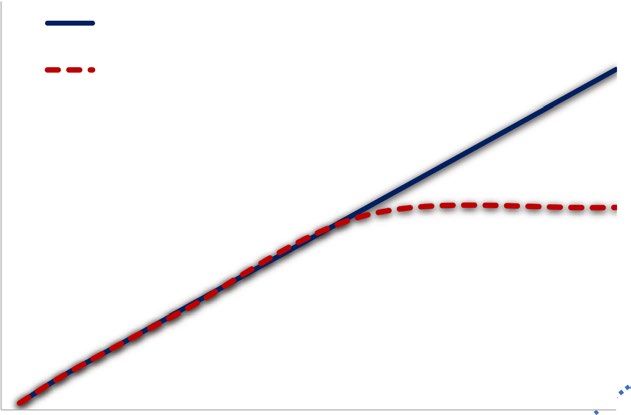
www.nature.com/scientificreports/
boring electrodes (Electrode Quad 6). Relative locations of these electrodes in the visual field are mapped in
Panel B. Hue and saturation of the colors reported were depicted in Panel C, in which two colors simultaneously
perceived in one phosphene were presented in concentric rings. When the stimulation frequency increased from
6 to 120 Hz, the phosphene perceived changed from yellow/white dominated colors to blue dominated colors.
Other colors such as black and pink were sporadically reported only. Quantification of the blue sensation yielded
a blue score that consistently increased with the frequency, suggesting the possibility of using frequency modula-
tion to selectively activate different color pathways in the inner retina, bypassing the cone photoreceptors.
Discussion
A multi-scale computational study using a combined AM-NEURON model was conducted to further our under-
standing of the cellular, and potentially color, selectivity of RGC subtypes in the electrically stimulated degen-
erated retina. We first developed realistic models of the two classified ganglion cells known as D1-bistratified
and A2-monostratified. Their responses to electrical stimulation with alterations in stimulation frequency were
further evaluated. Our findings show that: (i) the greatest differential firing rate between D1-RGCs and A2-RGCs
can be achieved at high stimulation frequency; (ii) with the proper choice of current amplitude at high frequency,
D1-RGCs can be selectively activated; (iii) there are electrophysiological and morphological factors influencing
RGCs response to high stimulus frequency; (iv) RGCs with a relatively small soma size are more responsive to
high stimulus frequency.
Our results show that D1 cells can be selectively activated at a 20 Hz firing rate, similar to the typical stimulus
frequency employed in the epiretinal prosthetic systems, which is found to induce stable p hosphenes41,42 with
a proper selection of current amplitude at 200 Hz stimulus frequency. We found that the greatest difference in
the current amplitude required to reach 20 Hz firing rate in both cells (~ 22 µA) can be achieved using a high
frequency of 200 Hz. The differential current threshold between low and high stimulation frequencies is further
supported in Fig. 6A, comparing the suprathreshold current required to reach 90% efficacy (spike probability)
for small and large A2 cells using the optimized waveform in8. Using our computational platform, we found a
small difference in the required current for gaining 90% efficacy between the cells at low stimulation frequency
compared to a significant difference in the current amplitude at high frequency, as shown in Fig. 6A (12.5 µA at
10 Hz, compare to 109 µA at 200 Hz). Again, this manifests the greatest chance for selective activation of small
cells at high frequency.
We gained additional insights into the underlying mechanisms leading to increased responsiveness of D1
cells and the potential for selective excitation of this cell type at high frequency. We found the greatest impact
on the capability of these cells to elicit spikes at high frequency to be related to the soma diameter compared
to the axon diameter (Table 1). Our analysis shows that D1 RGCs with in average smaller soma size are better
able to follow high repetitive stimulus pulses. We further considered the impact of possible differences in AIS
properties between the two RGC subtypes on their response to high frequency stimuli. Recently, a positive cor-
relation has been reported between the length of the AIS and the soma size across a population of α S R GCs40. In
addition, increase in the length of the SOCB has shown to reduce the stimulation threshold of RGCs to electrical
stimulation38. Our computational models allowed us to separately investigate the role of modulations in the length
of the AH and SOCB on the sensitivity of RGCs to high stimulation frequency. Although reducing the length of
SOCB in D1 cells with smaller soma size decreased the responsiveness of this cell to high stimulus frequency,
the contribution of soma diameter changes is found to be more significant. Comparing the response of the two
cells with simultaneous modulations in the soma diameter, axon diameter, and SOCB length established higher
responsiveness of D1 cells compared to A2 cells at a high stimulus frequency (Fig. 5). This finding is consistent
with the experiments on frequency response of A2-RGC type, showing that small cells can better sustain high
rate of spikes at high f requency8.
Consistent with a recent study in α R GCs39, we found negligible influence of the AH length and dendritic field
size, and a relatively strong impact of soma size on soma RGCs threshold. The significant contribution of the AIS
length relative to other morphological factors to the AIS threshold of RGCs with a point-source electrical stimu-
lation was reported in39. In our recently published study12, an almost two-fold increase in the differential AIS
threshold of these morphologically- and biophysically-distinct RGCs using a disk electrode was found for fixed
AIS properties of the cells. This indicates the increased sensitivity of RGCs threshold to soma diameter changes
using the current large disk electrode of Argus II prosthetic systems, rather than a point source. In the present
study, we further explored the enhanced current window required for selective activation of RGCs in response
to high stimulus frequency relative to single stimulus pulse and low stimulation frequency. The differences in
the biophysical properties, spike width, spike latency, and the duration of the refractory period across RGCs can
contribute to the slow-moving firing rate of the A2 cell with increases in the current amplitude, suggesting the
reduced potential for preferential excitation of this cell type at high frequency.
It is also worth noting that while there is a positive correlation between soma diameter and axon diameter of
monostratified cells, this correlation is shown to be not significant in bistratified RGCs in the primate r etina26.
Therefore, not only smaller soma size, but also relatively larger axon diameter of D1-type would lead to higher
chance of spikes in this RGC type at high stimulation frequency. Hence, a plausible explanation behind the domi-
nation of the blue percept at high frequency in Argus II patients could be relatively large axon and small soma
diameters of small bistratified RGCs, assuming their contributions to “blue-yellow” color opponent pathway in
the retinal circuitry28–31.
Studies reported the gradual changes in the electrode impedance and therefore the perceptual threshold of
Argus I and II i mplants43,44. Increase in electrode to retina distance was shown to increase the perceptual thresh-
old of Argus I subjects43. However, the recent clinical data from one subject with Argus II implant reported no sig-
nificant changes in the electrode-retina distance up to 40 months after implantation, suggesting the contribution
Scientific Reports | (2021) 11:5177 | https://doi.org/10.1038/s41598-021-84437-w 7
Vol.:(0123456789)www.nature.com/scientificreports/
Figure 8. The influence of electrode-cell distance on response and selective activation of RGCs at 200 Hz.
(A) Firing rates of the A2 and D1 RGCs as a function of current amplitude for four difference electrode-soma
distances (20 µm, 50 µm, 100 µm, and 200 µm). (B) Current amplitude difference between the two cells required
to obtain firing rates (FRs) of 20 Hz, 100 Hz, and 200 Hz with increase in the electrode-soma distance. Data
show that the differential firing rate and current amplitude of RGCs increased with increasing electrode-cell
distance, suggesting the enhanced chance for preferential activation of D1 cells.
of other factors, such as changes in impedance due to electrochemical reactions on the electrode surface, to the
perceptual threshold changes of the s ubject44. More tests need to be done clinically to measure the electrode-
retina distance/orientation variations across the electrodes and Argus II subjects, and analyze the impact on
the perceptual threshold. Using our multi-scale computational modeling platform, we explored the influence
of modulations in the electrode-to-retina distance on the response of RGCs at high frequency. So far, we have
only considered the response of the two cells for a given 50 µm electrode-to-cell distance. Figure 8A compares
the firing rates of the A2 and D1 RGCs as alterations in the current amplitude for 20 µm, 50 µm, 100 µm, and
200 µm electrode-soma distances at 200 Hz. Increased distance between the electrode and cell bodies leads to
increased current threshold9. Further, we computed the difference in the required current amplitude to reach
firing rates of 20 Hz, 100 Hz, and 200 Hz for both cells (Fig. 8B). The differential response of the two cells sig-
nificantly increases with increase in the electrode-cell distance, suggesting the enhanced chance for selective
activation of the D1-bistratified cell.
Recent clinical data reported that 2 of the 7 Argus II subjects did not perceive blue color at high stimula-
tion frequency32. Interestingly, the perceptual thresholds in the two non-blue-sensing subjects were found to
be lower in average compared to the other 5 subjects. The lowest perceptual threshold was also perceived by
the non-blue-sensing s ubject32. Although no significant difference in the electrode-retina interface among the
subjects was observed, our computational analysis suggests that even small variations in the electrode-retina
distance across the electrodes and among the Argus II subjects can provide a plausible explanation of the blue
perception difference between the two groups. The low threshold of the non-blue-sensing subject may indicate
the closer electrode-to-retina distance and therefore less likelihood of selectively activating the small bistratified
RGCs. Further investigation is required to better understand the correlation between electrode-retina distance
and blue sensation of the subjects.
Our computational findings, along with the experimental verifications, suggest that there are electrical
stimulation parameters with the greatest contribution to changes in RGCs stimulus threshold and perceptual
threshold. These parameters consist of stimulation frequency, electrode-retina distance, electrode impedance,
and pulse duration that can play significant roles in possible selective activation of different RGCs, as well as
avoiding activation of RGCs axon bundles. For example, short stimulus pulse durations with relatively higher
stimulation thresholds have proven effective in achieving a more focal response in RGCs12–15. While the impact
of pulse width modulations on the blue sensation of the Argus II subjects was found to be n egligible32, we will
further investigate the influence of pulse duration changes on selective activation of RGCs.
Increasing both stimulation frequency and current amplitude results in an increase in phosphene brightness
with a more pronounced impact of stimulation f requency45. Saturation in brightness and increase in phosphene
size have been reported with increasing current amplitude45,46. Lowering the current amplitude as the simula-
tion frequency increases is required for controlling the perceptual brightness and perceiving the color of the
phosphene, including the blue percept by Argus II s ubjects32. Our computational results indicate that increasing
either the stimulation frequency or current amplitude leads to an increase in firing rate. For example, as shown
in Fig. 6B, for a given current amplitude of 435 µA, while the efficacy of small cells at 200 Hz is 30.5% (0.305 ×
200 = 61 Hz firing rate), the efficacy is 100% at 20 Hz which means the firing rate of 20 Hz. Taken together, evi-
dence suggests a positive correlation between rate of RGCs spikes and phosphene brightness. Therefore, electrical
stimulation at high frequency with a proper current amplitude tuning for brightness control results in a better
chance for selective activation of RGCs and sensation of blue percept in the subjects.
The current amplitudes associated with the maximum firing rates of A2 and D1 RGCs do not necessarily
mean the saturation of perceptual brightness in the subjects. While the maximum spiking frequency of RGCs
Scientific Reports | (2021) 11:5177 | https://doi.org/10.1038/s41598-021-84437-w 8
Vol:.(1234567890)www.nature.com/scientificreports/
has been reached with direct activation, network-mediated response of RGCs may further alter the firing rates
of RGCs. We did not consider the presynaptically driven response of RGCs in the present study. Further, high
frequency of stimulation may result in phosphenes fading and cessation of indirect RGCs e xcitation47,48. The
cross-talk across the electrodes using synchronous stimulus pulses has been reported to increase the brightness
of phosphenes as w ell49. Given direct and indirect activations of RGCs using the 0.46 ms pulse width, the rate of
RGCs spikes leading to a moderate perceptual brightness of the subjects is not known. Therefore, we compared
the differential amplitude of RGCs leading to 20 Hz, 100 Hz, and 200 Hz firing rates of the cells at 200 Hz fre-
quency stimuli as depicted in Fig. 8B.
Center-surround receptive field structure (S ON versus L + M OFF, S: short L: long, M: middle wavelength), or
“blue-yellow” opponent visual pathway has already been identified. Short wavelength sensitive (S) cone photore-
ceptors make selective connection with S-cone ON bipolar cells, and L and M cones are presynaptic to OFF cone
bipolar cells, then signals from these pathways are transmitted to inner and outer dendrites of small bistratified
ganglion cells28–31,50. A recent study has suggested that, although small bistratified RGCs play a role in blue-yellow
perception in periphery, this percept is mediated by other pathways in central retina51. This hypothesis is based
on testing in patients with congenital stationary night blindness (CSNB), who lack the metabotropic glutamate
receptor (mGluR6), which is leading to loss of response sensitivity to ON pathway and presumably eliminating
the synaptic connection from S cone to S cone ON bipolar c ells52. Terasaki et al.52 observed that blue/yellow
color vision of these subjects was intact in central retina, but impaired in peripheral retina, suggesting S-ON
bipolar cells and therefore small bistratified RGCs do not contribute to blue-yellow perception in central retina.
However, most recently Thoreson and Dacey53 have stated that while S-ON response is diminished in CSNB
patients, L + M OFF response remains preserved (see Fig. 10A i n53),54, and OFF inputs can be sufficiently strong
enough to carry information about the light response and compensate for lack of inputs from ON pathway. They
further raised this theory to be doubtful by stating: “there are also no obvious deficits in the perception of ON
versus OFF luminance contrast in CSNB patients”53.
In the primate visual system, there are three pathways: parvocellular (P), magnocellular (M), and koniocel-
lular (K)55,56. Parasol ganglion cells with large soma and dendritic field size project to the M pathway and are
color insensitive57. However, midget and bistratified ganglion cells with small cell bodies and dendritic fields
send neural signals to the P and K pathways and they are involved in color v ision58–60. Even if small bistratified
RGCs are not involved in blue-yellow color opponency, the large soma size of color insensitive parasol cells and
small soma size of color selective midget cells possibly explain the importance of our computational findings,
particularly due to the fact that the subjects could occasionally see other colors such as purple and gold at high
frequency as well32.
Our results are limited to only two types of RGCs and the sensitivity of other RGCs to high stimulation fre-
quency requires further investigation. Since the band information is not clearly identified for the two RGCs, in
this work we assumed identical axonal biophysics for both cells and focused on morphological factors such as
soma, dendritic field, axon diameters, and the length of the AIS. The impact of retinal degeneration on changes
in the morphometric parameters of the cells assumed to be negligible in the present study. We identified the soma
diameter, SOCB length, and biophysical differences between the cells as critical factors affecting responsiveness
of RGCs at high frequency. Future studies will incorporate morphologically and electrophysiologically other
types of RGCs with a wide range of cell body sizes as well as the effect of electrode position on response of RGCs
to high stimulation frequency. We will develop a synthetic retinal network, modeling a large population of dif-
ferent RGCs and analyzing the sensitivity of cells response to various morphological changes and modulations
in electrode orientations with respect to the surface of the retina. We will further design electrical stimulation
waveforms with the aim of independent activation of various RGCs at high stimulation frequency.
This study is motivated by our intent to identify mechanisms that will allow us to potentially encode additional
information such as color in a visual prosthetic system. Our multi-scale computational framework helped us fur-
ther our understanding of the color-coding sensitivity in the electrically stimulated degenerated retina. Assuming
significant contribution of small bistratified retinal ganglion cells in blue-yellow color vision, we were able to
selectively target these cells with in average small soma size at high stimulus frequency with a careful modula-
tion of current amplitude. Our computational finding may be correlated with the clinical study in patients with
epiretinal prostheses showing that stimulation frequency played a role in the percept of colors, and particularly
the blue percept at high frequency. The verification of the computational models with the experimental data
in rats and preliminary experimental results in patients with epiretinal implants, allowed us to better elucidate
the underlying mechanisms of differential percept and provide more insights toward the development of visual
prosthetic systems with increased information content for the patient.
Methods
Admittance method/NEURON computational framework. In this work, we utilized our three-
dimensional Admittance Method (AM)/NEURON multi-scale computational modeling p latform12,61–73 to pre-
dict the electric fields generated inside retinal tissue, coupled to multi-compartmental models of neurons in
order to determine the activation of realistic RGCs. The Admittance Method linked with NEURON has proven
a powerful approach not only for studies of field distribution inside the tissue due to electrical stimulation, but
also providing a platform to analyze realistic representations of various cell t ypes12,61–73.
Admittance method: constructing the retina tissue and electrodes. In this approach, compu-
tational models of the retina tissue and implant electronics are created through discretization of segmented
images, and electrical properties are assigned to each voxel of the model. Current sources are applied as input
and the resulting voltages are computed at each node. A linear interpolation function is used to obtain the volt-
Scientific Reports | (2021) 11:5177 | https://doi.org/10.1038/s41598-021-84437-w 9
Vol.:(0123456789)www.nature.com/scientificreports/
age at the center of each neuronal compartment, which is utilized for the computation of the neural response
using the NEURON simulator (v7.4; https://neuron.yale.edu/neuron)74. Further details can be found in61–67. The
AM-NEURON computational platform has been recently parallelized by our group and accommodates adaptive
multiresolution meshing. In this work, the minimum model resolution was set to 10 μm and we merged at most
64 voxels in areas of lower resolution, away from boundaries between tissues.
To represent the degenerated retina tissue, the thickness of the outer part of the retina, which consists of outer
plexiform and outer nuclear layers, were mostly reduced in size. The retina laminar properties are identical to
those utilized in our previous w ork62. The computational model of a stimulating electrode of diameter 200 μm
is placed on the top-center of the bulk retina tissue, which is discretized in 2 million computational cells, and is
positioned 50 µm from the cell bodies of computational models of the RGCs unless otherwise stated. The resis-
tivity of platinum (10.6 × 1 0–8 Ω m) is utilized in the model of the electrode, which is surrounded by insulating
material. The admittance method was then used to solve the voltage generated inside the tissue by the stimulus
current. Unless otherwise specified, we used a symmetric charge-balanced biphasic pulse of constant pulse
width (0.5 ms) with no interphase gap (IPG), and amplitude modulations from 20 µA to 140 µA. The stimulation
frequencies ranging from 6 to 200 Hz were considered. The parameters used are identical to those used in the
experimental studies of the patients with epiretinal i mplants32. Resulting extracellular voltages were applied to
multi-compartment models of neurons and computation executed using embedded NEURON software. Neuronal
responses of individual retinal ganglion cells were then recorded.
NEURON: retinal ganglion cell models. The morphology of ganglion cell types was extracted as SWC
files from the NeuroMorpho d ataset75,76 and imported to NEURON software74 as shown in Fig. 1. The extracted
cells are of types A2 and D1, and their morphological parameters can be found in77. These parameters are pro-
vided in Fig. 1 and utilized for our AM-NERUON simulations unless otherwise noted. D1-bistratified cells
consist of two levels of dendritification, in which one layer of the dendritic tree is ramified inside the inner part,
and another is in the outer section of the inner plexiform layer. The dendritic structure of the A2-monostratified
cell types is only distributed in the inner part of the inner plexiform layer.
These morphologically realistic cells are compartmentalized and their responses to electrical stimulation are
solved based on multi-compartment Hodgkin–Huxley models. Each compartment includes several ionic chan-
nels, and they are modeled as voltage-dependent conductances in parallel with the membrane capacitance. In
addition to the five ionic channel models from Fohlmeister and Miller78,79 for the ganglion cells, two more ionic
currents have been considered to more accurately represent the intrinsic electrophysiological properties of differ-
ent ganglion cell types including the difference between ON and OFF cell types and the phenomenon of rebound
excitation, which plays a fundamental role in encoding visual p ercepts80. The hyperpolarization-activated, and
the low voltage activated (LVA) calcium ionic channels were modelled as in81,82 respectively. More details can be
found in37,61,80. The expressions of rate constants for different ionic channels are given in Supplementary Table S1.
Recently, a single-compartment model of ganglion cell was used to find the constraints for the maximum
ionic conductance values, in which the model output can replicate the electrophysiological properties of dif-
ferent RGC t ypes37. We first reproduced the results i n37 and then further developed the RGC models to include
multi-compartmental representations and tuned the density of ion channels accordingly in soma, dendrites
and axon. In addition, since the axons were missing from the available morphologies, we extracted them from
another dataset, modified to include the axon initial segment, and patched them to the cell body of both cells.
The morphological properties of the axon are adapted from38 as shown in Fig. 1. The experimentally recorded
signals of A2 and D1 cells i n37 were used for model tuning. The range of variation in the density of ion channels
of the dendrites, and axon is based on the constraints demonstrated by Fohlmeister et al.79. The tuned biophysical
properties of both A2 and D1 cells for the soma, dendrites, and axon are provided in Supplementary Table S2
and S3. Supplementary Fig. S1 shows that the morphologically and biophysically realistic models of RGCs
closely reproduce the measured electrophysiological responses provided in37. For this validation, intracellular
hyperpolarizing step currents of 200 pA with 400 ms duration were injected to the cells and their responses were
recorded from the cell body (soma) running NEURON simulations. As illustrated, the RGC’s model can closely
replicate the behavior of the experimentally recorded cells, including the rebound excitation phenomenon, which
is described as action potentials initiation after termination of a hyperpolarizing current.
Admittance method linked with NEURON. The multi-compartment models of neurons in the simula-
tion platform are integrated in our computational multiscale simulation package. For the extracellular stimula-
tion of the retina tissue, the Admittance Method was used to calculate the resulting voltage at each node for a
given input current. The voltage at the center of each voxel was estimated using a linear interpolation function.
Since the Admittance Method and NEURON use the same coordinates, a computational code was developed to
superimpose the potential computed in the tissue volume into the NEURON model and apply it as an extracel-
lular voltage, using the “extracellular” mechanism built into NEURON software, to each compartment in the
Hodgkin–Huxley circuit in series with the membrane12,61–71.
Individual responses of both A2 and D1 ganglion cell types to extracellular epiretinal stimulation were
computed using a range of stimulus frequency with the goal of identifying the responsiveness of RGCs at high
frequency of s timulation61. This will further help translate from biophysically realistic models of the retinal
ganglion cells to how color percepts might be elicited from patients with retinal prostheses.
Received: 28 September 2020; Accepted: 15 February 2021
Scientific Reports | (2021) 11:5177 | https://doi.org/10.1038/s41598-021-84437-w 10
Vol:.(1234567890)www.nature.com/scientificreports/
References
1. Humayun, M. S. et al. Pattern electrical stimulation of the human retina. Vision Res. 39, 2569–2576 (1999).
2. Weiland, J. D. & Humayun, M. S. Retinal prosthesis. TBME 61, 1412–1424 (2014).
3. Weiland, J. D., Walston, S. T. & Humayun, M. S. Electrical stimulation of the retina to produce artificial vision. Annu. Rev. Vis. Sci.
2, 273–294 (2016).
4. da Cruz, L. et al. Five-year safety and performance results from the argus II retinal prosthesis system clinical trial. Ophthalmology
123, 2248–2254 (2016).
5. Stingl, K. et al. Subretinal visual implant alpha IMS: Clinical trial interim report. Vision Res. 111, 149–160 (2015).
6. Kosta, P. et al. Electromagnetic safety assessment of a cortical implant for vision restoration. IEEE J. Electromagn. Microw. Med.
Biol. 2, 56–63 (2018).
7. Beyeler, M. et al. A model of ganglion axon pathways accounts for percepts elicited by retinal implants. Sci. Rep. 9, 9199–9116
(2019).
8. Hadjinicolaou, A. E. et al. Optimizing the electrical stimulation of retinal ganglion cells. IEEE Trans. Neural Syst. Rehabil. Eng. 23,
169–178 (2015).
9. Mueller, J. K. & Grill, W. M. Model-based analysis of multiple electrode array stimulation for epiretinal visual prostheses. JNE 10,
036002 (2013).
10. Freeman, D. K., Eddington, D. K., Rizzo, J. F. & Fried, S. I. Selective activation of neuronal targets with sinusoidal electric stimula-
tion. J. Neurophysiol. 104, 2778–2791 (2010).
11. Weitz, A. C. et al. Improving the spatial resolution of epiretinal implants by increasing stimulus pulse duration. Sci. Transl. Med.
7, 203–318 (2015).
12. Paknahad, J., Loizos, K., Humayun, M. & Lazzi, G. Targeted stimulation of retinal ganglion cells in epiretinal prostheses: A mul-
tiscale computational study. TNSRE 28, 2548–2556 (2020).
13. Chang, Y., Ghaffari, D. H., Chow, R. H. & Weiland, J. D. Stimulation strategies for selective activation of retinal ganglion cell soma
and threshold reduction. J. Neural Eng. 16, 026017 (2019).
14. Schiefer, M. A. & Grill, W. M. Sites of neuronal excitation by epiretinal electrical stimulation. TNSRE 14, 5–13 (2006).
15. Jensen, R. J., Ziv, O. R. & Rizzo, J. F. Thresholds for activation of rabbit retinal ganglion cells with relatively large, extracellular
microelectrodes. Invest. Ophthalmol. Vis. Sci. 46, 1486 (2005).
16. Freeman, D. K. & Fried, S. I. Multiple components of ganglion cell desensitization in response to prosthetic stimulation. J. Neural
Eng. 8, 016008 (2011).
17. Fried, S. I., Hsueh, H. A. & Werblin, F. S. A method for generating precise temporal patterns of retinal spiking using prosthetic
stimulation. J. Neurophysiol. 95, 970–978 (2006).
18. Sekirnjak, C. et al. Electrical stimulation of mammalian retinal ganglion cells with multielectrode arrays. J. Neurophysiol. 95,
3311–3327 (2006).
19. Soto-Breceda, A., Kameneva, T., Meffin, H., Maturana, M. & Ibbotson, M. R. Irregularly timed electrical pulses reduce adaptation
of retinal ganglion cells. J. Neural Eng. 15, 056017 (2018).
20. Jensen, R. J. & Rizzo, J. F. Responses of ganglion cells to repetitive electrical stimulation of the retina. J. Neural Eng. 4, S1–S6 (2007).
21. Im, M., Werginz, P. & Fried, S. I. Electric stimulus duration alters network-mediated responses depending on retinal ganglion cell
type. J. Neural Eng. 15, 036010 (2018).
22. Guo, T. et al. Mediating retinal ganglion cell spike rates using high-frequency electrical stimulation. Front. Neurosci. 13, 413 (2019).
23. Twyford, P., Cai, C. & Fried, S. Differential responses to high-frequency electrical stimulation in ON and OFF retinal ganglion
cells. J. Neural Eng. 11, 025001 (2014).
24. O’Brien, B. J., Isayama, T., Richardson, R. & Berson, D. M. Intrinsic physiological properties of cat retinal ganglion cells. J. Physiol.
538, 787–802 (2002).
25. Sun, W., Li, N. & He, S. Large-scale morophological survey of rat retinal ganglion cells. Vis. Neurosci. 19, 483–493 (2002).
26. Walsh, N., Ghosh, K. K. & FitzGibbon, T. Intraretinal axon diameters of a New World primate, the marmoset (Callithrix jacchus).
Clin. Experiment. Ophthalmol. 28, 423–430 (2000).
27. Huxlin, K. R. & Goodchild, A. K. Retinal ganglion cells in the albino rat: revised morphological classification. J. Comp. Neurol.
385, 309–323 (1997).
28. Dacey, D. M., Crook, J. D. & Packer, O. S. Distinct synaptic mechanisms create parallel S-ON and S-OFF color opponent pathways
in the primate retina. Vis. Neurosci. 31, 139–151 (2014).
29. Dacey, D. M. Circuitry for color coding in the primate retina. Proc. Natl. Acad. Sci. USA 93, 582–588 (1996).
30. Dacey, D. M. & Packer, O. S. Colour coding in the primate retina: Diverse cell types and cone-specific circuitry. Curr. Opin. Neu-
robiol. 13, 421–427 (2003).
31. Lee, B. B., Martin, P. R. & Grünert, U. Retinal connectivity and primate vision. Prog. Retin. Eye Res. 29, 622–639 (2010).
32. Yue, L. et al. Restoring color perception: A frequency modulated electrical stimulation strategy in patients with end-stage retinitis
pigmentosa. Ophthalmology, in press (2020).
33. Hornig, R. et al. The IMI Retinal Implant System. Artificial Sight Basic Research, Biomedical Engineering, and Clinical Advances
(Springer, New York, 2007).
34. Stanga, P. E. et al. Patients blinded by outer retinal dystrophies are able to perceive color using the argus II retinal prosthesis system.
Invest. Ophthalmol. Vis. Sci. 52, 4949 (2011).
35. Lin, T., Yue, L. & Humayun, M. S. Retinal Prostheses: The Argus System. Technology and innovation 19, 605–611 (2018).
36. Humayun, M. S. et al. Visual perception in a blind subject with a chronic microelectronic retinal prosthesis. Vision Res. 43,
2573–2581 (2003).
37. Qin, W. et al. Single-compartment models of retinal ganglion cells with different electrophysiologies. Network 28, 74–93 (2017).
38. Jeng, J., Tang, S., Molnar, A., Desai, N. J. & Fried, S. I. The sodium channel band shapes the response to electric stimulation in
retinal ganglion cells. J. Neural Eng. 8, 036022 (2011).
39. Werginz, P., Raghuram, V. & Fried, S. I. The relationship between morphological properties and thresholds to extracellular electric
stimulation in α RGCs. JNE 17, 45015–045015 (2020).
40. Raghuram, V., Werginz, P. & Fried, S. I. Scaling of the AIS and somatodendritic compartments in α S RGCs. Front. Cell Neurosci.
13, 436 (2019).
41. Ahuja, A. K. & Behrend, M. R. The Argus II retinal prosthesis: Factors affecting patient selection for implantation. Prog. Retin. Eye
Res. 36, 1–23 (2013).
42. Ahuja, A. K. et al. Factors affecting perceptual threshold in argus II retinal prosthesis subjects. Transl. Vision Sci. Technol. 2, 1
(2013).
43. Mahadevappa, M. et al. Perceptual thresholds and electrode impedance in three retinal prosthesis subjects. TNSRE 13, 201–206
(2005).
44. Yue, L., Wuyyuru, V., Gonzalez-Calle, A., Dorn, J. D. & Humayun, M. S. Retina-electrode interface properties and vision restora-
tion by two generations of retinal prostheses in one patient-one in each eye. JNE 17, 026020 (2020).
45. Nanduri, D. et al. Frequency and amplitude modulation have different effects on the percepts elicited by retinal stimulation. Invest.
Ophthalmol. Vis. Sci. 53, 205–214 (2012).
Scientific Reports | (2021) 11:5177 | https://doi.org/10.1038/s41598-021-84437-w 11
Vol.:(0123456789)You can also read