Rapid Encoding of New Memories by Individual Neurons in the Human Brain
←
→
Page content transcription
If your browser does not render page correctly, please read the page content below
Article

Rapid Encoding of New Memories by Individual
Neurons in the Human Brain
Highlights                                                         Authors
d   Contextual associations were used to model the formation of    Matias J. Ison, Rodrigo Quian Quiroga,
    new memories                                                   Itzhak Fried

d   Human single neurons changed their firing patterns to          Correspondence
    encode new associations
                                                                   mji3@le.ac.uk
d   Changes occurred at the exact moment of learning, even after
    single presentations
                                                                   In Brief
                                                                   Ison et al. recorded from single neurons in
d   The rapid speed of neural changes is compatible with           the human brain while patients learned
    episodic memory formation                                      contextual associations. They found that
                                                                   neurons change their firing to incept new
                                                                   associations even after one single
                                                                   presentation, thus providing a plausible
                                                                   mechanism underlying memory
                                                                   formation.

            Ison et al., 2015, Neuron 87, 220–230
            July 1, 2015 ª2015 The Authors
            http://dx.doi.org/10.1016/j.neuron.2015.06.016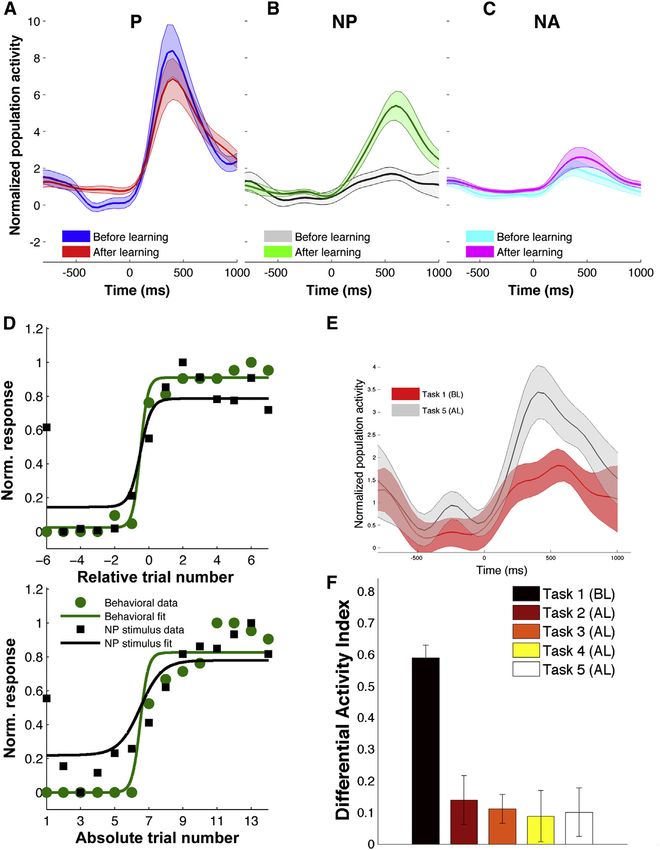
Neuron

                                                                                                                    Article

Rapid Encoding of New Memories
by Individual Neurons in the Human Brain
Matias J. Ison,1,2,* Rodrigo Quian Quiroga,1,2,5 and Itzhak Fried3,4,5
1Centre  for Systems Neuroscience, University of Leicester, Leicester, LE1 7QR, UK
2Department   of Engineering, University of Leicester, Leicester, LE1 7RH, UK
3Department of Neurosurgery, David Geffen School of Medicine and Semel Institute for Neuroscience and Human Behavior, University of

California Los Angeles, Los Angeles, CA 90095-7039, USA
4Functional Neurosurgery Unit, Tel-Aviv Medical Center and Sackler Faculty of Medicine, Tel-Aviv University, Tel-Aviv, 69978, Israel
5Co-senior author

*Correspondence: mji3@le.ac.uk
http://dx.doi.org/10.1016/j.neuron.2015.06.016
This is an open access article under the CC BY license (http://creativecommons.org/licenses/by/4.0/).

SUMMARY                                                              limited account on how single exposures to natural stimuli can
                                                                     give rise to the rapid encoding of new episodic memories.
The creation of memories about real-life episodes re-                    Neurons in the human MTL have been found to respond to con-
quires rapid neuronal changes that may appear after a                cepts that are related to each other (Quian Quiroga, 2012; Quian
single occurrence of an event. How is such demand                    Quiroga et al., 2005), such as two co-stars in the same television
met by neurons in the medial temporal lobe (MTL),                    series or a few researchers (previously unknown to the patients)
which plays a fundamental role in episodic memory                    involved in the experiments (Quian Quiroga et al., 2009; Viskontas
                                                                     et al., 2009). Here we designed a paradigm to study how fast
formation? We recorded the activity of MTL neurons
                                                                     these associations can be created and whether this speed is
in neurosurgical patients while they learned new asso-
                                                                     compatible with basic mechanisms of episodic memory creation.
ciations. Pairs of unrelated pictures, one of a person               We postulate that associations can be formed by partially over-
and another of a place, were used to construct a                     lapping cell assemblies encoding related concepts (Quian Quir-
meaningful association modeling the episodic mem-                    oga, 2012) and show experimental evidence of rapid changes
ory of meeting a person in a particular place. We found              of single-cell responses while contextual associations are
that a large proportion of responsive MTL neurons                    learned. As detailed below, in order to gain such evidence, we
expanded their selectivity to encode these specific as-              combined the ability to analyze trial-by-trial changes in the robust
sociations within a few trials: cells initially responsive           firing of highly selective MTL neurons (Quian Quiroga et al., 2005,
to one picture started firing to the associated one                  2008, 2009), with the rapid facility that humans have for learning
but not to others. Our results provide a plausible neu-              complex associations and consciously declare them.
                                                                         Patients first participated in a ‘‘screening session’’ (Quian Quir-
ral substrate for the inception of associations, which
                                                                     oga et al., 2005) in which a large number of images of people, an-
are crucial for the formation of episodic memories.
                                                                     imals, and places were presented to find out which (if any) of the
                                                                     recorded neurons responded to a picture. Data processing (spike
                                                                     detection, sorting, and identification of responsive cells) was
INTRODUCTION                                                         done quickly (typically within 1 hr) and 3 to 8 (median 7) pairs of
                                                                     pictures were selected. Each pair consisted of a picture of a per-
Neuroimaging investigations in humans and behavioral studies         son (or animal) and a picture of a landmark, for which there was a
of neurological patients have substantiated the importance of        neuron firing to one of them (the preferred ‘‘P’’ stimulus) and not to
the medial temporal lobe (MTL) for episodic memories (Davachi,       the other one (the non-preferred ‘‘NP’’ stimulus). For each pair,
2006; Eichenbaum, 2004; Eichenbaum et al., 2007; Moscovitch,         we created contextual ‘‘composite’’ images, in which each indi-
1994; Squire et al., 2004; Tulving, 2002). Furthermore, neuro-       vidual was digitally extracted from the original picture and placed
physiological and lesion studies in animals have shown that          in front of the landmark, mimicking a real photo of seeing the in-
the MTL is involved in the encoding of associations (Bunsey          dividual at that landmark (Figure 1). Using presentations of the
and Eichenbaum, 1996; Day et al., 2003; Kahana et al., 2008; Sa-     single and composite images of each pair, we evaluated changes
kai and Miyashita, 1991; Wirth et al., 2003), which is a key mech-   in neural activity while subjects performed five consecutive tasks
anism for episodic memory formation. In spite of the major signif-   (Figure 1). First, to get an estimation of the pre-learning firing to
icance of these works in advancing our understanding of              each picture, in Task 1, the screening was repeated showing
episodic memory, their contribution has been limited. On the         each of the single pictures for 1 s 6 times in pseudorandom order,
one hand, human studies have not addressed episodic memory           and patients were asked to indicate whether the picture con-
formation at the single neuron level. Animal studies, on the other   tained a human face or not. Then, a block of ‘‘learning and evalu-
hand, have relied on extensive reward-driven training with           ation trials’’ (median of 15 trials) comprising interleaved tasks 2
numerous repetitions of non-natural stimuli, thus offering a         and 3 were shown. In Task 2, the composite images (each of

220 Neuron 87, 220–230, July 1, 2015 ª2015 The Authors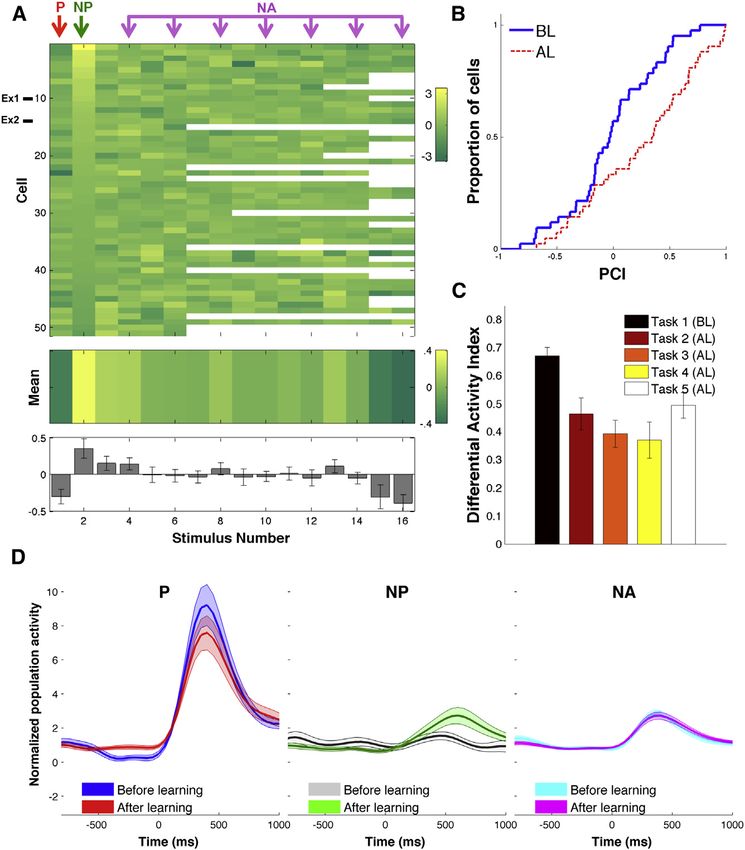
Figure 1. Experimental Design and Behav-
                                                                                               ioral Results
                                                                                               (A) Structure of the association task. P, preferred
                                                                                               stimulus; NP, non-preferred stimulus; C, com-
                                                                                               posite stimulus; L, landmarks.
                                                                                               (B) Selection of stimuli. In this example, in a pre-
                                                                                               vious recording session (performed prior to the
                                                                                               tasks in A to determine pictures eliciting re-
                                                                                               sponses in the neurons), we identified one single
                                                                                               unit that responded to a picture of the American
                                                                                               actor Clint Eastwood (P) and did not change its
                                                                                               firing rate in response to the picture of the Holly-
                                                                                               wood sign (NP). The preferred (P) and non-
                                                                                               preferred (NP) stimuli for each neuron were used to
                                                                                               create contextual pictures as the one shown
                                                                                               (median 7 pairs, 3–8 pairs per session).
                                                                                               (C) Grand average learning curve (mean ± SD) for
                                                                                               all pairs in 25 sessions performed by 14 patients.
                                                                                               Trial number refers to trials during Task 3, where
                                                                                               learning was assessed. Note the high variability
                                                                                               across sessions.

                                                                                                rons using electrodes implanted in the
                                                                                                MTL for clinical reasons. Figure 2 shows
                                                                                                a neuron in the hippocampus that re-
                                                                                                sponded strongly to the picture of a mem-
                                                                                                ber of the patient’s family (with a mean
                                                                                                firing rate of 13.1 spikes/s, SD = 3.9, me-
                                                                                                dian = 12.5) but not to the Eiffel tower
                                                                                                (3.6 spikes/s on average, SD = 3.4, me-
                                                                                                dian = 3.3. The firing to the Eiffel tower
                                                                                                during the response period did not differ
                                                                                                significantly from the one during baseline
                                                                                                (3.9 spikes/s on average, SD = 2.0, me-
                                                                                                dian = 4.2), according to a Wilcoxon
                                                                                                rank-sum test (p = 0.84, W = 40.5, n1 =
                                                                                                n2 = 6). With our experimental design,
                                                                                                we aimed to establish whether MTL neu-
                                                                                                rons will widen their tuning to encode the
them being a specific person in a specific place) were presented        formed association by selectively increasing their firing to the
in pseudorandom order, which were then followed by the presen-          associated stimulus. After a single exposure of the composite
tation of the single pictures, also in pseudorandom order. The in-      picture, the subject learned the association (i.e., family member
structions were the same as in Task 1 (i.e., indicate presence of a     at the Eiffel tower) and the firing rate in response to the Eiffel
human face). After each run of Task 2, the learning of associations     tower increased to 7.6 spikes/s on average (SD = 5.1, median =
was tested in Task 3 (the patient was presented each face at a          8.3), a 230% increase compared to the presentations of the Eif-
time and had to select the landmark corresponding to it). After         fel Tower before learning took place (Task 1). This difference
Task 2 and Task 3, in Task 4 the patient was presented 6 times          was significant (p = 0.002, W = 563, n1 = n2 = 27, Wilcoxon
each landmark in pseudorandom order and had to name the per-            rank-sum test between baseline and response periods, see
son that was there. Finally, in Task 5 (‘‘re-screening’’) all single    Experimental Procedures). In contrast, the response to the
pictures were presented again in pseudorandom order, to                 preferred stimulus (family member) did not change significantly
compare with Task 1 (before learning). Typically, the entire exper-     after learning the association (9.4 spikes/s, SD = 4.5, median =
iment lasted between 25 to 30 min.                                      10.8) and it was similar to the response to the composite image
                                                                        of ‘‘family member at the Eiffel tower’’ (7.8 spikes/s, median =
RESULTS                                                                 8.3; p = 0.96, W = 325, n1 = 27, n2 = 15, Wilcoxon rank-sum be-
                                                                        tween the response to the Eiffel tower and the composite im-
Firing Patterns of Single Cells during Learning                         age). In order to verify that the increase in firing after learning
In 14 patients, who participated in 25 experimental sessions (and       was specific to the associated stimulus pair (NP) and not com-
only 22 for Task 5), we recorded the activity of multiple single neu-   mon to other stimuli used in the experiment, for example, due

                                                                               Neuron 87, 220–230, July 1, 2015 ª2015 The Authors 221
Figure 2. Exemplary Response in the Hip-
P NP C pocampus
A unit in the left hippocampus of participant 14 was
activated with a response of 13.1 spikes/s when
the image of the patient’s family was presented
(preferred stimulus, black squares have been
added for privacy reasons). The same cell was not
responsive (response: 3.3 spikes/s) to the image of
the Eiffel tower before learning (Task 1). For each
Task 1 task the corresponding raster plots (ordered from
top to bottom) of each picture are given. Blue
rasters represent pre-learning (Task 1) or incorrect
trials. Red rasters represent correct or post-
learning (Task 5) trials. The spike density function
Task 2 for trials before (BL) and after (AL) learning in
response to the non-preferred (left), preferred
(middle), and to the mean of the non-associated
stimuli (average over 7 pictures) are shown at the
bottom panels. Crosses indicate that the stimulus
Task 3 was not shown during a given task. After single-
trial learning (Tasks 2, 3, and 4), the unit fired
strongly to the picture of the patient’s family
(mean: 10.8 spikes/s, left), to the composite pic-
ture (7.8 spikes/s, right) and to the picture of the
Task 4 Eiffel tower (7.6 spikes/s). There was a 230% in-
crease in firing to the non-preferred stimulus. The
response to the non-associated stimuli slightly
decreased from 5.3 spikes/s before learning to 3.6
spikes/s after learning.
Task 5
Non−associated stimuli
Firing rate (Hz)
15 BL 15 BL 15 BL
AL AL AL stimulus) after learning was observed in all
10 10 10
tasks: a mean of 12.9 spikes/s in Task 2
5 5 5
(post-learning trials only), 16.7 spikes/s in
0 0 0
−1000 0 1000 −1000 0 1000 −1000 0 1000 Task 3, and 9.4 spikes/s in Task 5. The
Time (ms) Time (ms) Time (ms) response to the preferred stimulus (the
White House) increased slightly after
learning to 25.6 spikes/s (SD = 8.9),
to an increase in familiarity, we also examined the response to but this difference was not significant (Wilcoxon rank-sum test).
the other stimuli. For each neuron X with a preferred stimulus Additional examples are shown in Figure S1 and Movie S1.
Px and a non-preferred stimulus NPx, we defined the non-asso-
ciated (NA) stimuli for neuron X to be all the other pictures used Population Responses
in the association experiment corresponding to the same cate- We recorded from a total of 613 units (438 multi-units and 175
gory of the NPx stimulus (person or landmark). The bottom-right single units) from the hippocampus (138 units), entorhinal cortex
plot of Figure 2 shows the average response to all the NA stimuli, (117 units), amygdala (194 units), and parahippocampal cortex
which decreased from a mean of 5.3 spikes/s (SD = 5.6) to (164 units). We first identified visually responsive units, defined
3.8 spikes/s (SD = 4.9) after learning. as those that, before learning, showed a significant difference in
For some other units, the association was established the other the response to at least one stimulus using a Wilcoxon rank-
way around, i.e., a neuron initially responding to a landmark sum test between baseline and response (see Experimental
changed its firing to the associated person after learning. Figure 3 Procedures). Altogether, we found 51 visually responsive units
shows a multi-unit in the parahippocampal cortex that, in Task 1 (31 single units and 20 multi-units) that significantly increased
(before learning), originally fired to an image of the White House their firing rate in response to the preferred stimulus (P), with
(mean = 17.8 spikes/s, SD = 7.2, median = 15) and not to American P being one individual (27 units) or landmark (24 units). Figure 4
beach volleyball player Kerri Walsh (mean = 5.0 spikes/s, SD = shows the population results for all visually responsive units.
3.6, median = 3.3). After the patient learned the association be- Figure 4A shows the increase in response strength (comparing
tween these two concepts (trial 1 in Task 2, see Experimental Pro- before and after learning) for each of the 51 visually responsive
cedures for learning criterion), there was an increase in the firing of units and for all stimuli. The population averages are shown at
the neuron to the picture of Kerri Walsh (mean = 13.8 spikes/s, the bottom of Figure 4A for all types of stimuli, where we
SD = 9.2, median = 14.2), which was statistically significant (p < observe a larger increase in firing after learning for the NP
0.05, Wilcoxon rank-sum test between baseline and response pe- compared to the other stimuli. The change in firing rate after
riods). This increase in the neuron’s response to Kerry Walsh (NP learning (see ‘‘Visually Responsive Units’’ in Experimental
222 Neuron 87, 220–230, July 1, 2015 ª2015 The AuthorsFigure 3. Exemplary Response in the Para-
NP P C hippocampal Cortex
Conventions are the same as in Figure 2. A multi-
unit in the parahippocampal cortex of participant 3
fired at a rate of 17.8 spikes/s (SD = 7.2) to the
picture of the White House (preferred stimulus)
from a baseline of 4.4 spikes/s (SD = 4.0). This cell
only fired at a rate of 5.0 spikes/s (SD = 3.6) to the
picture of the American volleyball player Kerri
Task 1 Walsh before learning (Task 1). After learning (trial 1
in Task 2), the cell selectively increased (by 246%)
its response to the pair associate (mean response:
13.8 spikes/s, SD = 9.1, p < 0.05).
Task 2
for details). Of all the 613 units that we re-
Task 3 corded from, 51 were visually responsive
and 562 were non-responsive (i.e., did
not have a significant response
compared to baseline before learning).
Task 4 Of the 562 non-responsive units, 12
(2.1%) exhibited a significant increase
to at least one image (mean = 4.1 images,
SD = 1.5) after learning took place, ac-
cording to a Wilcoxon rank-sum test
Task 5 between the baseline and response pe-
Non−associated stimuli riods. This number is within what could
Firing rate (Hz)
30 BL 30 BL 30 BL be expected by chance (n = 28) with a
20 AL 20 AL 20 AL false positive rate of 0.05. Only three of
10 10 10
the non-responsive units had a change
in response to an association pair
0 0 0
−1000 0 1000 −1000 0 1000 −1000 0 1000 (P and NP) that was larger than the one
Time (ms) Time (ms) Time (ms) to the other pictures (Wilcoxon rank-
sum test, p < 0.05). To further quantify
the responses of all visually responsive
Procedures) was significantly different for the different stimuli neurons (to all of the presented stimuli), we calculated a pair-
according to a one-way ANOVA F(11,492) = 3.15, MSE = coding index (PCI), a correlation coefficient for each neuron be-
0.46, p = 0.0001 (n = 42 cells with at least 12 stimuli—9 units tween the mean response to each stimulus and its paired asso-
that corresponded to sessions where less than 12 stimuli ciate (as defined in Higuchi and Miyashita, 1996). This statistic
were presented were excluded from this analysis to avoid un- has been used to assess how neurons acquire stimulus selec-
balanced data). This significant difference was largely due to tivity through associative learning and is expected to approach
the change in the NP stimuli and not any other non-associated zero for a large number of neurons firing with a pattern indepen-
stimulus. In fact, the difference was still significant when dent of the stimulus pairs (Naya et al., 2003). Across the popu-
excluding the P stimuli (p = 0.01) but not when also excluding lation of visually responsive units, we found that the pair-coding
the NP stimuli (p = 0.76). Moreover, the only two stimuli that indices after learning (median = 0.35) were significantly higher
showed a median significantly different from zero were the (median = 0.03, D = 0.36, n1 = n2 = 42, p = 0.007, Kolmo-
preferred stimulus (decrease, p = 0.001; see below for interpre- gorov-Smirnov test, see Figure 4B), thus showing the formation
tation in terms of repetition suppression) and the NP stimulus of an association between the P and NP stimulus pairs.
(increase, p = 0.005). Furthermore, paired t tests showed that To assess the changes that occurred in different tasks, we
the increases in the NP responses were significantly larger calculated, for the whole population of visually responsive units,
than the ones to any other stimulus (all p values between an average differential activity index DAI = (Pr NPr / Pr + NPr),
0.0008 and 0.03). To further validate these results, we per- where Pr, NPr denote the mean activity in the response interval
formed a permutation test, adjusted for multiple comparisons, (see Experimental Procedures). The DAI is expected to be posi-
by shuffling the labels of the stimuli and taking as test statistic tive, since Pr > NPr, and it quantifies the difference in the
the smallest difference between the activity to the NP stimulus response to the preferred and non-preferred stimuli. As ex-
and the one to any other stimuli. We ran 5,000 permutations pected, the largest DAI values were obtained for Task 1 (Fig-
and found the p value of the NP stimulus to be statistically sig- ure 4C) before learning took place, indicating a large difference
nificant (p = 0.012, see Supplemental Experimental Procedures in the response to the P and the NP stimuli. For the following
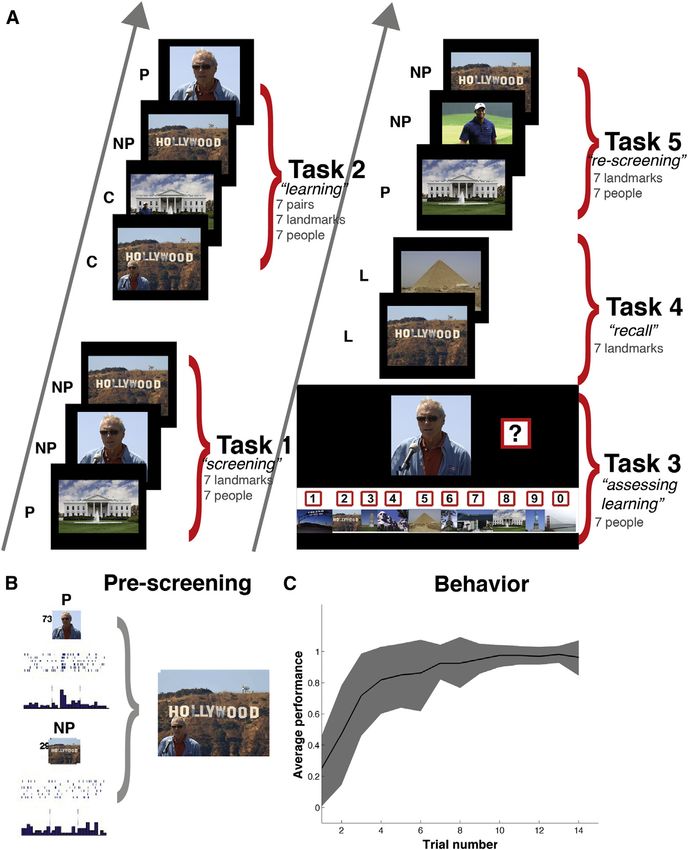
Neuron 87, 220–230, July 1, 2015 ª2015 The Authors 223Figure 4. Population: Visually Responsive
Units
(A) Response changes for all visually responsive
units. Each row represents one cell and each col-
umn represents one stimulus. The rows were sor-
ted by the strength of the change in the NP stimulus
and the columns were unsorted. Blank squares
represent stimuli that were not shown during the
corresponding session. The mean values across all
cells are shown in the middle panel (in colors) and
in the bottom panel including SEMs. Ex1, Ex2
correspond to the exemplary units shown in Fig-
ures 2 and 3.
(B) Cumulative frequency histograms of the corre-
lation coefficient (defined as in Higuchi and Miya-
shita, 1996) for units before learning (BL) and after
learning (AL). Correlation coefficients were signifi-
cantly higher after learning than before learning (p =
0.007, Kolmogorov-Smirnov test).
(C) Average differential activity index DAI = (Pr
NPr / Pr + NPr) for all tasks. Lower values of DAI
denote more similar responses. Responses to the
preferred and non-preferred stimuli become more
similar after learning for all tasks (p < 0.001,
average decrease by a factor of 1.6, range:
1.4–1.8).
(D) Average normalized spike density function
(SDF) for 51 visually responsive units to the P, NP,
and NA before and after learning. There was a
significant increase in the response strength to the
NP stimuli after learning (p < 0.05, Wilcoxon rank-
sum test).
trial responses to all the other pictures
(excluding P) after learning (see ‘‘Pair-
Coding Units’’ under Experimental Proce-
dures). Of the 51 visually responsive units,
tasks, DAI values were significantly smaller (p < 0.001, see 21 (41%) were ‘‘pair-coding neurons’’ and selectively increased
Experimental Procedures). their response to the NP stimuli after learning. As expected by
To study the time course of the responses, we separated the construction—since based on the screening sessions we chose
normalized population response for all visually responsive neu- the NP stimuli to be one that the neuron originally did not fire to—
rons according to the type of stimuli (P, NP, and NA) and condi- these units showed no significant response to the NP stimuli
tion (before and after learning). After learning (Figure 4D), we before learning took place (Wilcoxon rank-sum test). The number
found a 172% increase in the response strength to the NP stimuli of neurons encoding the association (pair-coding neurons, n =
compared to the pre-learning value. This increase was statisti- 21/51) far exceeded the number expected by chance (p <
cally significant (p = 0.05, n = 51, Wilcoxon rank-sum test be- 1013), according to a binomial test with a chance level of 0.05
tween the mean response before versus after learning). In (see Supplemental Experimental Procedures). We also verified
contrast, the mean response to the preferred stimuli decreased that the observed distribution of p values was significantly lower
to 87% of its pre-learning value (p = 0.3, n = 51, Wilcoxon than the one generated by neurons with a Poisson firing proba-
rank-sum test), while the mean response to the non-associated bility and the same mean firing rates as the responsive units
stimuli did almost not change (101% of the pre-learning value, (p < 0.004; see ‘‘Proportion of Pair-Coding Units’’ under Supple-
p = 0.9, n = 51, Wilcoxon rank-sum test). mental Experimental Procedures).
Given these population results, we next evaluated how many In what follows, we concentrate on the 21 neurons that en-
of the visually responsive neurons encoded the enforced associ- coded the associations. Among the 21 pair-coding units, 14
ations. For this, we defined ‘‘pair-coding neurons’’ as the ones (67%) originally fired to a person and started firing to the associ-
that: (1) showed a significant response to the NP stimulus after ated landmark after learning (like the one shown in Figure 2). In
learning, using a Wilcoxon rank-sum test comparing baseline the remaining 7/21 cases, the association was established the
and response periods (with p < 0.05), and (2) the distribution of other way around, i.e., the neuron originally responding to a
increases of single-trial responses to the NP stimulus after landmark, changed its firing to the associated individual after
learning was larger than the distribution of increases of single- learning (like the one shown in Figure 3). Across the population
224 Neuron 87, 220–230, July 1, 2015 ª2015 The AuthorsFigure 5. Population: Pair-Coding Units
Average normalized spike density function (SDF)
for 21 units that selectively changed their response
after learning. The shaded areas represent SEM.
(A) Normalized SDF to the preferred stimulus for
before learning (BL) and after learning (AL). There
was no significant difference between conditions in
the response period.
(B) Normalized SDF to the non-preferred stimulus
for BL and AL. After learning, units responded
significantly more strongly to the non-preferred
stimulus (p < 0.01).
(C) Normalized SDF to the non-associated stimuli.
(D) Average normalized neural activity (black
squares) and behavioral responses (green circles)
to the non-preferred stimulus as a function of trial
number. In the top panel, data were aligned to the
learning time (relative trial number 0). In the bottom
panel, trials were sorted according to their pre-
sentation order, with the first 6 trials always de-
noting trial 1 and trial 7 corresponding to the start
of Task 2. Continuous lines correspond to psy-
chometric fits using a binomial function. Note that
the neural activity follows the sudden increase in
behavioral learning when data are aligned relative
to learning time.
(E) Normalized SDF to the non-preferred stimulus
for Task 1 and Task 5. Responses during Task 5
were significantly higher than during Task 1 (p =
0.001, Wilcoxon rank-sum test).
(F) Average differential activity index DAI for all
tasks. Responses to the preferred and non-
preferred stimuli become more similar after
learning for all tasks (p < 106, average decrease
by a factor of 5.5, range: 4.2–6.7).
scaling the activity across the population
of neurons encoding the association for
all trials in all tasks to the range 0–1 (see
Experimental Procedures). A direct com-
parison between the behavioral and neu-
ral learning curves exhibited a significant
of pair-coding neurons, the responses to the non-preferred stim- positive correlation for the non-preferred stimulus (r = 0.25, p <
uli showed an average increase of 281% (from 1.44 ± 0.22 to 1011, Pearson’s correlation coefficient r), due to the increase
4.06 ± 0 0.38, mean ± SEM) after learning, which was statisti- in firing after learning the associations. There was a non-signifi-
cally significant (p < 105; Wilcoxon rank-sum test between cant correlation for the non-associated stimuli (r = 0.05, p =
the mean response before versus after learning) (Figure 5B). 0.2) and also a negative correlation for the preferred stimulus
Similar results were obtained when considering only single units (r = 0.08, p = 0.03), consistent with the decrease in firing to
(n = 11). In this case, there was a significant increase of 412% in the preferred stimulus reported in Figure 4A, which is likely due
the response to the NP stimuli after learning (p = 0.0001, Wil- to repetition suppression in line to a previous work without an
coxon rank-sum test). In line with the results for all visually association paradigm (Pedreira et al., 2010). To further investi-
responsive units (Figure 4C), the responses to the P (Figure 5A) gate whether this behavior is due to repetition suppression, or
and NA (Figure 5C) stimuli did not change significantly after whether it also reflects the formation of associations, we
learning (88% of the pre-learning value, p = 0.65 for the P stim- compared the decreases found in pair-coding units with the
ulus and 134% of the pre-learning value, p = 0.27 for the NA ones found in the other visually responsive units. For this, for
stimuli). each visually responsive unit, we calculated the percentage
change as 100*(Ppost Ppre)/Ppre, where Ppost and Ppre indicate
Neuronal and Behavioral Learning Curves the mean activity in the response window. Both populations
In order to compare on a trial-by-trial basis the neural and behav- of pair-coding and non-pair-coding units exhibited similar
ioral changes, we calculated the neuronal learning curves by re- trends, with a mean percentage decrease of 7% (SD = 40,
Neuron 87, 220–230, July 1, 2015 ª2015 The Authors 225median = 15%) for the pair-coding units and 11% (SD = 33, ferences (p = 0.001, Figure 5E), which can be attributed to the
median = 20%) for the non-pair-coding units. The median of learning of the particular association. There was also an increase
both populations did not differ significantly (p = 0.64, Wilcoxon in the response during Task 5 when considering all visually
rank-sum test) and the median of both populations differed responsive units but in this case the difference was not signifi-
significantly from zero (p = 0.03 and p = 0.02 for pair-coding cant (p = 0.14).
and non-pair-coding, respectively), thus the decreases for the
P stimuli seem to reflect repetition suppression rather than an Decoding Analysis
encoding of the association. From a readout viewpoint, the learning of the associations
Given the variability on the number of trials that subjects should be accompanied by a decrease in the discriminability be-
needed to learn each association pair, to further evaluate how tween the NP and the P stimulus, given that the neuron originally
tightly correlated were the observed firing changes to the actual firing only to the P stimulus starts also firing to the NP after
learning of the associations, we realigned the response of each learning. This selective increase in firing to the NP stimuli should
cell to the learning time and compared these neural responses also lead to more discriminability between the NP and NA stimuli
to the ones obtained as a function of the actual trial number in after learning. This is indeed what we observed using a linear
the experimental session. For this, we fitted logistic functions classifier to decode the identity of the stimuli before and after
to the average behavioral and neural learning curves to the learning (see Supplemental Experimental Procedures). When
non-preferred stimulus for both alignments (absolute trials and considering the whole population of visually responsive units,
relative to learning time; see Experimental Procedures for de- the discrimination between P and NP stimuli went down from a
tails). In Figure 5D, we first observe that aligning to learning 74% average performance before learning to 68% after learning.
time gives a more accurate matching between the behavioral The decrease was significant according to a paired t test, t(100) =
and the neural learning curves. In fact, for data aligned to learning 1.95, p = 0.03. For pair-coding units, the discrimination between
there were no significant differences between behavioral and P and NP stimuli went down from a 72% average performance
scaled neural data (Kolmogorov-Smirnov test, p = 0.59). Addi- before learning to 56% after learning. Altogether, the decoding
tionally, the fits were more accurate for data aligned to learning performance was significantly larger than chance with p < 0.05
time, as quantified by the Akaike Information Criterion (AIC) (see Supplemental Experimental Procedures) for 11 of the 21 re-
(Akaike, 1974)—data relative to learning: AICBeh = 142; AICNeu = sponses (52%) before learning and for 6 of the 21 responses
298; data not aligned: AICBeh = 175; AICNeu = 325, where smaller after learning (38%).
values denote higher accuracy. The same logistic model did not
fit the data for the preferred and non-associated stimuli as accu- Latency Analysis
rately as it did with the non-preferred stimuli (Figure S2). More- Two possible mechanisms can in principle account for the
over, both for the P and NA, Pearson’s correlation coefficient increased response to the NP stimuli after learning. On the one
was larger for the unaligned (R2 = 0.73/0.04 for P/NA stimuli) hand, neurons can rapidly change their tuning and start firing
than for the learning-aligned data (R2 = 0.46/0.03). When the to the NP stimuli directly—that means, a neuron originally encod-
NP data were aligned to learning time, there was a large increase ing the P stimulus starts encoding the NP stimulus after
in the slope of the behavior curve: bBeh = 4.6 after re-alignment, learning—in which case, the time courses of both P and NP sig-
compared to bBeh = 4.2 for the unaligned data. But the interesting nals are expected to be similar. On the other hand, the NP stimuli
fact was that this change in the behavioral learning curve was can act as a cue to evoke the representation of (and in turn the
accompanied by an abrupt increase in firing to the non-preferred neuron’s firing to) the P stimuli. Following previous works
stimuli, when re-aligning the neural data to the learning time: (Naya et al., 2001, 2003), we distinguished between these two
bNeu = 3.1 aligned to learning, compared to bNeu = 1.6 without putative mechanisms—namely between Type 1 and Type 2 neu-
alignment. The slope difference (with and without alignment to rons—by analyzing the differences in the latency response on-
learning) was significant, according to a non-parametric boot- sets between the NP and P stimuli. In the first case (Type 1),
strap test (p < 0.05; see Figure S3 and Experimental Procedures we expect similar latency onsets for the P and NP stimuli,
for details). whereas in the other case (Type 2), we expect a larger latency
onset for the NP stimuli. We used Poisson spike train analysis
Neural Activity during Different Tasks (see Experimental Procedures) to estimate the onset latency
Next, to rule out that changes in neuronal responses were just for all presentations and performed a Wilcoxon rank-sum test
driven by one of the specific tasks we used (as each task varied to compare the latency values for the P and NP stimuli. Of the
in complexity and attentional demand) and not by the formation 21 pair-coding units that selectively increased their firing to the
of new associations, we used the differential activity index DAI NP stimuli after learning, 13 were ‘‘Type 1,’’ as in the example
introduced before for the population of visually responsive units. shown in Figure 2, and the remaining 8 were ‘‘Type 2,’’ as in
Altogether, after learning there was a decrease of DAI values by a the example shown in Figure 3. The scatter plot of the response
factor of 5.5 on average (range: 4.2–6.7). Moreover, differences onset latency values with the classification details is shown in
between the tasks after learning were not significant, thus sug- Figure S4. Interestingly, both Type 1 and Type 2 units exhibited
gesting that these neuronal changes were not task dependent. a significant positive correlation between behavioral perfor-
Supporting this view, a direct comparison of the response to mance and neural activity for the NP stimulus (Pearson’s r =
the non-preferred stimuli in the two identical tasks (Task 1, 0.24, p = 107 and r = 0.28, p = 4*106 for Type 1 and Type 2,
pre-screening and Task 5, re-screening) showed significant dif- respectively).
226 Neuron 87, 220–230, July 1, 2015 ª2015 The AuthorsRegional Analysis specific actions (a saccade toward one of four cardinal loca-
Altogether, we identified 51 visually responsive units across tions). However, in this case the task also involved explicit
different regions within the MTL: 10 in hippocampus, 7 in the en- reward-driven training, and learning occurred in two-thirds of
torhinal cortex, 29 in the parahippocampal cortex, and 5 in the the cases only after 14–17 trials (Wirth et al., 2009). These time-
amygdala. We observed pair-coding units throughout the MTL: scales are longer than the ones concomitant with episodic
(6 out of 10 [60%] visually responsive units in the hippocampus), memory, which is seemingly effortless and often triggered by
4 out of 7 (57%) in the entorhinal cortex, 11 out of 29 (38%) in single presentations.
the parahippocampal cortex, and 1 out of 5 (40%) in the amyg- Besides the need of reward-driven training, a major caveat to
dala. We consistently found both Type 1 and Type 2 neurons in develop animal models of episodic memory is the lack of verbal
these regions: 4 out of 8 pair-coding units in H/EC were of Type or complex feedback to assess conscious recollection. In an
1, where we have grouped responses in hippocampus and en- earlier study, we showed that neurons in the human MTL
torhinal cortex that were previously shown to exhibit similar respond in a reliable and specific manner during viewing of video
properties (Mormann et al., 2008; Quian Quiroga et al., 2009). episodes such as a clip of The Simpsons and also during the free
In PHC, 7 out of 11 pair-coding units were of Type 1. Pair-cod- conscious recall of that same clip (Gelbard-Sagiv et al., 2008).
ing cells in H/EC were more prominently firing to pictures of per- Human MTL neurons have also been reported to act as novelty
sons instead of landmarks (6 out of 8 pair-coding units) and familiarity detectors (Rutishauser et al., 2006). A recent work
compared to cells in PHC (n = 7 out of 11) but the difference (Miller et al., 2013) has studied modulations in the firing of place-
was not significant (c2 = 0.28, p = 0.60). Despite the small sam- responsive neurons in the human MTL while subjects learned
ple size of the recorded neurons, we found that the time courses item-location associations during a virtual navigation task fol-
of the responses in PHC were qualitatively similar to the ones in lowed by free recall. The authors calculated a neural similarity in-
H/EC (Figure S5). As a cautionary note, we wish to point out that dex between the ensemble activity of these place cells during
a larger number of recorded neurons is necessary to address navigation and during item recall and found that such index
the issue of regional differences (and similarities) more was higher for the ensemble of place cells near the location of
conclusively. the item. Considering the previous finding that MTL neurons
show an invariant representation of concepts (Quian Quiroga
DISCUSSION et al., 2005), our results of association formation in these neu-
rons suggest conceptual associations. In particular, we show:
Episodic memory—the ability to consciously recall personal (1) the encoding of associations at the single-cell level, (2) the
experienced events and situations (Moscovitch, 1994; Tulving, learning of the associations on a trial-by-trial basis (showing
2002)—relies on the very rapid and effortless formation of the emergence of robust responses at the exact moment of
new associations (Bunsey and Eichenbaum, 1996; Quian Quir- learning), (3) the precise latency of the responses, distinguishing
oga, 2012; Wirth et al., 2003; Kahana et al., 2008). Animal two type of neurons, (4) the neurons’ responses in different
studies have previously shown that single neurons can change tasks, including free recall, also comparing the exact same
their selectivity after learning in associative tasks (Erickson and task before and after learning (Task 1 versus Task 5), (5) that
Desimone, 1999; Gochin et al., 1994; Messinger et al., 2001; these changes were specific to the associated (compared to
Sakai and Miyashita, 1991; Wirth et al., 2003). In particular, the other non-associated) stimuli, and (6) a decoding approach
Miyashita and colleagues trained macaque monkeys to asso- provided differences in discrimination performance after
ciate pairs of fractal patterns and found picture-selective neu- learning consistent with our other analyses. Overall, by showing
rons in IT cortex (areas TE and perirhinal cortex) that showed that such associations can be created with arbitrary but concep-
significantly correlated responses to the paired associates (Sa- tually coherent concepts (i.e., persons in particular scenes, in
kai and Miyashita, 1991). This coding was later hypothesized to contrast to pair association tasks in which two arbitrary pictures
emerge from separate TE neurons coding perceptual informa- are associated), our results provide strong evidence pointing to-
tion about the individual paired associates that would converge ward a role of the MTL beyond a spatial representation of the
onto the same neurons in the perirhinal cortex (the selective- environment. Moreover, the emergence of associations of con-
convergence model) (Higuchi and Miyashita, 1996; Naya cepts established after single trials linked to rapid neural activity
et al., 2001, 2003). But the learning of paired associates in an- changes is ideal for the creation of new episodic memories
imals is a demanding task that requires extensive reward- (Quian Quiroga, 2012).
driven training, typically taking place before recordings begin How different MTL regions contribute to episodic memory
(Erickson and Desimone, 1999; Higuchi and Miyashita, 1996; formation is still a subject of intense discussion (Diana et al.,
Sakai and Miyashita, 1991). Moreover, these recordings were 2007; Eichenbaum et al., 2007). Neuroimaging works have
performed in extra-hippocampal regions, which show distrib- advocated that episodic encoding is mediated by the hippo-
uted representations and are not thought to support fast campus, which supports the relational binding of the individual
learning according to modeling studies (McClelland et al., elements to the context of an episode (see Davachi, 2006;
1995). One notable exception was reported by Wirth and col- Quamme et al., 2007), and the parahippocampal cortex, which
leagues (Wirth et al., 2003; Yanike et al., 2004), who demon- is involved in item memory (Kirwan and Stark, 2004) and/or in
strated a significant correlation between behavioral perfor- relational memory (Diana et al., 2007). The PHC has been
mance and neuronal hippocampal activity during the shown to be involved in both spatial (Buffalo et al., 2006) and
acquisition of associations between background scenes and nonspatial contextual associations (Aminoff et al., 2007; Law
Neuron 87, 220–230, July 1, 2015 ª2015 The Authors 227et al., 2005). Related lesion studies in animals have suggested EXPERIMENTAL PROCEDURES
that the hippocampus is important for item-item associations,
Subjects
while parahippocampal cortex is critical for recognition memory
14 patients with pharmacologically intractable epilepsy (10 right handed,
for object-place associations (Higuchi and Miyashita, 1996; 6 male, 18 to 53 years old) participated in this study. Patients were implanted
Malkova and Mishkin, 2003). In line with these studies, we with chronic depth electrodes for 7–10 days to determine the seizure focus
found pair-coding units not only in H/EC (8/21) but also in for possible surgical resection. The number and specific sites of electrode im-
PHC (11/21). plantation were determined exclusively on clinical grounds and were verified
A long-lasting debate in the psychology literature (Roediger by MRI or by computer tomography co-registered to preoperative MRI. Pa-
tients volunteered for the study and gave written informed consent. The study
and Arnold, 2012), refers to whether the formation of associa-
conformed to the guidelines of the Medical Institutional Review Board at
tions occurs gradually (Hull, 1943) or all-or-none (Estes et al.,
UCLA.
1960; Rock, 1957). In the first case, the strength of association
between each pair develops gradually until the first item pro- Electrophysiology
duces a recall of the second. This assumes that learning reflects Each electrode contained nine platinum-iridium microwires at their end. Eight
a continuous buildup of the strength of memory traces. Alterna- of the microwires acted as the active recording electrodes and the ninth micro-
tively, association pairs could be learned at once and repeated wire acted as a reference. The differential signal from the microwires was
amplified and filtered between 1 and 9,000 Hz. Data from six patients were re-
trials are just giving several opportunities for the formation of
corded with a 64-channel Neuralynx system with a sampling rate of 28 kHz. In
the association (Estes et al., 1960). In line with the latter view, the remaining eight patients, data were acquired at 30 kHz using a 128-chan-
the formation of associations to NP stimuli changed abruptly, nel acquisition system (Blackrock Microsystems). The extracellular signals
with a large increase in the slope of both the behavioral and neu- were band-pass filtered (300 Hz to 3 kHz) and later analyzed offline. Spikes
ral learning curves, thus supporting all-or-none learning. A ma- were detected and sorted using wave_clus (Quian Quiroga et al., 2004). Single-
jority of neurons that changed their tuning after learning had a and multi-unit activity was classified by one of the authors (M.J.I.) based on
spike shape, variance, and the presence of a refractory period for the single
similar response-onset latency for the P and NP stimuli (Type
units (i.e.,increase in the response to the NP stimulus (the paired associate of the (1 – l). We used a Maximum Likelihood Criterion to estimate the optimal pa-
preferred stimulus) with respect to baseline after learning (Wilcoxon rank- rameters and obtained the learning time from the closest trial following a
sum test), and a non-significant response to NP before learning (Wilcoxon (the threshold f(x = a) = 0.5, for l = g = 0). All subjects learned most pairs
rank-sum test), and (2) the distribution of single trial increases after learning (mean: 98.3%) but the learning time varied across subjects. The learning
(i.e., subtracting the mean number of spikes before learning in the response criterion was reached on average after 2.9 trials (median 2, interquartile
window) for the NP stimulus was significantly larger than the distribution of sin- interval: 2).
gle trial increases after learning for all the other pictures (excluding P) accord- Comparison of Neural and Behavioral Learning Curves
ing to a Wilcoxon rank-sum test across trials. To allow a comparison with the behavioral fits, the neural data were smoothed
Pair-Coding Index and rescaled to a range of 0–1. For this, we rescaled the neural activity (N) to
We also used a pair-coding index defined using a correlation coefficient as the range 0–1 (Nr) using Nr = N minðNÞ=maxðNÞ minðNÞ. We then
P P
in Higuchi and Miyashita (1996): CC = ½ðxi mÞðxi0 m0 Þ= f½ðxi mÞ2 measured the similarity between neural and behavioral learning curves with
½ðxi0 m0 Þ2 g1=2 ði = 1 12Þ, where xi denotes the mean response for the i-th a Pearson’s correlation coefficient. To further quantify whether the changes
stimulus, and the i’-th pictures are the ones belonging to the associated in the neural activity were gradual or sudden, we fitted the neural learning
pair, m and m’ are the averages of xi and xi’. This calculation was done over curves with logistic functions with b as the only free parameter (Equation 1).
n = 42 visually responsive units that correspond to sessions where at least The values of l,g were taken from the pre-learning and post-learning firing
12 stimuli were shown. rates/behavioral performance, where 0/1 corresponds to pre/post-learning,
Comparisons between Conditions respectively. The threshold a, calculated for each individual pair, was kept
In the examples shown in Figures 2 and 3 and Figure S1, we used the raw data constant. For the data aligned to absolute trial number, we considered the first
(number of spikes in the response window) and Wilcoxon rank-sum tests to 14 trials in chronological order (which corresponded to presentations during
compare between different conditions. For comparing the population re- Tasks 1, 2, and 3).
sponses before and after learning, we used normalized data (see ‘‘Time Assessing the Quality of the Fits
Courses of Behavioral and Neural Data’’) and Wilcoxon rank-sum tests be- We evaluated the quality of the fits following an information theoretic approach
tween responses before and after learning. by means of the Akaike Information Criterion (Akaike, 1974). The lower the
Time Courses of Behavioral and Neural Data value of AIC, the more accurate the fit. To test the significance of the difference
To study the time course of the responses, we built the spike density function in the parameters (slope, AIC) for the neural data with different alignments,
by convolving each spike train with a Gaussian kernel (width = 100 ms). For the we performed a non-parametric bootstrap procedure (Kingdom and Prins,
analyses at the population level we normalized the firing rates for each neuron 2010).
by calculating a Z score for each 50 ms width bin: z = FRresponse
FRbaseline =SDbaseline + h, where FRresponse is the smoothed firing rate in the SUPPLEMENTAL INFORMATION
bin, FRbaseline is the mean firing rate during the baseline period, SDbaseline is
the standard deviation of firing rates averaged for all trials, and h = 0.1 is a reg- Supplemental Information includes Supplemental Experimental Procedures,
ularization term. We obtained the normalized population response by aver- five figures, one table, and one movie and can be found with this article online
aging the Z scores of a given neuron in response to a stimulus type (preferred, at http://dx.doi.org/10.1016/j.neuron.2015.06.016.
non-preferred, non-associated) and averaging over all the trials depending on
the analysis (e.g., pre-learning trials, post-learning trials, all trials in a given
AUTHOR CONTRIBUTIONS
task).
Differential Activity Index
M.J.I., R.Q.Q., and I.F. designed the electrophysiology study; I.F. performed
To quantify the difference in firing in the different tasks, we computed a differ-
the surgeries; M.J.I. collected the electrophysiological data; M.J.I. analyzed
ential activity index DAI = (Pr NPr / Pr + NPr), considering the mean activity in
the data; M.J.I., R.Q.Q., and I.F. wrote the paper. R.Q.Q. and I.F. contributed
the response interval of the normalized response (where Pr and NPr are the
equally to the study. All authors discussed the results and implications and
mean normalized responses to the preferred [P] and nonpreferred [NP] stimuli,
commented on the manuscript at all stages.
respectively). We used z tests to assess the significance of the difference in the
DAI across different tasks (Figure 5F).
Latency Estimation ACKNOWLEDGMENTS
Onset latencies for responsive units were determined by Poisson spike train
analysis (Hanes et al., 1995; Mormann et al., 2008). To compare the latency We are grateful to all patients for their participation and Tony Fields, Eric
values for the P and NP stimuli, we estimated the onset latency for all presen- Behnke, Anna Postolova, Vanessa Isiaka, and Deena Pourshaban for technical
tations and then performed a Wilcoxon rank-sum test. This procedure allowed assistance. We thank W. Freiwald, G. Kreiman, R. Malach, M. Moscovitch, U.
us to separate the neurons into Type 1 neurons, which fired to the P and NP Rutishauser, S. Wirth, and three anonymous reviewers for useful comments on
stimuli with a latency that was not significantly different (Wilcoxon rank-sum the manuscript. This research was supported by grants from National Institute
test and interquartile range < 250 ms), and Type 2 neurons, which showed a of Neurological Disorders of the National Institutes of Health under awards
significantly longer latency to the NP compared to the P stimulus. R56NS033221 and R01NS084017, Medical Research Council, the Human
Behavioral Learning Curves Frontiers Science Program, and the Mathers Foundation. The content is solely
We calculated the learning curves for individual picture pairs and subjects. For the responsibility of the authors and does not necessarily represent the official
each paired associate, we annotated whether each response was correct or views of the National Institutes of Health.
incorrect for all the trials of Task 3 (in which subjects had to identify the land-
mark where each person was). Subjects performed a median of 15 trials Received: July 2, 2014
(range: 14–19), where each trial corresponds to a complete cycle through Revised: December 2, 2014
the entire set of stimuli used in the task. We estimated the trial where learning Accepted: June 4, 2015
occurred by fitting the behavioral learning curves with a logistic function: Published: July 1, 2015
1gl
fðxÞ = +g (Equation 1) REFERENCES
1 + expðbðx aÞÞ
where a corresponds to the threshold, b denotes the slope of the logistic func- Akaike, H. (1974). A new look at the statistical model identification. IEEE Trans.
tion (low values of beta correspond to gradual transitions and high values of Auto. Contr. 19, 716–723.
beta correspond to abrupt transitions), and l,g are two parameters related Aminoff, E., Gronau, N., and Bar, M. (2007). The parahippocampal cortex me-
to the pre-learning lower asymptote (g) and post-learning upper asymptote diates spatial and nonspatial associations. Cereb. Cortex 17, 1493–1503.
Neuron 87, 220–230, July 1, 2015 ª2015 The Authors 229Buffalo, E.A., Bellgowan, P.S., and Martin, A. (2006). Distinct roles for medial Miller, J.F., Neufang, M., Solway, A., Brandt, A., Trippel, M., Mader, I., Hefft, S.,
temporal lobe structures in memory for objects and their locations. Learn. Merkow, M., Polyn, S.M., Jacobs, J., et al. (2013). Neural activity in human hip-
Mem. 13, 638–643. pocampal formation reveals the spatial context of retrieved memories.
Bunsey, M., and Eichenbaum, H. (1996). Conservation of hippocampal mem- Science 342, 1111–1114.
ory function in rats and humans. Nature 379, 255–257. Mormann, F., Kornblith, S., Quiroga, R.Q., Kraskov, A., Cerf, M., Fried, I., and
Davachi, L. (2006). Item, context and relational episodic encoding in humans. Koch, C. (2008). Latency and selectivity of single neurons indicate hierarchical
Curr. Opin. Neurobiol. 16, 693–700. processing in the human medial temporal lobe. J. Neurosci. 28, 8865–8872.
Day, M., Langston, R., and Morris, R.G.M. (2003). Glutamate-receptor-medi- Moscovitch, M. (1994). Memory and working with memory: Evaluation of a
ated encoding and retrieval of paired-associate learning. Nature 424, 205–209. component process model and comparisons with other models. In Memory
Diana, R.A., Yonelinas, A.P., and Ranganath, C. (2007). Imaging recollection Systems, D.L. Schacter and E. Tulving, eds. (Cambridge: MIT Press),
and familiarity in the medial temporal lobe: a three-component model. pp. 269–310.
Trends Cogn. Sci. 11, 379–386. Naya, Y., Yoshida, M., and Miyashita, Y. (2001). Backward spreading of mem-
Eichenbaum, H. (2004). Hippocampus: cognitive processes and neural repre- ory-retrieval signal in the primate temporal cortex. Science 291, 661–664.
sentations that underlie declarative memory. Neuron 44, 109–120. Naya, Y., Yoshida, M., and Miyashita, Y. (2003). Forward processing of long-
Eichenbaum, H., Yonelinas, A.P., and Ranganath, C. (2007). The medial tem- term associative memory in monkey inferotemporal cortex. J. Neurosci. 23,
poral lobe and recognition memory. Annu. Rev. Neurosci. 30, 123–152. 2861–2871.
Erickson, C.A., and Desimone, R. (1999). Responses of macaque perirhinal Pedreira, C., Mormann, F., Kraskov, A., Cerf, M., Fried, I., Koch, C., and
neurons during and after visual stimulus association learning. J. Neurosci. Quiroga, R.Q. (2010). Responses of human medial temporal lobe neurons
19, 10404–10416. are modulated by stimulus repetition. J. Neurophysiol. 103, 97–107.
Estes, W.K., Hopkins, B.L., and Crothers, E.J. (1960). All-or-none and conser- Quamme, J.R., Yonelinas, A.P., and Norman, K.A. (2007). Effect of unitization
vation effects in the learning and retention of paired associates. J. Exp. on associative recognition in amnesia. Hippocampus 17, 192–200.
Psychol. 60, 329–339.
Quian Quiroga, R. (2012). Concept cells: the building blocks of declarative
Gelbard-Sagiv, H., Mukamel, R., Harel, M., Malach, R., and Fried, I. (2008). memory functions. Nat. Rev. Neurosci. 13, 587–597.
Internally generated reactivation of single neurons in human hippocampus
Quian Quiroga, R., Nadasdy, Z., and Ben-Shaul, Y. (2004). Unsupervised spike
during free recall. Science 322, 96–101.
detection and sorting with wavelets and superparamagnetic clustering. Neural
Gochin, P.M., Colombo, M., Dorfman, G.A., Gerstein, G.L., and Gross, C.G. Comput. 16, 1661–1687.
(1994). Neural ensemble coding in inferior temporal cortex. J. Neurophysiol.
71, 2325–2337. Quian Quiroga, R., Reddy, L., Kreiman, G., Koch, C., and Fried, I. (2005).
Invariant visual representation by single neurons in the human brain. Nature
Hanes, D.P., Thompson, K.G., and Schall, J.D. (1995). Relationship of presac-
435, 1102–1107.
cadic activity in frontal eye field and supplementary eye field to saccade initi-
ation in macaque: Poisson spike train analysis. Exp. Brain Res. 103, 85–96. Quian Quiroga, R., Kreiman, G., Koch, C., and Fried, I. (2008). Sparse but not
‘grandmother-cell’ coding in the medial temporal lobe. Trends Cogn. Sci. 12,
Higuchi, S., and Miyashita, Y. (1996). Formation of mnemonic neuronal re-
87–91.
sponses to visual paired associates in inferotemporal cortex is impaired by
perirhinal and entorhinal lesions. Proc. Natl. Acad. Sci. USA 93, 739–743. Quian Quiroga, R., Kraskov, A., Koch, C., and Fried, I. (2009). Explicit encoding
of multimodal percepts by single neurons in the human brain. Curr. Biol. 19,
Hull, C.L. (1943). Principles of Behavior: An Introduction to Behavior Theory
1308–1313.
(New York: D. Appleton-Century Company).
Ison, M.J., Mormann, F., Cerf, M., Koch, C., Fried, I., and Quiroga, R.Q. (2011). Rock, I. (1957). The role of repetition in associative learning. Am. J. Psychol.
Selectivity of pyramidal cells and interneurons in the human medial temporal 70, 186–193.
lobe. J. Neurophysiol. 106, 1713–1721. Roediger, H.L., 3rd, and Arnold, K.M. (2012). The one-trial learning controversy
Kahana, M.J., Howard, M.W., and Polyn, S.M. (2008). Associative retrieval and its aftermath: remembering Rock (1957). Am. J. Psychol. 125, 127–143.
processes in episodic memory. In Cognitive Psychology of Memory, H.L. Rutishauser, U., Mamelak, A.N., and Schuman, E.M. (2006). Single-trial
Roediger III, ed. Volume 2 of Learning and Memory: A Comprehensive learning of novel stimuli by individual neurons of the human hippocampus-
Reference, J. Byrne, ed. (Oxford: Elsevier), pp. 1–24. amygdala complex. Neuron 49, 805–813.
Kingdom, F.A.A., and Prins, N. (2010). Psychophysics: A Practical Introduction Sakai, K., and Miyashita, Y. (1991). Neural organization for the long-term mem-
(London: Academic Press, Elsevier). ory of paired associates. Nature 354, 152–155.
Kirwan, C.B., and Stark, C.E. (2004). Medial temporal lobe activation during Squire, L.R., Stark, C.E.L., and Clark, R.E. (2004). The medial temporal lobe.
encoding and retrieval of novel face-name pairs. Hippocampus 14, 919–930. Annu. Rev. Neurosci. 27, 279–306.
Law, J.R., Flanery, M.A., Wirth, S., Yanike, M., Smith, A.C., Frank, L.M., Suzuki,
Tulving, E. (2002). Episodic memory: from mind to brain. Annu. Rev. Psychol.
W.A., Brown, E.N., and Stark, C.E. (2005). Functional magnetic resonance im-
53, 1–25.
aging activity during the gradual acquisition and expression of paired-asso-
ciate memory. J. Neurosci. 25, 5720–5729. Viskontas, I.V., Quiroga, R.Q., and Fried, I. (2009). Human medial temporal
lobe neurons respond preferentially to personally relevant images. Proc.
Malkova, L., and Mishkin, M. (2003). One-trial memory for object-place asso-
Natl. Acad. Sci. USA 106, 21329–21334.
ciations after separate lesions of hippocampus and posterior parahippocam-
pal region in the monkey. J. Neurosci. 23, 1956–1965. Wirth, S., Yanike, M., Frank, L.M., Smith, A.C., Brown, E.N., and Suzuki, W.A.
(2003). Single neurons in the monkey hippocampus and learning of new asso-
McClelland, J.L., McNaughton, B.L., and O’Reilly, R.C. (1995). Why there are
ciations. Science 300, 1578–1581.
complementary learning systems in the hippocampus and neocortex: insights
from the successes and failures of connectionist models of learning and mem- Wirth, S., Avsar, E., Chiu, C.C., Sharma, V., Smith, A.C., Brown, E., and Suzuki,
ory. Psychol. Rev. 102, 419–457. W.A. (2009). Trial outcome and associative learning signals in the monkey hip-
Messinger, A., Squire, L.R., Zola, S.M., and Albright, T.D. (2001). Neuronal rep- pocampus. Neuron 61, 930–940.
resentations of stimulus associations develop in the temporal lobe during Yanike, M., Wirth, S., and Suzuki, W.A. (2004). Representation of well-learned
learning. Proc. Natl. Acad. Sci. USA 98, 12239–12244. information in the monkey hippocampus. Neuron 42, 477–487.
230 Neuron 87, 220–230, July 1, 2015 ª2015 The AuthorsYou can also read