The tourism sector and business tourism activities in Russia 2013
←
→
Page content transcription
If your browser does not render page correctly, please read the page content below
The tourism sector and business tourism activities in Russia

                                        Irina Tarasova
                                        UPCT Trabajo Fin de Máster
                                        Titulación: Máster universitario en Gestión
                                        y Dirección de Empresas e Instituciones
                                        turísticas (GDEIT)
                                        Dirección: María del Mar Vázquez Méndez

                                        2013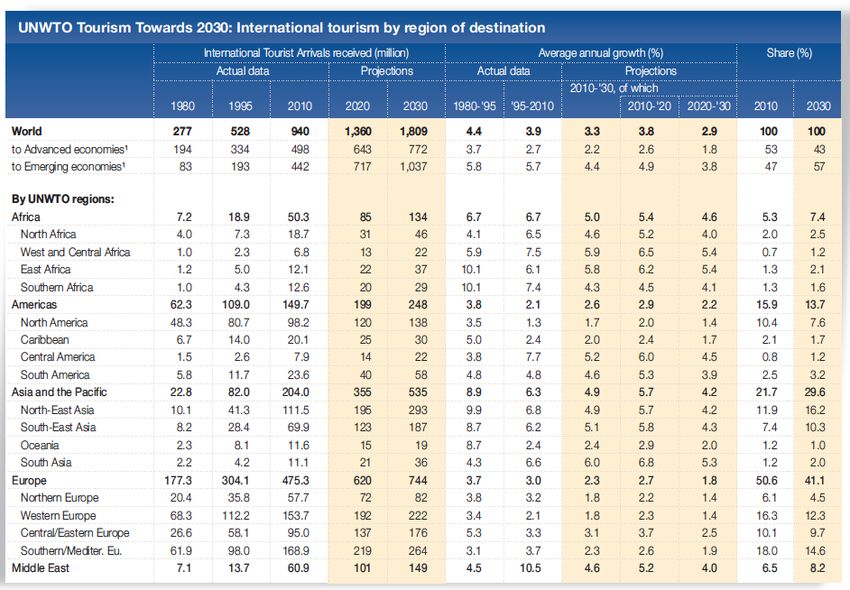
Resume: In this study, we briefly describe the global market of tourism. We will
report the general situation and trends of tourism sector in Russia, and give some
macroeconomics indicators. We will consider and analyze the main indicators of
inbound and outbound tourism in Russia. And namely: the evolution of number of
tourists arriving to Russia; arrivals to Russia by regions; arrivals to Russia by purpose;
and, particularly - by business reason and Leisure&Culture reason. We will try to
explain, why an international tourists utilize so less the air transportation. And we will
compare expenditures between business tourists and leisure travellers. Within above
said we will consider the situation related with inbound tourism in Russia. After that we
will notify what are principal destinations for Russian tourists and pay a special
attention to arrivals of Russian tourists to Spain. Separately, we will describe types of
accommodation in tourist industry of Russia. After all we come to the conclusion.

                                            2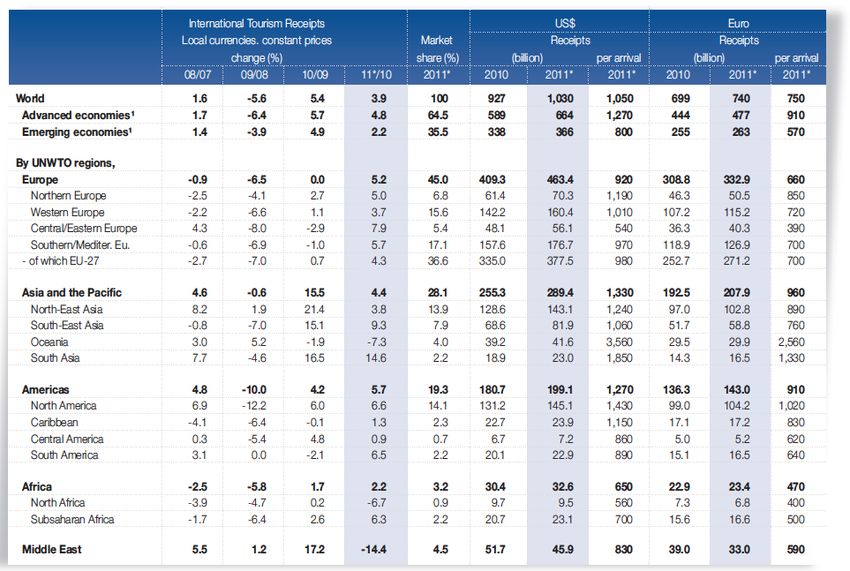
CONTENT

    Introduction…………….........................................................................4

1. The global market of tourism at the beginning of the 21 st century.........5
2. General trends of the tourism sector in Russia.....................................10
    2.1. The tourism situation in Russia nowadays......................................13
    2.2. Macroeconomic indicators..............................................................16
3. Analysis of tourism in Russia.................................................................21
    3.1. Inbound tourism in Russia..............................................................21
        3.1.1. Evolution of number of tourists arriving to Russia.................22
        3.1.2. Arrivals to Russia by regions.................................................24
        3.1.3. Arrivals to Russia by purpose.................................................27
        3.1.4. Arrivals to Russia by air to compare with total arrivals..........29
        3.1.5. Total Expenditure by main purpose of the trip.......................31
        3.1.6. Resident tourism.....................................................................36
        3.1.7. Tourism industry in Russia.....................................................37
        3.1.8. Evolution of number of establishments, with number of room
              and with evolution of available beds.........................................39
    3.2. Outgoing……………......................................................................42
        3.2.1. The 5 principal destinations (countries) for Russian tourist...42
        3.2.2. Arrivals of Russian tourist to Spain........................................44

        Conclusions……………...................................................................46
References……………...............................................................................47

                                                  3
Introduction

       Russia is an old country with long history. Nowadays, the country is embarked
in a process of change from former Soviet Union to a market economy, redefining its
place in the international economy. In this report we analyze the present situation of the
tourism sector in Russia, with a focus on business tourism activities. Tourism has long
tradition in the country for domestic flows, just recently opening its territory to
international tourism. The tourism market shows recently a sustained growth, with main
flows arriving to the most important cities of Moscow and St. Petersburg. In this way
the development of the tourism industry is still incipient, although the country shows
big potential for future development. First, we start by briefly characterizing the state of
world tourism. And we will report the general situation and trends of tourism sector in
Russia. We will consider and analyze the main indicators of inbound and outbound
tourism in Russia. In the last section we conclude.

                                             4
1. The global market of tourism at the beginning of the 21st century

       The tourism sector has been resisting very well the impact of the crisis, suffering
a decline in 2009, but promptly recovering from 2010 onwards (Table 1). At a global
scale, demand for international tourism has grown 4.6% in 2011, with the European
region (North and South) being the fastest growing area, both in rates (+6%, tied with
Asia and the Pacific), and in absolute terms (+29 million of new tourist arrivals).
International receipts, estimated at US$ 1,030 billion in 2011, grew 3.9% that year. UN
World Tourism Organization (UNWTO) expects arrivals to reach 1 billion in 2012 (983
million in 2011) and growth of the market to be at 3-4% globally, despite the crisis.
Table 2 includes the top world tourism destinations, with leadership of France in terms
of arrivals, and the US for receipts. Some European enter this ranking for arrivals
(Spain, Italy, Turkey, the UK, and Germany), and receipts (Spain, France, Italy,
Germany and the UK), what reflects the capacity of attraction of Europe for
international tourism. Indeed, Europe is also the main exporter of tourists (516 million
of outbound flows in 2011), followed by Asia (215 million) and The Americas (162
million). See the following Table 1 on the next page.

                                            5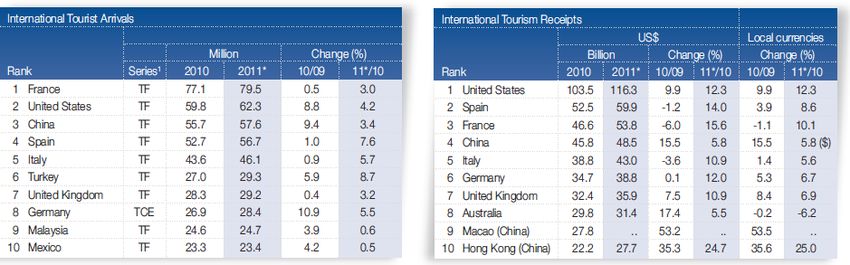
Table 1. International tourism arrivals and receipts by regions

                      Source: UNWTO.

                              6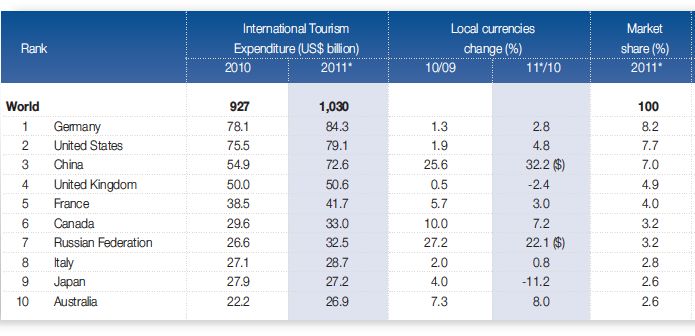
It is important to note that tourism is a continental and proximity issue, where
distance matters, behaving as any other trade exchange (see Balance of Payments
structure). In this way, tourists are travelling inside their continental region of origin in
80% of cases, just pursuing inter-continental flights in the remaining 20% of them
(UNWTO, 2012). Table 2 also includes world top spenders in tourism services.
Germany and the US lead the ranking, but closely followed by China, who has
experienced a remarkable surge of total spending in 2011 compared to previous year
(around 40%). This country also occupies salient positions in the ranking of arrivals and
receipts, scaling in the last years until the third/fourth position. The dynamism of the
Chinese economy is also present in the tourism sector, where the country is becoming a
world leader as an exporter and receiver of tourism flows. The UK, France, Russia, and
Italy are amongst the top ten countries with higher tourist expenditures around the
world. It makes Northern Europe and MED countries the main destination of tourists
arriving from five out of ten of the top spending countries in the world.

            Table 2. World´s top tourism destinations and top spenders in 2011

                                       Source: UNWTO.

See the continue of Table 2 on the next page.

                                                7
Continue: Table 2. World´s top tourism destinations and top spenders in 2011
Source: UNWTO.
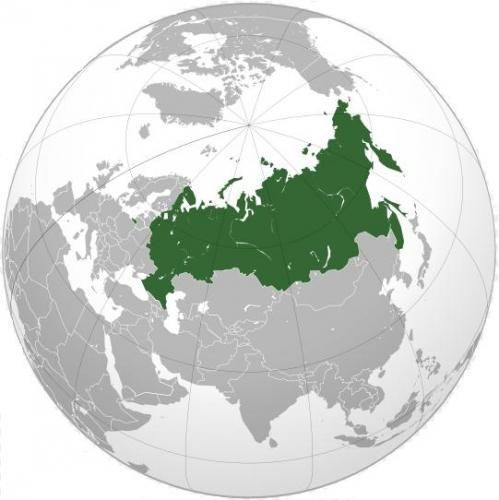
The future prospects for the world tourism market are shown in Table 3. Asia
will become a major actor in the market in the following years, although Europe would
be still leading it. Absolute numbers reflect the potential of this industry in fostering
development of certain regions of the world. Central/Eastern Europe will grow 3.7 in
2010/2020 and 2.5 in 2020/2030, reaching around 180 million visitors in 2030.
In general, three salient facts are depicted in the table: First, number of world
arrivals are expected to double until 1,800 million in 2030; second, emerging economies
are getting the big share in this upward trend, receiving nearly 60% of total arrivals in
2030; and third, annual average growth in 2010-2020 is expected to be 3.8% at a world
scale, and 2.9% for 2020-2030. All these forecasts draw a positive horizon for the
tourism sector in the incoming decades, showing the opportunities opened to developing
countries in the near future.
8Table 3. UNWTO forecasts for the World tourism market 2010-2030
Source: UNWTO
92. General trends of the tourism sector in Russia
The Russian Federation is a country in the North and East of Europe, stretching
from Asia to the Pacific Ocean. It is the largest country in the world and has an area of
17,075,400 km ², 20,017 km of borders and 37,653 kilometers of coastline.
Figure 1. Russia
Source: Wikipedia
The capital of Russia is Moscow, Russian the official language, although locally
they are official thirty different languages, a currency is the ruble, and whole territory of
Russia extends for ten time zones.
Currently Russia is governed by the constitution of 1993, and is defined as a
federation and semi-presidential republic.
10The population in 2011 was about 143 million inhabitants, but constitutes one of
the countries with lower density of population worldwide (8.4 inhab/km2). ¾ of total
population lives in urban centres, with 80% of total population (113 million people)
living in the European part of the country, where two main urban centres are located,
that is, the capital of the country, Moscow (11.5 million inhabitants), and Saint
Petersburg (4.8 millions). There are other 12 cities surpassing one million inhabitants,
and 27 surpassing half million numbers.
Russia has about 140 million people giving an average density of about 8 h/km²;
however most of the country is uninhabited, with average densities less than 2 h/km².
Russia is divided into eight federal districts administered by a governor
appointed by the President of Russia. These districts are divided into a total of 83
federal subjects, which are autonomous entities, but have varying degrees of autonomy.
There are 21 republics, 46 oblasts (provinces), 9 krais (territories peripherals), 1
autonomous oblast, 4 autonomous districts and 2 federal cities.
Figure 2. Federal districts
Area Population Federal Administrative
Name of districts
(km²) (2009) Subject Centre
1. Central 652 800 37 121 812 18 Moscow
2. Southern 418 500 13 714 623 6 Rostov-on-Don
3. Northwestern 1 677 900 13 462 259 11 Saint Petersburg
4. Far Eastern 6 215 900 6 460 094 9 Khabarovsk
5. Siberian 5 114 800 19 545 470 12 Novosibirsk
6. Urals 1 788 900 12 254 976 6 Yekaterinburg
Nizhny
7. Volga 1 038 000 30 157 844 14 Novgorod
8. North Caucasian 170 700 9 186 901 7 Pyatigorsk
11Source: Wikipedia
Analyzing the Figure 3 we see that the distribution (density) of the population in
Russia is very high in central region of Russia, having one of the smallest areas in km2
and at the same time has the highest population density. And the largest in km2, the Far
East region has the lowest population density.
Figure 3. Area and Population in Federal districts
Comparative analysis (2009)
Area (%) Population (%)
36%
30%
26%
21%
14%
10% 10%9% 10%
9%
6% 6%
4% 5%
2% 1%
Source: Authors
12Russia has also the largest coastal line in the World. It extends for more than
32.180 km along from Icy Arctic Ocean as well as Pacific Ocean. This is a country
where we can find a number of different climates from arid desert climate of Southeast
Asia and Siberian polar climate. But, in general, has a very cold climate in winter, with
temperatures usually below zero, and cool and moist summers with an average
temperature of 15-20 degrees.
In the northern regions, especially to the north of Moscow, the skies are
constantly covered frequently, particularly during the winter, a phenomenon that the
Russians have called "pasmurno", roughly translated as 'sad and gray time'. As an
example, of the thirty-one days of December, Moscow maintains an average of twenty-
three days completely covered sky.
To travel to Russia it is mandatory to obtain the visa. There are 4 main types of
visa to travel to Russia: Tourist, Business, Private and Transit. For all types of visa is
essential that you possess a valid passport with at least 6 months validity after the
finalization of the validity of your visa.
Russia is a country of immense beauty, the planet's largest country, the richest in
raw materials, leading exporter of oil and gas and second in nuclear power. Russia is a
country of extremes, but exciting for anyone who has a chance to meet up close. Indeed,
Russia is like one of her symbols, the matryoshka. You should go on discovering her
wrists opening to find another inside. To form a correct and fair view of today's Russia,
we held a general analytical study clearly shows us what actual Russia is.
2.1. The tourism situation in Russia nowadays
Tourist resources of Russia are strong potential for high-grade and high-quality
recreation of citizens, promoting a healthy lifestyle. Tourism is a powerful tool to
overcome the crisis, contributing to enhancing the socio- economic development of
regions.
13The Russian tourist industry has all the necessary resources for the active
development of almost all types of recreation and has a portfolio of over 12 thousand
hotels, 477 historic cities, more than 144 thousand monuments of history and culture,
the Museum 108 and 142 of the National Park. At present, Russia has 101 State Nature
Reserve, 35 national parks and 69 nature reserves of federal significance.
Possessing significant tourist and recreational resources in the Russian Federation, is
insignificant in the global tourism market (about 1% of global tourist traffic), although
its potential to allow (at the appropriate level of development of the tourist industry) to
take up to 40 million foreign tourists per year compared to 7.4 million at present
(according to the World Tourism Organization, Russia may take up to an annual 70
million Russian and foreign tourists).
The tourist activity is under reform and development in Russia nowadays.
Existing tourism resources are not fully utilized, but the dynamics of Russian travel
market shows an upward trend in the number of tourists in general, and foreign - in
particular. Analysis of the current state of tourism in the Russian Federation shows that
in recent years this sector as a whole is developing steadily and rapidly. It is noted the
annual growth domestic tourist traffic. Rapidly growing demand for tourist services in
the country has caused a boom of construction of small hotels, mainly in the resort
areas, as well as an increase in the number of international hotel chains hotels in
Moscow, St. Petersburg and other major cities, the creation of national hotel chains.
There is increased amount of investment proposals for hotel development on the part of
foreign as well as from domestic investors.
By the competitive weakness of the Russian tourism industry can be attributed
to those still lingering and constraining the development of inbound tourism and
domestic factors, such as:
- Underdeveloped tourist infrastructure in most parts of the country, a small
number of hotel accommodation facilities of tourist class c modern comfort;
- The high cost of hotel accommodation, food, transport and other services
offered to tourists, significantly exceeding the European average;
14- Obstacles to attracting investment in tourism infrastructure, consisting in the
absence of readily investment areas, the availability of administrative barriers, and
unfavourable terms of the land lease;
- In general, the continuing shortage of skilled labour, which determines the low
quality of service in all sectors of the tourism industry, despite a slight change for the
better in the last 2-3 years;
- Preservation of the negative stereotypes of perception of the image of Russia
and at the same time the lack of state non-profit advertising tourism potential of the
country as foreign source markets, and within the country, making it difficult to work
on purposely create a positive image of Russia as a country that is conducive to tourism,
which is associated with a limited budget financing;
- Questions remain facilitating the issuance of visas for Russian tourists safe
migration of these foreign countries like Europe, Japan, South Korea, Australia,
Switzerland, Canada and other additional fees are retained for the urgency of the visa,
which is justified resentment and leads to a decrease in inbound tourist traffic;
- Foreign citizens, particularly residents of EU countries, when applying to the
Russian consulate for a tourist visa face unnecessarily complicated procedure of
registration and refuse to travel to our country; Russian visa centres that are opened in
different countries, increase the cost of visas and give tour operators sending tourists to
our country, in a place with private claimants;
Currently, in 2013, the Russian federal television is undergoing another phase of
a multimedia project contest "Russia 10" for the selection of 10 new visual symbols
Russia by public voting. This contest has received wide publicity. Only during one day,
from 29 to 30 of August, the project management has received 50,000,000 votes. The
purpose of the project - maintaining a steady interest in Russia as an object of national
and international tourism, a story about the unique geographic features of Russia. One
of the most important functions of the project is to promote the image of Russia as a
unique country with a rich cultural and natural heritage.
152.2. Macroeconomic indicators
Since the fall of the USSR, Russia has tackled a series of deep structural reforms
leading to increase its level of integration in the world economy. The country suffered
during 2009 the most relevant economic recession since the fall of the Soviet Union,
with GDP falling -7.9%. Nevertheless, the recovery was vigorous in 2010-2011
(+4.3%), stimulated by the rising prices of the oil products and a boost of the domestic
demand (IMF, 2013; ECOSM, 2012).
Macroeconomic situation in the country could be defined as reasonably good:
stable growth, non-budget deficit, and foreign debt of 15% of the GDP. Russia began
the second decade of this century as one of the world countries with the best prospects
for economic growth in the middle-run. World Bank estimates an average growth rate of
6.5% for the period 2010-2020. Such an expected rate of growth would increase the
share of Russia in the world economy from the present 3.2% to 4.3% at the end of this
decade. In this setting, Russia faces huge opportunities for business and businessmen.
Undoubtedly this is one the most promising opportunities opening to the country, the
one related to the development of business tourism through business travels. Tourism is
an increasingly important source of income, although still represents 6% of GDP share
and 5% of national employment (IVEX, 2013). In this section we start by reviewing the
present situation of the tourism industry in Russia and its recent evolution.
GDP of Russia as a macroeconomic indicator shows that since 1993 the Russian
gross domestic product has undergone as growth with the fall (Table 5). During 1993 to
1996, the indicator is shown in negative value. Probably the collapse of the Soviet
Union influenced negatively on economic growth in Russia. A negative index of 1998
clearly shows the relationship with the Russian financial crisis. And furthermore, from
1999 to 2008, we are seeing a steady growth of the economy, as evidenced by the
positive value of the indicator of GDP. In 2009, the negative value of this indicator
demonstrates the close relationship of the Russian economy with the global economy.
16Table 5. Real GDP Growth (%)
Russian Federation
1993 -8,7
1994 -12,6
1995 -4,1
1996 -3,6
1997 1,4
1998 -5,3
1999 6,4
2000 10
2001 5,1
2002 4,7
2003 7,3
2004 7,2
2005 6,4
2006 8,2
2007 8,5
2008 5,2
2009 -7,8
2010 4,3
2011 4,3
Source: World Development Indicators
Figure 4 Russian Federation GDP growth
(annual %)
15
10
5
0
-5
-10
-15
1995
2005
1993
1994
1996
1997
1998
1999
2000
2001
2002
2003
2004
2006
2007
2008
2009
2010
2011
Source: World Development Indicators
17The Table 6 shows us that the Russian Federation over the last 8 years has GDP
with a stable growth as well as Europe. Only in 2009 GDP growth shows negative
values, both in Europe and Russia. And in other years there was a growth. Thus, that
there is a link between Russia's GDP and the growth of business tourism to Russia.
Table 6 Real GDP Growth (%)
Russian Federation EU
2004 7,2 2,5
2005 6,4 2,0
2006 8,2 3,3
2007 8,5 3,2
2008 5,2 0,3
2009 -7,8 -4,4
2010 4,3 2,1
2011 4,3 1,5
Source: Eurostat
After the collapse of the Soviet Union there has been strong, growing
unemployment in the Russian Federation (Figure 4). As we can see from the graph the
level of unemployment grew until 1998, peaking. However, from 1999 to 2008,
unemployment has been gradually decreasing. In 2009, the global crisis has also had its
impact on the growth of unemployment, then, 2010 and 2011 show again increase of
employment.
Figure 4 Russian Federation, unemployment,
total (% of total labor force)
14
12
10
8
6
4
2
0
1993
1994
1995
1996
1997
1998
1999
2000
2001
2002
2003
2004
2005
2006
2007
2008
2009
2010
2011
Source: World Development Indicators
18From Figure 5 we can see that for the entire period under review, the inbound
tourism expenditure indicator over GDP reached its maximum values of 2.5 in 1998.
After that we see a sharp decrease of this indicator in 1999 and 2000. Since 2002 this
indicator is gradually decreasing in importance.
In our opinion, this is due to the fact that investments in the tourism industry are
not sufficient by the federal government. According to the Russian Union of Travel
Industry major problems that impede the further development of tourism are:
the high cost of tours in Russia ;
lack of modern tourist class hotels ;
lack of advertising tourism opportunities Russia abroad;
lack of modern tourist buses, cruise ships and other vehicles ;
the need for registration upon arrival to Russia and the procedure of
tourist visas;
lack of development (in most parts) of the country's transport
infrastructure (poor quality of roads and roadside maintenance level, the
state of the airports, etc.).
Figure 5 Russian Federation. Inbound tourism
expenditure over GDP (%)
3,0
2,5
2,0
1,5
1,0
0,5
0,0
Source: UNWTO Data from 1995-2010
19From Figure 6 we can see that for the entire period under review, the outbound
tourism expenditure indicator over GDP reached its maximum values of 3,7 in 1995 and
3,6 as well as sub maximum in1999. After that we see a sharp decrease of this indicator
in 2001. Since 2002 this indicator is gradually decreasing in importance until 2008 and
after that it slightly grows.
Figure 6 Russian Federation. Outbound tourism
expenditure over GDP (%)
4,0
3,5
3,0
2,5
2,0
1,5
1,0
0,5
0,0
Source: UNWTO Data from 1995-2010
203. Analysis of tourism in Russia
In this chapter we will consider and analyze the main indicators of inbound and
outbound tourism in Russia. And namely: the evolution of number of tourists arriving
to Russia; arrivals to Russia by regions; arrivals to Russia by purpose; and, particularly -
by business reason and Leisure&Culture reason. We will try to explain, why an
international tourists utilize so less the air transportation. And we will compare
expenditures between business tourists and leisure travellers. Within above said we will
consider the situation related with inbound tourism in Russia. After that we will notify
what are principal destinations for Russian tourists and pay a special attention to arrivals
of Russian tourists to Spain. Separately, we will describe types of accommodation in
tourist industry of Russia.
3.1. Inbound tourism in Russia
Slightly more than 25 million of foreign tourists will visit Russia along the year
2013. Although the international tourism in Russia is still starting, the enormous
possibilities which opening Russia as a tourism destination are great, giving the
fabulous amounts of resources it presents (history, nature, architecture, etc.). Despite
our analysis will focus on foreign tourists arriving to Russia, we should mention first
some data available on domestic flows: 31.7 millions of Russians travelled inside
Russia in 2009, with an increase up to 32.5 million of persons in 2010. Those figures
imply that the volume of domestic tourism is in any case greater than these ones of
international flows arriving to the country, as we will see later.
213.1.1. Evolution of number of tourists arriving to Russia
Figure 7 shows the evolution of international tourists arriving to Russia in total.
Analysing the tourism data information from UNWTO, we can observe that the number
of tourists arriving to Russia from 1995 till 2010 is gradually increasing. In the year
2002 it was reached the level of incoming tourists as 23 millions. That means that the
growth since 1995 amounted of almost 10 millions of tourists during 15 years. In
2009, consequently with the international economic crisis and the effects over the
Russian economy we see a relevant decreasing of arrivals related to world financial
crisis. However already in 2010 we note the continued growth of arrivals to Russia
related to the recovery of both the Russian and its neighbours economies.
Figure 7 Evolution of number of tourists arriving to Russia
30.000
25.000
Units ('000)
20.000
15.000
10.000
5.000
1995 1996 1997 1998 1999 2000 2001 2002 2003 2004 2005 2006 2007 2008 2009 2010
Source: UNWTO Data from 1995-2010
Analyzing the state of the market share in Europe and Russia (Table 7), we see
that despite of Europe a trend of increase the number of international tourists: in 1995 –
333 ml tourists and in 2010 – 445 ml arrivals, we obtain that the share of the market for
Europe is gradually decreasing from 63% in 1995 down to 47% 2010. And Russia is
still holding its own market share for 2-3 % of the global market.
22Table 7 International Tourist Arrivals (million)
1995 2000
Europe 333,00 63% Europe 372,00 54%
Russia 10,29 2% Russia 21,17 3%
Others 187,71 35% Others 290,63 43%
World 531,00 100% World 683,80 100%
2005 2010
Europe 408,40 51% Europe 445,40 47%
Russia 22,20 3% Russia 22,28 2%
Others 378,10 47% Others 487,22 51%
World 808,70 100% World 954,90 100%
Source: UNWTO Data from 1995-2010
Considering Table 8, we can see continuous growth in the number of
international tourists both in Russia and in Europe and at a global level, except for some
exceptions. In 2009 the indicator shows negative value for all the three considering
parts of the market. As for Russia, the annual rate of growth amounted to -0.10, for
Europe – 0.05, and for global -0.04.
Table 8 Evolution of number of tourists (Units ('000))
Russia Annual growth Europe Annual growth Global Annual growth
1995 10 290 333 327 531 425
1996 16 208 0,58 276 871 -0,17 561 297 0,06
1997 17 463 0,08 300 458 0,09 588 945 0,05
1998 16 188 -0,07 314 081 0,05 606 712 0,03
1999 18 820 0,16 322 187 0,03 632 029 0,04
2000 21 169 0,12 372 080 0,15 682 843 0,08
2001 21 595 0,02 344 271 -0,07 680 272 0,00
2002 23 309 0,08 354 099 0,03 701 593 0,03
2003 22 521 -0,03 369 269 0,04 692 222 -0,01
2004 22 064 -0,02 378 864 0,03 764 203 0,10
2005 22 201 0,01 408 408 0,08 808 758 0,06
2006 22 486 0,01 429 719 0,05 855 795 0,06
2007 22 909 0,02 454 708 0,06 916 964 0,07
2008 23 676 0,03 456 179 0,00 933 997 0,02
2009 21 339 -0,10 433 281 -0,05 895 162 -0,04
2010 22 281 0,04 445 404 0,03 954 976 0,07
2011 24 932 0,12 469 127 0,05 1 001 235 0,05
Source: UNWTO Data from 1995-2010
23Treating both Table 7 and Table 8, we can summarize that the growing number
of international visits to Russia was a bit higher and more stably. And in confirmation
of this, we have calculated CAGR (Compounded Annual Growth rate) for the years
2011-1995. In Russia this indicator amounted to 0.06, Europe 0.02, for the world as a
whole is 0.04.
3.1.2. Arrivals to Russia by regions
In Figure 8 we analyse the ratio of tourist arrivals from Europe, East Asia and
other regions. We observe that European tourists are in times superior on visits to
Russia, what shows a steady interest to Russia from Europeans countries in all
considered years.
Figure 8 Arrivals to Russia by regions
20.000
Units ('000)
10.000
0
1995
1996
1997
1998
1999
2000
2001
2002
2003
2004
2005
2006
2007
2008
2009
2010
Others East Asia and the Pacific Europe
Source: UNWTO Data from 1995-2010
Table 9 shows the data of the annual growth of the three abovementioned
regions (Europe, Asia and Other). From this table we can see that different regions in
different years show negative indications. Although in 2010, all three dedicated regions
show a positive indicator.
24Table 9 The annual variation rate (Arrivals by region)
Europe East Asia Others Total Arrivals
1995
1996 0,66 -0,11 -0,12 0,58
1997 0,06 0,16 0,87 0,08
1998 -0,11 0,00 0,71 -0,07
1999 0,17 -0,01 0,13 0,16
2000 0,15 0,12 -0,18 0,12
2001 0,02 0,04 -0,04 0,02
2002 0,07 0,32 0,04 0,08
2003 -0,04 -0,04 0,11 -0,03
2004 -0,03 0,19 -0,03 -0,02
2005 0,00 0,00 0,04 0,01
2006 0,01 0,02 0,06 0,01
2007 0,03 0,03 -0,11 0,02
2008 0,04 0,07 -0,11 0,03
2009 -0,11 -0,12 0,24 -0,10
2010 0,04 0,05 0,08 0,04
CARG(2010-1995) 0,05 0,04 0,08 0,05
Source: UNWTO Data from 1995-2010
The following table (Table 10) shows the number of tourists and their respective
share from the total number of visits. From this table, we can clearly see that in spite of
the quantitative growth of the number of tourists from Europe, namely, with 15.000.000
in 1996 to 19.500.000 in 2010, their share in the total number of visits to Russia
gradually decreases, respectively, with 94% to 88%. On the other hand the number of
tourists from Asia shows small but growth in the number of visits, as in other regions.
We can conclude that the "other regions" demonstrated maximum growth, rising in the
share of total visits to Russia, from 2% to 6%, with the overall increase in the number of
Arrivals to Russia for the whole analyzed period between 1996 and 2010.
This fact, mentioned above, implies that the Russian tourism is starting the
correct way of diversifying the regions from where the tourist are coming from at the
same time that we observe that in Russia is increasing the number of tourist coming
from every regions considered. See the Table 10 on a next page.
25Table 10 Arrivals by region. Units (‘000)
1996 2000
Europe 15 197 94% Europe 19 269 91%
East Asia and the Pacific 652 4% Others 1 061 5%
Others 359 2% East Asia and the Pacific 839 4%
Total Arrivals 16 208 100% Total Arrivals 21 169 100%
2005 2010
Europe 19 691 89% Europe 19 569 88%
East Asia and the Pacific 1 315 6% East Asia and the Pacific 1 358 6%
Others 1 194 5% Others 1 354 6%
Total Arrivals 22 200 100% Total Arrivals 22 281 100%
263.1.3. Arrivals to Russia by purpose
As we see in Figure 9 the main purpose of visits to Russia has been always that
of personal motives, including holidays and leisure, or other personal motives, mainly
visiting friends and relatives- VFR). For instance, in the year 2010 the number of
business travellers was 4.4 million, while the number of personal (holidays and VFR
purpose tourists) was approaching 17.8 million. All data shows us a constantly
maintained high interest in Russian culture and VFR travels through the whole
investigating period 1995-2010. This is one of the most appealing findings of the report,
that is, the relevance of VFR travels to Russia, that accounts for more than 70% in 2010,
with nearly 15.7 million visits per year. It would be explained by the 25 million
Russians living overseas in neighbouring countries of former Soviet States (Ukraine,
Kazakhstan, etc.), and in Eastern and Northern EU countries (Poland, Finland, Czech
Rep., Slovaquia, etc.). It would also match previous role of some of these origin
countries in inbound international tourism coming to Russia, as well as role of these
countries as destination of Russians travelling abroad.
Figure 9 Arrivals to Russia by purpose
20.000
Units ('000)
10.000
0
1995
1996
1997
1998
1999
2000
2001
2002
2003
2004
2005
2006
2007
2008
2009
2010
Business reason Leisure & Culture
Source: UNWTO Data from 1995-2010
When we split number of travels for personal motives between the two aspects
that this concept includes, holydays and leisure in one side, and visit to friends and
relatives (VFR) in the other side, we can clearly see the large relevance of the later over
27the former motive. Data collected by UNWTO from 2006 to 2010 also shows that
business tourism reaches 20% of the total arrivals. VFR then accumulates main number
of tourist’s arrivals, as shown in Table 11 below.
Table 11. Arrivals by main purpose (000 units)
1996 2000
Holidays and leisure 1.837 18% Holidays and leisure 2.598 11%
VFR 5.554 54% VFR 15.353 73%
Business 2.889 28% Business 3.218 16%
Total 10.290 100% Total 21.169 100%
2005 2010
Holidays and leisure 2.385 11% Holidays and leisure 2.134 10%
VFR 16.590 74% VFR 15.715 70%
Business 3.226 15% Business 4.432 20%
Total 22.201 100% Total 22.281 100%
Source: UNWTO database.
Table 12 shows the variation in the two big groups of purpose provided by
UNWTO, and how personal motives have registered a greater increase during the period
of analysis.
Table 12 The annual variation rate (Arrivals by purpose)
Business Leisure & Culture Total Arrivals
1995
1996 0,58 0,66 0,54
1997 0,08 -0,30 0,24
1998 -0,07 -0,11 -0,06
1999 0,16 0,33 0,12
2000 0,12 -0,20 0,21
2001 0,02 -0,06 0,03
2002 0,08 0,00 0,09
2003 -0,03 -0,15 -0,02
2004 -0,02 0,06 -0,03
2005 0,01 0,18 -0,02
2006 0,01 0,00 0,01
2007 0,02 0,01 0,02
2008 0,03 0,26 0,00
2009 -0,10 -0,06 -0,11
2010 0,04 0,14 0,02
CARG 2010-1995 0,03 0,06 0,05
Source: UNWTO database.
28Summing up, we have observed that the business tourism motive is quite
relevant in the total amount of tourists arriving to Russia, with more than 4.4 of millions
of tourists coming by this purpose (19.9% of total visitors), above that of leisure
travellers in 2010 (9.6%). VFR visits, however, dominate present tourism flows in
Russia, where tourism industry is just starting to develop. As shown before, domestic
tourism emerges as the most relevant for the industry, with around 32 million
movements per year. EU countries should be the main focus for Russian-based tour
operators, given that more than 500 million people leave this region for tourism
purposes every year, and Russia territory is no more than 5-hours flight from these
sending countries.
3.1.4. Arrivals to Russia by air to compare with total arrivals
In accordance to the statistic data from UNWTO in Figure 10 we compare
arrival by air and total arrivals. We see that by air to Russia were arrived much less
tourists compared with the rest of the used means of transport. And as a whole from
1995 to 2008, there is gradual increase of use of the aircraft.
Figure 10 Arrivals to Russia by air to compare with total
arrivals
24.000
20.000
16.000
Units ('000)
12.000
8.000
4.000
0
1995 1996 1997 1998 1999 2000 2001 2002 2003 2004 2005 2006 2007 2008
Air Total
Source: UNWTO Data from 1995-2010
Consistently with the main origin of tourists from neighbouring countries, the
plane is not the most elected way of transport to visit Russia, as shown in Table 13.
29Observing the Table 13, we may conclude that the Annual Variation Rate about
Arrivals by Air shows negative value just in 1998 and 1999, and then it was growing,
and even in 2003 and 2004, when total arrivals decreased, the Arrivals by Air continued
to grow.
Table 13 The annual variation rate (Arrivals by purpose)
Air Total Arrivals
1995
1996 0,08 0,58
1997 0,36 0,08
1998 -0,10 -0,09
1999 -0,17 0,17
2000 0,11 0,15
2001 0,01 0,02
2002 0,26 0,08
2003 0,11 -0,03
2004 0,18 -0,02
2005 0,01 0,01
2006 0,07 0,01
2007 0,15 0,02
2008 0,09 0,03
CARG 2008-1995 0,08 0,07
Source: UNWTO database.
Why international tourist use so less the air transportation? We suppose that the
market is highly monopolized by several carriers such as “Aeroflot” and “Transaero
Airlines”. Historically, all arriving flights income for just about only one or two cities in
Russia, even mainly to one city - Moscow, which is certainly not conducive to the
effective use of air transport, especially when tourists travel to another part of Russia,
which has a very long territory. Nowadays, Moscow and St. Petersburg are the main
directions of flights from Europe to Russia. In fact, Moscow (with its three airports)
serving almost all flights from Europe to Russia. Accordingly, the tickets are very
expensive and not so many people as it should be, chooses to follow air transport in
Russia.
Therefore, according to the Table 13, despite the outward comfort, the
percentage of air travel is low because of expensive tickets and relatively small number
30of flights and concentration of flights in just few locations (arriving to Moscow and St.
Petersburg).
If you travel to Russia from Asia, such as China, there is a high percentage of
travelling by rail, due to the large extent of land borders and historically popular rail
lines. And, for example, a high percentage of Ukraine travelling to Russia, too, by rail
and by road, as in the recent past, Ukraine and Russia were part of one country and still
have a well developed common rail network and roads in all directions.
Therefore, among the travelers in Russia can be divided into three main areas:
Europe, Ukraine and China. And, at the same time, China and Ukraine enjoy the rail
and road to travel, and Europe uses mainly air transport. However, with the further
successful development of the market of so-called Low Cost flights in Europe and in
Russia, the percentage of travelers from Europe to Russia will increase.
3.1.5. Total Expenditure by main purpose of the trip
Regarding total expenditure of single tourists, it is interesting to explore how the
purpose of the trip affects the level of expenditure of tourists. With statistical data for
the 10 years from 1999 to 2010, we see in Figure 11 that personal spending on Leisure
& Cultural goals from 1999 to 2006 exceeded business expenditures. But since 2006 the
situation on the charges levelled off and even more spending on business trips
increased. Although in 2009 and 2010, we see a general reduction in costs, as a global
trend of cost savings.
Figure 11 Total Expenditure by main purpose of the trip
6.000
US$ Mn
4.000
2.000
0
1999 2000 2001 2002 2003 2004 2005 2006 2007 2008 2009 2010
Business and professional Leisure & Cultural
Source: UNWTO Database from 1995-2010
31From Figure 12 we conclude that the expenditure for entertainment purposes
have not undergone significant changes. Thus in 1999, the tourist spent on
entertainment goal of $ 150 per day. By 2008 this figure reached $ 247 in the day that is
almost doubled. However, the totally different situation is happening with the business
expenditures. The expenses of business tourists have increased from 369 dollars in 1999
up to $ 1,700 in 2008. We can observe a slight decrease in expenditures in 2009-2010 in
view of the consequences of the international financial crisis.
Figure 12 Total Expenditure by main purpose of the trip
per tourist
1.800
1.650
1.500
1.350
1.200
1.050
US$
900
750
600
450
300
150
0
1999 2000 2001 2002 2003 2004 2005 2006 2007 2008 2009 2010
Business and professional Leisure & Culture
Source: UNWTO Data from 1995-2010
Why is there a huge difference in specificity between tourists spending by
business and leisure travellers on holiday? In Spain, there is no such a difference. In
Russia, this difference consists of a significant increase of costs for business tourist
comings. In other words, a tourist, who arrives to Russia for Leisure&Culture purpose
spends less in times if to compare with the business traveller and a business tourist
spends more representation purposes. The concern is that in modern Russia the so-
called threshold for entry into the business is very high. We observe that business in
Russia is strong enough centralized in large cities. And in some cases, heavily corrupt.
And business travellers, i.e. entrepreneurs who comes to Russia to build a business to
reckon with the need to overcome the very high administrative barriers to entry into the
business, which often include, among other things, corruption component. It should be
32noted that modern Russian entrepreneurs are very sensitive to the luxuries and the
business traveller must live in a very expensive hotel, he must attend the expensive
restaurants where the check amount is much higher than the equivalent amount of the
check in Spain, for example. That is, the so -called presentation costs. For comparison -
the usual tourist in 1990 spent 150 Euros per day, and in 2010 he was about the same.
Business tourist spent 360 Euros per day in 1990, but, in 2010, he has spent 1,070 Euros
a day. This occurred because of the increased costs of services in Russia, such as hotel
accommodation, the meals at the restaurant, the cost of renting a car, the cost of renting
space for exhibitions and business conferences, etc... . As any business in Russia is very
highly profitable, at great expense brings a business at the same time and a great
income, and, in pursuit of higher incomes, the business traveller is willing to go to great
expense to build its business in Russia or enter into it as a partner. Accordingly, 10
years ago, the level of these expenses was lower as the level of income was also lower.
Businessman never goes there where he prospectively cannot make money.
This should be possible to do in a central city, such as Moscow or town with a
population of more than a million inhabitants. But, anyway, the first of all, business
travellers traditionally fly to Moscow - and it is an expensive city, expensive airline
tickets (because of practically monopolized air transportation), the cost of expensive
hotels, but due to that all financial flows are concentrated in biggest and expensive
about the costs cities, the business is orientated to them, and, especially, in the capital of
Russia - Moscow. Today Moscow proposes much higher costs than same Moscow but
10 years ago. If the cultural tourist goes to Moscow in an ordinary restaurant, the
business traveller is forced to settle in a prestigious hotel, in order to strike up the right
contacts. Price per day for a budget hotel is very different from the price of a day in a
business hotel in the centre. Specificity it is also a high percentage of the costs consists
of representational costs and branding expenses.
For example, Katerina City Hotel is a 4-star hotel located only 4km from the
centre of Moscow. Usual visitors are people who came to the city for a business trip. It
has truly created an ideal environment for productive work and recreation. The rooms
are of European level. In the morning a great breakfast is included in the price of
occupied rooms. Business people can use the full range of telecommunications and
various business services, international communication, WI-FI. Prices are differed from
33235 Euros to 391 Euros (Table 13). Business dinner will cost around 150-200 Euros per
person. The car rental costs around 120 Euros a day, however, due to complicated
traffic situation many of business tourist’s still use taxi service, which is rather
expensive.
To compare with some similar hotels in Madrid we may see that, for example, 4
stars Hotel Petit Palace Posada del Peine, located in main square of Madrid, offers their
rooms for the price of 120 Euros per night and the other one in the centre of Madrid -
Axor Feria, offers their rooms for the price of 60 Euros. Very good dinner will cost
between 30 till 60 Euros. And a car rental will cost between 20 or 40 Euros per day
depending on season.
Thus, comparing to the prices in both Capitals – we conclude that the prices in
Moscow are much higher.
Table 13 Prices in Katerina City Hotel (EUR)
Table 14 shows us how exchanged expenditures by main purpose of the trip.
Compounded annual Growth Rate (1999-2010) explains that expenditures of Business
tourists increased more than expenditure by Leisure & Culture tourists at the studied
period. Although annual variation rate for business expenditures in 2009 and 2010 is
shown in negative value.
34Table 14 The annual variation rate
(Expenditure by main purpose of the trip)
Business Leisure & Culture Total Arrivals
1999
2000 -0,05 -0,20 0,21
2001 0,00 -0,06 0,03
2002 0,02 0,00 0,09
2003 0,01 -0,15 -0,02
2004 0,34 0,06 -0,03
2005 0,23 0,18 -0,02
2006 0,60 0,00 0,01
2007 0,29 0,01 0,02
2008 0,42 0,26 0,00
2009 -0,24 -0,06 -0,11
2010 -0,05 0,14 0,02
CARG 2010-1999 0,12 0,05 0,08
Source: UNWTO Data from 1995-2010
Table 15 also shows that the expenditure of business tourists in Russia has
grown faster than total arrivals. The final result is that in 1999 the average expenditure
by tourist was of $201, while in 2010 it increased to $402.
Table 15 The annual variation rate (Expenditure by main
purpose of the trip in total and Arrivals)
Expenditure Arrivals
1999
2000 0,21 0,12
2001 0,03 0,02
2002 0,09 0,08
2003 -0,02 -0,03
2004 -0,03 -0,02
2005 -0,02 0,01
2006 0,01 0,01
2007 0,02 0,02
2008 0,00 0,03
2009 -0,11 -0,10
2010 0,02 0,04
CARG 2010-1999 0,08 0,02
Source: UNWTO Data from 1995-2010
353.1.6. Resident tourism
Having a few data from UNWTO We can state data on domestic tourism:
31.690.000, Russians travelled inside Russia in 2009 and this number increased up to
32.500.000, persons in 2010. These data correspond to the General trend of growth in
the number of arrivals in global.
There is an existing range of problems in the area of domestic tourism. The
demand for tourist trips around the country among Russians increases, but rising prices
for transport and hotels prevent expansion of geography of tourist flows. The
comfortable high-speed train to cross the whole of Germany is cheaper than to drive the
same distance in a reserved seat in Russia. To overnight at a hostel in the high season is
comparable to the price of staying in 4-5 star Turkish hotels, running on the system all
inclusive.
Today, the only following reasons are preserving the situation: first, rising real
incomes and, secondly accelerated in recent years, the growth of travel prices to
overseas resorts associated with fuel surcharges, as well as an improve of facilities of
these resorts. In addition, statistics on domestic tourism flows, not adjusted. If in the
next few years, the situation in the Russian tourist market does not change, an active
redistribution of flows in favour of outbound tourism will continue.
There is an indicative fact that in countries with developed tourism, the main
part of the tour operators engaged in domestic and inbound tourism. In Russia, however,
from about 5 thousand tour operators, who are included in the federal register, only
around 1.5 thousand are registered as resident tourism tour operators. And from the
remaining once, who are international tour operators, less than 10% actually engaged in
inbound tourism.
Thus, the bulk of the Russian tourist industry is occupied in outbound tourism,
since work in this area is easier than in the Russian domestic market, or being involved
in the reception of foreign tourists.
363.1.7. Tourism industry in Russia
Let's consider what the accommodation for visitors in Russia is. Moscow, being
the capital city of Russia, attracts many tourists from all over the world. And, for
example, Moscow offers a broad range of holiday accommodation types, both in terms
of affordability and the quality of services.
According to the different sources, and especially web-resource
moscow.Angloinfo.com, we observe that holiday accommodation in Russia can be
classified into the following groups: Luxury hotels (4-5 stars), Tourist-class hotels (3-4
stars), Small and mini-hotels operated by private companies (3-4 stars), Hostels (1-3
stars), Countryside hotels, Rental apartments, Sanatoriums.
The star system in Russia is similar to the rest of the world. However, the
standards for these stars are not always observed (apart from those managed by western
hospitality companies) and hotels may vary in the level of service provided. Most hotels
accept credit cards.
Luxury Hotels
Luxury hotels typically provide a high level of service and correspond to
international 4 and 5 star rating. 4 and 5 star hotels are usually operated by Western
hospitality companies, such as Hilton, Marriott or Sheraton.
Tourist Hotels
These are mid-sized hotels with a 3 and 4 star rating. Most of them offer
business-class accommodation with all corresponding services. Rooms usually have a
TV, telephone and air-conditioning. Wi-Fi is also often available either in rooms or in
the lobby. The staff usually speak (or at least understand) English. Some 3 and 4 star
hotels are operated by Western hospitality chains, such as Holiday Inn or Best Western.
37Small and Mini-hotels
These hotels are usually privately run and range in size from ten to 50 rooms.
Rooms usually have all the required amenities and can have a 3 or 4 star rating. Some
hotels may offer breakfast only, others provide full board. Staff may or may not speak
English.
Hostels
Hostels are budget class accommodation, and offer a cheaper alternative to
staying in a hotel. They offer dormitory-style rooms (four or more beds in a room) or
private rooms with shared bathroom and toilets.
Country Hotels
These are usually village-style mini-hotels located outside of Moscow. Country
hotels can be either family cottages, single, double or dormitory-type cottages for 10 or
more people with shared bath, toilets and cooking facilities, or luxury cottages. Rooms
usually have all the required amenities, including warm water (through a boiler),
modern toilets, satellite TV, Wi-Fi and telephone. These hotels may also offer a sauna,
Russian steam bath, swimming pool or barbeque.
Rental Apartments
Apartments for rent are also available in all districts in Moscow. It is possible to
rent 1-bedroom, 2-bedroom, 3- or even 4-bedroom apartments. Rental apartments are
usually furnished and include linen and kitchen appliances and utensils. They also
typically have a telephone, TV and Internet connection. A cleaning service may also be
provided.
Sanatorium
Sanatorium (from Lat. Sano) - health care setting in which the treatment and
prevention of diseases used mainly by natural factors (climate, mineral water, mud, sea
bathing, etc.) in combination with physical therapy, physical therapy and balanced diet,
subject to certain mode of treatment and rest.
38Sanatoriums are organized as in resorts and outside, in areas to the favourable
climate, landscape and hygienic conditions (local motels). Close proximity to industrial
facilities for workers organized sanatorium.
Created in the original Soviet Union, the sanatorium system meant an
accessibility to all segments of the population. Holiday activities were fully
monopolized by the state of Soviet Union. Management of it was provided through state
planning. Initially sanatoriums were far more medical facilities than the resort ones.
Many health centres are still running by the Doctor-in-Chief. Sanatoriums are licensed
by (as well as any medical activity) The Federal Service on Surveillance in Healthcare
and Social Development and certified in accordance with specific requirements.
Specificity of health centres is significantly different from the hostels, holiday
homes, hotels, etc. Despite the apparent similarity of business processes such as sales of
services, accommodation and meals, these processes are considerably different in
sanatoriums, both because of the influence of medical orientation of such institutions
and also because of historical patterns of work. Currently, the most modern sanatorium
resorts approximate processes that are not directly related to treatment, to the global
hotel and SPA- standards.
For a specific set of health-care services citizen should receive sanatorium
direction (voucher). This voucher was a document confirming the right to receive a
certain set of medical-health services.
3.1.8. Evolution of number of establishments, with number of room
and with evolution of available beds
In this part of the report we analyze Russian`s tourist industry, particularly, the
number of hotel establishment and other supply side information, such as number of
rooms and beds in accommodation services. By means of comparing the evolution of
demand and supply sides, we are able to analyze if there has been excess of someone.
To check out that issue, we focus on the occupancy rate of the hotel establishments.
According to the data of UNWTO from 2006 to 2010, we have seen constant
growth of number of Establishment (Figure 16). In the year 2006, 5400 units and this
39number increased in 2010 until 7900 units. During these years the growth was smooth
and continuous. At the same time also increased the number of rooms and bed places.
Figure 16 Evolution of number of establishments (Units)
9.000
7.900
8.000
7.000
6.000 5.400
5.000
4.000
3.000
2.000
1.000
0
2006 2007 2008 2009 2010
Figure 17 Evolution of number of rooms, with number of
bed-places (Units)
573.300
600.000
500.000 430.970
400.000
300.000 263.000
208.309
200.000
100.000
0
2006 2007 2008 2009 2010
Number of rooms Number of bed-places
Source: UNWTO Database from 1995-2010
As we can observe in Figure 17, the number of rooms was of 263,000 in 2010.
This increase in the number of hotels and similar establishments in 2006-2010 (46,3%),
and in the number of rooms (26,2%), show us that the average size of hotels has been
decreasing during this period. In fact, the average size of a hotel in Russia was of 38.5
rooms per hotel in 2006 and 33.3 in 2010. Surely, the quality of hotels has also been
increasing in time, the same trend shown in other emerging destinations (UNWTO,
2012).
40It is always an interesting exercise trying to check out how the accommodation
supply for tourists (supply side) has evolved in comparison with the number of tourist
inflows themselves (demand side). In this way, we can also check how the match
between supply and demand has been evolving. Data let us see that foreign tourists
arriving to Russia increased in this period in 10.8%, a number clearly below that of the
increase in the supply side for this same period (46% in the number of hotel
establishments, 26% in rooms, and 33% in beds).
Unfortunately, we have not information about occupancy rate per available room
in Russia. However, information on occupancy rate per available bed shows to be about
32% in 1998, 36% in 2006, and 31% in 2010. It means that the increase of supply side
has been greater than those of demand side through this period, not necessarily implying
a lower occupancy rate. A greater length of stay of the tourists could be an explanation.
Perhaps a lower demand of accommodation in "other establishments" different to hotels
could help to understand also the figures above. In any case, we have assist to a
development of hotel industry in Russia, as a sign of an increasing flow of international
and domestic demand for tourism in the country, leading to higher investment in this
sector. As a result, the increase in the supply of accommodation has been great enough
to increase the ratio of available beds per 1000 inhabitants. This indicator began its
steady growth since 2005, and continues to grow in 2010, as can be observed in Figure
18. This indicator began its stable growth since 2005 and continues to grow.
Figure 18 Available capacity
(bed-places per 1000 inhabitants) (Units)
5,00
4,00
3,00
2,00
1,00
0,00
1996
1995
1997
1998
1999
2000
2001
2002
2003
2004
2005
2006
2007
2008
2009
2010
Source: UNWTO Database from 1995-2010
413.2. Outgoing
Regarding Russian people visiting foreign countries, we are going to analyze the
recent evolution of outflows and main destination countries.
3.2.1. The 5 principal destinations (countries) for Russian tourist
Analyzing all the tourist destinations and tourist flows to go Russian tourists we
can see a Table 14 with interesting data for 1996 -2000 - 2005 - 2010. The number of
Russian tourists travelling during this period increased from 3.900.000 in 1996 to
almost 26.000.000, tourists in 2010. The first place to conduct visits, according to the
obtained data, is still, Ukraine. In our opinion, this is due to geographical proximity, the
lack of language barrier, the resort climate of the black sea, historical affinity. Although,
despite the fact that the share of the market in 2010 decreased to 31%, compared with
38% in 2005, however, the physical number of outgoing tourists to Ukraine has
increased, with 6.043.829 in 2005 to 7.900.436, in 2010. This trend shows the increase
of the tourist flow from Russia (growth of 6 times), but also the gradual changes in the
flow direction (explicit reduction of the flow in Ukraine of the total number).
Table 14 The 5 principal destinations for Russian tourists
1996 2000
Ukraine 572 906 14% Ukraine 1 788 080 32%
China 555 897 14% China 1 080 209 20%
United Arab Emirates 459 161 12% United Arab Emirates 228 785 4%
Poland 382 639 10% Spain 222 995 4%
Germany 289 375 7% Germany 222 528 4%
Rest 1 705 732 43% Rest 1 961 871 36%
Total 3 965 710 100% Total 5 504 468 100%
2005 2010
Ukraine 6 043 829 38% Ukraine 7 900 436 31%
China 2 223 875 14% Turkey 3 091 930 12%
Turkey 1 855 918 12% Egypt 2 855 723 11%
Kazakhstan 1 405 543 9% China 2 370 313 9%
Egypt 777 665 5% Kazakhstan 1 269 697 5%
Rest 3 558 680 22% Rest 8 364 928 32%
Total 15 865 510 100% Total 25 853 027 100%
Source: UNWTO Data from 1995-2010
42You can also read