CAPITALAND LIMITED DBS Vickers Pulse of Asia Conference 2021 5 January 2021 - SGX
←
→
Page content transcription
If your browser does not render page correctly, please read the page content below
CAPITALAND LIMITED DBS Vickers Pulse of Asia Conference 2021 5 January 2021

Disclaimer

This presentation may contain forward-looking statements. Actual future performance, outcomes and results may differ materially
from those expressed in forward-looking statements as a result of a number of risks, uncertainties and assumptions. Representative
examples of these factors include (without limitation) general industry and economic conditions, interest rate trends, cost of capital
and capital availability, availability of real estate properties, competition from other developments or companies, shifts in customer
demands, shifts in expected levels of occupancy rate, property rental income, charge out collections, changes in operating expenses
(including employee wages, benefits and training, property operating expenses), governmental and public policy changes and the
continued availability of financing in the amounts and the terms necessary to support future business.

You are cautioned not to place undue reliance on these forward-looking statements, which are based on the current view of
management regarding future events. No representation or warranty expressed or implied is made as to, and no reliance should be
placed on, the fairness, accuracy, completeness or correctness of the information or opinions contained in this presentation. Neither
CapitaLand Limited (“CapitaLand”) nor any of its affiliates, advisers or representatives shall have any liability whatsoever (in
negligence or otherwise) for any loss howsoever arising, whether directly or indirectly, from any use, reliance or distribution of this
presentation or its contents or otherwise arising in connection with this presentation.

The past performance of CapitaLand or any of the listed funds managed by CapitaLand Group (“CL Listed Funds”) is not indicative of
future performance. The listing of the shares in CapitaLand (“Shares”) or the units in the CL Listed Funds (“Units”) on the Singapore
Exchange Securities Trading Limited (the “SGX-ST”) does not guarantee a liquid market for the Shares or Units.

This presentation is for information only and does not constitute an invitation or offer to acquire, purchase or subscribe for the Shares or
Units.

                                                                                                                                               2
Table of Contents

• 3Q/YTD Sep 2020 Business Updates
• Financial Overview
• Key Operational Statistics

                                     3
3Q/YTD Sep 2020
Business Updates

                   Raffles City Chongqing, China
Key Highlights
  3Q 2020 operating metrics show encouraging signs of recovery

                                                                                                              Portfolio Updates
  •    COVID-19 situation stabilises in CapitaLand’s two largest markets – Singapore

  •
       and China
       Signs of businesses picking up across geographies and asset classes
                                                                                            1

                                                                                  Financial and liquidity positions remain robust
                                                                                  • Maintained discipline in shoring up liquidity and proactively managing cash
                                                                         2          position
                                                                                  • Pivoting towards sustainable finance

  Fund management - Repositioning of listed trusts takes shape
  • Formation of CapitaLand Integrated Commercial Trust was completed on 28 Oct
    2020
  • CapitaLand Retail China Trust becomes the Group’s dedicated listed vehicle for
                                                                                             3
    non-lodging assets in China with investment strategy expansion

                                                                              2030 Sustainability Masterplan launched on 1 Oct 2020

           Strategic Priorities                                         4     • Strategic plan committing the Group to a new level of sustainability KPIs to drive
                                                                                and safeguard our businesses for generations to come

  Charging ahead in digital and tech transformation
  • More tenants see digitalisation as an integral business enabler : ~400 tenants across
      China and Singapore onboarded CapitaStar app in 3Q 2020
  • “Discover ASR” mobile app launched for members of Ascott Star Rewards - Group’s
                                                                                             5
                                                                                                                                                                     5
    digital ecosystem expands further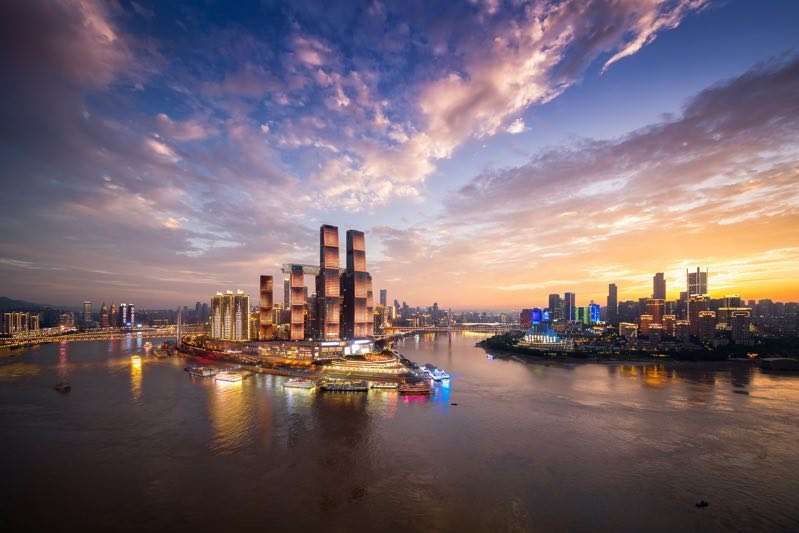
Development

     Residential Performance
      New launches, healthy sales; unit handovers back on track in China and Vietnam
China                                                                                                             Singapore
•   Sales momentum remains strong – over 1,900 units                                                              •   Units sold in 3Q 2020 was three
    sold in 3Q 2020. This was 40% higher than previous                                                                times the total number sold in
    quarter (third consecutive quarter of improvement)                                                                the first half of 2020
•   Handovers YTD Sep 2020 exceeded the same                                                                      •   New units launched at One
    period last year in total value                                                                                   Pearl Bank and Sengkang Grand
•   More units expected to be handed over in the last                                                                 Residences to meet increased
    quarter of 2020                                                                                                   demand
                                                                            Artist impression of Sengkang Grand
                                                                                    Residences, Singapore

                                                                        Vietnam
                                                                        •   Handovers YTD Sep 2020
                                                                            tripled YTD Sep 2019 in both
                                                                            units and handover value
         La Botanica, Xi’an              Parc Botanica, Chengdu         •   3Q total sales doubled that
• 574 units launched in Jul 2020   • 774 units launched in Jul 2020
• 99% sold with ASP of ~RMB13.0k   • Fully sold with ASP of ~RMB10.4k
                                                                            of 1H 2020                                    D’Edge Thao Dien, Ho Chi Minh
  psm                                psm
• Achieved total sales value of    • Achieved total sales value of
  ~RMB 874 mil                       ~RMB 872 mil

                                                                                                                                                          6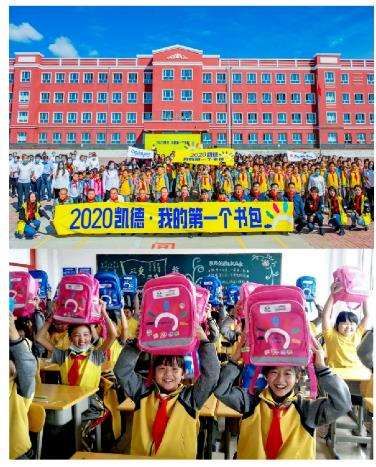
Development
Retail Performance
Improving operating metrics as retail headwinds soften
YTD Sep 2020 shopper traffic and tenant sales
                                    Tenant sales
                                                                                      •      YTD Sep 2020 shopper traffic and tenant sales showed gap
           Shopper traffic
                                                                                             narrowing with pre-COVID levels

 China        -31%1 YoY2                       Singapore       -17.0%1 YoY2           •      Committed occupancy rate remained largely stable and
              -38% YoY2                                        -42.4% YoY2
                                                                                             almost all tenants have resumed operations
                                                                                      •      While pace of new take-ups have slowed down, tenant
                                                                                             retention rate remained high at >80% for Singapore
                                                                                             portfolio
                                                                                      •      About 2% of Singapore tenants3 have requested for rental
                                                                                             relief in accordance with the COVID-19 (Temporary
                                                                                             Measures) Act 2020
                                    1Q 2020         2Q 2020      3Q 2020
                                                                                      •      Over S$320 million of rental rebates4 has been disbursed to
                                                                                             tenants YTD Sep 2020
   Japan      -21.3%1 YoY2                                    -15.0%1 YoY2
                                                Malaysia      -41.0% YoY2
              -21.9% YoY2
                       18,000,000                                          700,000,000           Committed                                      99.8
                                                                                                                                    97.8
                       15,000,000                                          600,000,000           Occupancy
                                                                                                 Rate (%)
                       12,000,000
                                                                           500,000,000                                  89.4                                87.9
                                                                           400,000,000
                        9,000,000
                                                                           300,000,000
                        6,000,000
                                                                           200,000,000                         China           Singapore         Japan          Malaysia
                        3,000,000                                                Notes:
                                                                           100,000,000
                                                                                 1.       Change in tenants’ sales per sqm (for China) and sq ft (for Singapore, Malaysia and Japan)
                               -                                           0     2.       Compared to YTD Sep 2019
                                     1Q 2020       2Q 2020    3Q 2020            3.       Based on YTD Sep 2020 gross rental income. Includes base rent, service charge and A&P charge and
                                                                                          excludes rental rebates
                                                                                 4.       On 100% basis. YTD rental support to our retail tenants, excluding government subsidies
                                                                                                                                                                                             7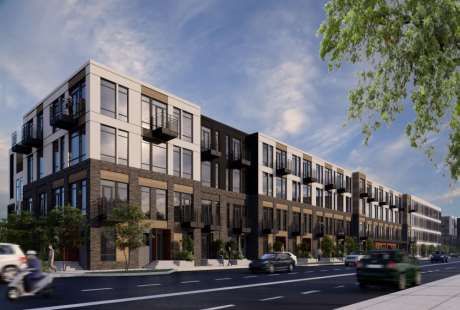
Development

       Office Performance
       Resilient despite softening market conditions
                                                                                       Reconstituted portfolio at favourable valuations
               3Q 2020 Overview                                                                                                                                     Investment
•    Committed office occupancy remained                                                           Divestment
                                                                                                                                                 An office property, Singapore
     strong across geographies                                                  ICON Yeoksam, South Korea                                         •   Minority co-investment in a private
                                                                                                                                                      fund managed by CapitaLand
•    Healthy weighted average lease expiries                                     •      Divested at agreed property value
                                                                                                                                                  •   Freehold property in Singapore CBD
     (WALE) across key office markets                                                   of KRW142.2 billion (c.S$165.1
                                                                                                                                                      at an agreed property value of
                                                                                        million3), 16.9% above valuation4
                                                                                                                                                      S$200 million, >13% below valuation5
•    While leasing remained soft, renewals                                       •      c.S$19.0 million net gains, based on
                                                                                                                                                  •   Expected completion in 4Q 2020,
                                                                                        effective stake of 99.1%
     and new take-ups in 3Q 2020 continued                                                                                                            subject to vendor securing necessary
                                                                                 •      Retained as asset manager
     to register positive reversions portfolio-                                  •      Completed in August 2020
                                                                                                                                                      shareholder approval
     wide
•    CapitaLand saw ~35%1 of its Singapore                                               Updates on Key Projects Under Development/AEI
     portfolio office community returning to                                             CapitaSpring
     their workplaces since the government                                               •   Structural works reached level 50                     Artiste Impression:
     relaxed workplace regulations on 28 Sep                                                                                                      CapitaSpring interior
                                                                                         •   Committed occupancy at 34.9%     6                          facade
     2020. Across the portfolio, returning office
     community has increased                                                             •   Target completion in 2H 2021
                                                                                         Six Battery Road
•    Rental arrears are at 2%2 or less across                                            •   Revised target completion end-2021
     geographies                                                                         21 Collyer Quay
                    95.3           92.5   94.1
                           89.9                                                          •   7-year lease to WeWork expected to commence in early 4Q 2021
            84.6
                                                                                         79 Robinson Road
                                                        CapitaSpring site progress
                                                                                         • Committed occupancy at 73.8%6
                                                        Notes:
                                                        1.   As at 16 Oct 2020
                                                        2.   As at 30 Sep 2020. For Singapore, this excludes tenants on rent deferment schemes   6.   As at 30 Sep 2020
    China   Singapore 7 Japan  South Korea    Germany
               Committed Occupancy Rate (%)
                                                        3.
                                                        4.
                                                             Based on exchange rate of KRW 1 : S$ 0.001161
                                                             Valuation as at 31 Dec 2019
                                                                                                                                                 7.   For Singapore Grade A office buildings only. Excluding
                                                                                                                                                      79 Robinson Road
                                                                                                                                                                                                               8
                                                        5.   Valuation as at 4Q 2020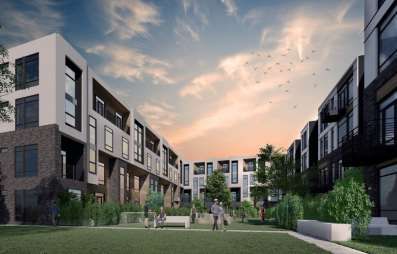
Development

          Business Park, Industrial & Logistics Performance
           Asset class benefits from majority “new economy” tenants that have been able to
           better withstand current cyclical headwinds
                                                                                                                                                          Committed Occupancy Rate (%)2

❑ Overall committed occupancy remained robust                                                                                                                     97.5     97.5

❑ >50% of monthly gross revenue is derived from less impacted new                                                                                                                   92.0            92.5

  economy industries, which are tech-driven and/or R&D-focused                                                                                           88.9
                                                                                                                                                                                            87.8

❑ Tenants’ workforce in most geographies have gradually resumed work
❑ Maintained positive rental reversions across the portfolio YTD
                                                                                                                                                     Singapore        Australia      UK    U.S.    China   India

Update on leasing at Arlington Business Park, UK                                                                     Well-positioned to capitalise on attractive opportunities
•       Secured a long-term lease with Commvault Systems Ltd, an                                                     •   Acquired MQX4, 5th suburban office in Australia (via
        international enterprise data solutions and services                                                             Ascendas Reit) in Sep 2020 for A$167.2 million (S$161.0 million)
        company, taking up 13,000 sq ft of the newly refurbished                                                         at 6.1% NPI yield1
        building 1330                                                                                                •   Located in Sydney’s premier innovative location, Macquarie
•       This adds to the recent successful lettings to other                                                             Park, is an attractive alternative location to the CBD
        multinational tenants, e.g. Veritas Technologies and                                                         •   Targeting to achieve a 6 Star Green Star Design & As Built
        Honda, totaling 27,000 sq ft                                                                                     Rating and 5.5 Star NABERS Energy Rating upon construction
                                                                                                                         completion in mid-2022

         Double-height reception                            Building 1330 adjacent to Floating Pavilion                                  Artist’s illustration of MQX4, Macquarie Park
    Notes:
    1.   First year NPI yield (post transaction cost)
                                                                                                                                                                                                                   9
    2.   The committed occupancy rate of UK portfolio refers to the 38 logistics properties owned by Ascendas Reit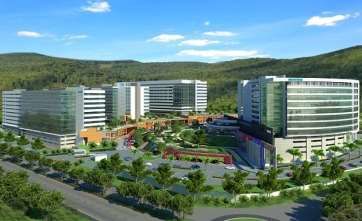
Development

        Up-and-coming Space Concepts
        Across asset classes, we are redefining work, live and play
     New retail offerings catering to a growing interest in                                   Rochester Commons       A campus-style
eSports and social wellness & sustainability at Bugis Street,                                                         integrated development
  a development integrating the former Bugis Street and
                                               Bugis Village
                                                                                                                      equipped with state-of-
                                                                                                                      the-art learning
                                                                                                                      technologies and a
                                                                                                                      1,200 sqft green trail that
                                                                                                                      will create thriving work
                                                                                                                      communities
                                                                                                                      17-storey Grade A office tower, Shared
                                                                                                                      Executive Learning Centre (SELC) and 135-key
                                                                                                                      business hotel as well as 12 heritage black
                                                                                                                      and white bungalows
                                                                                                                      Under construction. Target TOP in 2021

Arena esports hostel                Hovoh
                                                                                                                                                 Southeast Asia’s first
• Singapore’s first and flagship    • A service residence centered on sustainability and social                                                  shared executive
  esports hostel                      wellness                                                                                                   learning centre
• Space take-up: ~22,700 sq ft      • Operated by home grown brand, CP Residences
• Features 124 private rooms with   • Space take-up: ~22,600 sqft
  pro grade eSports gaming
                                    • Features >21 units with a 70 sqm community area; convenient &
  equipment, a 12-station Gaming                                                                           Heritage black and
                                      unique sustainable design concepts such as: DIY Edible Garden,
  Arena and vending machine                                                                                white bungalows for
                                      solar-powered / energy efficient lighting and appliances,            office and F&B use
  cafe
                                      recycling & upcycling community programmes                                                                                          10
Lodging
Lodging Performance
Resilient business model ⚫ Optimism on recovery with increasing resumption of domestic
travel
3Q 2020 Key Highlights • Pace of recovery
dampened by resurgence
of virus in Japan and Korea
• ~96% of properties operational as at 30
September 2020 Europe
• Overall occupancy at ~50% for 3Q 2020, a USA • Recovery largely driven by
sequential recovery from c.40% in 2Q 2020 domestic leisure segment North Asia
during the summer holidays,
• 3Q 2020 RevPAU improved by ~22% from • Operating environment as well as demand from
2Q 2020 challenging as COVID-19 student and arts and
caseloads remain high cultural groups China • Strong recovery
• Asset light operating platform maintained • Providing driven by domestic
accommodation to corporate and
positive cashflow for YTD September 2020
alternative market Gulf Region & India leisure demand
• Opened 6 properties comprising 975 units segments • Occupancy
in 4 countries: China, UK, Australia and Singapore recovered to >90%
Indonesia of last year’s level
• Middle East and India
• Signed more than 3,700 units across 22 supported by long stays
properties since 1H 2020. ~60% of which
are in China and the rest are spread • Housing those on self- SE Asia & Australasia
across various countries including Austria isolation and Malaysians
and Indonesia affected by border
closure • ~97% of properties operational
• >S$40 million in revenue generated YTD • 3 properties approved for • Long-stays cushioned occupancies
from alternative business segments staycation bookings in Vietnam, Indonesia and
Note:
1. As at 30 September 2020 Philippines
• Limited demand in Australia as
state borders largely remain closed 11Lodging
Lodging Performance (Cont’d)
Positioning our portfolio for eventual resumption of travels
Record signings of over 5,600 units Expansion of Citadines portfolio in Europe Optimising space use and extending
across 26 properties in China to date with new Islington Apart’hotel offerings in the new norm
Ascott Huaishu Road Ningbo Somerset Suzhou Bay Suzhou
• Opening of 108-unit Citadines Islington • ‘Space-as-a-Service’ initiative
• c.60% more new units signed in China London, a prime property held under
year-to-date, compared to the same • Conversion of apartments into other uses
Ascott’s serviced residence global fund (fitness and yoga studios, cloud kitchens
period last year, reinforcing Ascott’s
position as the largest international and venues for photoshoots and “live”
serviced residence owner-operator in • Ascott currently owns over 900 units in streaming events).
China London, which is set to increase by 300
units when Citadines Wembley London • Partnership inked with Nestle to set up We
opens next year
• Despite COVID-19, Ascott has sealed new Proudly Serve StarbucksTM self-service kiosks
contracts for more than 3,700 new units in Citadines-branded properties globally
globally, including over 2,100 new units in • Plan to further add over 800 units across
China, in 3Q 2020 Europe by 2023
• ‘Work in Residence’ initiative in more than 80
properties in over 10 countries
• Demand for extended-stay properties • Year-to-date, 17 properties with over
• Quick check-in and start work with minimal
continues to grow 2,400 units have been opened globally
disruption
• Riding the “Work-from-home” trend to
provide guests, corporates and students
with alternative locations to work or study
• Healthy take-up in Japan and Singapore
12Fund Management
Fund Management Performance
Diversified funds platform provides a resilient source of recurring fee income ⚫
Repositioning of listed trusts takes shape
Fee Income1 by Equity Sources (S$’ million) 3Q 2020 Key Highlights
293.2 • 3Q 2020 fee income marginally higher compared to 2Q 2020; and
225.8 18.1% lower YoY due to reduced one-time transaction fees as activities
104.7 217.5 slowed
57.9 Q4
71.1
64.5 86.8 Q3 • More than half a billion were divested via listed REITs or private funds
69.9 Q2 YTD
56.8 52.1
Q1
46.6 49.6 76.5 • >S$600 mil of investments made through listed REITs and private funds
2 YTD; S$1.3 bn of third-party capital remains available for deployment
FY 2018 FY 2019 YTD Sep 2020
Fund AUM by Geography and Equity Sources (S$’ billion) REIT Vehicles
PE Funds Repositioning • CapitaLand Commercial Trust and CapitaLand Mall Trust
31.4 completed their merger on 28 Oct 2020. The enlarged
26.1 0.8 REITs & BTs entity, CapitaLand Integrated Commercial Trust is the
largest proxy for Singapore’s commercial real estate market
16.7
21.8 30.6 2.1 ************
14.6 • CapitaLand Retail China Trust (CRCT) expands investment
4.3 strategy to diversify its portfolio beyond retail into office and
industrial properties, as well as integrated developments,
China Singapore Others 3
making CRCT the dedicated listed vehicle for non-lodging
Notes:
1. Includes fee-based revenue earned from consolidated REITs before elimination at Group level businesses in China for CapitaLand.
2. Includes contribution from ASB for the period from 1 Jul to 31 Dec 2019
3.
4.
Others include Malaysia, Vietnam, other Asia, Europe and USA
Inclusive Rock Square mall
13Capital Management Overview
Well-funded balance sheet, increasingly pivoting towards sustainable finance ⚫ Disciplined
cost management
3Q 2020 Capital Management Activities
S$800 million 2.90% fixed-rate senior notes due 2032
(Joint lead managers and joint bookrunners: DBS and
S$6.8bn S$2.6 bn
0.70x 0.70x
UOB) Total raised YTD Sep 2020 debt S$3.9 bn
headroom debt
S$2.0bn1
✓ Tightest-ever 12-year coupon for a corporate issuer in headroom
the SGD bond market in the last 20 years
Total sustainable financing
Dual-tranche S$200 million SORA-SOFR loan with UOB
raised YTD Sep 2020
0.64x 0.55x
✓ Referencing Singapore Overnight Rate Average
(SORA) and Secured Overnight Financing Rate (SOFR)
– a first dual-tranche in Singapore S$14.6bn2
Cash and available undrawn
Sustainable finance raised by REITs facilities of CapitaLand’s CL Group On On B/S
treasury vehicles
B/S (excl. REITs)
Ascendas Reit green bond with OCBC S$100M
(Sole lead manager/bookrunner: OCBC)
Ascendas Reit green perpetual securities S$300M
3.5 years2 Net D/E Debt Headroom
(Sole lead manager/bookrunner: OCBC) Debt maturity profile
CMT sustainability-linked Loan with UOB S$200M
Notes:
1. Total sustainable financing raised Including Off B/S is S$2.4bn 14
2. As at 30 Sep 2020Annual Asset Recycling Target - MET
S$3.02 billion of divestments YTD, of which S$1.9 billion was announced in 4Q 2020 as follows:
Divestment of 5 business park properties and Rock Transaction allows CapitaLand to:
1 Square to CRCT at an agreed property value1 of ✓ Unlock capital,
RMB8,130 million (S$1,653.1 million) in Nov 2020 ✓ Realise development profits and
✓ Tap recurring yield through our fund management
Ascendas Innovation Towers (“AIT”) platform
Type Business Parks
GFA 118,495 sq m Ascendas Xinsu Portfolio (“Xinsu Portfolio”)
Interest to be divested 100% Business Parks /
Type
Industrial
Agreed property value (mm)1 RMB759 / S$154
GFA 373,334 sq m
Interest to be divested 100%
Ascendas Innovation Hub (“AIH”)
Agreed property value (mm)1 RMB2,265 / S$461
Type Business Parks
GFA 40,547 sq m Singapore-Hangzhou Science & Technology Park Phase
Interest to be divested 80% I (“SHSTP Ph I”)
Type Business Parks
Agreed property value (mm)1 RMB298 / S$61 Xi’an
GFA 101,811 sq m
Interest to be divested 80%
Rock Square Suzhou Agreed property value (mm)1 RMB641 / S$130
Type Retail
Singapore-Hangzhou Science & Technology Park Phase
Hangzhou II (“SHSTP Ph II”)
GFA 88,279 sq m
Interest to be divested 49% Type Business Parks
GFA 130,261 sq m
Agreed property value (mm)1 RMB3,400 / S$691
Guangzhou Interest to be divested 80%
Agreed property value (mm)1 RMB767 / S$156
Notes: SGD/RMB of 4.9179 used
1. Agreed Property Value on 100% basis
15Annual Asset Recycling Target – MET (Cont’d)
S$3.02 billion of divestments YTD, of which S$1.9 billion was announced in 4Q 2020 as follows:
2 Divested three matured malls in Japan for a total of JPY 21.99 billion (S$283.6 million1) in Nov 2020
CO-OP Kobe Nishinomiya Higashi, Greater Osaka La Park Mizue, Greater Tokyo Vivit Minami-Funabashi, Greater Tokyo
• Sold La Park Mizue, Vivit Minami-Funabashi and CO-OP Kobe Nishinomiya Higashi to two
unrelated parties above assets’ December 2019 valuation
• In line with strategy to divest non-core assets and recycle capital into other new economy
assets
• Upon deal completion, CapitaLand’s remaining Japan portfolio to consist two malls and four
offices, as well as the newly announced development of a logistics property in Greater Tokyo
Note:
1. Based on the exchange rate of JPY 1 to S$0.01290 16Expanding Footprint With New Economy Asset
Re-deploying capital released from asset recycling into resilient business park and
logistics sectors
Acquisition of Ascendas Xinsu Portfolio
• Signature business park portfolio within Suzhou Industrial Park with significant
strategic value and redevelopment potential
• A 49:51 JV1 with CRCT with CapitaLand’s effective stake increased to 49%, from
23%
• Agreed property value2 at RMB2,265 million (S$460.6 million)
• Ability to support CRCT in asset management and build potential future assets
pipeline
Development of a logistics property in Japan Artist’s impression
• CapitaLand’s first foray into Japan’s logistics sector, a prime beneficiary of e-commerce growth
• A joint venture with Mitsui & Co. Real Estate to develop and operate a four-storey modern logistics
facility in Greater Tokyo
• CapitaLand as the majority partner in JV
• Site is close to Central Tokyo and easily accessible via the strategic Route 16 expressway
• CapitaLand will continue to grow and scale up in Japan’s logistics sector by forming strategic
partnerships with local players
Notes:
1.
2.
CL holds 49% stake while CRCT holds 51% stake in the JV
Agreed Property Value on 100% basis
17Scaling Up Multifamily Asset Portfolio in The USA
Overview
• Announced programmatic joint venture (JV) with an Austin-headquartered real estate
investment, development and property management firm in Dec 2020, to acquire and
develop multifamily assets totalling US$300 million (S$416.1 million 1) in gross asset value
• This will build upon CapitaLand’s existing multifamily portfolio, which has exhibited
resilience during the COVID-19 pandemic and remains a deep, scalable and liquid asset
class with attractive risk-adjusted returns.
• The JV will focus in the Southeast and Southwest markets of the USA, with an initial focus
on high growth city of Austin, Texas
• CapitaLand holds an 80% stake in the JV’s first multifamily project while its partner holds
the remaining 20%
Details of first co-investment project
• A 341-unit modern, mid-rise and green suburban multifamily property on
4.71acres of freehold land
• Mix of studios, one- and two-bedroom apartments with separate work and
living areas for residents to work from home efficiently
• Located within minutes of The Domain mixed-use development and
immediately adjacent to the soon-to-be delivered McKalla Place Major
League Soccer Stadium
• Expected completion in 2023
Note: 18
1. Based on the exchange rate of US$1 to S$1.38713Accelerating Digitalisation and Tech Innovation
Retail stakeholders Ascott’s digital Digitalising our CapitaLand leads Smart Urban
digital outreach gains ecosystem internal operations Co-Innovation Lab collaboration
pace transformation enters • Embarked on Robotic • Southeast Asia’s first industry-led lab for smart cities
a new phase Process Automation solutions development opened on 28 Oct 2020
• CapitaStar membership at ~13 journey - automated more • The Lab will engage and build industry
million1 • Launch of ASR (Ascott Star than 40 processes across communities of intelligent estates, smart mobility,
Rewards) mobile app in Oct 2020 the company, achieving
• >2,000 tenants onboarded sustainability, urban agriculture, advanced
to further drive the growth of savings in excess of 300
CapitaStar and other digital manufacturing and digital healthcare that are
Ascott’s customers globally man-days per month
channels2 YTD Sep 2020 (approx. enabled by AI, 5G, cloud etc
25% increase from last reported in • A one-stop 24/7 digital concierge • Promote sustainability • To discover, develop, demonstrate and deploy
1H 2020) to deliver more conveniences to through paperless initiatives solutions in a live environment at CapitaLand’s
ASR members, provide greater and use of Internet of
• CL China retail saw a 168% QoQ 5G-enabled Singapore Science Park
value and flexibility, as well as Things (IOT), improving
increase in gross merchandise enhance members’ experience • As a start, CapitaLand and its partners have
value in 3Q 2020 efficiency in work
with Ascott processes committed up to S$10 million in the Lab
• eCapitaVoucher sales in • Partnership with CapitaStar to
Singapore increased by ~229% • Use of robots, video
cross-sell and bring greater value analytics and sensors to
YTD Sep 2020 compared to the to members
same period in 2019 reduce reliance on Innovation
• To build on the successes of ASR manpower Leadership
• Offline-online partnership with which saw: Digitalising
Internal
➢ Members growth: +200% Ops
➢ Growth in direct bookings :
+35%
to drive tenant sales and shopper
traffic through the Shopee ➢ 35% more spend by loyal
platform to selected CapitaLand members
malls; and have IMM on the
Shopee platform as its first virtual ➢ 20% online revenue growth Partnership with
shopping mall CapitaStar
since ASR’s launch in Apr 2019
Notes:
1. As at 30 Sep 2020
2. Includes platforms such as
eCapitaMall and Capita3Eats
19Sustainability Overview
Release of 2030 Sustainability Masterplan sets strategic blueprint to elevate CapitaLand’s
sustainability leadership
Focuses on three key themes in environment, social and
governance (ESG) pillars. Impact to be measured by new
metric, Return on Sustainability and global benchmarks
BUILD
Sustainability is at Portfolio Resilience and Resource Efficiency
the core of • Reduce carbon emissions intensity by 78%1 – transition to a low-carbon
business with science-based targets for a well-below 2°C scenario
everything we do •
•
Reduce water consumption intensity by 45%1 and mitigate water risks
Incorporate circular economy in waste management and reduce Launched
embodied carbon in building materials concurrently with
We will grow in a Sustainability
responsible manner, ENABLE
Master Plan to
Thriving and Future Adaptive Communities
deliver long-term crowdsource
• Dynamic human capital global
economic value, and • Healthy and safe buildings
technologies and
contribute to the • Proactive customer relationship management
solutions
• Robust supply chain management
environmental and
social well-being of our Scan here to know
ACCELERATE
communities
more about
CapitaLand 2030
Sustainability Innovation & Collaboration Sustainability Master
Plan and
• Triple sustainable finance to S$6 billion Sustainability X
Challenge
• Leverage technology to elevate productivity, service quality and
improve well-being and safety
Note: • Innovation budget to pilot sustainable technologies and solutions
1. Reduction targets are relative to 2008 baseline 20Sustainability Overview (Cont’d)
Unwavering commitment to building people and communities
• Won ‘Organisation of Good’ at President's • >8,000 staff and public in
Volunteerism and Philanthropy Awards 2020 China donated their steps
in October for exemplary contribution to the for matching donation from
community in Singapore during COVID-19 – CapitaLand Hope
Highest honour award Foundation to support
Grade 1 students in rural
• Contributed >S$6 million globally including >S$2 schools with school
million in Singapore to support over 55,000 necessities
people impacted by COVID-19 to-date Mr Lee Chee Koon receiving the award from
Singapore President Madam Halimah Yacob • Donated 10,000
(Photo credit: National Volunteer & Philanthropy Centre)
schoolbags in September
#CareKitWithLove volunteers sewing mask pouches
• Pledged S$200,000 donation from CapitaLand My Schoolbag China 2020
Hope Foundation in support of President’s
Challenge in September through
#CareKitWithLove community initiative in • Mid-autumn celebration
Singapore with >1,400 students from
• Rallied community to sew over 9,000 mask pouches
CapitaLand Hope Schools
for students and frontline staff at special schools, in Vietnam
and conduct virtual art workshops for special
needs students • Distributed education
bursary from CapitaLand
• Supported the sale of 2,000 batik mask pouches Hope Foundation to 173
designed by artists with special needs on Education bursary distribution to graduating Grade 5
eCapitaMall in October students’ parents at CapitaLand Hope students
Schools in Vietnam
Scan here to purchase Arts@Metta batik
mask pouches
21Our Business Outlook
❖ 3Q 2020 was marked by a quarter-on-quarter improvement in the operating metrics across CapitaLand’s portfolio,
especially in the residential, retail and lodging segments, as the COVID situation improved globally.
❖ Notwithstanding the progress, overall business and consumer sentiment remains cautious, underpinned by the uneven
pace of recovery, and concerns over a resurgence in the pandemic.
❖ Following significantly reduced profitability in 1H 2020 and arising from a subdued operating environment, lower
expected capital recycling, year-end revaluation that will be applied to the Group’s investment property portfolio, as
well as impairment assessment for equity investments, CapitaLand’s financial performance for FY 2020 will be materially
adversely impacted.
❖ Nonetheless, CapitaLand’s financial position remains resilient. We expect our diversified operating income streams across
geographies and asset classes to deliver positive cash profits for FY 2020, underpinned by our proactive approach to
capital management.
❖ Looking ahead to FY 2021, the pace of the global economic recovery remains highly dependent on multiple factors,
such as a reliable COVID-19 vaccine, the resumption of normal international travel, and the easing of geo-political
tensions. Until then, financial returns expectations based on pre-COVID assumptions may also have to be moderated.
❖ We will continue to look for attractive investment opportunities to reposition the Group for growth in our three strategic
pillars: Development, Lodging and Fund Management. We are actively future proofing our businesses by adjusting our
product suite to new norms and expectations, digitalising our operations, as well as stepping up our commitment to
sustainability.
❖ We will remain disciplined with our capital expenditure, cost controls and workforce optimisation.
❖ We are confident that we have the resilience and agility to successfully navigate through the pandemic.
22Financial Overview
Raffles City Hangzhou, China1H 2020 Financials Overview (Recap)
Revenue EBIT PATMI
S$2,027.4M S$596.8M S$96.6M
Operating Total Cost Cash & Available
Cashflow Savings1 Undrawn Facilities
Note:
1. Versus 2H 2019 24Portfolio Overview
Real estate asset under management1,2 by geography and asset class
By Geography By Asset Class
YTD Sep 2020: S$133.3 Billion YTD Sep 2020: S$133.3 Billion
Other Emerging Residential, Commercial
Other Developed Business Park, Strata & Urban Development
Markets5 Industrial &
10% Markets3 8%
15% Logistics7 15%
11% 15% 8%
15%
FY 2019 28%
FY 2019 29%
S$131.9 Billion S$131.9 Billion Retail
27%
41% 33% 27%
42% 33%
China4
Lodging6
Singapore
21%
22%
Office
Notes:
1. Refers to the total value of real estate managed by CapitaLand Group entities stated at 100% of property carrying value
2. FY 2019 RE AUM as at 31 Dec 2019 and YTD Sep 2020 RE AUM as at 30 Sep 2020
3. Excludes Singapore and Hong Kong
4. Includes Hong Kong
5. Excludes China
6. Includes multifamily and hotels 25
7. Includes data centresPortfolio Overview
Total assets1 by geography and asset class
By Geography By Asset Class
YTD Sep 2020: S$86.2 Billion YTD Sep 2020: S$86.2 Billion
Other Emerging Corporate Residential,
Markets5 Other Developed & Others
Business Park, Commercial Strata
Markets2 & Urban Development
6% Industrial &
14% Logistics7 5%
15%
9%
6% 3%
14%
8% 16%
Lodging6
China4
15% 15%
37% FY 2019 FY 2019
37%
S$82.3 Billion S$82.3 Billion
43% 34%
Singapore3 33%
24%
43%
Retail
Office 23%
Notes:
1. FY 2019 total assets as at 31 Dec 2019 and YTD Sep 2020 total assets as at 30 Sep 2020
2. Excludes Singapore and Hong Kong
3. Includes corporate & others
4. Includes Hong Kong
5. Excludes China
6. Includes multifamily and hotels 26
7. Includes data centresYTD Sep 2020 Balance Sheet & Liquidity Position
Leverage Ratios
Coverage Ratio
Net Debt / Equity Net Debt / Total Assets1 Interest Coverage Ratio2
0.64x 0.33x 4.8x
0.63x in FY 2019 0.33x in FY 2019 7.6x in FY 2019
% of Fixed Rate Debt Ave Debt Maturity3 NTA Per Share NAV Per Share
66% 3.5 Years S$4.32 S$4.57
68% in FY 2019 3.7 years in FY 2019 S$4.44 in FY 2019 S$4.64 in FY 2019
Notes:
1. Total assets excludes cash
2. On a run rate basis. Interest Coverage Ratio = EBITDA/ Net Interest Expenses; EBITDA includes revaluation gain
3. Based on put dates of convertible bond holders 27Prudent Management Of Look-Through Debt
As at 30 September 2020
On Balance Sheet Off Balance Sheet
Net Debt (1) /Equity
0.64 0.56 0.59
0.55 0.50
(4)
0.42
(2)
CL Group On B/S On B/S (excl. REITs) REITs (3) JVs/Associates (5) (6) Funds Off B/S REITs (7)
Net Debt (1) /Total Assets (8)
0.33 0.32 0.31 0.35
0.29 (4)
0.23
(2) (3) (5) (7)
CL Group On B/S On B/S (excl. REITs) REITs JVs/Associates Funds Off B/S REITs
Well-managed balance sheet
Notes:
1. Debt includes Lease Liabilities and Finance Lease under SFRS (I)16. (On B/S : S$1,080M , Off B/S : S$615M)
2. Proforma without SFRS (I)10 (excludes REITs Net Debt, includes CL’s share of REITs Equity)
3. The Group consolidated Ascott Residence Trust (ART), CapitaLand Commercial Trust (CCT), CapitaLand Mall Trust (CMT), CapitaLa nd Malaysia Mall Trust (CMMT), CapitaLand Retail China Trust (CRCT) and RCS Trust (Raffles City Singapore – directly held by
CCT and CMT) under SFRS (I)10
4. 63% of the debt in JVs/Associates is from ION Orchard, Jewel Changi Airport, Raffles City Changning (Shanghai, China) and Hongkou Plaza (Shanghai, China)
5. JVs/Associates exclude investments in Lai Fung Holdings Limited
6. JVs/Associates’ equity includes shareholders’ loans
7. Off B/S REITs refer to i) Ascendas Reit and ii) Ascendas India Trust 28
8. Total assets exclude cashWell-Managed Maturity Profile12 of 3.5 Years
Plans in place for refinancing/repayment of debt due in 2020
S$ billion Total Group cash
16.0 balances and available
undrawn facilities of
14.0
CapitaLand's treasury
12.0 vehicles:
10.0
8.0
~S$14.6 billion
6.8 6.5
5.8
6.0 5.1
4.0 3.1 3.1
2.0 0.8 1.2 1.1
0.3
0.0 0.5
2020 2021 2022 2023 2024 2025 2026 2027 2028+
On balance sheet debt 2 due in 2020 S$’ billion
Total
To be refinanced 0.6 Non-REIT level debt
To be repaid 0.2 REIT level debt 3
Total 0.8
As a % of total on balance sheet debt 3%
Well-equipped with ~S$14.6 billion in cash and available undrawn facilities
Notes:
1. Based on the put dates of the convertible bonds
2. Debt excludes S$1,080 million of Lease Liabilities and Finance Lease under SFRS(I)16 29
3. Ascott Residence Trust (ART), CapitaLand Commercial Trust (CCT), CapitaLand Mall Trust (CMT), CapitaLand Malaysia Mall Trust (CMMT), CapitaLand Retail China Trust (CRCT) and RCS Trust (Raffles City Singapore – directly held
by CCT and CMT)Disciplined Interest Cost Management
%
5.0
4.0
3.7
3.5
3.4
3.3 3.2
3.2 3.2 3.1
3.0
Implied Interest Rate
2.0
1.0
2 3
FY 2013 FY 2014 FY 2015 FY 2016 FY 2017 FY 2018 FY 2019 YTD Sep 2020
(Restated)
Implied interest rates 1 kept low at 3.1%
Notes:
1. Implied interest rate for all currencies = Finance costs before capitalisation/Average debt
2. Implied interest rate for all currencies before restatement was 4.2% 30
3. Straight annualisationYTD 2020 Divestments/Transfers
As of 31 December 2020
YTD 2020 Divestments/Transfers1,2 S$ million Entity (Seller)
Aggregated transactions announced in 1H 2020 Financial Results 702.3 Various entities
Transactions since 1H 2020 Financial Results announcement
ICON Yeoksam, Seoul, South Korea 165.1 CapitaLand
Retail spaces at Vista Verde and Mulberry Lane, Vietnam 16.4 CapitaLand
60.01% stake in a residential project in Shenyang, China 202.0 CapitaLand
Five business park properties and Rock Square mall, China 1,653.1 CapitaLand
Three malls, La Park Mizue, Vivit Minami-Funabashi and CO-OP Kobe
283.6 CapitaLand
Nishinomiya Higashi in Japan
Total Gross Divestment Value3 3,022.5
Notes:
1. Announced transactions from 1 Jan to 31 Dec 2020 31
2. The table includes assets divested/transferred by CapitaLand and CapitaLand REITs/Business Trusts/Funds
3. Divestment/transfer values based on agreed property value (100% basis) or sales considerationYTD 2020 Investments
As of 31 December 2020
YTD Investments1,2 S$ million Entity (Buyer)
Aggregated transactions announced in 1H 2020 Financial Results 516.0 Various entities
Transactions since 1H 2020 Financial Results announcement
Suburban office in Macquarie Park, Sydney, Australia 161.0 Ascendas Reit
Office property in Singapore 200.0 CapitaLand
Five business park properties and Rock Square mall, China
1,653.13 CRCT
(includes CapitaLand’s 49% stake acquisition in Ascendas Xinsu Portfolio)
Two office properties in San Francisco, U.S. 768.0 Ascendas Reit
Logistics property in Greater Tokyo, Japan (Development) Undisclosed CapitaLand
Multifamily property in Austin, Texas (Development) Undisclosed CapitaLand
Suburban office at 1 – 5 Thomas Holt Drive, Macquarie Park,
284.0 Ascendas Reit
Sydney, Australia5
Logistics property in Brisbane, Australia (Development) 69.1 Ascendas Reit
Total Gross Investment Value4 3,651.26
Notes:
1. Announced transactions from 1 Jan to 31 Dec 2020
2. The table includes assets acquired by CapitaLand and CapitaLand REITs/Business Trusts/Funds
3. Adjusted from disclosure on 10 Nov 2020 to exclude separate mention of CapitaLand’s 49% stake in Ascendas Xinsu Portfolio
4.
5.
Investment values based on agreed property value (100% basis) or purchase/investment consideration
Acquisition expected to complete in 1Q 2021
32
6. Excludes “Logistics property in Greater Tokyo, Japan” and “Multifamily property in Austin, Texas” due to confidentiality clau sesKey Operational
Statistics
Heronfield, Seattle, USA33Development - Singapore, Malaysia and Indonesia
Singapore, Malaysia and Indonesia
Residential Sales1,2
131 units worth S$201 million sold in Singapore in YTD Sep 2020
Total Units Units % of launched
Markets
units launched sold units sold
Singapore 1,753 987 915 92.7%
Malaysia 837 837 745 89.0%
4,547
Indonesia 96 96 39 40.6%
SMI Total 2,686 1,920 1,699 88.5%
Notes:
1. Figures might not correspond with income recognition
2. Sales figures are based on options issued / bookings made excluding abortive units
34Development - Singapore, Malaysia and Indonesia
SMI1 Investment Properties Performance
Retail Business Park, Industrial & Logistics
As at 30 Sep 2020 Singapore Malaysia As at 30 Sep 2020 Singapore
No. of operating malls2 19 7 No. of operating properties 102
Committed occupancy rate 88.9%
Committed occupancy rate3 97.8% 87.9%
Weighted average lease expiry10 (years) 3.4
Change in shopper traffic
-42.4% -41.0%
(YTD Sep 2020 vs YTD Sep 2019)4 Average rental reversion11 (3Q 2020) -2.7%
Change in tenants’ sales (per sq ft)
-17.0% -15.0%
(YTD Sep 2020 vs YTD Sep 2019)4
Office
As at 30 Sep 2020 Singapore
No. of operating Grade A offices5 5 Notes:
1. Singapore, Malaysia and Indonesia
2. Portfolio includes properties that are operational as at 30 Sep 2020 and include properties managed by
CapitaLand Group
Committed occupancy rate6 95.3% 3. Committed occupancy rates as at 30 Sep 2020 for retail components (applicable to Singapore only)
4. Comparison on same-mall basis which compares the performance of the same set of property components
open/acquired prior to 1 Jan 2019
NPI yield on valuation7 3.7% 5. Figures as published in CapitaLand Commercial Trust (CCT) 3Q 2020 Financial Results. All five operating offices are
owned by CCT. Does not include 79 Robinson Road as committed tenants have not move in yet
6. Committed occupancy rate as at 30 Sep 2020; Lower committed occupancy rate largely due to asset
NPI 8 (S$ mil) 215.5 7.
enhancement initiative at Six Battery Road. 79 Robinson Road’s committed occupancy of 73.8% is not included
NPI yield on valuation is based on annualised YTD Sep 2020 NPI and valuation as at 30 Jun 2020. Excluded 79
Robinson Road, as the building obtained TOP in end-Apr 2020 and no tenants moved in yet
Change in NPI 9 8. Figures are on 100% basis, with the NPI of each property taken in its entirety regardless of CapitaLand’s effective
-6.4% interest. Excluded 79 Robinson Road as the building obtained TOP in end-Apr 2020
(YTD Sep 2020 vs YTD Sep 2019)(100% basis) 9. Lower NPI year-on-year largely due to ongoing asset enhancement initiative at Six Battery Road
10. Calculated based on balance of lease term of every lease weighted by annual rental income
11. Calculated based on average signing gross rent of the renewed leases divided by preceding average signing
gross rent of current leases. For the period Jul to Sep 2020, weighted by area renewed and for multi-tenant 35
buildings onlyDevelopment - Vietnam
Vietnam Residential Sales1,2
• No new launches scheduled in YTD Sep 2020. Limited selections left for balance unsold
launched units
• 177 units were returned by buyers, primarily due to delays in securing permits for units sold
previously. This resulted in negative sales accounted in YTD Sep 2020, but was offset by
the subsequent sales of 30 returned units
• 4 new units sold in D1mension in 3Q 2020
Total
4,547 Units Units % of launched
Markets
units launched sold2 units sold
Ho Chi Minh City 972 754 529 70.2%
Hanoi 2,778 2,778 2,771 99.7%
Vietnam Total 3,750 3,532 3,300 93.4%
Notes:
1.
2.
This list only shows current projects with available units for sale during the reported period. Figures might not correspond with income recognition
Sales figures are based on options issued made, netting off abortive units
36Development - Vietnam
Vietnam Residential Handover Volume and Value
3Q 2020: ~3.6x YoY 3Q 2020: ~3.3x YoY
YTD Sep 2020: ~3.3x YoY YTD Sep 2020: ~2.8x YoY
1,000 300
Handover Value (S$ million)
903
245 1Q
250
Residential Units
800 2Q
276 3Q
200
121
600
150
400 490 100 88
271
37 97
76
200 50
77 19
118 137 32 27
-
-
YTD Sep 2019 YTD Sep 2020
YTD Sep 2019 YTD Sep 2020
Future Revenue Recognition
• ~1,159 units1 sold with a value of ~S$456 million2 expected to be handed over from 4Q 2020 onwards
• ~34% of value expected to be recognised in 4Q 2020
Notes:
1. Above data is on 100% basis 37
2. Value excludes value added tax and impact due to significant financing component for certain payment schemes under accounting principles IFRS 15Development - International
International Investment Properties Performance
Retail Business Park, Industrial & Logistics
As at 30 Sep 2020 Japan As at 30 Sep 2020 3Q 2020
No. of operating properties1 5 Weighted
No. of Committed
average lease Average rental
Committed occupancy rate 99.8% operating occupancy
expiry7 reversion8
properties rate
Change in shopper traffic (years)
-21.9%
(YTD Sep 2020 vs YTD Sep 2019)2,3,4 Australia
Change in tenants’ sales (per sq ft) Logistics 32
-21.3%
(YTD Sep 2020 vs YTD Sep 2019) 2,3,4 Suburban 97.5% 4.3 N.A.9
4
offices
Office United Kingdom
As at 30 Sep 2020 Japan6 South Korea Germany Logistics 38 97.5% 9.0 N.A.9
United States
No. of operating properties1 4 2 2
Business Park 28 92.0% 3.6 11.5%
Committed occupancy rate5 89.9% 92.5% 94.1%
Multifamily
As at 30 Sep 2020 United States Notes:
1. Portfolio includes properties that are operational as at 30 Sep 2020
2. Comparison on same-mall basis which compares the performance of the same set of property components
No. of operating properties 16 opened/acquired prior to 1 Jan 2019
3. Excludes La Park Mizue and Seiyu-Sundrug due to no disclosure from tenants
Committed occupancy rate 95.1% 4. Olinas Mall and Vivit Minami Funabashi were largely closed from 8 Apr to 31 May and 9 Apr to 31 May
respectively due to the “State of Emergency” implemented by the Japanese Government
5. Committed occupancy rate as at 30 Sep 2020 for office components only
Weighted length of stay (years) 1 6. Excludes Shinjuku Front Tower
7. Calculated based on balance of lease term of every lease weighted by annual rental income
8. Calculated based on average signing gross rent of the renewed leases divided by preceding average signing
gross rent of current leases. For the period Jul to Sep 2020, weighted by area renewed and for multi-tenant
buildings (MTB) only 38
9. There were no MTB lease renewals signed in the periodDevelopment - China
China Residential Sales
Residential sales value YTD Sep 2020 increased 28% YoY
3Q 2020: ~2.9x YoY 3Q 2020: ~2.5x YoY
YTD Sep 2020: ~1.0x YoY YTD Sep 2020: ~1.3x YoY
4,000 3,694 3,684 12,000 1Q
10,896 2Q
Sales Value (RMB million)
3Q
Residential Units
669 10,000
3,000 8,504
1,915 8,000 5,308
2,085
2,000
1,807 6,000
3,849
4,000
1,000 1,361 4,719
1,218 2,000
2,570
408 869
0 0
YTD Sep 2019 YTD Sep 2020 YTD Sep 2019 YTD Sep 2020
Notes:
1. Above data is on a 100% basis, including strata units in integrated development and considers only projects being managed. YTD Sep 2020 include 179 units with a value of RMB 0.7b arising from the divestment of a residential
investment
2. Value includes carpark, commercial and value added tax
39Development - China
China Residential Sales1
As at 30 September 2020
~ 1,400 more units ready to be released in China for the rest of 2020
Total Units % of launched
Markets Units sold1
units launched units sold
Beijing 922 453 363 80.1%
Guangzhou 10,220 3,211 2,864 89.2%
Shanghai 169 168 131 78.0%
Tier 1 Total 11,311 3,832 3,358 87.6%
Chengdu 7,714 7,145 7,134 99.8%
Chongqing 3,444 1,673 890 53.2%
Ningbo 180 180 110 61.1%
Wuhan 2,246 2,246 2,246 100.0%
Xian 28,146 21,465 21,460 99.9%
Tier 2 Total 41,730 32,709 31,840 97.3%
Kunshan 5,745 5,744 5,711 99.4%
Tier 3 Total 5,745 5,744 5,711 99.4%
Total 58,786 42,285 40,909 96.7%
Note:
1. Sales figures of respective projects are based on options issued made, netting off abortive units
40Development - China
China Residential Handover
3Q 2020: ~2.2x YoY 3Q 2020: ~1.7x YoY
YTD Sep 2020: ~0.8x YoY YTD Sep 2020: ~1.0x YoY
4,000 3,668 8,000
Handover Value (RMB million)1,2
7,000 6,347
3,042 6,231
Residential Units1
3,000
1,069 6,000 1Q
2Q
5,000 3Q
2,780
2,000 4,000 4,752
2,390
2,271 3,000
2,255
1,000 2,000
1,000 1,255
520 1,196
328 132 340
0 0
YTD Sep 2019 YTD Sep 2020 YTD Sep 2019 YTD Sep 2020
Future Revenue Recognition
• ~6,400 units sold3 with a value of ~RMB15.9 billion4 expected to be handed over from 4Q 2020 onwards
• ~50% of value expected to be recognised over the next 3 months5
Notes:
1. Above data is on a 100% basis, including strata units in integrated developments and considers only projects being managed
2. Value includes carpark and commercial
3. Units sold include options issued as at 30 Sep 2020. Above data is on a 100% basis, including strata units in integrated developments and considers only projects being managed
4. Value refers to value of residential units sold including value added tax
5. Subject to construction progress of the projects. While the Group remains cautiously optimistic, COVID-19 may potentially cause delays in construction progress 41Development - China
China Investment Properties Performance
Retail Business Park, Industrial & Logistics
As at 30 Sep 2020 As at 30 Sep 2020 YTD Sep 2020
No. of operating malls1 46
No. of Weighted
Committed
Targeted no2 of malls to be opened in 2020 1 operating average lease Average rental
occupancy
properties7 expiry8 reversion
Targeted no2 of malls to be opened in 2021 & rate
(years)
beyond 1
Business Park 8 86% 15.4%
Committed occupancy rate3,4 89.4%
2.1
Change in shopper traffic Industrial &
-38% 2 93% 10.9%
(YTD Sep 2020 vs YTD Sep 2019)4,5 Logistics
Change in tenants’ sales (per sqm)
-31%
(YTD Sep 2020 vs YTD Sep 2019)4,5
Office
Notes:
1. Portfolio includes properties that are operational as at 30 Sep 2020
As at 30 Sep 2020 2. Opening targets relate to the retail components of integrated developments and properties managed by CapitaLand
Group
3. Committed occupancy rates as at 30 Sep 2020 for retail components only
No. of operating properties1 22 4. Comparison on same-mall basis which compares the performance of portfolio with the same set of property components
opened/acquired prior to 1 Jan 2019
5. Excludes one master-leased mall. Tenants’ sales from supermarkets and department stores are excluded
No. of properties under development 5 6. Based on committed occupancy for stabilised projects as at 30 Sep 2020. Stabilised projects include offices in Raffles City
Shanghai, Raffles City Changning, Capital Square, Hongkou, Minhang, Innov Center, Pufa Tower, Ascendas Plaza,
Ascendas Innovation Plaza, Raffles City Ningbo, Raffles City Hangzhou, Suzhou Center, Raffles City Beijing, Tianjin
Committed occupancy rate6 84.6% International Trade Centre, Raffles City Shenzhen, Raffles City Chengdu, CapitaMall Tianfu, CapitaMall Xindicheng, One
iPark and CapitaMall Westgate. Office leasing momentums are stepping up in new projects, including Raffles City The
Bund in Shanghai and Raffles City Chongqing which are in their initial leasing stage
Average rental reversion (YTD Sep 2020) 0.7% 7. Xinsu portfolio comprises of Xinsu - Industrial (Industrial & Logistics) and Xinsu- R&D (Business Park)
8. Calculated based on balance of lease term of every lease weighted by occupied leasable area
42Development - India
India Investment Properties Performance
As at 30 Sep 2020
Portfolio
Number of operating Committed Weighted average lease expiry1
parks occupancy rate (years)
IT Parks 9 92% 4.2
Logistics Park 3 99% 2.5
International Tech Park Bangalore International Tech Park Pune International Tech Park Chennai
Note:
1. Calculated based on balance of lease term of every lease weighted by annual rental income
43Development - Lodging
Lodging Portfolio
69,019 operational units and 49,377 pipeline units
Real estate platform Operating platform
3rd Party
REIT/fund TAL Franchised Leased Total
Managed
Singapore 1,560 - 173 1,337 304 3,374 ROE-accretive model
SE Asia & Australasia (ex SG) 5,273 1,424 12,587 24,448 161 43,893
with >80% units under
management
China 1,441 200 34 26,490 - 28,165
contracts and
North Asia (ex CN) 3,275 - 342 905 649 5,171 franchise deals
Europe 3,631 478 690 923 821 6,543
Others 1,004 717 210 4,104 - 6,035
Serviced Apartments 16,184 2,819 14,036 58,207 1,935 93,181
Corp Leasing 1,517 433 - 830 33 2,813
Deepening presence
TAUZIA - - 186 19,952 - 20,138
and building scale in
Subtotal 17,701 3,252 14,222 78,989 1,968 116,132 key gateway cities
Synergy - - - - - 2,264
118,396
Notes: Figures above as at 15 Oct 2020
Includes properties units under development 44Development - Lodging
Lower Lodging RevPAU Due to COVID-19
YTD September 2020
Revenue per
Available Unit
(RevPAU)
S$
-39%
-68%
233 -59%
177
-46%
159 -34%
-43% -24%
142
113
95 98
83
72 66 65
56 61
47
Singapore SE Asia & China North Asia Europe Gulf Region & Total
Australia (ex China) India
(ex S'pore)
YTD Sep 2019 YTD Sep 2020
Overall YTD September 2020 RevPAU decreased by 46% YoY
Note:
1. Same store. Includes serviced residences leased and managed by the Group. Foreign currencies are converted to SGD at average rates for the relevant period 45Development - Lodging
Lower Lodging RevPAU Due to COVID-19
3Q 2020
Revenue per
Available Unit
(RevPAU) -46%
S$
-78%
244 -73%
-52%
-15% 191 -43%
-57% 162
131
108 114
85 88
75
62 55
44 42
36
Singapore SE Asia & China North Asia Europe Gulf Region & Total
Australia (ex China) India
(ex S'pore)
3Q 2019 3Q 2020
Overall 3Q 2020 RevPAU decreased by 52% YoY
Note:
1. Same store. Includes serviced residences leased and managed by the Group. Foreign currencies are converted to SGD at average rates for the relevant period 46Development – Fund Management
Diversified Portfolio Of Funds
One of Asia’s leading real estate fund managers with 26 Private Funds and 6 Listed Trusts2
Listed REITs/Business Trusts Market Cap
(As at 3 Nov 2020) (S$ Billion)
CapitaLand Integrated Commercial Trust 11.6
Ascendas Real Estate Investment Trust 10.9
Ascott Residence Trust 2.6
CapitaLand Retail China Trust 1.5
Ascendas India Trust 1.5
CapitaLand Malaysia Mall Trust 0.4
Total 28.5
Notes:
1. Fund size as at respective fund closing date
2. As at 3 Nov 2020 market close. Source: Bloomberg
47Sources of Fee Income
Others2
Others2
11% REIT
REIT 18%
Management3
Management3 29%
Serviced Residence 32%
Management Serviced Residence
21% Management
FY 2019 14% YTD Sep 2020
Total Fee Income1: Total Fee Income1:
S$673 Million S$530 Million
PE Fund
PE Fund Management3
Management3 11%
Property 11% Property
Management Management
22% Project Management
Project Management 24%
4%
3%
Notes:
1. Includes fee based revenue earned from consolidated REITs before elimination at Group Level
2. Mainly include general management fees, leasing commission, HR services, MIS, accounting and marketing fees
3. Includes acquisition/divestment fees of $3M (YTD Sep 2020), $43M (FY2019)
48Thank You
For enquiries, please contact Ms Grace Chen, Head, Investor Relations
Direct: (65) 6713 2883 Email: grace.chen@capitaland.com
CapitaLand Limited (https://www.capitaland.com)
168 Robinson Road #30-01 Capital Tower Singapore 068912
Tel: (65) 6713 2888 Fax: (65) 6713 2999 Email: groupir@capitaland.comYou can also read


