Sustainability Week Presentation - IGD SiiQ
←
→
Page content transcription
If your browser does not render page correctly, please read the page content below
Sustainability Week
Presentation
                      June 2021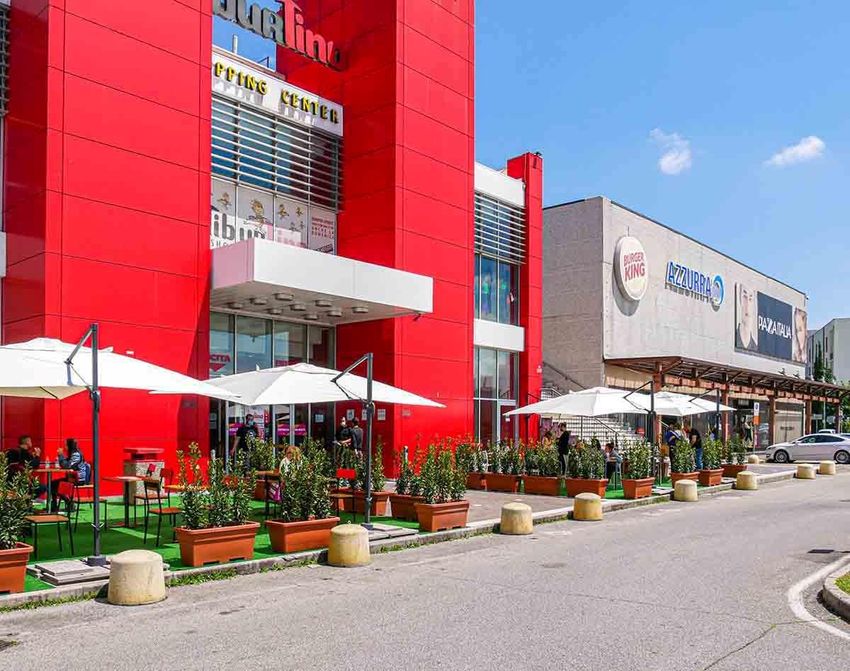
Disclaimer

  This presentation does not constitute an offer or an             These statements include financial projections and
  invitation t o subscribe for or purchase any securities.         estimates and their underlying assumptions, statements
                                                                   regarding plans, objectives and expectations with
  The securities referred t o herein have not been registered      respect t o future operations, products and services, and
  and will not be registered in the United States under the        statements regarding plans, performance.
  U.S. Securities A c t of 1933, as amended (the “Securities
  Act”), or in Australia, Canada or Japan or any other             Although the management of IGD SIIQ SPA believes
  jurisdiction where such an offer or solicitation would           that the expectations reflected in such forward-looking
  require the approval of local authorities or otherwise be        statements are reasonable, investors and holders of IGD
  unlawful. The securities may not be offered or sold in           SIIQ are cautioned that forward-looking information
  the United States or t o U.S. persons unless such                and statements are subject t o various risk and
  securities are registered under the Securities Act, or an        uncertainties, many of which are difficult t o predict
  exemption from the registration requirements of the              and generally beyond the control of IGD SIIQ; that
  Securities A c t is available. Copies of this presentation are   could cause actual results and developments t o differ
  not being made and may not be distributed or sent into           materially from those expressed in, or implied or
  the United States, Canada, Australia or Japan.                   projected by, the forward-looking statements.

  This presentation contains forwards-looking information          These risks and uncertainties include, bu t are not limited
  and statements about IGD SIIQ SPA and its Group.                 to, those contained in this presentation.

  Forward-looking statements are statements that are               Except as required by applicable law, IGD SIIQ does not
  not historical facts.                                            undertake any obligation t o update any forward-
                                                                   looking information or statements.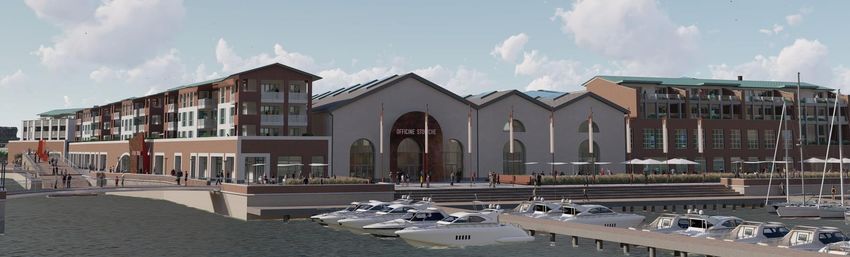
Index

   1    Introduction to
        IGD
                          Pag. 4
                                    5
                                    FY2020 and 1Q2021
                                    Financial results Pag. 65

   2    Operating
        performances
        in 2020           Pag. 11   6
                                    Dividend and
                                    Outlook
                                                      Pag. 73

   3    Portfolio and
        projects
                          Pag. 26   7
                                    Appendix
                                                      Pag. 76

   4    Sustainability
                          Pag. 38

                                                                3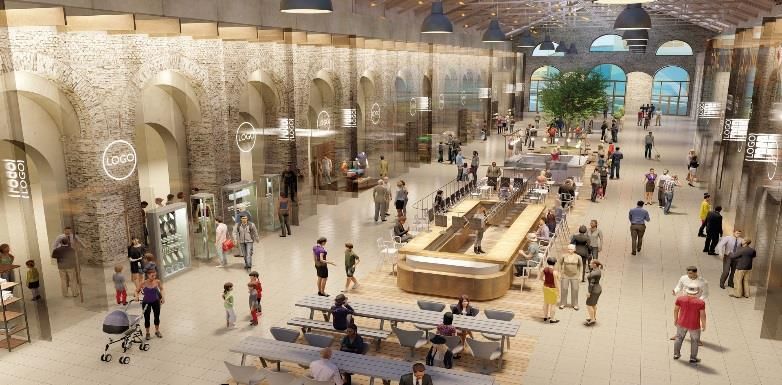
1
Introduction to IGD

IGD at a glance

IGD is one of the main players in the Italian retail real estate sector: we develop and manage shopping centres across
the country. We are also present in the retail sector in Romania
                           25 hyper/                                                                  14 shopping
27 shopping                                                                                                            Development
malls in Italy
                         supermarkets                                      c. €2.3bn                    malls in
                                                                                                                        & other(1)
                            in Italy                                                                   Romania
65% of value                                                                portfolio value                                4% of value
                           25% of value                                                               6% of value

Of which full ownership of 16 shopping
    centres (mall + hypermarket)

         5.3% EPRA NIY (2)                                                #1                            EPRA NAV/NRV:
         5.4% net initial yield topped-up                               Italian                         €10.38/share
                                                                         SIIQ
                                                                         (REIT)
         62.0% EBITDA                 margin(3)                                                         FFO: €13.8mn
         As at 31/03/2021                                                                               As at 31/03/2021

         93.6% financial                                                                                49.9% LTV
                                                                                                  %
  %      occupancy Italy                                                                                (excl IFRS16 c.47.8%)
         As at 31/03/2021                                       Sustainability        Financial
                                                                   Report              Report
                                                                 (6th year)          (3rd year)

                 Data as at 31/12/2020 unless differently indicated
           (1)   Includes mainly the Porta a Mare project in Livorno
                                                                                                                                         5
           (2)   IGD’s portfolio average
           (3)   Margin from freehold properties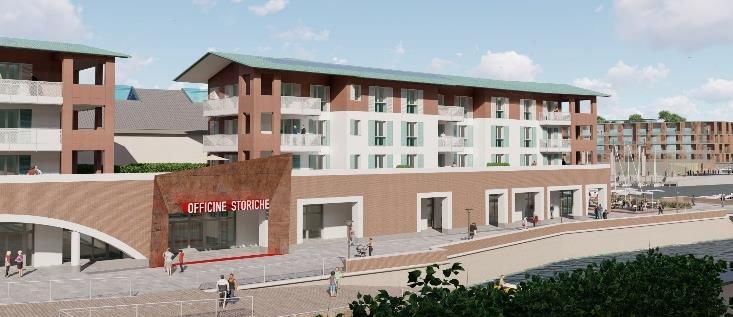
IGD Business Model
A distinctive competitive positioning in the fragmented
Italian retail real estate market

1           Well-diversified
            presence across Italy
                        39,2k                      PIL pro capite
                                                                    2   Strategic positioning
                                                                                                                3    Strong food anchor
                                                                                                                                                               4   Strong track record of
                                                                                                                                                                   direct management

                                                   €34,6k–€42,6k
                           1    30,9k
35,2k                                              €30,0k– €34,5k
                38,0k
                               5 33,1k             €20,6k– €29,9k                                                                                                           Services
                    3
        2                                          €16,8k– €20,5k
   30,3k 1
                        22 35,3k                        €28.500
            31,6k                                  Media italiana                                                                                                           Personal and
                        30,4k                                                        Ravenna
                                    7
                                 26,8k
                                                        €29.200                                                                                                             healthcare care
                           6 24,5k                  Media europea
            #              6           2
 n° di proprietà                   5 24,7k
                                           19,8k
                                                                                    4 km                                                                                    Local and
                            32,7k
                                             2
                                                      18,4k                                                                                                                 international
                                                                                                                                      Ipermercato
            20,6k
                                         18,2k      21,1k           Centro Commerciale                                                                                      brands
                                                                             ESP
                                                     17,2k

                                         17,5k
                                                                                                                                                                            Sharing economy
                                            4

                                                                                                                    The Food Hypermarket Plays a Critical        Proactive Approach, Carefully Selected
        Presence across all Italy, mainly in hte                       We strive to be the Dominant Retail
                                                                                                                  Attraction Role in Our Retail Assets Fresh     Merchandising Mix, Marketing Activity
          Northern regions. With Strategic Focus                     Destination in Mid-Sized Wealthy Italian                                                  Adapted to Each Context and Wide Offer of
                                                                      Cities, at Easy Reach from City Centre    food, Daily Shopping, Sticky Consumer Habits
         on High GDP per capita Mid-Size Cities                                                                                                                       Customer Related Services

                                                                                2 Average Gla: about 25,000 sqm
                                                                          M                                                                   Easily reachable: about 4 k m from city center

                          Modern portfolio                                          Catchment area: about 370,000                             N. Of average parking places: 2,013
                          Average age 10 years                                      inhabitants within 2 0 minutes                            Centers reached by public transport: 24 (89%)
                          (from opening/restyling
                                                                                    Average footfalls per center/year: 3.3
                                                                                    million*                                                  Centers reached by cycle path: 16 (59%)

                            * Data at 31 December 2019
                                                                                                                                                                                                           6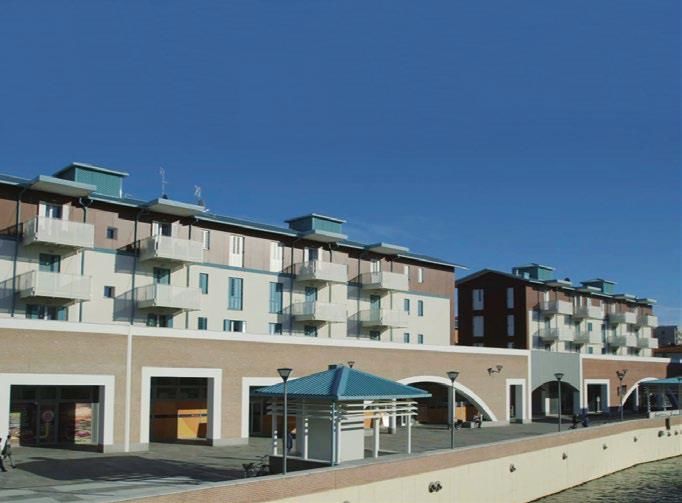
Group Structure (simplified)

                                                                  80.4% Revenues
                                              Parent Company      95% Financial debt
                                                                  86% Portfolio value

                                                                  13,7% Revenues
       100%                                                       5% Financial debt
                                    Italian Facility Management
                                                                  6% Portfolio value

                                                                  5,4% Revenues
                             100%                                 No Financial debt
                                                      Romania
                                                                  6% Portfolio value

                             100%
                                                                  0,5% Revenues
                                        Development project in    No Financial debt
                                                      Livorno
                                                                  1% Portfolio value

     Data as at 31/12/2020
                                                                                       7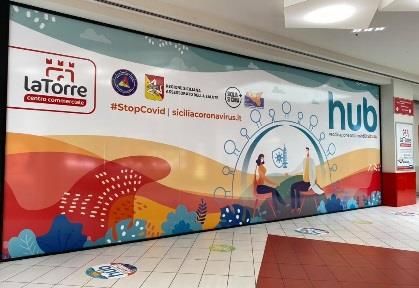
IGD’s shareholding structure

                    No. of shares                                        Share capital                                    Net equity
                     110,341,903                                          € 650 Mn                                         € 1.1 Bn

                                                                     Average 2020 market
              Listed on STAR Segment of                            capitalization: c. €424 Mn                    Average 2020 daily trading:
                Italian Stock Exchange                              Last mkt capitalization                        approx.261,262 shares
                                                                   (28 May ’21) c. €444 mn

                                                                                   Majority of institutional investors, of which ⁽1⁾
                       EUROPA PLUS (GWM)
                             4.50%
                                                                                                Italy
         Unicoop Tirreno
                                                                                    30%         Mediolanum, Banca d’Italia
             9.86%
                                                                                                UK & Ireland
                                                                                   1%           Legal & General Group,
                                                                                                Interactive Brokers

                                                                                                US & Canada
                                                            Free float
                                                                                   42%          Vanguard, Blackrock
                                                             44.72%
                                                                                                Luxembourg, Belgium, Netherlands

Coop Alleanza 3.0
                                                                                   2%           Banque et Caisse d’Epairgne,
                                                                                                Banque Degroof
    40.92%
                                                                                                France
                                                                                   5%           Societe Generale, BNP Paribas

                                                                                                Rest of the world
                                                                                   20%          Codan Forsikring, Japan TRSV

                1. Internal processing by IGD                                                                                                  8
                All figures as at 31 December 2020 unless otherwise determined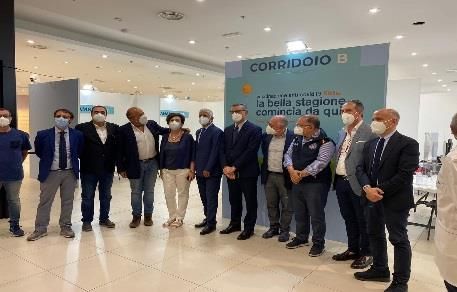
IGD Governance – Directors and Committees

IGD’s governance has been in line with the criteria of the Self Regulatory Code of Italian Stock Exchange since it was
listed. An internal Corporate Governance Code has been in use since 2008.

                                                                   CEO
 EXECUTIVE                                                         Claudio Albertini

                     CHAIRMAN                                                                                Timothy Guy
                     Rossella Saoncella       Antonio Rizzi                     Silvia Benzi                 Michele Santini
 NON EXECUTIVE
 INDEPENDENT
                    Rossella Schiavini                        Rosa Cipriotti                   Géry Robert-Ambroix

 NON EXECUTIVE             VICE CHAIRMAN
                           Stefano Dall’Ara                    Alessia Savino                       Edy Gambetti
 NON INDEPENDENT

 COMMITTEES:
                                                                                                    54.5% Male (6)
              Nominations and compensation Committee
                                                                                                    45.5% Female (5)
              Control and Risks Committee
              Committee for Related Parties Transactions                                             63.6% Independent (7)

 INTERNAL CONTROL AND RISK MANAGEMENT SYSTEM                                                        36.4% Non Independent (4)
 Held by the Ceo, including the Internal Audit and Risk Management

                                                                                                                                9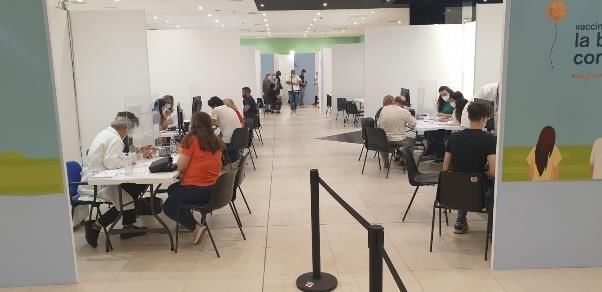
Our Top Management

Rossella Saoncella (1953) Chairman                                                     Claudio Albertini (1958) Chief Executive Officer
            •   Appointed as IGD’s Chairman on 20 April 2021                                       • Appointed in May 2009
            •   She was and executive of Conad Grouo until 1993                                    • IGD Board member since 2006
            •   She was General Manager of the Graranolo Group until 2011                          • Member of EPRA (1) Advisory Board since 2017
            •   Over the past few years she has held administrative offices                        • Member of ECSP’s (2) Nominations Committee since 2021
                for municipalities in Emilia Romagna and she has been a                            • More than 20 years of experience with Unipol Group, his last role
                Directors at HERA S.p.A.                                                             being General Manager of Unipol Merchant

Daniele Cabuli (1958) Chief Operating Officer                                          Roberto Zoia (1961) Director of Asset Management, development &
            • More than 20 years of experience in retail distribution                  network management
            • Joined IGD in 2008 as Network Management Director and has                            • Director of Asset Management and Development since 2006
              been COO since 2009                                                                  • Chairman of CNCC (3) since 2020
            • Worked for Coop Adriatica from 1986 with several roles: Head of                      • Joined GS Carrefour Italia Group in 1999 as Head of Hypermarket
              Projects in the Marketing Division (1989), Head of different                           and Shopping centres Development
              geographical areas and Hypermarket Manager (until 2003),                             • Head of Asset Management and Development for Carrefour Italia
              Director of Marketing and Commercial Development (from 2003)                           from 2005
                                                                                                   • Previously, Business Manager at Coopsette (from 1986)
Andrea Bonvicini (1963) Director of Finance Division
                                                                                       Carlo Barban (1978) Director of Administration, Legal & Corporate Affairs
              • Head of IGD Group's Finance Division since September 2009
              • In July 2012 he was appointed Director of Finance and                                • Director of Administration, Legal & Corporate Affairs since
                Treasury Department                                                                    January 2019
              • More than 20 years of professional experience in the world of                        • CEO of Winmarkt group in the period Apr 2014 – Dec 2018.
                credit, first in Cooperbanca and, after 1997, in the Bank of                           Worked in Winmarkt as Operating & Reporting Manager from
                Bologna                                                                                January 2009 with responsibilities also in administration,
                                                                                                       planning and control and finance
                                                                                                     • Previously worked as a qualified accountant and for international
Raffaele Nardi (1976) Director of Planning, Control and Investor
                                                                                                       consultancy companies
Relations
                                                                                                     • Graduated in Economics and Commerce
              • Head of the division to which 3 different departments report:
                planning, control and investor relations
              • Joined IGD in October 2010
              • Head of the Advisory Service of Unipol Merchant, bank of the
                Unipol Group, where he matured more than ten years of
                experience
              • Graduated in Business Economics

               1.
               2.
                     EPRA: European Public Real Estate Association
                     ECSP: European Counsel of Shopping Places
                                                                                                                                                                     10
               3.    CNCC: Consiglio Nazionale dei Centri Commerciali (National Council of Shopping Centers)
Titolo
titolo
2 Operating performances
note
37Operating performances in Italy
in 2019 and 2020
2019 Jan-20 Feb-20 Mar-20 Apr-20 May-20 Jun-20 Jul-20 Aug-20 Sep-20 Oct-20 Nov-20 Dec-20
Positive National Positive quick answer New restrictions*
start of the Lockdown when the restrictions
year were eased
IMPACTS ON IGD’S SC: IMPACTS ON IGD’S SC:
66 days of restrictions 21 days of restrictions
(weekends, holidays)**
IGD’S shopping centers always open
but with «non-essential» stores closed for 87 days throughout 2020
MALL TENANTS
SALES
+0.5%
FOOTFALLS
-2.0%
ON AVERAGE YEAR 2020 vs 2019:
HYPERMKT
SALES Mall tenants sales -27.6%
-2.2%
Hypermarket sales -2.8%
Footfalls -29.5%
*Closure of cinemas, gyms, bars and restaurants + Regions variable coloring system based on changes in infection rates
** The 21 days of closure of non-essential activities on weekends and on holidays weight for approx. 40% of November and December tenant sales. 12Quick response to Covid and limited
effects on leasing activities in 2020
Precautions and measures implemented to ensure Maintained a controlled risk profile
the safety of the shopping centre visitors
ITALIAN MALLS
FINANCIAL
CONTRACTS: OCCUPANCY*
Renewals 55 turnover 46
TEMPERATURE MONITORING
(downside -0.38%)
94.3%
SANITIZING GEL DISPENSERS ROMANIAN MALLS
OBSERVE SOCIAL AVAILABLE TO VISITORS
CONTRACTS: FINANCIAL
DISTANCING
OCCUPANCY
Renewals 290
(downside -0.47%) 93.6%
AIR RECICLYING
FROM OUTSIDE Covid-19 net direct impacts on 2020:
MASK REQUIRED approx. €18.5mn** (approx. 1.7 months
STAGGERED ENTRIES granted)
SANITATION
• No changes on existing contracts
OF COMMON
AREAS
• Deferred payments and temporary
reductions granted
13Good results when the restrictions
were eased in 2020
Evidence emerged after restrictions were eased*…
Fewer but more targeted visits… Approx. 87% of footfalls recovered
…with an increase in average
ticket …
€ 26.0, +17% (+€3.8)
…resulting in a slight increase in
Tenant sales +0.3%
overall purchases
Quick answer from visitors; shopping centers still attractive
despite limitations on organized events and leisure activities
*figures refer to the period of August, September and October 2020 for Italian malls
14What’s happened in 1Q 2021:
Covid restrictions still impact
January February March
Normal activity Normal activitiy lockdown
Ø
2020
economic
«non-essential» activities in IGD’s shopping malls impact
were closed about 25% of the possible days of operation on 1Q 2020
vs
Restrictions and variable Restrictions and variable Restrictions and variable
closures closures closures €5.4 mln
2021
one off Covid
non-essential» activities in IGD’s shopping malls impact
were closed about 48% of the possible days of operation on 1Q 2021
(with differences based on the location)*
*For more information see slides 32 – 33 in the attachments
15The main trends
in the first 4 months of 2021
2021 2020
January February March
1Q 2021 vs 1Q 2021 vs
Δ month/month 1Q 2020 1Q 2019
TENANT
SALES
-38.1% -16.9% +142.2% -14.4% -38.1%
FOOTFALLS -38.1% -27.1% +50.0% -19.5% -36.5%
The 2020 trend with fewer but more targeted visits continued in the 1Q
average ticket 1Q ‘21 equal to €27.4 (+21.6% vs 1Q ‘20; +28.9% vs 1Q ‘19)
Update on May 2021 trends: footfalls -21,1% vs 2019
tenant sales -6,4% vs 2019
average ticket €29,5 +32,0% vs 2019
16Scenario change thanks to
the reopenings
Progressive change
Week 17-23 Week 24-30 Week 31 May Week 7-13 Week 14-20 Week 21-27
May May - 6 June June June June
40,0%
32,0%
30,0% Change vs
2020
20,2%
20,0% +13,6 %
14,2%
10,0% 7,1% 7,8%
4,3%
0,0%
-10,0%
Change vs
-10,5% 2019
-11,7% -12,6%
-15,8% -15,4% -14,5% - 13,4%
-20,0%
Change 21vs20 Change 21vs19
17Leasing management
performance in 1Q2021
74%
MALLS of rental KEY MESSAGES
income
• No changes on the
ITALY
structure of existing
contracts
CONTRACTS: FINANCIAL
OCCUPANCY* • Occupancy is decreasing in
Renewals 50 Turnover 22 Italy (-90 bps) because of
93.6% the «knock-on effect» of
the restrictions in force
since November
ROMANIA
• Occupancy in Romania is
FINANCIAL already recovering (+80
CONTRACTS
OCCUPANCY bps)
Renewals 75 Turnover 58
94.4%
26% • Always open**
of rental
HYPERMARKETS income • NO changes on existing contracts
and on rents
*malls + hypermarkets
**non-food departments closed during the weekend
18Collection rate*
FY2020 and 1Q2021
2020 1Q 2021
Collected>95% Collected~75%
▪ Monthly invoicing
Italian ▪ Negotiations with
Portfolio tenants are in progress
to manage the second
lockdown in the same
way as in 2020
(especially temporary
Collected >95% Collected >88% reductions)
Romanian
Portfolio
*% on invoiced rents net of reductions and loss on receivables; figures updated at 3 of May 2021
19IGD’s shopping centers
adapting to this context (1/2)
Introduction of new brands, which despite the restrictions, recorded good
results:
Furniture solutions, opened at International brand, 4 stores
Ready to Centro ESP: opened* with excellent results; new
introduce new it became a true attractive anchor of openings in IGD portfolio are
#1 players and the center expected
satisfy new
trends
Footfalls and sales, which were lost due to weekend closures,
Partial recovery were in part transferred and recovered during the week
#2 of lost tenants’
sales >48% days of closure of non-essential activities vs
- 38% of overall revenues excluding food anchors
*Clothing, accessories, household goods; opened at Centro Borgo, La Favorita, Le Maioliche and Fonti del Corallo
20IGD’s shopping centers
adapting to this context (2/2)
Openings of new brands and formats continued,
despite being one of the sectors hit hardest by the restrictions
La Piadineria – Centro Lame (BO) Poke Kal - Centrosarca (MI)
Food and
Open air food and beverage services allowed from 26th April
#3
2. Dal 26 aprile: consentita
beverage
ristorazione all’aperto
services Immediate response with specific areas and structures
did not halt organized outside with excellent results
Centro ESP (RA) Le Maioliche (RA)
Le Porte di Napoli (NA)
21Effective leasing activities to combat
the negative impacts of Covid
24* among new openings and fully Innovative brand: MI Store
restyled shops
Next opening
@Tiburtino
(Roma)
Continuous intense leasing activities
to re-let the higher number of vacant
spaces caused by the impacts of Covid
Some of the new openings in Italy and Romania
Encouraging and positive signals
from the market:
Folletto BimbY – Fonti del
• Romania: occupancy is increasing Corallo Medair (uffici) - Slatina
• Italy: expected recovery in the 2Q/2H
Venus (arredamento) -
Intimissimi - Maremà (GR) Ploiesti
*As of 30 April 2021
22IGD assets
to serve the community
The shopping center, which offers large, organized, supervised, regularly sanitized
and easy to reach spaces, is the ideal location to quickly and safely create areas
to endure proximity healthcare
in Palermo is the first IGD shopping center to host a vaccination center
(inaugureted on 26th of May) a strong signal of IGD proximity to the
territory.
1,800 m2 of surface, operational from mid May, it will be able to guarantee approx. 900 vaccinations per day
23Our idea of shopping center
in the coming years
«Next Steps» projects: ideas for innovation
▪ The pandemic favored the acceleration of some transformations on-going in the retail world and, therefore, in the
Shopping Centers sector
• Two surveys* to better understand new visitors needs
«Next steps»
Targets
#1 Finding solutions #2 Integration of CRM #3 Personalization/
to answer to new and digital plan specificity
needs of the actions and
offering
*Carried out between the end of 2020 and February 2021: the first one over a sample of 5,000 students aged 12/19; the second 24
one over 8,100 between visitors and not in 13 IGD’s shopping centersFirst initiatives that are already
being implemented
SERVICES MERCHANDISING
LAYOUT
AND TENANT MIX
▪ External areas intended for ▪ Apps to book/order at the ▪ Clinics in line with the plan to
restaurants and leisure restaurants endure proximity healthcare
▪ Areas intended for pick-up and ▪ pet store and vet clinics
delivery
▪ Click and collect
IGD aims at strengthening attractiveness and the
urban and service character of its shopping centers
253 Portfolio and projects
IGD: a portfolio of high
quality assets

                                                          Centro Sarca
                                North                   Sesto S.Giovanni
                                                                                Esp           Le Maioliche        Centro Borgo       Centro Lame           Puntadiferro
                                                              (MI)            Ravenna         Faenza (RA)           Bologna           Bologna                 Forlì

        IGD - Main                                      Centro Leonardo         Conè          Centro Piave
                                                                                              San Donà di
                                                                                                                     Clodì            Centro Nova
                                                                                                                                     Villanova di
                                                                                                                                                           Mondovicino
                                                                                                                                                             Sc&Rp
                                                          Imola (BO)       Conegliano (TV)                       Chioggia (VE)
        Italian Asset                                                                         Piave (VE)                            Castenaso (BO)        Mondovì (CN)

                                        Nuova Darsena      Millennium        La Favorita       Gran Rondò         Lungo Savio       Centro Luna              I Bricchi
                                                            Gallery
                                           Ferrara       Rovereto (TN)        Mantova          Crema (CR)           Cesena           La Spezia          Isola d'Asti (AT)

                      Piazza Mazzini       Tiburtino       Maremà           Centro Porto     Cttà delle Stelle   FontiFonti
                                                                                                                      del Corallo      Casilino               Centro
                                                            Maremà                                                          del
Center                   Livorno        Guidonia (RM)      Grosseto
                                                                               Grande
                                                                                              Ascoli Piceno         Livorno
                                                                                                                       Corallo
                                                                                                                                       Caslino
                                                                                                                                       Roma
                                                                                                                                                            d'Abruzzo
                                                                                                                                                         Centro d’Abruzzo
                                                           Grosseto         Porto d'Ascoli                                             Roma                  Pescara
                                                                                                                                                             Pescara
                                                                                                                      Livorno

                                                                             >75% of the market value
                        Le Porte
                                          La Torre         Katané               of Italian Malls and             Future                        Offcine Storche
                                                                                                                                              Officine Storiche
South                   di Napoli                                                                                                                   Livorno
                     Afragola (NA)        Palermo          Catania           Hypermarkets dominant⁽1⁾            Opening                          Livorno
                                                                              in respective catchment
                                                                                        areas

                                                                                                                                                                   27
                1. Dominant assets: assets that are reference points for the consumers in their catchment area in terms
                of attractivity and offer quality
                   Key assets malls with> € 7 0 m n mkt value
The main characteristics of our portfolio
2,265.7 € mn
42% of this portfolio consists of 8 “Key” assets
of which 6 are Shopping centres (mall + hypermarket)
On average every shopping centre is 10 years old
Romania (last restyling/opening)
6% North western Italy
15%
Southern Italy
12%
Full ownership of 16 Shopping centres (mall+hyper) in Italy
(60.8% of Italy core market value)
Central Italy
25%
North eastern
Italy
42% 18 out of 25 Hyper/Super in Italy are small
(sales areaIGD’s portfolio market value
(1/2)
Gross Initial EPRA Net Initial EPRA Net Initial
FY 2019 * FY 2020 Δ%
Yield Yield Yield topped up
Malls Italy 1,574.54 1,473.30 (-6.43%) 6.53%
5.3% 5.4%
Hypermarkets Italy 564.58 558.97 (-0.99%) 6.02%
Romania 150.29 138.64 (-7.75%) 7.35% 6.0% 6.2%
Porta a Mare + development + other 91.99 94.78
Total IGD's portfolio 2,381.41 2,265.69 (-4.86%)
Leasehold properties (IFRS16) 54.80 43.32
Total IGD's portfolio including leashold 2,436.21 2,309.01 (-5.22%)
29
*Values at 31/12/2019 of Malls Italy and Hypermarkets Italy have been reclassified because of the Casilino realized in 2H 2020.IGD’s portfolio market value
(2/2)
ITALY ROMANIA
€ 2,381.4mn 7.5
7.5
Other 3.9%
(91.99 €mn)
Romania 6.3% -115.3
(150.29 €mn) -115.3 € 2,265.7mn
10.3 -6.5 0.5 -12.2
10.3
Other 4.2%
-6.5 0.5 -12.2 (94.78 €mn)
Romania 6.1%
(138.64 €mn)
FV change is due to DCF
2,381.4 assumptions (rates) for
Malls 66.1%
2,381.4
(1,574.54 €mn) approx. 29% and to change in
cash flows including COVID
2,265.7
Malls 65.0%
impacts for approx. 71* (1,473.30 €mn)
2,265.7
Asset
Hypervalue at
23.7% Projects and capex Change in market Projects and capex Change in market Projects and capex Change in market AssetHyper
value at
31/12/2019
(564.58 €mn) Italy value Italy Porta Medicea value Porta Medicea Romania value Romania 31/12/2020
24.7%
(558.97 €mn)
Asset value at Projects and capex Change in market Projects and capex Change in market Projects and capex Change in market AssetFY2020
value at
FY2019
31/12/2019 Italy value Italy Porta Medicea value Porta Medicea Romania value Romania 31/12/2020
*Estimate calculated excluding Casilino Shopping Center that was remodeled
30EPRA Metrics
€ per share FY 2020 FY 2019 Δ%
NRV and NAV 10.38 11.40 -8.9%
NTA 10.31 11.29 -8.7%
NDV 10.42 10.81 -3.6%
-0.23 0.54
-1.32
0.00
11.40
10.38
EPRA NRV/NAV 31 Resolved dividend FFO Change in asset fair Change in financial EPRA NRV/NAV 31
Dec 2019 value instruments fair Dec 2020
value and other
31Strong repositioning
of the Romanian Portfolio
1 5 9 13
2 6 10 14
1 7
2 Bistrita Piatra Neamt 8
Cluj-Napoca Vaslui
7 11
3 9
3
Turda Galati
14 Key Strategical points
4 10 1
13 12
Ramnicu Valcea 1
Buzau Braila Tulcea • Further capex
Ploiesti for safety, maintenance
5
4 8 12
and commercial
Slatina Bucuresti - Hq improvements
6 • Growth trend of rents
Alexandria
• Attention on operational
costs
• Focus on sustainability
2008 2009 2010 2011 2012 2013 2014 2015 2016 2017 2018 2019-2021
Acquisition
Surfaces recovery/Tenant Repositioning and complete external/internal refurbishement
Consolidation
New Plan
c.€22mn of investments (2008- c.€70.+5mn of dividends generated since
Self-financing of the 2020) for the upgrade and
No financial leverage
investments carried the acquisition⁽1⁾
repositioning of the portfolio
out
Romanian portfolio considerably repositioned, currently generating important free-cash flow
1. Until December 2020 32Flexible and sustainable
asset management
2020 2021/2022
✓ In order to strenghten the Group’s financial ✓ Priorities: non defferable activities,
solidity some projects and capex were extraordinary maintenance, update of
postponed as early March 2020. systems as well as fit out adaptations in order to
continuosly attract tenants and visitors.
✓ Lower cash-out for approx. €40mn ✓ Our asset type enables us to be flexible in
compared to what expected for the year offering spaces for different uses like flagships
for physical and/or online sales, logistics
hubs…
2020 Total Investments €18.3mn No major transformations/reconversions
are necessary, just few adjustmens in the
merchandising mix
33Pipeline
CENTRO CASILINO PORTO GRANDE LA FAVORITA
Project
Mall Restyling and Mall Restyling and
Hypermarket Hypermarket Mall Restyling
Remodelling Remodelling
Restyling of the external Reduction in the
façade and internal areas hypermarket area and Restyling of the
together with seismic creation of new retail façade, the internal
Description improvement measures areas and the car park
units in the mall; center
on the Ground Floor and restyling (project by
First Floor Lombardini 22)
End of work 1H 2022 End of 2022 End of 2022
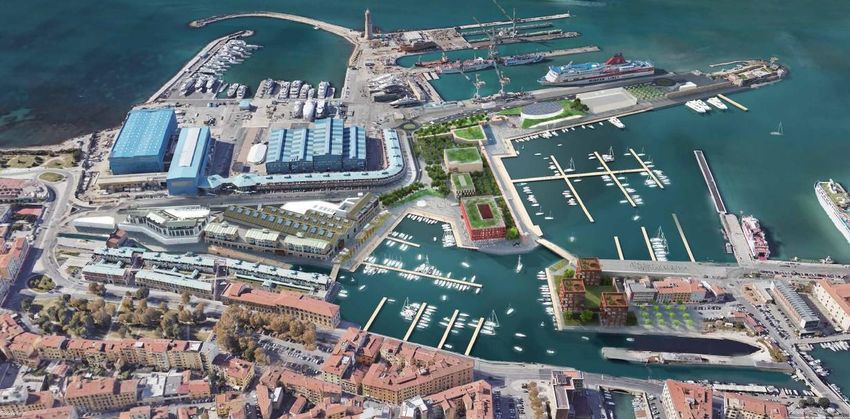
34Porta a Mare: an ambitious
multifunctional project Lips Molo Mediceo Arsenale
Livorno, touristic Port
(Hotel, residential, entertainment and
Officine Storiche
services for the port)
(retail, food court, residential)
Focus next slide
Piazza Mazzini
Palazzo Orlando
(retail, residential)
Retail owned by IGD and
already operational since 2016; (Offices)
residential fully sold Sold on 30/09/2019
35Porta a Mare:
Officine Storiche
The heart of the project
End of work:1H2022
Total expected investment retail area : € 53 mn
(of which remaining € 11mn*)
Total surfaces: 20k sqm, of which 15k sqm
dedicated to retail
Stores: 30 + 10 restaurants + 1 fitness center
*Data at 31/03/2021
36Residential areas
Piazza Mazzini Officine storiche
73 flats already sold 42 seafront flats
(flats with garden, flats with terrace, (11 preliminary purchase agreements signed + 3
duplex terraced houses) being finalized at 25/05/2021 )
374 Sustainability
IGD sustainability steps
   2011      IGD’s first Sustainability Report (on 2010 data)

 2012-2014   Process for greater internal awareness

   2013      Sustainability issues incorporated in the Plan

 2014-2015   Materiality analysis and new approach to the report

   2016      Sustainability Report approved for the first time by the Board of
             Directors

   2017      First external assurance and new materiality matrix

   2018      New sustainability targets and introduction of a methodology to
             assess the impacts of 3 projects

   2019      Risk analysis integrated in the sustainability strategy and definition
             of medium-term targets
             Formal participation in the Global Compact, Ethical Code update,
   2020
             IGD’s assignation of the Chair of CNCC’S ESG Commission

                                                                                      39
2012-2014: Process for greater internal
awareness
Once decided the Sustainability Report and the structure, IGD defines a process aimed at increasing internal
involvement of:
MANAGEMENT EMPLOYEES
2012 2013/2014
Definition of the contents of the Together with Impronta Etica,
first Sustainability Plan through the training activity involving all
coaching project employees on ESG issues, with a
specific focus on the Shopping
Center of the future
This process played a role in determining the contents of the first Sustainability Plan.
402013: Sustainability issues incorporated in the Plan
GOAL
One step forward: sustainability issues are incorporated in the Plan
SUSTAINABILITY PATH AND ACTORS INVOLVED
Under the guidance of the Sustainability Commettee, the Board of Directors and internal
teamworks together with managerial directors start working on the sustainability strategy
INTEGRATION
Sustainability issues are integrated within 2014-2016 Business Plan
3 general targets identified:
• Improve quality and efficiency of Shopping Centers
• Need to adapt to a constantly changing external environment
• Strengthen the “Spaces to be lived in” concept
412014-2015: Materiality analysis and new
approach to the report
Complying with the principles contained in the international standards
Materiality: goal (GRI-G4 ed EPRA), IGD carrries out a materiality analysis to assess
which issues may affect both the Company and its stakeholder.
15 material issues are identified through a documentary analysis and
IGD’s process
the stakeholders’ engagement
The contents and the structure of the Sustainability Report change with
respect to the previous years in order to comply with EPRA’s
The result
recommendations and to ensure a meaningful comparison of the
environmental results among peers.
422016: Board of
Directors’ involvement
The Board of Directors is the promoter of the Company’s commitment to CSR. It annually
assesses social-environmental performance and it approves the Sustainability Report.
Besides demonstrating full directors’ commitment, this approval enables to compare
formally and substantially the Sustainability report to the Annual report.
432017: First external assurance and
new materiality matrix
For the first time, the data and the information included in the Sustainability
Assurance Report are subject to Limited Assurance in accordance with the procedures
set out in ISAE 3000.
Subject to assurance: compliance with GRI Standards*, the most important
standard on sustainability reporting on an international level.
After an assessment of the materiality , 13 material issues are identified
New material
issues (an issue is material when it is relevant for both the Company itself and its
shareholders). IGD’s sustainability strategy is encapsulated in «Becoming
Great».
The sustainability report reports on the actions carried out by IGD in order to
SDGs contribute to the achievement of 10 of the 17 Sustainable Development Goals
(SDGs**) defined by the United Nations.
*GRI: Global Reportig Initiative
44
**SDGs: Sustainable Development GoalsSocial Responsibility strategy
3 ELEMENTS OF THE SUSTAINABILITY STRATEGY
Material
issues
Sustainability Sustainability
risks analysis targets
45 45Material issues
The 12 material issues represent the cornerstones upon which
sustainability planning and strategy is based
GREEN RESPONSIBLE ETHICAL ATTRACTIVE TOGETHER
1. Climate Change 3. Good 6. Governance, 7. Sustainable 11. Stakeholder
2. Accessibility employment ethics and enhancement engagement
and mobility 4. Gender corruption of portfolio 12. Local
equality 8. Retail offer communities
5. Wellbeing, 9. Spaces to be
health and lived in
safety 10. innovation
46 46Sustainability risks
IGD identifies the sustainability risks associated to each material issue, the necessary
policies and actions and defines the KPIs to monitor the level of presidium. An example can
be found below:
47 47Sustainability targets
At the begininning of 2020 IGD reviewed its sustainability targets by adding some medium-long term
targets to those already included in the 2019-2021 Strategic Plan. Some of the 25 targets can be found
below:
ZERO CO2 EMISSIONS: ITALIAN PORTFOLIO NEARLY ZERO ENERGY BUILDING BY 2030
OBTAIN BREEAM CERTIFICATION FOR 80% OF THE ITALIAN PORTFOLIO BY 2030
INSTALLATION OF LED LIGHTING SYSTEMS IN THE ENTIRE ITALIAN PORTFOLIO BY 2022
CORPORATE WELFARE: INCREASE IN SERVICES
DEFINITION OF INDIVIDUAL TARGETS RELATED TO CSR
ISO37001:2016: OBTAIN CERTIFICATION IN ITALY IN 2020
RESTYLING ACTIVITIES WITH IMPROVEMENT ON ENVIRONMENTAL IMPACT TO BE CARRIED OUT IN 10 SHOPPING
CENTERS BY 2030
SHOPPING CENTER IN THE ROLE OF CIVIC CENTER: COOPERATION WITH THE LOCAL AREA FOSTERING INVOLVEMENT
AND PARTICIPATORY PLANNING ACTIVITIES
48 48Covid impact on the strategy and performance
IGD decided to confirm its sustainability strategy, albeit with the need for partial
adjustments to be carried out in the 3 elements upon which it is founded (material
issues, risks and targets).
Material issues CSR risks Targets
Confirmed the 12 topics «Pandemic risks» linked to «Good Several targets were suspended or
identified, with a deeper focus employment», «wellbeing and postponed until 2021, in particular
on «health» in addition to the safety», «Sustainable following IGD’s decision to go
existing topic «wellbeing and enhancement of portfolio» and ahead in 2020 only with
safety» «innovation» have been added. undeferrable investments.
Due to the restrictions imposed by the Authorities, which affected Shopping Centers’ operations, it is
sometimes difficult to make a comparison between the sustainability indicators reported for 2020
and those of previous years.
49Task Force on Climate-related Financial Disclosures
• In 2017 Task Force on Climate-Related Financial Disclosures (TCFD), created by
What is it? the Financial Stability Board published its recommendations aimed at encouraging
companies in communicating information about governance, strategy, risks and
targets related to climate change
• The TCFD recommedations are widely acknowledged as an important guide to
Why is it
reporting financially relevant information climate-related; adherence to these
important?
recommendations is also encouraged by the European Commission
• The recommendations are more and more used by IGD comparables at international
level
How do we
implement • IGD refers to the recommendations of the TCFD in its 2019 and 2020 Sustainability
them? Reports
50 50Participation in the UN Global Compact
In 2020 IGD decided to adhere to the Global Compact, the
world’s most important initiative on the sustainability of
organisations, promoted by the United Nations.
51 51IGD sustainability in the national and
international context
PARTICIPATION IN NATIONAL AND INTERNATIONAL ORGANISATIONS AND EVENTS ON SUSTAINBILITY
Universities lectures
and testimonies
Member of the EPRA Member of the Chairman of the ESG Member of Impronta IGD is called to spoke
Sustanability committee Sustainability Group Commission Etica since 2010. about its CSR path at
since 2018. Impronta Etica (non- university classes and
profit organisation Masters
that aims to promote
and develop the CSR)
INTERNATIONAL AWARDS AND BENCHMARK
Stock Indices Sustainability rating (ESG) Awards (2021)
6 independent and unsolicited ratings in 2020 • Sustainability Leader
(4 in 2019) 2021 (Sole 24 Ore)*
• Gaia Rating
• Refinitiv • 3° at the Confindustria
• MSCI contest «Best Performer
for circular economy»
• ISS ESG
5 stock indices with with the Waste2Value
focus on sustainability • S&P Global
project
• Vigeo Eiris
Growing (or in line) scores
*analysed the Corporate Social Responsabilty (CSR) of more than 400 companies in Italy. To that end, more than 30 KPIs regarding environment,
social and economic have been examined. 150 companies have been awarded. 52Some of the results achieved
Level of satisfaction of
IGD shopping centers’ visitors
3.9
(scale 1min. - 5max.)
Co2 Emissions intensity 2020-2012
(KgCo2/Mq)
-36.1% The structured engagement of all
stakeholders allows IGD to
understand their expectations and
evaluate if integrate them in its
strategy
2020 Turnover rate
ISS QuickScore evaluation on
2.3% governance risk (1 lowest risk-10 highest risk)
1 (2021)
5354 54
GREEN

                                                        8   Photovoltaic systems installed in 7 Shopping Centers

The Shopping Centres can have an impact on the
environment due to:                                    19   Shopping Centres equipped with LED lighting systems

    1. the large amount of energy they consume
    2. the road traffic they can create              100%   Electricity from renewable sources in all Shopping
                                                            Centres
IGD is committed to operate in such a way as to
reduce   these    impacts,    both    during   the          Decrease in the IGD Italian portfolio energy intensity
                                                     -13%
construction/restyling phase of the Centres and in          (kwh/mq) 2020-2019

the management of the structures themselves.
                                                            Shopping Centres with ISO14001 certification,
                                                       24   corresponding to 95% of the company portfolio
IGD has defined several actions and commitments
aimed at sustainable mobility.                              Shopping Centres with Breeam/Breeam In Use
                                                        8
                                                            certification

                                                       34   EV charging stations installed

                                                                                                              55
56
RESPONSIBLE

                                                          96%    % permanent contracts(2020)
IGD undertakes to behave in a responsible manner
towards people.
With its employees it is committed to fostering          99,3%   % employees trained during the year (2020)

“good    employment”,     where    continuous   skills
development and the promotion of these are two of                % employees that have benefited from the Corporate
its main undertakings.                                    98%    Welfare System (2020)
Particular attention is placed on the health and
wellbeing both of its employees and of all those that
visit its Shopping Centres on a daily basis.               1,3   Milions(€) invested to prevent the spread of Covid-19
                                                                 (2020)

                                                                                                                57
58
ETHICAL

                                                                       % of least represented gender in the Board of
                                                             36%       Directors
•    IGD adopted a governance system aligned with
     the best practices of listed companies.
•    The    Company      undertakes    to      operate   7   on   11   Independent Directors

     ethically and to ensure that all the necessary
     safeguard measures are in place, in order to
     guarantee compliance with the law both with                  3    Stars obtained in the Legality Rating

     regard to its own conduct and by positively
     influencing the context in which it operates.                     UNI EN ISO 37001 anti-bribery management systems
                                                                       certification obtained in Italy and Romania

                                                             339       Sustainability Protocol signed in Romania (2012-2020)

                                                                                                                       59
60
ATTRACTIVE

IGD’s commitment to ensure its Shopping Centres
                                                        13.1%     Social-environmental events - % out of total
are, and remain, attractive, involves:                            (2019)

• A continuous enhancement of the areas, both
                                                            3.8   Total € spent annually by IGD Shopping Centres
   from an architectonic point of view and from that
                                                        million   on the organisation of free events
   of the merchandising offer;
• Ensure that the IGD structures are out and out
   “Spaces to be lived in”, for the visitors’ leisure       13    Malls in which digital ledwalls have been installed

   time, by offering shopping opportunities as well
   as being places in which to meet up with others;               Visits have been carried out for the prevention of
• Constantly working on the innovation of its
                                                        8,015
                                                                  skin cancer or thyroid check-ups, in cooperation
   spaces and the services offered.                               with ANT (2012-2019)

                                                            18    New tenants opened in IGD Shopping Centres
                                                                  (2020)

                                                                                                              61
62
TOGETHER

IGD enters into contact with a variety of
stakeholders, both at institutional level and at
                                                                The local events on the total of those organised in
a more local one.                                      1 in 3   IGD Centres (2019)
•   It has established a continuous dialogue
    with these in order to understand their               1.6   Sponsorships to local associations (2012-2020)
    needs and expectations as well as to              million
    determine their level of satisfaction;
                                                                Associations which IGD Centres entered into contact
•   At   local   level,   the   Shopping     Centre     367     with (2019). In 2020 they were 140.
    becomes      a    producer     of   economic
    development and a place in which to get
    together.

                                                                                                                 63
UNI ISO37001 Anti-Bribery
certification obtained
20 April 2020
UNI ISO 37001:2016 Certification
«Anti Bribery Management System»
The certification represents the international standard for anti-corruption management system.
The result achieved is consistent with the values expressed in the MOG*, the Social Responsibility strategy,
the Group’s Code of Ethics and Conduct and the «zero tolerance» approach to non-compliant behavior.
*Organizational, Management and Control Model, ex Legislative Decree 231/2001
645 FY2020 and 1Q2021
Financial ResultsFY 2020 and 1Q2021
main results
2020 vs 2019 1Q 2021 vs 1Q 2020
REVENUES
Rental Income €145.6 mn -6.2% €36.7 mn -4,4%
Net Rental Income €109.5mn -19.8% €26.2 -20.7%
EBITDA
EBITDA (Core Business ) €99.4 mn -20.6% €23,8mn -21.6%
EBITDA Margin (Core Business) 65.4% -121pts 61.8% -140pts
EBITDA Margin From Freehold 65.3% 62.0%
GROUP NET PROFIT €-74.3 mn n.a. €10.3 mn -31.1%
Core Business Funds From Operations (FFO) €59.3 mn -28.8% €13.8 mn -33.3%
Core Business FFO per share * 0.54 0.13
Results impacted by the exceptional containment measures adopted in Italy to limit the spread of
Covid-19
66
1. Calculated on the year-end no. of shareNet Rental Income
(€mn)
Italy
-€8.6mn -19.9% -€27.1mn
-6.3% Romania -19.8%
-19.3%
-5.3 -3.3
-18.5 *
136.6
FY2020 128.0
109.5
Net rental income 2019 Change in rental income Change in rental costs Net rental income 2020 adj COVID net direct impacts Net rental income 2020
Italy
-1.4€mn -20.9%
-6.8€mn
-4.2% Romania
-20.7%
-17.5%
**
1Q2021
*Covid-19 net direct impacts include Covid temporary reductions already granted for €4.4mn and Covid effects included in direct costs for €14.1mn.
67
**Covid-19 net direct impacts include Covid temporary reductions already granted for €0.2mn and Covid effects included in direct costs for €5.2mn.
Some figures may not add up due to rounding.Financial management
(€mn) 5.4 3.8
5.4 3.8 2.8
3.8 2.8
2.8 Total Total
€ 36.8mn € 36.2mn
-4.7%
Negative carry
31.0 5.4 29.6 3.8
€400mn bond issue + SACE
31.0 29.6 2.8
29.6 IFRS16 and
Totale Totale
9,0€mn
non-recurring charges
8,8€mn
FY2020 Totale
8,8€mn
31.0 29.6
0.7FY 2019 FY0.6
2020 Finacial Mgt. Adj:
FY 2019 0.6FY 2020 -€1.4mn vs 2019 (-4.7%)
FY 2020
Financial management Adj. IFRS16 and non-recurring charges Negative Carry
management Adj. IFRS16 and non-recurring charges Negative Carry
FY 2019 FY 2020
ecurring charges Negative Carry
Total
Totale
Financial management Adj. IFRS16 and non-recurring charges Total
Totale Negative Carry
8.4 € 9.0mn
9,0€mn
8.2 -1.5% € 8.8mn
8,8€mn
8.2 0.7 IFRS16 and
0.6
non-recurring charges
1Q2021 8.4 8.2
Recurring Financial Mgt:
1Q 2020 1Q 2021 -0.2€ mn vs 2020 (-1.5%)
1Q 2021
Recurring financial management IFRS16 and non-recurring charges
cial management IFRS16 and non-recurring charges
1Q 2020 1Q 2021
Some figures may not add up due to rounding
Recurring financial management IFRS16 and non-recurring charges 68Funds From Operations
(FFO)
-€5.5mn -€24.0mn
-6.6% -28.8%
-7.3 0.2 FFO p.s.
1.4
-18.5 0.54€
83.3
77.8
FY2020 59.3
FFO_2019 Change in core Change in financial Change in taxes and FFO_2020 adj COVID net direct FFO_2020
business Ebitda adj*
1 management adj other impacts
-1.5€mn -6.9€mn
-7.1% -33.3%
FFO p.s.
0.13€
1Q2021
Some figures may not add up due to rounding.
1 Change in core business Ebitda Ad (fy20)j: equal to change in core business Ebitda adjusted by approx. €0.7mn of non recurring expenses.
*Change in core business Ebitda
PerAdj
recurring marketing expensens
(1Q21):dell’FFO
il calcolo equal to change core business
sono state Ebitdaleadjusted
considerate by passive
locazioni approx. 0.9mn estimated
e rettificato lowerdella
il dato leasing rents and
gestione +0.2 €mn of 2020 non-
finanziaria 69
**Financial management adj (1Q21): net of IFRS16, IFRS9, non-recurring charges net of negative carryFinancial structure as at 1Q2021
31/12/2020 31/03/2021
LTV 49.9% 49.5% • Net debt improved in the
(adj. IFRS16 c. 47.8%) (adj. IFRS16 c. 47.6%) first quarter
(-10€mn vs YE2020)
ICR 3.2X 2.9X
• LTV is slightly decreasing
Average cost of 2.30% 2.32%
debt
NET DEBT
Debt breakdown* €1,145.4 mn**
MARKET SECURED
54.6% 26.0%
BANKING
SYSTEM L.T.
45.4% 1,192.24
UNSECURED
74.0%
CASH
-46.86
*Debt calculated excluding the IFRS16 effect
**Net debt including IFRS16 effect (if excluded €1,101.8mn) 70Debt maturity as at 1Q2021
€100mn: 2.25% 7y
€400mn: 2.125% 5y
Ratings
2.1%
5y*
Repayed on
2.65%
7y
209
500 BBB- negative outlook
1 March
154
71 9
2 9
67 7
52 53 46
25 27 6
2021 2022 2023 2024 2025 2026 >2026
BB+ negative outlook
secured bank debt unsecured bank debt Bonds Already repayed
Taking into account the cash-on-hands at 31/03/2021
equal to €46mn and the committed and uncomitted credit
lines, the Group has already enough resources to cover the
financial maturities of 2021 and first months of 2022
*rate and duration refers to €200mn loan
71On-going process on disposals to
rebalance the financial structure
✓ Consistent with 2019-2021 Strategic Plan, the procedure for the disposal of
a portfolio of stand-alone hypermarkets/supermarkets was started
✓ Mandate granted to CBRE, a premiere international advisor
Asset class with a Attractive Stable cash-flow
good appeal on Net Initial yield with long-term
the market leases
The proceeds from the transaction will be used to reduce the
Loan-To-Value and strenghten the financial structure
726 Dividend and Outlook
Dividend

                  2020                                     Next few years
✓ Loss of the Parent company IGD SIIQ SPA        ✓ As soos as external conditions allow, IGD
✓ Safeguard of the financial stability and the     intends to resume paying dividends and
  investment grade profile                         providing its shareholders with attractive
                                                   remuneration

           NO DIVIDEND                                   IGD share remains
           DISTRIBUTION                                  a «dividend play»

           Decision triggered by
         exceptional circumstances

                                                                                          74
Outlook
The first few months of 2021 were undoubtely difficult for shopping center operations
due to the restrictions put in place, and it is therefore plausible that the Company will again be
impacted directly and indirectly by the pandemic
NEW OUTLOOK
Basic assumptions
• Effective implementation of the FFO
FY2021
vaccination plan
• Strengthening of the economic
recovery starting from 2° half 2021 +3/4%
vs FY2020
(without further significant
Not taking into account the
restrictions) disposal impact
75Titolo
titolo
7 Appendix
note
65Consolidated Income
Statement 1Q2021
GROUP CONSOLIDATED (a) (c) Δ
1Q_CONS_2020 1Q_CONS_2021 (c)/(a)
Revenues from freehold rental activities 35.3 33.6 -5.0%
Revenues from leasehold rental activities 3.1 3.1 1.9%
Total income from rental activities 38.4 36.7 -4.4%
Rents and payable leases 0.0 0.0 -9.8%
Direct costs from rental activities -5.4 -10.5 95.6%
Net rental income 33.0 26.2 -20.7%
Revenues from services 1.6 1.7 7.3%
Direct costs from services -1.4 -1.4 -2.4%
Net services income 0.2 0.4 67.4%
HQ Personnel expenses -1.7 -1.7 3.7%
G&A Expenses -1.2 -1.1 -14.7%
CORE BUSINESS EBITDA (Operating income) 30.3 23.8 -21.6%
Core business Ebitda Margin 75.8% 61.8%
Revenues from trading 0.0 0.0 n.a.
Cost of sale and other costs from trading -0.1 -0.2 22.9%
Operating result from trading -0.1 -0.1 -0.4%
EBITDA 30.2 23.6 -21.7%
Ebitda Margin 75.5% 61.4%
Impairment and Fair Value adjustments -5.9 -4.1 -29.4%
Depreciation and provisions -0.3 -0.3 3.4%
EBIT 24.1 19.2 -20.1%
0.0
FINANCIAL MANAGEMENT -9.0 -8.8 -2.4%
ENTRAORDINARY MANAGEMENT 0.0 0.0 n.a.
PRE-TAX RESULT 15.1 10.4 -30.8%
Taxes -0.1 -0.1 18.4%
NET RESULT OF THE PERIOD 14.9 10.3 -31.1%
(Profit/Loss) for the period related to third parties 0.0 0.0 n.a.
GROUP NET RESULT 14.9 10.3 -31.1%
Some figures may not add up due to rounding
77Reclassified Balance
Sheet 1Q2021
Sources - Uses of funds (€/000) 31/03/2021 31/12/2020 Δ Δ%
Fixed assets 2,231,246 2,234,484 3,238 0.1%
Assets under construction 44,182 42,674 -1,508 -3.4%
Other non-current assets 17,956 17,374 -582 -3.2%
Other non-current liabilities -30,646 -30,371 275 -0.9%
NWC 32,434 30,421 -2,013 -6.2%
Net deferred tax (assets)/liabilities -10,645 -10,286 359 -3.4%
TOTAL USE OF FUNDS 2,284,526 2,284,296 -230 0.0%
Net equity 1,126,320 1,114,442 -11,878 -1.1%
Net (assets)/liabilities for derivative instruments 12,827 14,396 1,569 12.2%
Net debt 1,145,379 1,155,458 10,079 0.9%
TOTAL SOURCES 2,284,526 2,284,296 -230 0.0%
GEARING RATIO (€000)
1.03 1.01
1,125,417 1,135,656
1,155,458 1,145,379
2020 2021
Net debt Adj. Net equity
78Funds From Operations
(FFO) 1Q2021
Funds from Operations CONS_2020 CONS_2021 Δ 2020 Δ%
*
Core business Ebitda 30.3 23.8 -6.6 -21.6%
IFRS16 Adjustments (Payables leases) -2.6 -1.7 0.8 0.3%
Financial management adj -6.8 -7.9 -1.0 15.2%
Extraordinary management adj 0.0 0.0 0.0 n.a.
Gross margin from trading 0.0 0.0 0.0 n.a.
Current taxes for the period -0.3 -0.3 0.0 -1.6%
FFO 20.6 13.8 -6.8 -32.8%
Una tantum Marketing 0.2 0.0 -0.2 n.a.
FFO 20.8 13.8 -6.9 -33.3%
* Considera nelle locazioni passive la riduzione di una mensilità (in linea con le stime interne di riduzione delle locazioni derivanti 79
dagli impatti COVID)More financial highlights 1Q2021
31/12/2020 31/03/2021
Gearing ratio
1.03X 1.01X
Average lenght of long-term debt 3.2 years 3.2 years
Hedging on long-term debt + bond 93.0% 92.7%
Share of M/L term 98.3% 98.6%
Uncommitted credit lines
granted 151€ mn* 151€ mn*
Uncommitted credit lines
available 151€ mn 151€ mn
Committed credit lines granted
60 € mn 60 € mn
and available
Unencumbered assets 1,434.9€ mn 1,434.9€ mn
* Some banks allowed us to transform them in medium/long-term not granted credit lines.
80Other Epra metrics FY2020
EPRA Performance Measure 31/12/2020 31/12/2019
EPRA NRV/NAV (€'000) 1,145,827 1,258,008
EPRA NRV/NAV per share € 10.38 € 11.40
EPRA NTA 1,137,258 1,245,473
EPRA NTA per share € 10.31 € 11.29
EPRA NDV 1,149,534 1,192,894
EPRA NDV per share € 10.42 € 10.81
EPRA Net Initial Yield (NIY) 5.8% 5.9%
EPRA 'topped-up' NIY 5.9% 6.0%
EPRA Vacancy Rate Malls Italy 7.6% 4.5%
EPRA Vacancy Rate Hypermarkets Italy 0.0% 0.0%
EPRA Vacancy Rate Total Italy 5.7% 3.2%
EPRA Vacancy Rate Romania 6.5% 2.4%
EPRA Performance Measure 31/12/2020 31/12/2019
EPRA Cost Ratios (including direct vacancy costs) 17.9% 18.5%
EPRA Cost Ratios (excluding direct vacancy costs) 15.3% 16.1%
EPRA Earnings (€'000) € 62,941 € 87,335
EPRA Earnings per share € 0.57 € 0.79
81Italian Portfolio:
hypermarkets and shopping malls
27 shopping malls 25 hypermarkets Tenants of hypermarkets
Centro D'Abruzzo - Pescara Centro D'Abruzzo - Pescara Coop Alleanza 3.0
Clodì - Chioggia Clodì - Chioggia Coop Alleanza 3.0
Porto Grande - Porto d'Ascoli (AP) Porto Grande - Porto d'Ascoli (AP) Coop Alleanza 3.0
ESP - Ravenna ESP - Ravenna Coop Alleanza 3.0
Centro Borgo - Bologna Centro Borgo - Bologna Coop Alleanza 3.0
Conè Retail Park - Conegliano (TV) Conè Retail Park - Conegliano (TV) Coop Alleanza 3.0
Le Maoliche - Faenza Le Maoliche - Faenza Coop Alleanza 3.0
Full ownership
Lungo Savio - Cesena Lungo Savio - Cesena Coop Alleanza 3.0
16 shopping centres Città delle Stelle - Ascoli Piceno Città delle Stelle - Ascoli Piceno Coop Alleanza 3.0
(mall + hypermarket) Katanè - Catania Katanè - Catania Coop Alleanza 3.0
Centro Lame - Bologna Centro Lame - Bologna Coop Alleanza 3.0
Centro Leonardo - Imola (BO) Centro Leonardo - Imola (BO) Coop Alleanza 3.0
La Torre - Palermo La Torre - Palermo Coop Alleanza 3.0
Casilino - Roma Casilino - Roma Uncoop Tirreno
Le Porte d Napoli - Afragola(NA) Le Porte d Napoli - Afragola(NA) Distribuzione Centro Sud Srl (ipercoop)
Tiburtino - Guidonia (RM) Tiburtino - Guidonia (RM) Distribuzione Centro Sud Srl (ipercoop)
Millennium Gallery - Rovereto (TN)
Puntadiferro - Forlì (FC)
Centroluna - Sarzana (SP)
La Favorita - Mantova
Maremà - Grosseto
11 shopping malls Centro Sarca - Sesto S. Giovanni (MI) Hypermkts not owned by IGD
Mondovicino Retail Park - Mondovì (CN)
Gran Rondò (Crema)
Piazza Mazzini (Livorno)
I Bricchi - Isola d'Asti (AT)
Darsena City - Ferrara
Supermkt Civita Castellana (Viterbo) Unicoop Tirreno
Supermkt Cecina (Livorno) Unicoop Tirreno
Hypermkt Le Fonti del Corallo - Livorno Unicoop Tirreno
Hypermkt Schio-Schio (Vicenza) Hypermkt Coop Alleanza 3.0
9 hypermarkes Malls not owned by IGD LUGO - Lugo (RA) Coop Alleanza 3.0
Hypermkt IL MAESTRALE - Senigallia (AN) Coop Alleanza 3.0
Hypermkt MIRALFIORE - Pesaro Coop Alleanza 3.0
Supermkt AQUILEJA - Ravenna Arca SpA (Famila)
Hypermkt I MALATESTA - Rimini Coop Alleanza 3.0
82Contracts and key tenants
Italy 1Q2021
Malls
Product Rents
TOP 10 Tenant Contracts
category impacts N 171 N 187 N 204 N 840
clothing 3.1% 14 64.8%
10.6% 10.4% 14.2%
clothing 2.6% 9
2021 2022 2023 >2023
electronics 2.1% 8
Average residual maturity: 3.9 years
personal care 1.8% 17 Total contracts: 1,402 of which 57 renewals with the same tenant
and 27 signed with a new tenant
clothing 1.7% 23
Rotation Rate 1.9% (% new tenats on tot. contracts)
clothing 1.7% 28
Hypermarkets
clothing 1.6% 10 N1 N 24
jewellery 1.5% 26 94.2%
shoes 1.4% 5
5.8%
jewellery 1.3% 19
2021 2022 2023 >2023
Average residual maturity: 13.5 years
Total 18.8% 159
Total contracts: 25
83Contracts and key tenants
Romania 1Q2021
Product Rents
TOP 10 Tenant Contracts
category impacts Winmarkt
supermarkets 11.3% 11
N 216 N 197 N 49 N 78
clothing 5.7% 10
36.0%
clothing 4.6% 11
28.0%
25.0%
clothing 3.6% 6
drugstore 2.8% 5 11.0%
jewellery 2.3% 4
personal care 2.1% 5
2021 2022 2023 >2023
office 1.9% 1 Average residual maturity: 4.0 years
restaurants 1.3% 1 Total contracts: 540 of which 75 renewals with the same tenant
and 58 signed with a new tenant
entertainment 1.2% 1
Rotation Rate 10.7% (% new tenants on tot contracts)
Total 36.8% 55
84Merchandising &
Tenants Mix 1Q2021
Italy Romania
Household Culture, leisure and Household goods
Restaurants Supermarkets
goods gift items 5%
7% 11%
Culture, leisure 9% 3%
and gift items Electronics Personal care
12%
Electronics
7% 4% 2%
Personal care Services
5% 9%
Services
Merchandising Restaurants
7%
Mix* 7%
Entertainment Other
4%
Clothing
5% 42%
Clothing
Entertainment
51%
13%
Local brands International
13% brands
Local brands 37%
International 43%
brands
40% Tenant
Mix*
National
National brands
brands
20%
47%
*Internal processing on total rents
85The main shareholders:
«Coop world»
7 Legal entities throughout Italy
«Coop world» key data(1):
17 Regions covered by Coop Turnover ~ EUR 14.7 bil € (12.9 % of italian large scale retail) 2
No. of stores: ~1,200
Employees ~52,000
Members ~ 6.7 Mn people
Coop Alleanza 3.0 (3) Unicoop Tirreno (4)
Revenues ~4.4bn € ~890mn €
N° of stores ~378 ~100
Employees s ~21,900 3,410
Members ~2.3 mn ~607,000
Deposits from
members
~3.2bn € ~602mn €
Strategic investments in listed companies:
UNIPOL GRUPPO
FINANZIARIO IGD SIIQ SPA
(Insurance and banking)
1. Data at 31/12/2018
2. Source: Nielsen, survey GNLC 2020 86
3. Data at 31/12/2020; sources:: Coop Alleanza 3.0
4. Data at 31/12/2019; sources; Unicoop Tirreno financial reportsRaffaele Nardi Director of Planning, Control and investor relations raffaele.nardi@gruppoigd.it Claudia Contarini, Investor Relator T. +39 051 509213 claudia.contarini@gruppoigd.it Elisa Zanicheli, IR Team T. +39. 051 509242 elisa.zanicheli@gruppoigd.it Federica Pivetti, IR Team T. +39. 051 509260 federica.pivetti@gruppoigd.it Follow us on
You can also read