MILAN INVESTOR FORUM 29 SEPTEMBER 2016 - HETAL PATEL, GENERAL MANAGER INVESTOR RELATIONS VALÉRIE MELLA, INVESTOR RELATIONS SPECIALIST - ARCELORMITTAL

Page created by Greg Farmer
 
CONTINUE READING
MILAN INVESTOR FORUM 29 SEPTEMBER 2016 - HETAL PATEL, GENERAL MANAGER INVESTOR RELATIONS VALÉRIE MELLA, INVESTOR RELATIONS SPECIALIST - ARCELORMITTAL
Milan Investor Forum
                                           29 September 2016

                       Hetal Patel, General Manager Investor Relations
                            Valérie Mella, Investor Relations Specialist
MILAN INVESTOR FORUM 29 SEPTEMBER 2016 - HETAL PATEL, GENERAL MANAGER INVESTOR RELATIONS VALÉRIE MELLA, INVESTOR RELATIONS SPECIALIST - ARCELORMITTAL
Disclaimer
Forward-Looking Statements
This document may contain forward-looking information and statements about ArcelorMittal and its subsidiaries. These
statements include financial projections and estimates and their underlying assumptions, statements regarding plans,
objectives and expectations with respect to future operations, products and services, and statements regarding future
performance. Forward-looking statements may be identified by the words “believe,” “expect,” “anticipate,” “target” or similar
expressions. Although ArcelorMittal’s management believes that the expectations reflected in such forward-looking
statements are reasonable, investors and holders of ArcelorMittal’s securities are cautioned that forward-looking information
and statements are subject to numerous risks and uncertainties, many of which are difficult to predict and generally beyond
the control of ArcelorMittal, that could cause actual results and developments to differ materially and adversely from those
expressed in, or implied or projected by, the forward-looking information and statements. These risks and uncertainties
include those discussed or identified in the documents filed with or furnished to the Luxembourg Stock Market Authority for
the Financial Markets (Commission de Surveillance du Secteur Financier) and the U.S. Securities and Exchange
Commission (the “SEC”). ArcelorMittal undertakes no obligation to publicly update its forward-looking statements, whether
as a result of new information, future events, or otherwise.

Non-GAAP Measures
This document may include supplemental financial measures that are or may be non-GAAP financial measures, as defined
in the rules of the SEC. They may exclude or include amounts that are included or excluded, as applicable, in the
calculation of the most directly comparable financial measures calculated in accordance with IFRS. Accordingly, they should
be considered in conjunction with ArcelorMittal's consolidated financial statements prepared in accordance with IFRS, which
are available in the documents filed or furnished by ArcelorMittal with the SEC, including its annual report on Form 20-F and
its interim financial report furnished on Form 6-K. A reconciliation of non-GAAP measures to IFRS is available on the
ArcelorMittal website.

                                                                                                                                1
MILAN INVESTOR FORUM 29 SEPTEMBER 2016 - HETAL PATEL, GENERAL MANAGER INVESTOR RELATIONS VALÉRIE MELLA, INVESTOR RELATIONS SPECIALIST - ARCELORMITTAL
World’s Leading Steel and Mining Company

 Focussed on developed markets

 Cost competitive

 Primary position in premium steel grades

 Capacity to capitalize on continued demand recovery

 Strengthened balance sheet

 Roadmap to improve annual free cash flow by >$2 billion

    World’s leading global steel company positioned to deliver value to shareholders
                                                                                       2
MILAN INVESTOR FORUM 29 SEPTEMBER 2016 - HETAL PATEL, GENERAL MANAGER INVESTOR RELATIONS VALÉRIE MELLA, INVESTOR RELATIONS SPECIALIST - ARCELORMITTAL
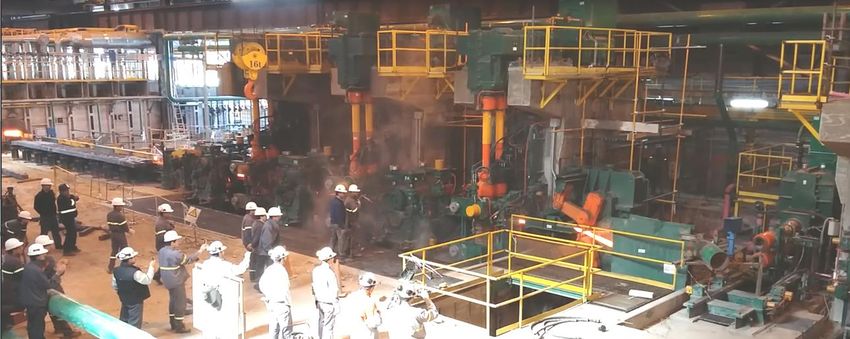
Safe, Sustainable Steel
Health & Safety Lost time injury frequency (LTIF) rate*
Mining & steel, employees and contractors

                                                                                           -75%
           3.1

                            2.5

                                            1.9
                                                            1.8

                                                                             1.4

                                                                                             1.0
                                                                                                             0.85            0.85      0.81   0.78

          2007            2008            2009             2010            2011            2012             2013            2014       2015   1H’16

                                           Our goal is to be the safest Metals & Mining company
* LTIF = Lost time injury frequency defined as Lost Time Injuries per 1.000.000 worked hours; based on own personnel and contractors                  3
MILAN INVESTOR FORUM 29 SEPTEMBER 2016 - HETAL PATEL, GENERAL MANAGER INVESTOR RELATIONS VALÉRIE MELLA, INVESTOR RELATIONS SPECIALIST - ARCELORMITTAL
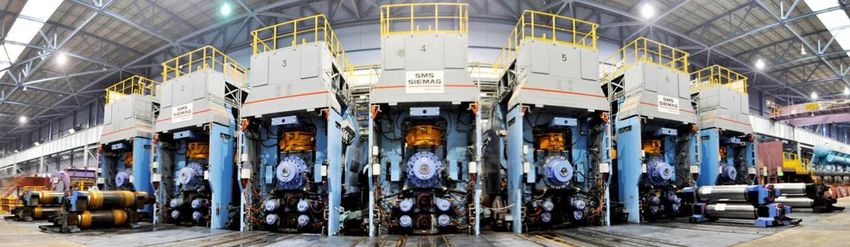
Global scale, regional leadership
                                                                       ACIS
• ArcelorMittal is worlds leading steel and                   Mining
                                                                        9%          NAFTA
                                                                                     26%
  mining company, with presence in 60                          5%
  countries and an industrial footprint in 19
  countries
                                                                          2015
• ArcelorMittal is the leader in all major global                       Revenues
  steel markets, including automotive,                      Europe
                                                                         $63.6bn
  construction, household appliances and                     47%                      Brazil
  packaging                                                                           13%

• Leading R&D and technology, as well as
  sizeable captive supplies of raw materials and                       ACIS        NAFTA
  distribution networks                                       Mining    6%          17%
                                                               9%
• Balanced portfolio of cost-competitive assets
  in both developed and developing markets                                2015
  (No1: EU; North America; Africa, LatAm, CIS)                           EBITDA
                                                                         $5.3bn
• ~209,400 employees serving customers in                   Europe                     Brazil
  over 170 countries                                         45%                       23%

                               Global scale delivering synergies
                                                                                                4
MILAN INVESTOR FORUM 29 SEPTEMBER 2016 - HETAL PATEL, GENERAL MANAGER INVESTOR RELATIONS VALÉRIE MELLA, INVESTOR RELATIONS SPECIALIST - ARCELORMITTAL
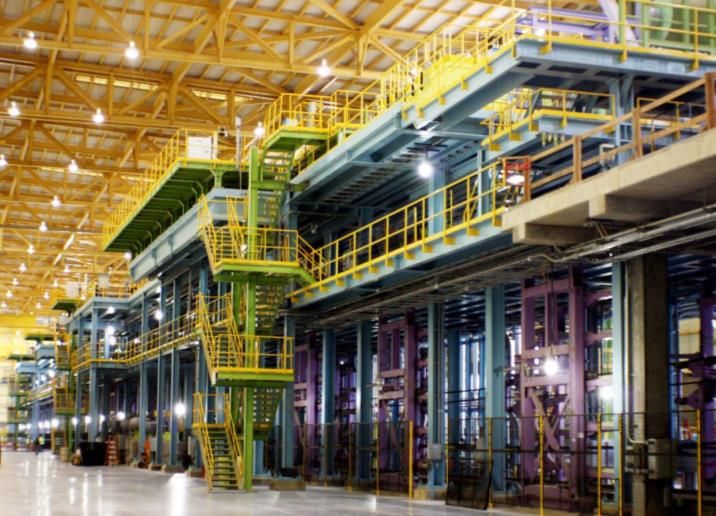
Positioned for industry-leading returns
and value
• A global champion well positioned for new market opportunities and servicing
  globalising customer industries

   Leading market
     position in
   developed world

                                    Diversified
                                     Leading supplier to                      Higher and
   Access to high
   growth markets
                                    premium markets
                                                                              more stable
                                     Leading supplier to high-                  returns
                                    growth markets
                                                                              through the
   Ability to service                Significant self-
   global customers                                                              cycle
                                    sufficiency in raw
                                     materials

  Access to own raw
      materials

      ArcelorMittal: the industry leader with a global presence backed by raw materials
                                                                                            5
MILAN INVESTOR FORUM 29 SEPTEMBER 2016 - HETAL PATEL, GENERAL MANAGER INVESTOR RELATIONS VALÉRIE MELLA, INVESTOR RELATIONS SPECIALIST - ARCELORMITTAL
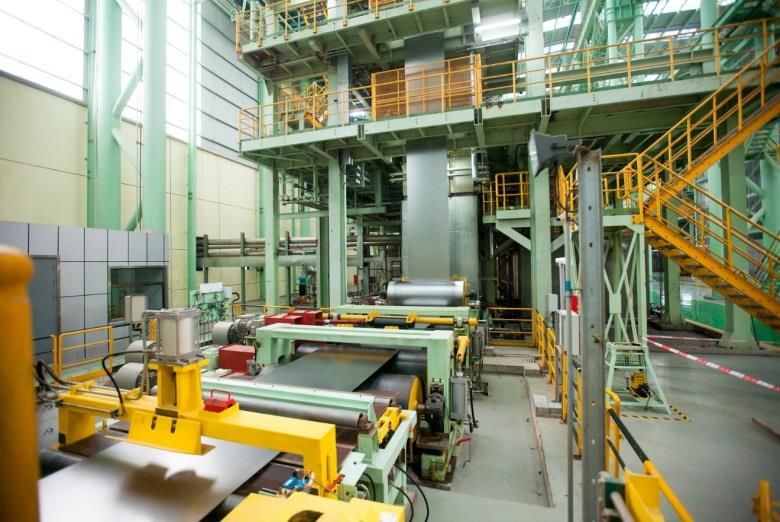
Demand in core markets is growing
   Steel shipment split by segment 1H’16                                                                End market growth prospects in US (2007=100)
                                                                                                         120
                   Brazil                  ACIS
                                                          75% of shipment to                             100
                          12%        15%                  developed markets                                80
                                                                                                           60
                                                                                                           40
                                             25% NAFTA

                                                                                                                                                 2011

                                                                                                                                                        2012

                                                                                                                                                                                                            2019
                                                                                                                 2007

                                                                                                                         2008

                                                                                                                                 2009

                                                                                                                                         2010

                                                                                                                                                               2013

                                                                                                                                                                       2014

                                                                                                                                                                              2015

                                                                                                                                                                                     2016

                                                                                                                                                                                            2017

                                                                                                                                                                                                    2018

                                                                                                                                                                                                                    2020
                    49%
       Europe
                                                                                                                   Construction*                               Machinery**                         Auto***

   ArcelorMittal steel shipments (Mt)                                                                   End market growth prospects in EU28 (2007=100)

                                                                                                          110
                                                                      90
                                                                                                          100

                                                                                                            90
                                        85        85
         83                                                                                                 80
                   82        83
                                                                                                            70

                                                                                                                                                 2011
                                                                                                                  2007
                                                                                                                          2008

                                                                                                                                  2009
                                                                                                                                          2010

                                                                                                                                                        2012

                                                                                                                                                                2013
                                                                                                                                                                       2014

                                                                                                                                                                              2015
                                                                                                                                                                                     2016

                                                                                                                                                                                            2017
                                                                                                                                                                                                   2018

                                                                                                                                                                                                           2019
                                                                                                                                                                                                                   2020
        2011 2012 2013 2014 2015                                  ACTION
                                                                   2020

                              Demand recovery in core markets has been offset by high imports…
* Weighted by steel demand, i.e. larger weight given to non-residential; ** Industrial output of machinery and equipment (Source: Oxford Economics Sept 2016)                                                              6
*** Light vehicle assembly (Source: LMC Automotive (March 2016))
MILAN INVESTOR FORUM 29 SEPTEMBER 2016 - HETAL PATEL, GENERAL MANAGER INVESTOR RELATIONS VALÉRIE MELLA, INVESTOR RELATIONS SPECIALIST - ARCELORMITTAL
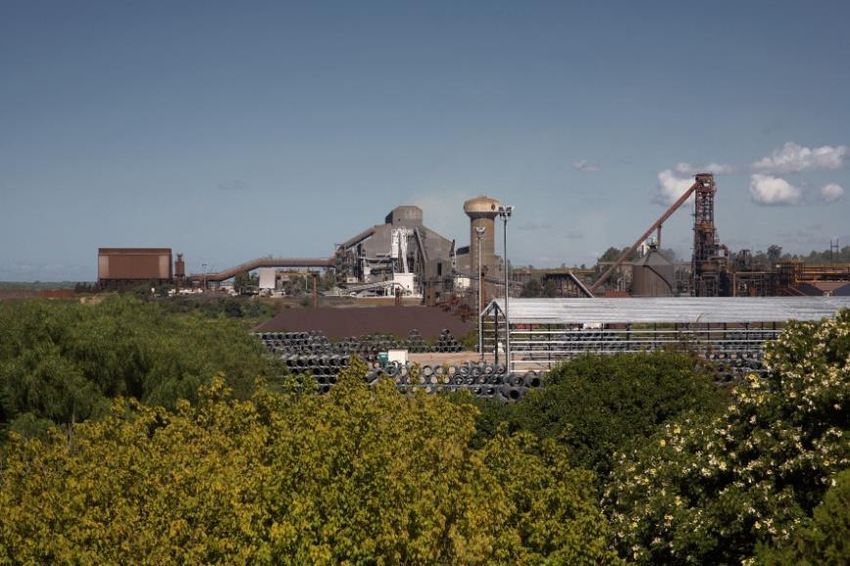
IBDROOT\PROJECTS\IBD-LN\FRACTION2015\585460_1\6. Presentations\2016.02.08 - Roadshow Presentation\ProjectRose_investorpresentation_V7 160204 speakernotes.pptx

Positive industry signals
                                                                                                                                      China steel spreads
• Supply side reforms in China                                                                                                        ($/t differential between China HRC domestic price ex VAT and
                                                                                                                                      international RM Basket*)
  – Government targets to reduce capacity by                                                                                                              159 146                              171   160
                                                                                                                                              132                 125                    124                Note: China
    100-150Mt; 2016 target is set as 45Mt                                                                                                                                      87   93                      spreads based
                                                                                                                                                                                                            on spot raw
    capacity (~25mt achieved YTD)  ~180,000                                                                                                                                                                materials are
                                                                                                                                                                                                            lower

    people impacted and deployed                                                                                                             2013 2014 1Q15 2Q15 3Q15 4Q15 1Q16 2Q16                 Wk38
  – Central SOE must cut at least 10% of
                                                                                                                                      Europe steel spreads
    capacity for steel & coal by 2018                                                                                                 (€/t differential between North Europe domestic HRC price and
                                                                                                                                      international RM Basket*)
  – Structural reform fund to be allocated                                                                                                       208 220 217 212 186 186
                                                                                                                                                                         252                          280
    according to the capacity cut volume and                                                                                                 178

    timing.
• Steel price recovery                                                                                                                      2013 2014 1Q15 2Q15 3Q’15 4Q15 1Q16 2Q16                 Wk38

     – Stabilization of price environment brought                                                                                     US steel price
       an end to destocking cycle                                                                                                     ($/t US domestic exw Indiana HRC)

     – Steel spreads recovered in all key markets                                                                                             669 729
                                                                                                                                                                       578 505 505         639        606
       from unsustainable low levels of 2H’15                                                                                                                                      430 456

• Pressure from rising raw material costs
                                                                                                                                            2013 2014 1Q15 2Q15 3Q’15 4Q15 1Q16 2Q16                 Wk38

                               Steel spreads have recovered from unsustainably low levels of 2H 2015
Source: Mysteel, CU Steel, Broker Research, Factiva. . * RM basket includes coking coal prices based on quarterly contracts; week 38 start Sept 12, 2016                                                              7
MILAN INVESTOR FORUM 29 SEPTEMBER 2016 - HETAL PATEL, GENERAL MANAGER INVESTOR RELATIONS VALÉRIE MELLA, INVESTOR RELATIONS SPECIALIST - ARCELORMITTAL
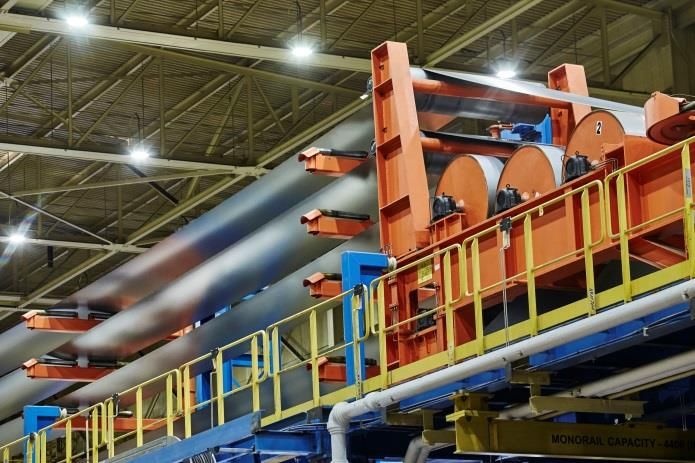
Trade case progress in core markets
    Summary Europe and US Antidumping/CVD trade case timelines*

           Activity                                                         2015                                                    2016                       2017

E          CRC
U                                                    Investigation                                   Provisional                      Definitive
R
O          HRC**
                                                                                                         Investigation                           Provisional      Definitive
P
E          QP
                                                                                                         Investigation                           Provisional      Definitive

           Corrosion resistant
                                                                         Petition                Preliminary                           Final
U
S          CRC
A                                                                              Petition              Preliminary                         Final

           HRC
                                                                                          Petition            Preliminary                         Final

                                                                                                                                                Sept 2016
      APPROVED

                                                                      …trade cases have positive momentum
* Dates provided for illustrative purposes. **Additional AD investigation against Iran, Serbia, Ukraine, Russia & Brazil started July 7, 2016
See appendix for further details.
                                                                                                                                                                               8
MILAN INVESTOR FORUM 29 SEPTEMBER 2016 - HETAL PATEL, GENERAL MANAGER INVESTOR RELATIONS VALÉRIE MELLA, INVESTOR RELATIONS SPECIALIST - ARCELORMITTAL
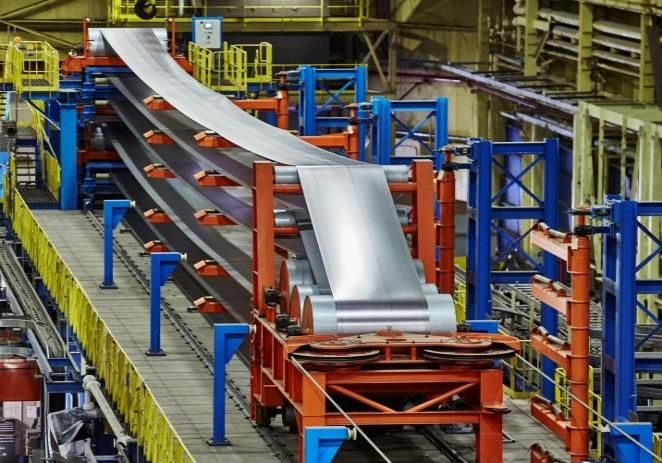
Profitability recovering
                                                                                                                         Consensus* forecasting a 20% increase in
 Comparable EBITDA ($m)                                                                                                  comparable EBITDA in 2015

                                  +32%
1,800                                                                      4,000                      +47%                  7,000               +20%
1,600                                                                      3,500                                            6,000
1,400                                                                      3,000
                                                                                                                            5,000
1,200
                                                                           2,500
1,000                                                                                                                       4,000
                                                                           2,000
  800                                                                                                                       3,000
                                                                           1,500
  600
                                                                                                                            2,000
  400                                                                      1,000

  200                                                                         500                                           1,000

      0                                                                           0                                             0
                  2Q 2015                    2Q 2016                                       2H 2015   1H 2016   2H 2016                  FY’15        FY’16 cons*
                                                                                                                cons*

                       Profitability improving believe 2H’15 marked the low-point of EBITDA cycle
* ArcelorMittal estimate of consensus on 23/09/16 for 2016 EBITDA (based on mean of 14 estimates)                                                                   9
Balance sheet strengthened
                                                                                            Net debt ($billion)
 • Rights issue and asset disposal                                                                                    ~$20bn reduction
   proceeds used to repay/prepay
                                                                                                                     32.5
   selected near term debt maturities
 • Gross debt declined from $20.2bn                                                                                                  12.7
   as at 1Q’16 to $15.1bn at 2Q’16
 • Average debt maturity increased to                                                                                3Q’08           2Q’16
   7.1 years
                                                                                            Debt maturity at 30, June 2016* ($billion)
 • Moody’s upgrade to stable outlook
                                                                                                                                                    7.3
   from negative outlook                                                                                      Prepaid or repaid debt during 2Q’16
                                                                                                              Outstanding end 2Q’16
                                                   4.9
                 Cash                              0.7
   Asset sale proceeds                             1.1                                                                  2.7   2.6                   7.0
                                                                                                               2.3                    2.5    2.5

Rights issue proceeds                              3.1                                                                                        2.2
                                                                                                                              2.0     2.1
                                                                                                               1.0      0.8

                                                 2Q’16                                                        2016     2017   2018   2019    2020 >2020

                                          Action taken to materially strengthen the balance sheet
* €/$ exchange rate of 1.1102 (as end of June 30, 2016); Maturity table excludes recent $1.5bn tender offer                                               10
Significantly reduced cash requirements

  Capex cut by $2.3bn since 2012
  US$mn
     4.7
             3.5     3.7
                             2.7     2.4

    2012    2013    2014    2015    2016F

                                                      Improved ability to translate
                                                         EBITDA to cash flow
  Net interest reduced by $0.8bn since 2012
  US$mn

     1.9     1.8
                     1.5
                             1.3     1.1

    2012    2013    2014    2015    2016F

    Actions taken to reduce cash requirements enabled net debt reduction in 2015
                                                                                      11
Action 2020 improvement plan

    Experience
                                      Return to >$85 EBITDA per tonne

                                      $3bn structural EBITDA improvement
      Unique
                                      Support annual FCF >$2bn

  Business driven

         Roadmap to sustainably improve EBITDA and FCF generation
                                                                           12
No1 in automotive steel: Maintaining
leadership position
                                                          S-In-Motion SUV/Mid-Size Sedans
• ArcelorMittal is the global leader in steel for
  automotive 40% market share in our core markets
• Global R&D platform sustains a material
  competitive advantage
• Proven record of developing new products and
  affordable solutions to meet OEM targets
• Advanced high strength steels used to make
                                                          AM/NS Calvert
  vehicles lighter, safer and stronger
• Automotive business backed with capital with
  ongoing investments in product capability and
  expanding our geographic footprint:
    • AM/NS Calvert JV: Break-through for NAFTA
      automotive franchise
    • VAMA JV in China: Auto certifications progressing
    • Dofasco: Galvanizing line expansion underway

                 Continue to invest and innovate to maintain competitiveness
                                                                                            13
Strategic progress in 2016
•       Balance sheet materially strengthened                                                                Automotive business development
         Rights issue complete: $3.1 billion raised                                                         •     Calvert ramp up progressing :
         Net debt at end of 2Q’16 of $12.7bn                                                                       Automotive certification ongoing and
                                                                                                                     increased utilization
•       Improved conversion of EBITDA to FCF
                                                                                                                    Phase 1: Slab yard expansion complete
         EBITDA “free cash flow breakeven”* point
          reduced to $4.5bn                                                                                  •     Automotive awards:
                                                                                                                    General Motors awarded ArcelorMittal its
•       Focus on capex discipline
                                                                                                                     “Supplier of the Year award” for the 3rd
•       Cost control and operational excellence                                                                      consecutive year

         Action 2020 plan underway                                                                                 Ford gave ArcelorMittal its highest ranking
                                                                                                                     for the 5th consecutive year
         Footprint optimization Indiana Harbour (US)
         Europe transformation plan progressing                                                             •     ArcelorMittal and Voestalpine announce
                                                                                                                   global market launch of galvanized, press
•       Portfolio optimization ongoing                                                                             hardened steels for direct hot forming
         Sale of US long products Vinton and LaPlace
                                                                                                             •     Launch of 2 new project in 2017: Usibor 2000
         Closure / idling of non-performing assets                                                                and Ductibor 1000

                                                    Strategic priorities on track and progressing well
    * Free cash flow breakeven defined as level of EBITDA required to ensure cash flow from operations is =/ > capex
                                                                                                                                                                   14
Takeaways
• ArcelorMittal is the global steel industry leader
• Core markets expanding; steel spreads have recovered from
  unsustainably low levels experienced in 2H’15
• Lower cash requirements will support improved conversion of EBITDA
  to free cash
• Balance sheet now amongst the strongest in the industry, reinforcing
  ArcelorMittal’s leadership position
• Continuous investment in R&D and production capability to sustain
  leadership position in automotive steel
• Action 2020 plan to deliver sustainable improvements and drive
  outperformance

 Taking the right actions to leverage leadership positions to maximise shareholder returns
                                                                                             15
Appendix
Key trade case update: EU & US                                                                              Note: Timelines provided are defined based on regulation maximum limits

Europe Flat, Long and Tubes                                                                     US Flat Rolled
Prod         Exporter          Status                      Timeline                             Prod   Exporter             Status                                                    Timeline
CRC          AD                • Definitive measures       • Measures in place for the next 5   Core    AD/CVD               • DOC final determination (June 24, 2016- ITC            Measures in
             China               and retroactive             years                                      China                  voted unanimously on the measures )                    place for the
             Russia              implementation were                                                    India                  ─ CVD: China: 39.05 – 241.07%, India: 8% -             next 5 years
                                 voted in favour on                                                     Italy                      29.46%; Italy: 0.07 – 38.15%; Korea: 0.72-
                                 July 7:                                                                Korea                      1.19%; Taiwan – de minimus (no duty
                                                                                                        Taiwan                     imposed)
                                 ─ China: 19.8% to
                                     22.1%                                                                                     ─ AD: China 209.97%; India 3.05-4.44%; Italy
                                 ─ Russia: 18.7% to                                                                                12.63-92.12%; Korea 8.75-47.8.5%; Taiwan:
                                     36.1%                                                                                         3.77%

HRC          AD                • AD China Investigation    • AD China Provisional measures      CRC     AD/CVD               • DOC final determinations:                              Measures in
             China               started Feb 13, 2016        could be expected not later than           Brazil                 ─ CVD: Brazil: 11.09%-11.31%; China:                   place for the
                                                             4Q’16                                      China                      256.44%; India: 10%; Korea: 3.91%-58.36%           next 5 years
                                                                                                        India                  ─ AD: Brazil:14.35%-35.43%; China: 265.79%;
                               • CVD China                 • AD China definitive measures
             CVD                                                                                        Korea                      India: 7.6%; Japan: 71.35%; Korea: 6.32%-
                                 investigation started       could be expected no later than
             China               May 13, 2016                2Q’17                                                                 34.33%; UK: 5.4%-25.56%
                                                                                                        AD only              • ITC voted affirmative on China and Japan (June
             AD                                                                                                                22), and on Brazil, India, Korea, UK (Sept 2)
             Iran, Serbia,     • AD (5 Cs) Investigation                                                Japan
                                 started July 7, 2016                                                   UK                   • ITC voted negative on Russia AD and CVD (Sept
             Ukraine, Russia
                                                                                                                               2) - no orders will be issued
             & Brazil

QP           AD                • Investigation initiated   • Provisional measures could be      HRC     AD/CVD               • DOC final determination:                               Measures in
             China               Feb 13, 2016                expected not later than 4Q’16              Korea                  ─ CVD: Brazil: 11.09%-11.30%; Korea: 3.89%-            place for the
                                                           • Definitive measures could be               Brazil                     57.04%                                             next 5 years
                                                             expected not later than 2Q’17                                     ─ AD: Australia: 29.37%, Brazil: 33.14%-
                                                                                                        AD only
                                                                                                        Australia,                 34.28%, Japan: 4.99%-7.51%, Korea: 3.89%-
                                                                                                        Japan,                     9.49%, Netherlands: 3.73%, Turkey: 3.66%-
             AD                • Definitive measures       • Publication of the EU Commission           Netherland,                7.15%, UK: 33.06%
Rebar (HF)   China               implementation were         expected by Aug 2016                       Turkey , UK          • ITC voted affirmative on all AD and Korea and
                                 voted in favour on the    • Measures in place for the next 5                                  Brazil CVD; the ITC voted negative on Turkey
                                 July 7, 2016 – From         years                                                             CVD (Sept 12)
                                 18.4% to 22.5%
                                                                                                QP      AD/ CVD              • Petition filed March 7, 2016                           DOC AD
             AD                • Investigation initiated   • AD provisional measures expected           China, Korea         • ITC preliminary vote: affirmative, present material    preliminary
             Belarus             March 31, 2016              no later than beginning of 1Q’17                                  injury, on May 20, 2016 for all countries; imports     determination
Rebar (LF)                                                 • Definitive measures expected no            AD                     subsidized by the Brazilian government were            s for Brazil,
                                                             later than 2Q’17                           Austria,               found to be negligible so the CVD investigation        Turkey and S.
                                                                                                        Belgium,               was terminated                                         Africa Sept
                                                                                                        France,              • DOC preliminary determination (7 Sept.’16):            2016; all
             AD                • Investigation confirmed   • Provisional measures could be              Germany,               CVD China 210.5%, Korea 0.62% (de minimus)             other
Seamless     China               on 13 February              expected not later than mid Q4             Italy, Japan,                                                                 countries Nov
Tubes                                                                                                                        • Prelim. AD for Brazil, Turkey and S. Africa            2016
                                                             2016                                       South Africa,          expected 16 September ‘16. Prelim decisions in
(Large                                                                                                  Turkey, and
diameter)                                                  • Definitive measures expected not                                  remaining AD cases extended until early
                                                             later than 2Q 2017                         Taiwan                 November.
                                                                                                                                                                                                 17
Balance sheet structurally improved
Net debt* ($ billions)                                                                                        Average debt maturity (Years)

                      32.5                                                                                                                                          7.1

                                                    12.7                                                                                  2.6

                   3Q 2008                      2Q 2016                                                                              3Q 2008                    2Q 2016

Liquidity** ($ billions)                                                                                      Bank debt as component of total debt (%)

                         12.0                                                                                                           75%

                                                    8.4

                                                                                                                                                                    4%

                     3Q 2008                    2Q 2016                                                                              3Q 2008                    2Q 2016

                                                                Balance sheet fundamentals improved
 * Net debt refers to long-term debt, plus short term debt, less cash and cash equivalents, restricted cash and short-term investments (including those held as part of asset/liabilities held for sale);   18
** liquidity is defined cash and cash equivalents plus available credit lines including back-up lines for commercial paper program
Net debt
Net Debt ($ billion) & Net Debt/LTM reported EBITDA* Ratio (x)

          35                                                                                                                                                                           4.0
                                                                                                                                        Net Debt ($ billion) - LHS
                                                                                                                                         Net Debt / LTM EBITDA
          30

                                                                                                                                                                                       3.0
          25
                                                                                                                                                                                 2.5

          20
                                                                                                                                                                                       2.0
          15

          10
                                                                                                                                                                                       1.0

            5

            0                                                                                                                                                                          0.0
                 1Q 11
                 2Q 11
                 3Q 11
                 4Q 11
                 1Q 07
                 2Q 07
                 3Q 07
                 4Q 07
                 1Q 08
                 2Q 08
                 3Q 08
                 4Q 08
                 1Q 09
                 2Q 09
                 3Q 09
                 4Q 09
                 1Q 10
                 2Q 10
                 3Q 10
                 4Q 10

                 1Q 12
                 2Q 12
                 3Q 12

                 1Q 13
                 2Q 13
                 3Q 13
                 4Q 13

                 2Q 14
                 3Q 14
                 4Q 14
                 1Q 15
                 2Q 15
                 3Q 15
                 4Q 15
                 1Q16
                 2Q16
                 4Q 12

                 1Q 14
                                             Net debt decreased to lowest level since the merger
* Based on last twelve months (LTM) reported EBITA. Figures prior to 2012 have not been recast on quarterly basis for adoption of accounting standards implemented from 1.1.13         19
Strategy

           20
ArcelorMittal’s strategy
Our strategy is to leverage our distinctive attributes that enable us to achieve a leading
position in the most attractive components of the steel value chain

In steel, capture a leading position        In operations, achieve best-          In mining, grow a world-class
in attractive businesses by                 in-class competitiveness by           business utilizing our financial
leveraging our technical                    leveraging our technical              strength and diverse portfolio of
capabilities and global scale and           capabilities and diverse portfolio    assets and businesses
scope                                       of assets and businesses              • Invest to expand output at Tier I and
• Be the supplier of choice for             • Be the safest                         Tier II assets
  customers who value distinctive           • Concentrate production              • Optimize the value proposition
  products and services                       at the best assets and run them       associated with our products’ value
• Grow in markets with attractive             well                                  in use
  structures                                • Be cost competitive by              • Be the supplier of choice for a
• Minimize costs in commodity                 benchmarking, sharing best            balanced mix of internal and external
  businesses to lower risks and               practices, and investing to           customers
  capture boom-market potential               optimize our multi-site footprint   • Provide a natural hedge against
                                            • Innovate (product/process)            market volatility and potential
                                                                                    oligopolies

 Enablers
              A clear                  A strong            An effective           Active                    The
              licence to               balance             organisational         portfolio                 best
              operate                  sheet               structure              management                talent

                                                                                                                            21
Physical capacity reduction in Western
Europe  Footprint now Optimised
 Asset optimisation plan                                             New “Footprint” in Western Europe:

• In 2011 as European steel demand weakened ArcelorMittal                                              2011   2013
  undertook a footprint exercise to save $1bn on sustainable basis    # Blast furnaces                  15     11
• Focus on “core” assets to ensure lowest cost footprint with no      # Hot strip mills                  8      7
  impact on output                                                     # Cold rolling                   18     16
                                                                            mills
• Supply existing customers with lower cost base without
  compromising quality and service
• Significant savings  $1bn annualised savings achieved by end-

                                                                                Transformation costs
  2012; competitive gap with competition recovered

                                                                                                               Working Cap needs
 Industrial plan
• Closed 4 BF in Belgium and France and idled least competitive
   rolling & coating lines
• Concentrated slab production in 5 coastal sites: Dunkirk; Ghent;
   Bremen; FOS and Asturias
• Savings through fixed cost removal; well loaded assets with
   stable working points; lower variable cost; better service and
   quality; and reduce capex requirements

            Positive savings: Europe FCF positive even in challenging environments
                                                                                                                                   22
ACIS turnaround underway
• Volume improvement: 2mt through operational
                                                   Shipments split by geographical location
  reliability (investing in our assets)                                                                Domestic

• Maintenance practices: Maintenance                                                 Exports              CIS
  Transformation program and WCM regaining
  customer confidence in domestic and core
                                                     Kryviy Rih
  markets
                                                                                       Exports
• Long term agreements: Renegotiated long term                                                           Domestic
                                                                    Temirtau
  supply agreement with Kumba in South Africa
  expected to improve profitability
                                                                                                 CIS

• Government support: Trade case support and
  encouragement to sell locally in South Africa
                                                        South
                                                                                       Exports
                                                        Africa
• Renewed access to Middle-East market to
  improve overall shipments
                                                                                                         Domestic

• Currency devaluation improves
  competitiveness: long overdue currency
  adjustment to offset the last couple of years
  inflation                            ACIS recovery underway
                                                                                                                    23
China addressing its excess capacity
  11th 5-year plan               2009              12th 5-year plan       2013 September            2016 February

• Eliminate capacity    • Eliminate capacity     • Eliminate capacity     • Reduce 80mt          • Reduce 100-150mt
  below following         below following          below following          capacity               capacity over 5 years
  standard:               standard by 2011:        standard :             • Increase financial   • No projects of new
  - BF < 300m3             - BF < 400m3            - BF < 400m3             incentives in          capacity
  - BOF < 20t              - BOF < 30t             - BOF < 30t              capacity reduction   • There will be a
  - EAF < 20t              - EAF < 30t             - EAF < 30t              or volume swap         “mandatory” part and
• By 2005, overall      • By 2011, overall       • By 2015, overall         proposals              a “voluntary” part
  energy consumption      energy consumption       energy                 • Implement            • The “mandatory” part
  < 0.76 tons of coal     < 0.62 TCE; water        consumption < 0.58       penalties through      uses same criteria as
  equivalent; water       consumption < 5t         TCE; water               high electricity &     earlier policy but adds
  consumption < 12t       per ton; dust            consumption < 4          water prices for       criteria for product
  per ton                 emission per ton < 1     m3; SO2 emission         those companies        quality and for
• By 2010, overall        kilogram; CO2            per ton < 1 kilogram     that fail to meet      safety
  energy consumption      emission per ton <                                environmental        • The “voluntary” part
  < 0.73 TCE; water       1.8 kilogram                                      standard               will rely upon financial
  consumption < 8t                                                                                 incentives to cut
• By 2012, overall                                                                                 capacity. Special
  energy consumption                                                                               funds* will be used
  < 0.7 TCE; water                                                                                 for redeployment
  consumption < 6t                                                                                 incentives and debt
                                                                                                   restructuring
    Previous capacity closures more than offset by rapid capacity additions

China steel capacity rationalisation will take time… trade action to protect during this transition
                                                                                                                              24
MACRO (highlights)
Global apparent steel consumption
  China*                                                                                      EU28*
                                                                                             220
                                                                       0% to -1.0%
    800                                                                                      200
    700                                                                                                                                    0% to +1.0%
                                                                                             180
    600                                                                                      160
    500                                                                                      140
    400                                                                                      120
    300                                                                                      100
    200                                                                                      80
    100                                                                                      60
       0                                                                                     40
           2007 2008 2009 2010 2011 2012 2013 2014 2015                              2016F         2007 2008 2009 2010 2011 2012 2013 2014 2015    2016F

  NAFTA*                                                                                      Rest of World**
                                                                                                                                            +1% to +2%
    160                                                                +0% to +1%            600

    140                                                                                      500

    120                                                                                      400

    100                                                                                      300

     80                                                                                      200

     60                                                                                      100

     40                                                                                        0
           2007 2008 2009 2010 2011 2012 2013 2014 2015                              2016F         2007 2008 2009 2010 2011 2012 2013 2014 2015    2016F

                                                      Estimated 2016 ASC growth of 0% to 0.5%
*ArcelorMittal estimates of finished ASC in Mt; ** World ex. China, NAFTA and EU28                                                                         26
Global PMI point to improving manufacturing
• Global manufacturing output growing at an improved                                                         Global apparent steel consumption
  rate in Jun (ArcelorMittal PMI 51.3*)                                                                      2016 v 2015**
• US: Real demand growth continues led by consumer                                                           US***                                        +2 to +3%
  spending and homebuilding, but investment is held back
  by the strong dollar and depressed oil drilling activity.
  PMI picking up to 52.2 in Jun’16                                                                           EU28                                      +0% to +1%
• Europe: Underlying demand continues to rise led by
  strong automotive. Mild impact from Brexit to slow
  European recovery into 2017                                                                                China                       0% to -1.0%
• Brazil: The economy remains in recession. The pace of
  decline is moderating, as confidence has improved and
  the currency strengthened, both from low levels.                                                           Brazil -10% to -12%

• China: PMI remains below 50, but industrial output
  growth stable, supported by strong automotive. Robust
  infrastructure investment continues to support demand,                                                        CIS               -5% to -6%
  while growth in real estate moderates as expected.
• CIS: Russian economy continues to contract, but at a
                                                                                                           Global                                      0% to +0.5%
  slower pace. Russia PMI above 50 in Jun’16, first time
  since Nov’15 as manufacturing output stabilises

             ArcelorMittal PMI continues to indicate positive (albeit slow) growth in real demand
Source: *ArcelorMittal PMIs (weighted by ArcelorMittal steel deliveries) ** ArcelorMittal estimates *** Excludes tubular demand                                      27
Real GDP growth in major economies

      Real GDP
      Percent change           2014       2015        2016    2017                2018
       World                     2.7        2.7        2.4     2.8                 3.1
       United States             2.4        2.6        1.5     2.4                 2.4
       Canada                    2.5        1.1        1.2     2.3                 2.3
       Eurozone                  1.1        1.9        1.6     1.3                 1.6
       United Kingdom            3.1        2.2        1.9     0.7                 1.3
       China                     7.3        6.9        6.6     6.3                 6.4
       Japan                    -0.1        0.6        0.6     0.7                 1.0
       India                     7.2        7.5        7.5     7.4                 7.7
       Brazil                    0.1       -3.9        -3.2    0.6                 2.1
       Russia                    0.7       -3.7        -0.9    0.6                 1.6
      Source: IHS                                                    © 2016 IHS

                        World GDP growth expected in 2017
Source: HIS
© 2016 IHS                                                                               28
Construction markets in developed market
United States                                                                            US residential and non-residential construction
                                                                                         indicators (SAAR) $bn*
•    Residential construction remains strong supported
     by low mortgage rates but permits have begun to                                        (latest data point: May’16)

     stabilise after growing strongly in 2015 and Q1’16.

•    Non-residential construction continues to grow
     with the Architecture Billings Index (52.6) in June
     indicated growing demand (>50) for the 5th month
     running.

Europe
•    The economic recovery in Europe had been
                                                                                         Eurozone and US construction indicators**
     strengthening and broadening, but the UK’s vote
     to Brexit will slow growth.

•    The expected pickup in European construction
     has still not materialised and has become less
     likely in the current environment.

•    Increased uncertainty has knocked confidence,
                                                                                                                            (latest data point: Jul’16)
     so further policy action (such as a big increase in
     government infrastructure) spending is needed to
     support growth, but faces political constraints.

                                                                Construction gradually improving
* Source: US Census Bureau; ** Source: Markit and The American Institute of Architects                                                                    29
Regional inventories
German inventories (000 Mt)                                         US service centre total steel inventories (000 Mt)
            (latest data point: May’16)                                       (latest data point: Aug’16)

Brazil service centre inventories (000 Mt)                          China service centre inventories* (Mt/mth) with ASC%
         (latest data point: Aug’16)                                                       (latest data point: Aug’16)

                                                           Inventory trends
* Source: WSA, Mysteel, ArcelorMittal Strategy estimates                                                                 30
Surge of flat imports in 2014 and 2015 triggered antidumping
 investigations targeting especially China, developed Asia and
 some European countries
   Evolution of North America finished flat products* imports, mt

                                                                11.7
                                                                                                    •   The surge of imports initiated trade
                                                                       10.9
                                                                                                        actions with new AD and CVD
                                                                 2.3
                                                                        1.5                             introduced in 2016 targeting
                                                                                                        especially:
                                                                 1.0    0.9
                                                                               8.2                      -   China (HRC, CRC, coated)
                                                                        0.5
                                                                 0.6
                                                                 0.5
                                                                        0.4                             -   S. Korea (HRC, CRC, coated)
                                                                        0.7    2.2     Others
                                             6.4         6.4     0.7                                    -   Netherlands (HRC), UK (HRC,
                                                                        0.7
                           5.4               1.3          1.1
                                                                 0.7                                        CRC), Italy (coated)
                                                                        1.0    1.0     Rest of EU
         4.6                                              0.8                  0.1     India            -   Brazil (HRC, CRC)
                           1.6               0.8                 1.4           0.3
                                                                        1.3            Turkey
                                             0.3          0.3
                                                          0.0                  0.5     Taiwan           -   Turkey (HRC)
          1.3                                0.0          0.4                  0.4
                           0.6               0.5                                       Japan
                           0.2               0.5          0.7                  0.7     Brazil           -   Russia (CRC)
          0.7              0.3                                   1.9    1.5
          0.2              0.4                                                 0.7     IT, NL, UK
                                             0.7          0.8
          0.3              0.6                                                 0.4     China
                                             0.7          0.7
          0.6              0.6
          0.3                                                    2.0    2.3    1.9
                                             1.4          1.3                          Korea
          0.8              1.1

        2010              2011              2012         2013   2014   2015   2016**

                                                    …trade case have already had some impact in the US
•   HRC, CRC, HDG, EG, TP; ** 2016 H1 annualized
Source: ArcelorMittal Corporate Strategy team analysis
                                                                                                                                               31
Lower US imports
                          US Total Carbon Flat roll imports                     US Total Carbon Flat roll imports from
                            (excl. slab) – YoY ‘000 tons*                        China (excl. slab) – YoY ‘000 tons*

                                              -25%
                                                                                               -94%

                                 8,957                                                 1,208
                                                           6,695

                                                                                                       70
                                7M’15                      7M’16                     7M’15          7M’16
                          US HRC imports – YoY ‘000 tons*                         US CRC imports – YoY ‘000 tons*
                                              -24%
                                                                                               -27%

                                 2,238                                                 1,160
                                                           1,703                                       846

                                 7M’15                     7M’16                       7M’15          7M’16

                 •      YTD-July carbon flat roll import market share fell to ~17% from ~22% in the same
                        period last year
                 •      Domestic producers have been benefiting from the falling imports into the US, with
                        YTD-July domestic shipments up ~2% YoY

                                               …allowing domestic producers to recover market share
“Source: US Census Bureau, Dept. of Commerce, short tons                                                                 32
China overview
Despite declining real estate, other sectors
support steel demand growth
   Forecast crude steel demand in China (million tonnes)
   Base case, Q3 2016 outlook

                                                                                                                                                           Others

                                                                                                                                                           Container

                                                                                                                                                           Ship Building

                                                                                                                                                           Auto

                                                                                                                                                           Light industry

                                                                                                                                                           Machinery

                                                                                                                                                           Infrastructure

                                                                                                                                                           Real estate

    2008       2009       2010      2011       2012       2013   2014   2015        2016    2017   2018   2019   2020   2021   2022   2023   2024   2025

                                                                               China demand stabilized
Sources: ArcelorMittal Corporate Strategy team analysis                 Highly Restricted
                                                                                                                                                                             34
                                                                                                                                                                            34
China overview
China                                                                                                  China construction % change YoY, (3mth moving av.)*
•    GDP growth steady at +6.7% y-o-y in Q2’16, as
     robust infrastructure investment, offset weakening
     corporate investment and slower real estate growth
                                                                                                                                                             (latest data point: May’16)
•    GDP growth likely to slow during H2’16 without
     further stimulus, but strong credit and state-led
     growth increases downside risks in the medium-term
•    Industrial output growth has picked-up to 6.1% in
     Q2, up from only 5.9% in Q1. Passenger car sales,
     particularly SUV’s continued to improve, up over
     12% y-o-y in Q2’16
•    Chinese domestic HRC spread over raw materials,                                                   Crude steel finished production and inventory (mmt)
     which surged to a peak of $210/t in April, has eased                                                                                                              (latest data point: Jun’16)
     to $150-$160 spread in May/June
•    2016 real demand still expected to decline but ASC
     will be supported by an end to destocking
•    Crude steel production is expected to decline again
     in 2016, but less than previously expected as export
     volumes will be higher than forecast at the start of
     the year

                                      Economic growth stable supported by state led investment
* Source: China National Bureau of Statistics, China Real Estate Index System (via Haver) and ArcelorMittal estimates; Source: NBS, CISA, WSA, Mysteel, ArcelorMittal Strategy estimates             35
China exports expected to decline
China exports Mt*

          •       Chinese steel exports for August came in at 9.0M metric tons (vs July at 10.34M metric tons), down 12.5%
                  sequentially and -7% YOY

          •       Chinese steel exports are tracking +6.5% YTD. On an annualized YTD basis, exports are tracking toward 115M
                  metric tons (+2% above 2015’s record of 112.4M metric tons)

                                             China exports remain at elevated levels
* Source: Haver                                                                                                                36
Steel investments
Europe: ArcelorMittal Krakow Poland
On July 7, 2015, ArcelorMittal Poland announced it will restart preparations for the relining of BF#5 in Krakow,
which is coming to the end of its lifecycle in mid-2016.

•   Further investments in the primary operations include:
    – The modernization of the BOF #3  Total expected cost PLN 200m (more than €40m).

•   Investment in the downstream operations include:
    – The extension of the hot rolling mill capacity by 0.9Mtpa
    – Increasing the hot dip galvanizing capacity by 0.4Mtpa
    – Expected completion in 2016  Total capex value of both projects expected to exceed PLN 300m (€90m)

                                         HRM Krakow                                                   HRM

       Investments in excess of €130m in upstream and downstream installations in Krakow
                                                                                                               38
Dofasco (NAFTA)
Cost optimization, mix improvement and increase of shipments of galvanized products:
• Phase 1: New heavy gauge galvanize line (#6 Galvanize Line):
  – Completed construction of heavy gauge galvanizing line #6 (cap. 660ktpy) and closure of line #2 (cap. 400ktpy)
       increased shipments of galvanized sheet by 260ktpy, along with improved mix and optimized cost
  – Line #6 will incorporate AHSS capability  part of program to improve Dofasco’s ability to serve customers in
      the automotive, construction, and industrial markets
  – The first commercial coil was produced in April 2015 with ramp up ongoing
•   Phase 2: Approved galvanize line conversion to Galvalume and Galvanize:
    –   Restart conversion of #4 galvanize line to dual pot line (capacity 160ktpy of galvalume and 128ktpy of
        galvanize products) and closure of line #1 galvanize line (cap.170ktpy of galvalume)  increased shipments of
        galvanized sheet by 128ktpy, along with improved mix and optimized cost.
    –   Expected completion in 2016

                    Expansion supported by strong market for galvanized products
                                                                                                                    39
VAMA-JV with Hunan Valin
•    VAMA: JV between ArcelorMittal and Hunan Valin which will produce steel for high-end applications in the automobile industry,
     supplying international automakers and first-tier Chinese car manufacturers as well as their supplier networks for rapidly growing
     Chinese market
•    Construction of automotive facility : State of the art pickling tandem CRM (1.5Mt); Continuous annealing line (1.0Mt), and Hot dip
     galvanizing line (0.5Mt)
•   Capex ~$832 million (100% basis)  First automotive coils produced during 1Q 2015

•    VAMA recent developments
    –      VAMA has completed development of DP780, DP980 and Ductibor and received approval on advanced high strength steel and
           USIBOR by key auto OEMs.
    –      During 1Q’16, VAMA completed homologation of IF, USIBOR and DP600 with tier 1 auto OEMs; also officially homologated by
           some of the biggest domestic OEM’s
    –      Obtained ISO/TS16949 certification

                        CGL furnace               Entry section of Continuous Annealing Line                       Automotive packaging line

                 Robust Chinese automotive market: growth to ~32 million vehicles by 2022*
* Source: IHC
                                                                                                                                               40
AM/NS Calvert JV
Investment in the existing No.4 continuous coating line: Project completed 1Q 2015:
• Increases ArcelorMittal’s North American capacity to produce press hardenable steels  one of the strongest steels used in
   automotive applications, Usibor®, a type one aluminum-silicon coated (Al Si) high strength steel
• AM/NS Calvert will also be capable of producing Ductibor®, an energy-absorbing high strength steel grade designed specifically to
   complement Usibor® and offer ductility benefits to customers
• Modifications completed at the end of 2014 and the first commercial coil was produced in January 2015
Slab yard expansion to increase Calvert’s slab staging capacity and efficiency (capex $40m):
• To expand the HSM slab yard bays 4 & 5 with overhead cranes and roller table to feed the HSM  production up to 5.3mt/year of
   coils.
• The current HSM consists of 3 bays with 335kt capacity for incoming slabs  (less than the staging capacity required to achieve
   5.3mt target).
   • Phase 1 completed 1Q 2016: Slab yard expansion of Bay 4 and minor installations for Bay 5  increase coil production up to
        4.6mt/pa
   • Phase 2: Slab yard expansion Bay 5  Increase coil production from 4.6mt/pa to 5.3mt/pa. Completion expected in 2017

                                                                                                                 HSM Slab yard Bay 4

                     Investment in Calvert to further enhance automotive capabilities
                                                                                                                                       41
Acindar (Brazil segment)
New rolling mill at Acindar (Argentina):

•   New rolling mill (Huatian) in Santa Fe province to increase rebar
    capacity by 0.4mt/year for civil construction market:

    –   New rolling mill will also enable Acindar to optimize production at its
        special bar quality (SBQ) rolling mill in Villa Constitución, which in
        future will only manufacture products for the automotive and mining
        industries
•   Estimated capital expenditure of ~$100m
•   Project completed in 1Q 2016

                                   Finishing block         Hot commissioning
                                                                                  Plant overview

    Reheating Furnace                                                              New Building

                         Expansion supported by construction market in Argentina
                                                                                                   42
Mining
A global mining portfolio addressing Group
steel needs and external market
                                                                          Canada
      Key assets and projects                                        Baffinland 50%(1)                                                                                Ukraine
                                                                                                                                                                      Iron Ore
                                                                                                           Bosnia                                                     95.13%
                                                                                                          Iron Ore
                                                                                                            51%

                                                                                     Canada                                                                                                                                     Kazakhstan Iron
                                                                                   AMMC 85% (2)                                                                                                                                       Ore
                                                                                                                                                                                                                                 4 mines 100%
                                                                                                                                                                                                         Kazakhstan
                                                                         USA Coal                                                                                                                           Coal
 USA Iron Ore
                                                                          100%                                                                                                                          8 mines 100%
 Minorca 100%
Hibbing 62.31%*

                                                  Mexico Iron Ore
                                                  Las Truchas &
                                                   Volcan 100%;
                                                    Pena 50%*
                                                                                                                                     Liberia
         Iron ore mine                                                                                                           Iron Ore 85%

         Coal mine
                                                      Brazil
                                                    Iron Ore
      Existing mines                                  100%

                                                                                                                                                              South Africa
                                                                                                                                                               Iron Ore**

                                                                           Geographically diversified mining assets
 * Includes share of production
 ** Includes purchases made under July 2010 interim agreement with Kumba (South Africa)
 1)     Following an agreement signed off in December 2012, on February 20th, 2013, Nunavut Iron Ore subscribed for new shares in Baffinland Iron Mines Corporation which diluted AM’s stake to 50%
 2)     January 2nd, 2013 AM entered into an agreement to sell 15% of its stake in AM Mines Canada to a consortium lead POSCO and Chi na Steel Corporation (CSC).
 3)
 4)
        New exploration projects, Indian Iron Ore & Coal exploration , Coal of Africa (9.71%) and South Africa Manganese (50% ) are excluded in the above .
        On January 19, 2015, ArcelorMittal announced the sale of its interest in the Kuzbass Coal mines in the Kemerovo region of Siberia, Russia, to Russia’s National Fuel Company (NTK). This transaction closed on December 31, 2014.
                                                                                                                                                                                                                                                  44
Mining performance improved in 2Q’16
•    EBITDA: 2Q’16 EBITDA 67% higher than 1Q’16                                      Iron ore 62% Fe Platts (CFR) ($/t)
     +23.2% higher volumes (mainly AMMC) and +15.2%
     higher iron ore prices*                                                                                          +15.2%
•    Production lower in 2016:
     Liberia:
     ‒ Drilling underway to assess transition mining from                               58       55                          56
       ageing Tokadeh iron ore deposit to the nearby DSO                                                  47        48
       Gangra deposit by 3Q’17
     ‒ Increase from current 2-3Mtpa to 5Mtpa, higher grade                            2Q’15    3Q’15    4Q’15    1Q’16    2Q’16
       DSO, low strip ratio product by 3Q’17 (minimal
       investment)                                                                    Market price iron ore shipments (Mt)
     Mexico: Volcan mine closure (2mtpa impact)
•    Shipments: FY’16 marketable shipments expected to                                                                +23.2%
     decline by ~10% YoY

•    Ongoing cost reduction: FY’16 iron ore cash costs
     expected to be reduced by >10%                                                    10.8     10.3      9.9                9.6
                                                                                                                   7.8
•    Cashflow: FCF** breakeven point $40/t*

                                                                                       2Q’15    3Q’15    4Q’15    1Q’16    2Q’16

    Profitability improved due to seasonally higher volumes, prices and ongoing cost reduction
 YoY refers to FY’16 v FY15;                                                                                                       45
*CFR China 62% Fe; **FCF refers to cash flow from operations less maintenance capex
R&D

      46
Global R&D key facts and figures

• Over 1,300 full time researchers
• Working on all process and development needs
• Expanding worldwide network of laboratories (currently 12 labs in Europe, North America,
  and South America)
• Key challenges fully aligned with the group strategy: geography, value chain, product
  differentiation

R&D budget spending by need                                          Construction

       Exploratory                                                 10%
               6%                                                              Plates and specialities
                                                                         13%

 Process 37%
                         57% Product                                      10% General industry
                                                            60%
                                               Automotive
                                                                         7%
                                                                              Others

                     Significant R&D spend of ~$250m (1/3 for automotive sector)
                                                                                                         47
Six R&D labs dedicated to automotive
   industry

                                                               Canada                  France
                                                               Hamilton                Maizières-lès-Metz
                                                                                       Montataire
                                                                                       Gandrange*
                                                               USA
                                                               East Chicago

                                                                              Brazil
                                                               Tubarão**
Main missions:
 • Develop new steels
 • Improve the in-use properties of steels
 • Find anti-corrosion solutions
 • Invent breakthrough products
 • Ensure technical service to customers
 • Predict the behaviour of steel

                    565 people are adapting steel to the evolution of automotive industry needs
* Focus on R&D for Long Products                                                                                48
** Focus on steel innovations for the automotive, energy, construction, machinery and white goods industries.
Product and applications R&D is strongly
focused on addressing customer needs
• Automotive: compromise between weight reduction, comfort, safety & durability
• Packaging: cost effectiveness, easy processing, weight reduction, innovative look,
  food compatibility, green products
• Appliances: cost reduction, antibacterial, aesthetics, environmental friendly,…
• Construction: energy-efficiency, environmental issues, safe buildings, durability, fast
  erection, health & comfort, aesthetics,…
• Metal processing: weight and cost saving, corrosion resistance, safety, reduced total
  cost of ownership, high temperature resistance
• Electrical engineering: higher efficiency and power density machines through low
  loss, high permeability, high strength electrical steels
• Energy pipes: heavy gauge, high strength, corrosion resistance, improved welding

                                                                                            49
Automotive

             50
Through innovation, steel remains the
material of choice
                                                                                              3rd Generation AHSS
                                                                                              Fortiform® for cold stamping

                                                             2nd Generation: TWIP, X-IP

                                             1st Generation, phase 3: Usibor® for hot stamping

             1st Generation, phase 2 : Dual Phase (DP1180 since 2008), TRIP Steels, Martensitic(MS>1200MPa since 80’s)

1st Generation, phase 1: HSLA, HSS

 1990       1993                             2003            2008                              2014

   • ArcelorMittal has developed a unique full range of coated Advanced High Strength Steels in the last
     25 years
   • This has had significant impact on automotive construction:
     – Safety: Most vehicles get 5 stars NCAP rating today
     – Weight saving: Body structures are 25% lighter than in the 1980s
     – Environment: 6% less greenhouse gas emissions than in the 1980s
     – Corrosion protection: 12 years is the mainstream guarantee for corrosion thanks to the huge
        share of coated products

                 ArcelorMittal has developed the broadest product offer in the world
                                                                                                                             51
Global automotive a franchise business
• Steel set to remain material of choice for automotive producers
                                                                       Auto shipments by geography
• ArcelorMittal is the leading supplier with a global footprint 
  Global distribution network
• Majority of OEMs in Europe and NAFTA rank ArcelorMittal #1                                    Nafta
                                                                     Europe
  in Technology                                                        54%
                                                                                                38%

• Unrivalled reputation for quality and innovation
                                                                                              South America 6%
• Unique product offerings to meet OEMs demand for safety,                             South Africa 2%
  fuel economy and reduced CO2 emission  (S-in Motion 20%
  weight reduction)
• Relative stability of margin: 20-30% of average selling price is
  attributable to the value added nature of the product
• R&D efforts producing award winning Automotive solutions
• Focused investment to capture growth opportunities
• Calvert acquisition a break-through for NAFTA automotive
  franchise
• Strong market share in our core markets
• Strong and consistent investment in R&D
        Committed to producing innovative steel solutions for our automotive customers
                                                                                                                 52
S-in motion®: weight reduction solutions
• A catalogue of 60 steel solutions using:
–   Advanced High Strength Steels
–   Hot stamping
–   Laser Welded Blanks
–   Tubular products
–   Long products                                   Press hardened parts (Usibor®/Ductibor®)

• Enabling:
– to save up to 73 kg or 20% of a typical
  C-segment vehicle’s body-in-white and
  chassis weight
– to deliver a 13.5% reduction in
  CO2 equivalent (eq) emissions during
  the vehicle’s use-phase
– to achieve these savings at neutral cost                                      54% AHSS
                                                                      Processes
  without compromising the vehicle’s safety                           • Hot stamping
                                                                      • Stamping of LWB
                                                                                          29 parts
                                                                                          16 parts
  performance                                                         • Roll forming       2 parts

                  Choose the best weight saving / cost compromises
                                                                                                     53
Further weight reduction potential
• Due to a very aggressive and weight reduction driven product development,
  ArcelorMittal keeps enhancing:
    • Our portfolio of products for cold stamping with developments like Fortiform®,
      our family of 3rd Generation AHSS
    • Our portfolio of products for hot stamping with Usibor® 2000 and Ductibor® 1000

Further potential weight savings with new products (%)

         Potential                                                 Potential weight savings of
                                                                   additional 3% over the next
                                       23              24
          Current       20                                         2 years across our solutions

                     C Segment     Pick up truck   North America
                     (2009 base)   (2013 base)       D segment
                                                    (2015 base)

     New product developments to offer an additional 3% weight reduction in next 2 years
                                                                                                  54
Automotive growth in developed world
USA / Canada and EU28 + Turkey vehicles production units
                                                           • USA and Canadian automotive production
                                                            forecast to stabilize at ~14m units level
21,000
20,000             18,056
19,000
18,000                                                     • EU28 and Turkey recovery ongoing.
17,000
16,000                                                      Expected to return to 2007 level in 2017
                    13,818
15,000                                                      with further growth potential beyond
14,000
13,000
12,000
11,000
10,000                          EU28 & Turkey
 9,000                          USA & Canada
 8,000
     0
      2006 2008 2010 2012 2014 2016 2018 2020 2022

            Developed market vehicle production rates increasing; recovery ongoing
                                                                                                        55
Penetration of press hardened steels
                                                  Quote from Volvo’s statement on 22 July 2014:
              Volvo XC90                               “To help keep the occupant space inside intact in a
                                                  crash, the all-new XC90 has literally been made stronger
                                                  in every sense. This is achieved by more extensive use
 275 pounds lighter than its                     of hot-formed boron steel, which is the strongest type of
                                                  steel presently used in the car body industry.
  predecessor and 440 pounds                           The complete safety cage around the occupants is
  lighter than most of its competitors .          made from hot-formed boron steel and is designed for
                                                  maximum occupant protection in all types of crash
                                                  scenarios. The hot-formed steel amounts to about 40 per
                                                  cent of the total body weight.”
 XC90's body & components
 structure
                          Press hardened steels

                       40%

            60%
    Other

        40% of the Volvo XC90 uses press hardened steel – the most in any vehicle
                                                                                                          56
S-in motion® : Mid-Size Sedan & SUV
• Offers one platform for both the mid-size sedan and SUV
• Official launch 1Q 2016
• Achieves more than 20% weight reduction from a 2015 baseline
• Includes body structures, doors, rear suspension and bumper systems
• Approximately 25% of the underbody mass of the SUV solution is carried over from the sedan
  solution
   - 86 of 241 vehicle parts were applied to the SUV solution from the sedan
• Representative 2015 baseline vehicles include:
   - Mid-size sedan: Ford Fusion, Honda Accord, Chevrolet Malibu, Toyota Camry and Nissan Altima
   - Mid-size SUV: Ford Explorer, Jeep Grand Cherokee, Chevrolet Traverse, Toyota Highlander,
     Honda Pilot and Nissan Pathfinder

       S-in motion® Mid-Size Sedan                            S-in motion® Mid-Size SUV

    The S-in motion® Mid-Size SUV was built as an extension of the S-in motion® Mid-Size Sedan
                                                                                                   57
Award winning solutions

                                                   Delegation from ArcelorMittal and Magna Cosma Int’l

American Metal Market’s 2014 Best Innovation     Automotive News' 2014 PACE Award in the
Process Award for the Honda door ring            Manufacturing Process and Capital Equipment
                                                 category for the laser ablation process

                                 Door ring project awarded
                                                                                                         58
AM/NS Calvert
• World’s most advanced steel finishing facility. The largest newly constructed facility in the
  U.S. in 40 years
• Well positioned to supply growing demand in the SE US and Mexico with steels grades that
  meet 2025 safety and fuel economy targets
• Powerful, state-of-the-art hot-strip mill, well suited to supply fast-growing demand for
  advanced high-strength steels (AHSS)
• 5.3 million metric ton capacity with 1,650 team members

          Strengthens existing auto steel franchise and ability to supply energy market
                                                                                                  59
VAMA greenfield JV facility in China

 • 1.5 MT state-of-the-art production facilities            VAMA: Valin ArcelorMittal Automotive target
                                                            areas and markets
 • Well-positioned to serve growing automotive market
 • Central office in Changsha with satellite offices in
                                                                                          FAW-VW &
   proximity to decision making centers of VAMA’s customers                               BMW

 • VAMA will represent 10% of Chinese automotive steel                          Daimler &
                                                                                Nissan
   market
                                                                                                                                      Beijing

      Auto steel consumption accessible to VAMA target products (market size
      in MT)
                                                                                                                                                    Geely, VW, GM, KIA,
                                                                                                        BYD, Changan,
                                                                                                                                                    SAIC & Chery
                                      +29%                                                              Suzuki, CFMA &
                                                                                                        FAW-VW                                            Shanghai

                                         20                    22
                                                                                                                                                   Changfeng, Fiat,
                    17                                                                                                                             DPCA, Dongfeng,
                                                                                                                                        VAMA       Honda, JMC & Suzuki
                                                                                                                            Loudi

                                                                                                                 SAIC, Toyota, GM,
                                                                                                                 Honda, Nissan & BYD             Guangzhou
                 2014                 2016F                2018F

              VAMA well positioned to supply growing Chinese auto market (+35% 2014-2020)
BYD: Build Your Dreams; CFMA: Changan Ford Mazda Automobile; SAIC: Shanghai Automotive Industry Corporation; JMC: Jiangling Motors Corporation                        60
India - potential JV with SAIL
• MoU signed with SAIL on 22nd May to                  India auto production 2007-2022 (kveh)
  study feasibility of creating JV for             8,000                                    +93%
  constructing CR and HDG automotive               6,000
  steel production facility in one of the major    4,000
  auto clusters in India                           2,000
                                                       0
• India forecast to become the 4th largest

                                                           2011

                                                           2016
                                                           2007
                                                           2008
                                                           2009
                                                           2010

                                                           2012
                                                           2013
                                                           2014
                                                           2015

                                                           2017
                                                           2018
                                                           2019
                                                           2020
                                                           2021
                                                           2022
  automobile manufacturing nation by 2020,
  growing from ~3.5m units to over 7m units
                                                  India auto steel consumption ktpa 2014-2021
• India is expected to grow as a hub for
  automobile export manufacturing facilities                                       +2,200
  to cater to the international market                        Organic growth                 4,900
                                                              Domestic
• Establishing an automotive focussed                         Imports
                                                                          2,700              2,200
  production presence in India is a natural                               1,900              1,900
  progression in executing our global                                      800                800
  automotive strategy                                                      2014              2021

                                                           2014: 3.7m passenger cars; 2.6Mtpa
                                                           2021F: 6.6m passenger cars; 4.8Mtpa

                ArcelorMittal technology to be delivered through local JV partner
                                                                                                     61
Steel demand by end market
China steel demand split                                                               US steel demand split
                                                                                                            Machinery and equipment
                                                                                                                               10% Other
                               Shipbuilding                                                                                         3%
                       Railway                                                                                                         Energy
                               1%
                           1%                                                                          Construction                    10%
                                        Machinery
                                        19%                                                                   40%

                                                       Automobiles
                                                       8%                                                                             Automobile
                                                                                           Defense & Homeland Security
                                                       Household appliances                                                           26%
                                                                                                                  3%
                                                       2%                                                                   Container
                                                                                                                 Appliances
Construction                                                                                                                4%
                                                                                           Metal goods                  4%
       68%                                                                                                                   Europe & NAFTA
                                                                                                  14%
                                                                                                       Other
                                                                      Construction                     2%
                                                                             35%
                                                                                                        Tubes
                                                                                                        13%
                                           Europe steel demand split
                                                                                                        Other transport
                                                                                                        2%
                                                                                                       Domestic appliances
                                                                                                       3%
                                                                   Mechanical enginering         Automobiles
                                                                                   14%           18%

                                                           Regional steel demand by end markets
 Sources: China-Bloomberg, Europe: Eurofer, US: AISI
                                                                                                                                                   62
New ArcelorMittal IR app and contacts
                                                           Daniel Fairclough – Global Head Investor Relations
                                                           daniel.fairclough@arcelormittal.com
                                                           +44 207 543 1105

                                                           Hetal Patel – UK/European Investor Relations
                                                           hetal.patel@arcelormittal.com
                                                           +44 207 543 1128

                                                           Valérie Mella – European/Retail Investor Relations
                                                           valerie.mella@arcelormittal.com
                                                           +44 207 543 1156

                                                           Maureen Baker – Fixed Income/Debt Investor Relations
                                                           maureen.baker@arcelormittal.com
                                                           +33 1 71 92 10 26

                                                           Lisa Fortuna – US Investor Relations
                                                           lisa.fortuna@arcelormittal.com
                                                           +312 899 3985

 We have released a new ArcelorMittal investor relations app available for download on IOS or android devices
You can also read