Exploring the inconsistent variations in atmospheric primary and secondary pollutants during the 2016 G20 summit in Hangzhou, China: implications ...
←
→
Page content transcription
If your browser does not render page correctly, please read the page content below
Atmos. Chem. Phys., 20, 5391–5403, 2020
https://doi.org/10.5194/acp-20-5391-2020
© Author(s) 2020. This work is distributed under
the Creative Commons Attribution 4.0 License.

Exploring the inconsistent variations in atmospheric primary and
secondary pollutants during the 2016 G20 summit in Hangzhou,
China: implications from observations and models
Gen Zhang1,2 , Honghui Xu3 , Hongli Wang4 , Likun Xue5 , Jianjun He1 , Wanyun Xu1 , Bing Qi6 , Rongguang Du6 ,
Chang Liu1 , Zeyuan Li5 , Ke Gui1 , Wanting Jiang7 , Linlin Liang1 , Yan Yan1 , and Xiaoyan Meng8
1 State Key Laboratory of Severe Weather & Key Laboratory of Atmospheric Chemistry of CMA, Chinese Academy of
Meteorological Sciences, Beijing 100081, China
2 Collaborative Innovation Center of Atmospheric Environment and Equipment Technology, Jiangsu Key Laboratory of

Atmospheric Environment Monitoring and Pollution Control (AEMPC), Nanjing University of Information Science &
Technology, Nanjing 210044, China
3 Zhejiang Institute of Meteorological Science, Hangzhou 310008, China
4 State Environmental Protection Key Laboratory of Formation and Prevention of Urban Air Pollution Complex, Shanghai

Academy of Environmental Sciences, Shanghai 200233, China
5 Environment Research Institute, Shandong University, Ji’nan, Shandong 250100, China
6 Hangzhou Meteorological Bureau, Hangzhou 310051, China
7 Plateau Atmospheric and Environment Laboratory of Sichuan Province, College of Atmospheric Science, Chengdu

University of Information Technology, Chengdu 610225, China
8 State Environmental Protection Key Laboratory of Quality Control in Environmental Monitoring, China National

Environmental Monitoring Center, Beijing 100012, China

Correspondence: Gen Zhang (zhanggen@cma.gov.cn) and Honghui Xu (forsnow@126.com)

Received: 18 November 2019 – Discussion started: 7 January 2020
Revised: 4 March 2020 – Accepted: 31 March 2020 – Published: 7 May 2020

Abstract. Complex aerosol and photochemical pollution             tological Station (NRCS) (30.22◦ N, 120.17◦ E, 41.7 m a.s.l)
(ozone and peroxyacetyl nitrate, PAN) frequently occur in         in urban Hangzhou. We found significant decreases in at-
eastern China, and mitigation strategies to effectively allevi-   mospheric PAN, NOx , total VOCs, PM2.5 , and sulfur diox-
ate both kinds of pollution are urgently needed. Although the     ide (SO2 ) under the unfavorable meteorological conditions
effectiveness of powerful control measures implemented by         during G20 (DG20) relative to the adjacent period before
the Chinese State Council has been comprehensively eval-          and after G20 (BG20 and AG20), indicating that the pow-
uated in terms of reducing atmospheric primary pollutants,        erful control measures were effective in reducing the pollu-
the effectiveness in mitigating photochemical pollution is        tant emissions in Hangzhou. Unlike with the other pollutants,
less assessed and therefore the underlying mechanisms are         daily maximum 8 h average (DMA8) O3 exhibited a slight
still poorly understood. The stringent emission controls im-      increase and then decrease from BG20 to AG20, which was
plemented from 24 August to 6 September 2016 during               mainly attributed to the variation in the solar irradiation in-
the summit for the Group of Twenty (G20) provide us a             tensity and regional transport in addition to the contribution
unique opportunity to address this issue. Surface concentra-      from the implementation of stringent control measures. Re-
tions of atmospheric O3 , PAN, and their precursors includ-       sults from an observation-based chemical model (OBM) in-
ing volatile organic compounds (VOCs) and nitrogen diox-          dicated that acetaldehyde and methylglyoxal (MGLY) were
ides (NOx ), in addition to the other trace gases and particu-    the most important second-generation precursors of PAN, ac-
late matter, were measured at the National Reference Clima-       counting for 37.3 %–51.6 % and 22.8 %–29.5 % of the total

Published by Copernicus Publications on behalf of the European Geosciences Union.
5392             G. Zhang et al.: Exploring the inconsistent variations in atmospheric primary and secondary pollutants

production rates including the reactions of OVOCs, propa-           actions, the mitigation of secondary photochemical pollution
gation of other radicals, and other minor sources. Moreover,        is even more challenging. In the troposphere, O3 and PAN
we confirmed the production of PAN and O3 was sensitive to          are both formed in photochemical reactions of VOCs in the
VOCs throughout the whole period, specifically dominated            presence of NOx . However, PAN is exclusively formed by
by aromatics in BG20 and DG20 but by alkenes in AG20.               the oxidation of a small part of VOCs that can generate per-
These findings suggested that reducing emissions of aromat-         oxy acetyl radical (CH3 C(O)O2 , PA) including oxygenated
ics, alkenes, and alkanes would mitigate photochemical pol-         VOCs (OVOCs) such as acetaldehyde, acetone, methacrolein
lution including PAN and O3 . Source appointment results at-        (MACR), methyl vinyl ketone (MVK), and methylglyoxal
tributed the reductions of VOC source and ozone formation           (MGLY) (Williams et al., 2000; LaFranchi et al., 2009),
potentials (OFPs) during G20 to the effective emission con-         while O3 formation involves almost all VOCs. Therefore,
trols on traffic (vehicle exhaust) and industrial processes (sol-   PAN is considered to be a better indicator of photochemi-
vent utilization and industrial manufacturing). However, fuel       cal smog than O3 (McFadyen and Cape, 2005). In addition,
combustion and biogenic emissions both weakened such an             these OVOCs are mainly oxidation products (here referred to
effect with a sizable contribution to the VOC mixing ratios         as secondary precursors of PAN) of a certain class of hydro-
(18.8 % and 20.9 %) and OFPs (25.6 % and 17.8 %), espe-             carbons (e.g., ethane, propene, isoprene, and some aromat-
cially during the latter part of G20 (G20 II) when anthro-          ics) through the oxidation of OH, NO3 , and O3 . The relative
pogenic VOCs were substantially reduced. This study high-           importance of individual precursors to the formation of PAN
lights the effectiveness of stringent emission controls in rela-    and O3 varies from place to place depending on the reactiv-
tion to traffic and industrial sources, but a coordinated pro-      ity and composition of VOCs. Identification of the dominant
gram related to controlling fuel combustion and biogenic            precursors is the key to effective control of photochemical
emissions is also required to address secondary pollution.          pollution, which, however, remains poorly characterized in
                                                                    China.
                                                                       Recently, a series of temporary and stringent emission
                                                                    control measures were implemented in China during several
1   Introduction                                                    mega-events including the 29th Summer Olympic Games
                                                                    (August 2008), the 21st Asia-Pacific Economic Cooperation
Complex atmospheric pollution including particulate mat-            (APEC) conference (November 2014), and the China Victory
ter and photochemical pollution (ozone, O3 ; peroxyacetyl           Day Parade (Victory Parade 2015) in Beijing (Verstraeten
nitrate, PAN) is a pervasive environmental issue in eastern         et al., 2015) and the surrounding areas (Xu et al., 2010;
China (Geng et al., 2007; Ding et al., 2013; Mo et al., 2015;       Y. J. Zhang et al., 2012; Gao et al., 2011; Li et al., 2017). Dur-
Li et al., 2016; Zhang et al., 2018). Numerous mitigation           ing these events, the effectiveness of a series of emission con-
strategies have been released by the Chinese government,            trol measures in reducing atmospheric primary pollutants, in
such as the nationwide application of flue-gas desulfuriza-         particular the particulate matter, has been comprehensively
tion (FGD) devices in power plants after 2006 (Feng et al.,         evaluated, but less so for photochemical pollution.
2014) and the “Atmospheric Pollution Prevention and Con-               In September 2016, the Group of Twenty (G20) sum-
trol Action Plan” in 2013 (Zhang et al., 2016). As expected,        mit was hosted in Hangzhou, the capital city of Zhejiang
ambient concentrations of primary gas pollutants such as sul-       Province, which is located along the central Yangtze River
fur dioxide (SO2 ) (Koukouli et al., 2016) and nitrogen ox-         Delta (YRD) in the eastern part of China. Similar to other
ides (NOx =NO + NO2 ) (de Foy et al., 2016) showed a good           major events held in Beijing, rigorous temporal control
response to emission reductions. However, secondary atmo-           measures were set to reduce emissions of air pollutants
spheric pollutants such as ozone and secondary aerosols fre-        in Hangzhou and the adjacent regions including Zhejiang,
quently exceeded their respective Chinese Grade II standards        Shanghai, Jiangsu, and Anhui provinces from 24 August to
over urban cities in China (Wang et al., 2014). Severe haze         7 September including phase I (24–27 August) and phase II
pollution, mainly comprised of PM2.5 (particles within the          (28 August–6 September). These control measures included
2.5 µm diameter range), still occur in China during winter-         restrictions on the number of vehicles, limited production or
time, although it started to decline during the 11th Five-Year      complete shutdown of industrial enterprises, and temporary
Plan period (Huang et al., 2014; Cheng et al., 2016; Miao           cessation of construction activities, and the target sources in-
et al., 2018; Miao and Liu, 2019). Surface O3 has also ex-          cluded vehicles, paint and solvent use, steel factories, chem-
hibited a rapid increasing trend over China since 2000 (Ver-        ical factories, and power plants. During phase I the govern-
straeten et al., 2015; Wang et al., 2017), with high levels         ment implemented strict emission control measures on in-
(9.5–14.0 ppbv) of PAN often encountered during O3 pol-             dustrial sources, power plants, and residential activities and
lution events (Shao et al., 2009; Liu et al., 2010; G. Zhang        phase II referred to the additional control measures on vehi-
et al., 2012, 2014, 2015; Xue et al., 2014c). Due to the            cles in the Hangzhou and the surrounding provinces (includ-
highly nonlinear response of O3 and PAN to primary pol-             ing Zhejiang, Jiangsu, Jiangxi, and Anhui).
lutant emissions, in addition to intricate photochemical re-

Atmos. Chem. Phys., 20, 5391–5403, 2020                                               www.atmos-chem-phys.net/20/5391/2020/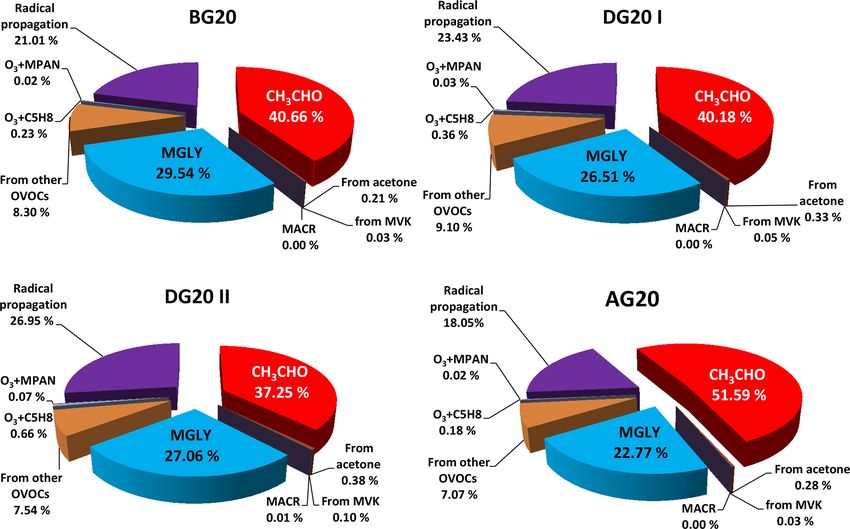
G. Zhang et al.: Exploring the inconsistent variations in atmospheric primary and secondary pollutants                        5393

   In this study, to evaluate the effectiveness of emission con-
trol measures on reducing pollutant concentrations, we com-
pared the variations in atmospheric O3 , PAN, particulate mat-
ter, VOCs, NOx , and other trace gases before, during, and
after G20, also demonstrating the effect of meteorological
conditions by using the WRF-Chem model. An observation-
based chemical box model (OBM) was used to identify the
predominant precursors and key chemical processes in PAN
and O3 formation and to further assess the effect of reduc-
ing their respective precursors before, during, and after G20.
Positive matrix factorization (PMF) was employed to appoint
the corresponding sources of various VOCs and compare
their variations and their respective ozone formation poten-
tials (OFPs) before, during, and after G20.

2     Experimental

2.1    Observations
                                                                   Figure 1. The topography of the National Reference Climatological
In situ observations of atmospheric PAN, O3 , and VOCs and         Station (NRCS) (30.22◦ N, 120.17◦ E, 41.7 m a.s.l) in Hangzhou,
                                                                   China. The star represents the location of the NRCS.
a suite of associated chemical species and meteorological pa-
rameters, including NOx , CO, SO2 , and fine particulate mat-
ter (PM2.5 ), were conducted at an urban site named the Na-
tional Reference Climatological Station (NRCS) (30.22◦ N,          2.2     Models
120.17◦ E, 41.7 m a.s.l) in the center of Hangzhou as shown
in Fig. 1. PAN was measured by a modified gas chromato-            2.2.1    WRF-Chem model
graph (Agilent 7890B, USA) equipped with an electron cap-
ture detector, which has been described in our previous stud-      To quantify the separate effects of meteorological condi-
ies in detail (G. Zhang et al., 2012; Zhang et al., 2014, 2015).   tions (EMCs) and emission control measures (ECCs) on ob-
Trace gases including O3 , SO2 , NOx , and CO were detected        served particulate concentrations, we performed simulations
by a set of commercial trace gas analyzers (Thermo Envi-           using the Weather Research and Forecasting model coupled
ronmental Instruments Inc., USA, i-series 49i, 43i, 42i, and       to Chemistry (WRF-Chem). WRF-Chem V3.9 was used to
48i, respectively; Zhang et al., 2018). All trace gas analyz-      simulate the variation in PM2.5 concentration from 6 Au-
ers were calibrated weekly and zero checked daily. Ambi-           gust 2016 00:00 UTC to 16 September 2016 00:00 UTC.
ent VOCs were measured by using an online gas chromatog-           The Multi-resolution Emission Inventory for China at 0.25◦
rapher (Syntech Spectras Instrument Co., Ltd., the Nether-         in 2016, developed by Tsinghua University (http://www.
lands) coupled with dual detectors (photoionization detec-         meicmodel.org/, last access: 2 May 2020), was used as in-
tor, PID, and flame ionization detector, FID) for quanti-          put for WRF-Chem. WRF-Chem was configured to have
fying C2 –C5 VOCs (GC955 series 811) and PID for de-               two nested domains, i.e., an outer domain with horizontal
tecting C6 –C12 VOCs (GC955 series 611). Ambient PM2.5             resolution of 25 km (140 × 100 grid points) covering east
samples were collected using co-located Thermo Scien-              China and the surrounding areas and an inner domain with
tific (formerly R&P) model 1405D samplers. Coarse PM               5 km resolution (101 × 101 grid points) covering the Yangtze
and PM2.5 , split by a virtual impactor, each accumulate on        River Delta. Hangzhou is located in the center of the do-
the system’s exchangeable tapered element oscillating mi-          main. Vertically, there were a total of 35 layers extending
crobalance (TEOM) filters. By maintaining a flow rate of           to the model top at 50 hPa, with 16 levels below 2 km. The
1.67 L min−1 through the coarse sample flow channel and            National Centers for Environmental Prediction (NCEP) Final
3 L min−1 through the PM2.5 sample channel, and measur-            Operational Global Analysis (FNL) data available at 1◦ × 1◦
ing the total mass accumulated on each of the TEOM filters,        every 6 h were used for meteorological driving fields. Anal-
the device can calculate the mass concentration of both the        ysis nudging was used for domain one. The RADM2 chemi-
PM2.5 and coarse PM sample streams in near-real time.              cal mechanism and MADE/SORGAM aerosols were used in
                                                                   this study. Here we assumed no significant change in chem-
                                                                   ical processes (specifically the other reactive gases involved
                                                                   in the chemical reactions with these pollutants) from BG20 to
                                                                   AG20. Thereby, the net contribution (NCC) of emission con-
                                                                   trols and meteorological conditions primarily results in the

www.atmos-chem-phys.net/20/5391/2020/                                               Atmos. Chem. Phys., 20, 5391–5403, 2020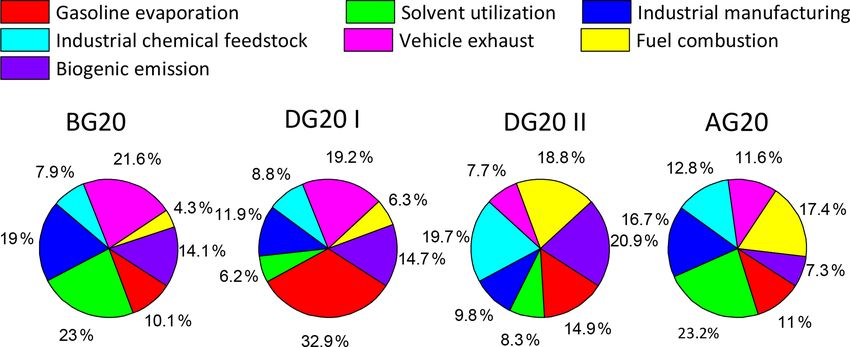
5394            G. Zhang et al.: Exploring the inconsistent variations in atmospheric primary and secondary pollutants

difference between observed PM2.5 before and during G20,          layer (Xue et al., 2014b). The photolysis frequencies appro-
which is represented by the ratio of observed PM2.5 (BG20)        priate for Hangzhou are parameterized using a two-stream
minus observed PM2.5 (DG20 II) to observed PM2.5 (BG20).          isotropic-scattering model under clear-sky conditions. In this
The effect of meteorological conditions (EMCs) was quanti-        study, all of these reactions were tracked and grouped into
fied by comparing the modeled PM2.5 without emission con-         a small number of formation pathways, such as acetalde-
trols before and during G20 under their respective meteo-         hyde, acetone, MACR, MVK, MGLY, other OVOCs, reac-
rological conditions (Eq. 1). Thereby, the effect of emission     tions of O3 with isoprene and peroxymethacryloyl nitrate
controls (ECCs) could be obtained through the difference be-      (MPAN), and propagation of other radicals to PA. The pro-
tween NCC and EMCs before and during G20 (Eq. 2) below.           duction rate of PA could be estimated as the sum of these
                                                                  reaction rates. The ozone production rates were calculated
         Modeled PM2.5 (BG20) − Modeled PM2.5 (DG20 II)
EMCs =                                                            through the oxidation of NO by HO2 and RO2 , and its de-
                     Modeled PM2.5 (BG20)                         struction rates were mainly facilitated by O3 photolysis and
× 100 %                                                           reaction with NO, NO2 , OH, HO2 , and unsaturated VOCs.
                                                           (1)    Moreover, we investigated the sensitivities of PAN and O3
ECCs = (NCC − EMCs) × 100 %                                (2)    formation to their respective precursor species by introduc-
                                                                  ing a relative incremental reactivity (RIR) concept which is
In general, the modeled results of PM2.5 before and af-           widely applied in the OBM investigation of PAN and ozone
ter G20 can reproduce the observation results (mean bias          formation (Chameides et al., 1999; Xue et al., 2014c). In this
(MB) = 2.46, root-mean-square error (RMSE) = 15.5, R =            calculation, we performed model calculations during the pe-
0.63, p < 0.01), providing the basis of the following compar-     riod of 20 August–10 September 2016, during which VOC
ison.                                                             measurements were available. The model was run based on
                                                                  the hourly average profiles of PAN, O3 , CO, SO2 , NO, NO2 ,
2.2.2   Backward trajectory analysis
                                                                  C2 –C10 non-methane hydrocarbons (NMHCs), air tempera-
To determine the influence of regional transport on the pol-      ture and pressure, and relative humidity (RH) measured at
lutant concentrations, 24 h air mass back trajectories start-     the NRCS site. During the simulation, the model was pre-
ing at 300 m from the NRCS site were calculated by us-            run for 3 d constrained to the data of 20–22 August so that
ing the National Oceanic and Atmospheric Administration           it reached a steady state for the unmeasured species (e.g.,
(NOAA) HYSPLIT-4 model with a 1◦ × 1◦ grid and the fi-            MACR, MVK, HONO, radicals). A more detailed descrip-
nal meteorological database. The 6-hourly final archive data      tion of this model has been given in previous studies (Jenkin
were obtained from the National Centers for Environmen-           et al., 2003; Xue et al., 2014a, c).
tal Prediction’s Global Data Assimilation System (GDAS)
                                                                  2.2.4    Positive matrix factorization (PMF) model
wind field reanalysis. GDAS uses a spectral medium-range
forecast model. More details can be found at https://www.         Positive matrix factorization (PMF) is an effective source ap-
arl.noaa.gov/hysplit/hysplit/ (last access: 2 May 2020). The      portionment receptor model based on the fingerprints of the
model was run 24 times per day. The method used in trajec-        sources that does not require the source profiles prior to anal-
tory clustering was based on the GIS-based software TrajStat      ysis and has no limitation on source numbers (Hopke, 2003;
(Wang et al., 2004).                                              Pentti and Unto, 1994). The data used in PMF are of the form
                                                                  of an i × j matrix X, in which i is the sampling number and
2.2.3   Observation-based chemical box model (OBM)
                                                                  j is the number of species. Based on chemical mass balance
Here we used the OBM model to simulate in situ PAN and            of the pollutants, the following equation can be derived with
O3 production and their sensitivity to changes in PAN and                Xp
                                                                  Xij =         g f + eij ,
                                                                             k=1 ik ik
O3 precursors, which has been successfully implied in our
previous studies (Xue et al., 2014a, c, 2016; Li et al., 2018).   where p is the number of the sources (i.e., the number of
In brief, the model was built on the latest version of the Mas-   factors), f is the profile of each source, g refers to the con-
ter Chemical Mechanism (MCM v3.3), an explicit mecha-             tribution of each factor to the total concentration, and e is
nism describing the degradation of 143 primarily emitted          the residual. Factor contributions and profiles are derived by
VOCs, resulting in 17 224 reactions involving 5833 molec-         minimizing the total scaled residual Q:
ular and free-radical species (Saunders et al., 2003). In ad-
dition to the existing reactions in MCM v3.3, the heteroge-               Xn Xm  eij 2
neous reactions of NO2 , HO2 , NO3 , and N2 O5 were also in-      Q=       i=1 j =1 uij
                                                                                         ,
corporated. In addition, we also optimized the model with
some physical processes such as the variations in bound-          where u is the uncertainty of the sampling data. More details
ary layer height and solar zenith angle, dry deposition, and      about principles have been found elsewhere (Cai et al., 2010;
the dilution of air pollutants within the planetary boundary      Zhang et al., 2013; Li et al., 2015, 2017). In this study, we

Atmos. Chem. Phys., 20, 5391–5403, 2020                                            www.atmos-chem-phys.net/20/5391/2020/
G. Zhang et al.: Exploring the inconsistent variations in atmospheric primary and secondary pollutants 5395
used the EPA PMF 5.0 model to identify major VOC sources atmospheric pollutants. On 26 and 27 August, the weather
and their temporal variations. We discarded the species that pattern changed to a cold continental high with showery and
were below the method detection limit (MDL) for more than windy days. The total precipitation and mean wind speed
50 % of the time or showed a significantly smaller signal- both reached their respective maximums of 14.6 mm and
to-noise ratio (S/N). The uncertainties for each sample and 3.7 m s−1 on 26 August. Accordingly, all species except CO
species were calculated based on the following equation if significantly decreased by 12.3 % for SO2 , 29.7 % for NOx ,
the concentration is greater than the MDL provided: 6.7 % for PM2.5 , 11.9 % for daily maximum 8 h average
(DMA8) O3 , and 56.1 % for PAN relative to BG20. With re-
uncertainty
q spect to the last half of DG20 I and the beginning of DG20
= (0.5 × DML)2 + (error fraction × concentration)2 . II (28–31 August), the prevailing wind experienced a shift
from northwest to west and to the southwest. On 28 August,
Values below the detection limit were replaced by one-half the prevailing wind was from the north with a average daily
of the MDL, and their overall uncertainties were set at five- maximum wind speed of 3.9 m s−1 during G20, and the rela-
sixths of the MDL values. In this analysis, different numbers tive humidity rapidly decreased by 26.2 % relative to the pre-
of factors were tested. The robust mode was used to reduce vious day. As seen in Fig. S3, air masses arrived at Hangzhou
the influence of extreme values on the PMF solution. More from the north, passing through all of Jiangsu Province and
than 95 % of the residuals were between −3 and 3 for all northern parts of Zhejiang Province, two of the most devel-
compounds. The Q values in the robust mode were approxi- oped provinces in China, with intense human activities. They
mately equal to the degrees of freedom. carried higher PM2.5 , SO2 , NOx , and CO loadings than the
other clusters (see Supplement Table S1). On 1 September,
the prevailing wind was from the southwest with high wind
3 Results and discussion
speeds (3.3 m s−1 ). Results from back trajectories indicated
In order to comprehensively evaluate air quality during the that the southwesterly air masses originated from northern
G20 period, we compared the concentrations of pollutants Jiangxi Province, were transported over western Zhejiang
during G20 with those in the adjacent time period in 2016. Province, and arrived at Hangzhou, with high concentration
According to the control measure schemes, we classified the loadings of SO2 , particulate matter, O3 , and PAN. The in-
whole period into three episodes: 1 week before G20 (BG20) creased relative humidity (56.5 %) relative to 49.5 % on 31
(16–23 August 2016), during G20 (DG20) (24 August– August was beneficial for the formation of particulate matter.
6 September) including phase I (24–27 August) and phase During 2–4 September, the Hangzhou area witnessed stable
II (28 August–6 September), and 1 week after G20 (AG20) meteorological conditions with weak wind (ws < 2.6 m s−1 ),
(7–15 September). continuously high air temperature (daily maximum average:
32.2 ◦ C), and moderate relative humidity (ca. 60 %). Such
3.1 Evolution of meteorological condition conditions were favorable for the accumulation of particu-
late matter and the photochemical production of O3 . It caused
First, we looked into the day-to-day variations in meteoro- significant increases by 25.1 % for PM2.5 , 16.7 % for PM10 ,
logical parameters and atmospheric pollutants from BG20 and 10.7 % for O3 compared with BG20, in contrast to the
to AG20 in Fig. S1 in the Supplement. In the period of large decreases by 56.4 % for SO2 and 27.9 % for NOx due
BG20 and the beginning of DG20 I (16–25 August), a to the implementation of emission control measures. Over-
subtropical anticyclone dominated Hangzhou and the sur- all, the meteorological conditions during G20 II were not fa-
rounding area, leading to a continuous 10 d with a daily vorable for the dispersal of atmospheric primary pollutants
mean temperature of 31.5 ◦ C ranging from 29.9 to 32.5 ◦ C but beneficial for producing O3 . However, with the strin-
and strong solar irradiation intensity (mean daily maximum gent control measures, the most distinct drops in pollutants
value: 369.4 W m−2 ), favorable for the photochemical pro- concentrations were found on 5 September, with large reduc-
duction of O3 and PAN. The highest O3 (113.4 ppbv) oc- tions of 50.0 % for PM2.5 , 18.3 % for DMA8 O3 , 55.7 % for
curred at 13:00 CST on 25 August under the maximum air SO2 , 41.3 % for NOx , and 65.6 % for PAN relative to BG20.
temperature of 35.2 ◦ C. Meanwhile, the mean daily maxi- Within AG20, 7 rainy days with mean daily total precipita-
mum height of the mixing boundary layer (MBL) during this tion of 18.7 mm occurred as well as 6 d with low wind speed
period was up to ca. 1895 m, beneficial for the diffusion of (ca. 2.0 m s−1 ) and 8 d with low MBL (< 1000 m). Such me-
atmospheric primary pollutants in the vertical direction. In teorological conditions were beneficial for scavenging the
addition, the prevailing wind was from the east (15.1 %) with particulate matter and SO2 by wet deposition in addition to
a mean wind speed of 2.9 m s−1 . Results from the backward the accumulation of NOx . In addition, weak solar irradia-
trajectory simulations demonstrated that the air masses from tion intensity was not favorable for the photochemical for-
the east originated from the East China Sea and Yellow Sea, mation of O3 and PAN. On 7 September a moderate shower
bringing in clean marine air (Fig. S2). Thus, meteorologi- lasted from 2:00 to 11:00 CST with daily total precipitation
cal conditions before G20 were favorable for the dispersal of of 9.5 mm, accompanied by low air temperature (21.5 ◦ C)
www.atmos-chem-phys.net/20/5391/2020/ Atmos. Chem. Phys., 20, 5391–5403, 20205396 G. Zhang et al.: Exploring the inconsistent variations in atmospheric primary and secondary pollutants
and wind speed (1.8 m s−1 ). Compared with the previous day,
significant decreases in DMA8 O3 (22.6 %) were found as
expected, while together with a small reduction in PM2.5
(2.7 %) and unexpected increases in NOx (41.1 %) and SO2
(175.1 %) were also found, indicating that emissions imme-
diately bounced back after lifting the ban on emission con-
trols.
3.2 Evolution of pollutant concentrations
Statistically, observed daytime concentrations of PM2.5 ,
NOx , and SO2 in DG20 II both exhibited significant de-
creases relative to those in BG20 with the reduction ratios
of 11.3 %, 17.0 %, and 18.0 %, respectively (Fig. 2). Further-
more, by using the WRF-Chem model, we quantified the
contributions of the emission control measures (ECCs) of
63.5 %, 44.1 %, and 31.2 % to the reductions of PM2.5 , SO2 , Figure 2. The comparisons of daytime PM2.5 , NOx , SO2 , CO, the
total VOCs, PAN, DMA8 O3 , and DMA8 Ox . before, during, and
and NO2 in DG20 II relative to BG20, respectively, but for
after G20, denoted as BG20, DG20, and AG20, respectively. The
the meteorological conditions it made negative contributions.
error bars represent the standard deviations.
This evidence indicated that powerful control measures have
had an effect on reducing pollutant emissions in Hangzhou
under unfavorable meteorological conditions. The large de- lar magnitudes in AG20 with BG20. Thereby, it indicates the
creases in NOx and SO2 reflected the reduction of vehicle significant effectiveness of emission control measures in re-
exhaust and coal consumption during G20 in Hangzhou and ducing local photochemical formation of O3 and PAN. The
the surrounding areas. It is worth noting that CO showed underlying formation mechanisms of PAN and O3 including
gradual increases (ca. 20.7 %) from BG20 to DG20, which their respective key precursors and chemical process are elu-
was mainly attributed to the weak control on fuel combus- cidated in Sect. 3.3.
tion. Specifically, residential usage and liquid natural gas With respect to VOCs, the mixing ratios of total VOCs also
and petroleum gas around the YRD regions during this pe- showed a significant reduction of 20.0 % in DG20 compared
riod might account for such a unique pattern of CO. The with BG20, but they increased by 104.1 % in AG20 after con-
other two types of fuel combustion including straw combus- trol (Table S2). Alkanes were the most abundant VOC group
tion and coal combustion were both excluded as discussed (55.4 %) in all periods and were reduced by 19.8 % from
in Sect. 3.4. Under the same stringent control measures, the BG20 to DG20. Conversely, alkenes increased by 20.0 % in
variation in O3 was not consistent with the primary pollu- DG20 compared to BG20, among which ethylene accounted
tants. Observed DMA8 O3 increased by 12.4 % in DG20 I for 63.9 %–78.0 % during the three periods, although other
relative to BG20, which was attributed to regional transport alkenes decreased to a minor extent. As expected, aromat-
from the northern provinces and the enhanced solar radia- ics were reduced by 49.7 % in DG20 compared with BG20.
tion intensity. Afterwards, DMA8 O3 decreased by 33.4 % Ambient mixing ratios of specific VOCs at the NRCS sta-
from DG20 II to AG20 (Fig. 2), as did the peak values of tion are summarized in Table S3. Ethane, ethylene, benzene,
mean daily O3 in DG20 II compared to BG20 and DG20 and toluene are the four most abundant species during all
I (Fig. S3). This evidence suggests that additional vehicle the periods. Compared with BG20, except ethane, isopen-
controls implemented during DG20 II might have played tane, and ethylene, the mixing ratios of all species decreased
an important role in reducing atmospheric O3 pollution in in DG20. Ethylene, as a representative tracer of fuel com-
Hangzhou reflected by shaping such unique diurnal varia- bustion, showed a continuous increase from BG20 to AG20,
tion, which was also confirmed by the decreased OFP from possibly indicating the ineffectiveness of control measures in
vehicle exhaust below. Elevated O3 during DG20 rush hours this source.
(as shown in Figs. S1 and S2) was attributed to the reduced
titration of fresh NO emission under the control measures on 3.3 Identification of the key precursors and chemical
vehicle exhaust. Considering such effects, Ox (represented processes for PAN and O3
by the sum of O3 + NO2 ) was used to determine the local
photochemical formation. The variation in DMA8 Ox was To identify the key precursors and chemical processes for
similar to O3 , with a distinct decreasing trend from DG20 PAN, we employed the observation-based model to investi-
II to AG20. For PAN, it showed a different pattern with O3 . gate the daytime average contributions to PA radical produc-
Daytime PAN exhibited a significant decrease (ca. 45.4 %) tion rates directly from individual pathways for these four
from BG20 to DG20 II, and then it sharply increased to simi- episodes (Fig. 3). Acetaldehyde (e.g., oxidation of OH and
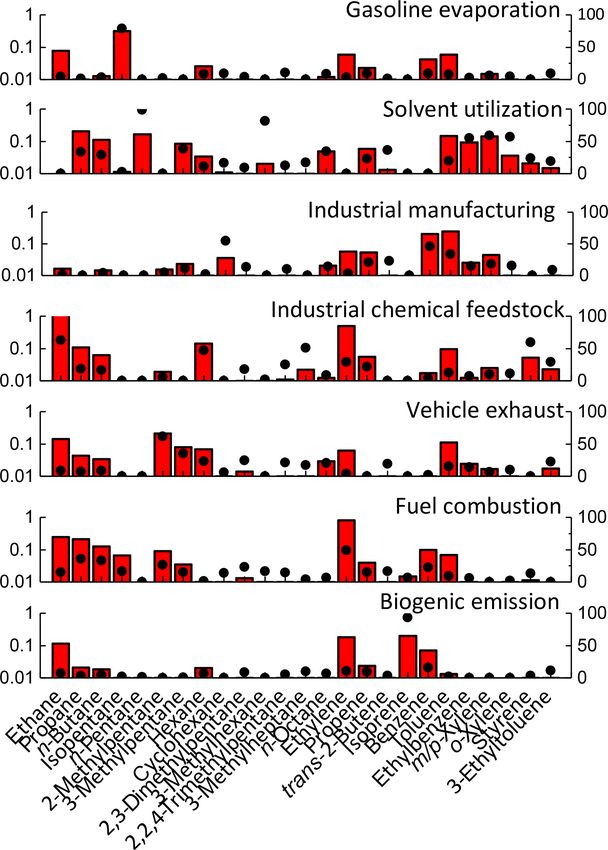
Atmos. Chem. Phys., 20, 5391–5403, 2020 www.atmos-chem-phys.net/20/5391/2020/G. Zhang et al.: Exploring the inconsistent variations in atmospheric primary and secondary pollutants 5397 NO3 ) and MGLY (e.g., photolysis and oxidation by OH and tinued emission control, the RIR for AVOCs showed a grad- NO3 ) were the most important sources of PA in Hangzhou, ual decrease from BG20 to DG20 but increased after G20. accounting for 37.3 %–51.6 % and 22.8 %–29.5 % of the to- In contrast, BVOCs (mainly isoprene) exhibited gradual in- tal production rates. This was in agreement with the find- creases for all periods, especially during phase II in DG20 ings obtained from the other typical urban areas such as Bei- and AG20 when their RIRs were both higher than those for jing (Xue et al., 2014c; Liu et al., 2010; Zhang et al., 2015), AVOCs. Thereby, the contribution of BVOCs to the photo- Tokyo (Kondo et al., 2008), Houston, Nashville (Roberts et chemical production of O3 weakened the effect of stringent al., 2001), and Sacramento (LaFranchi et al., 2009). Reac- control measures on reducing surface O3 . The RIRs for NOx tions of OVOCs and propagation of other radicals to PA were negative throughout the period of G20, also indicating (mainly including decomposition of some RO radicals and a VOC-limited regime for the sensitivity of ozone formation. reactions of some higher acyl peroxy radicals with NO) were This suggests that reducing emissions of aromatics, alkenes, also significant sources, with average contributions of 7.1 %– and alkanes would alleviate O3 formation, yet cutting NOx 9.1 % and 18.1 %–27.0 %, respectively. A minor contribu- emissions may aggravate the local O3 problems. tion (∼ 1 % in total) originated from the other pathways of O3 + isoprene, O3 + MPAN, acetone, and MVK. Acetalde- 3.4 Identification of VOC sources and quantification of hyde and other OVOCs are mainly photooxidation products their respective ozone formation potential of hydrocarbons; thus it is necessary to further identify the first-generation precursors of PAN here. We tested the model To distinguish the various sources of VOCs, we compared sensitivity by introducing the concept of relative incremen- the PMF profiles with the reference profiles from the litera- tal reactivity (RIR), which is widely used in the OBM study ture as listed below. Seven sources were identified as follows: of ozone formation (Chameides et al., 1999). Here RIR is (1) gasoline evaporation, (2) solvent utilization, (3) indus- defined as the ratio of decrease in PAN production rates to trial manufacturing, (4) industrial chemical feedstock, (5) ve- decrease in precursor concentrations (e.g., 20 % reduction is hicle exhaust, (6) fuel combustion, and (7) biogenic emis- used in this study). A number of sensitivity model runs were sion. Figure 5 exhibited the modeled source profiles together performed to calculate the RIRs for NOx , alkane, alkene, and with the relative contributions of each source to individual aromatic classes as well as the individual C2 –C10 hydrocar- species. The first source is characterized by a significant bon species. As shown in Fig. 4a, production of PAN was amount (78.5 %) of isopentane, which is a typical tracer for sensitive to VOCs from BG20 to AG20. Meanwhile, the neg- gasoline evaporation (Liu et al., 2008). Therefore, this source ative RIR values for NOx also indicated a VOC regime of was identified as gasoline evaporation. The second source PAN production around the G20 period in urban Hangzhou. was rich in n-pentane and aromatics. Many aromatics such as In terms of biogenic VOCs (BVOCs), the positive RIR values benzene, toluene, ethylbenzene, and xylene (BTEX) are the for isoprene (0.18–0.38) from BG20 to AG20 implied that dominant components of organic paints and were regarded as in situ formation of PAN at the NRCS was highly sensitive chemical tracers of solvent utilization (Watson et al., 2001). to isoprene. As for anthropogenic VOCs (AVOCs), alkenes Significant amounts of ethylbenzene, xylenes, and n-pentane and aromatics were the most important first-generation PAN are present in the second source, accounting for 19.2 %, precursors, with an RIR range of 0.24–0.37 and 0.26–0.52, 58.8 %, and 98.8 %, respectively. Thus, the second source respectively. Furthermore, we identified the other specific was identified as solvent utilization. The third source was VOCs controlling PAN production, which were xylenes, characterized by high loading of cyclohexane (54.7 %) and trans/cis-2-butenes, trimethylbenzenes, toluene, and propene BTEX (15.1 %–46.2 %). These compounds are confirmed to evidenced by their positive RIRs. Compared with their in- be typical species in industrial manufacturing in China (Liu dividual RIRs between the control and non-control periods, et al., 2008). Thus, this source was representative of indus- the in situ production of PAN was dominated by aromatics trial manufacturing. The fourth source identified as indus- in BG20 and DG20 I but controlled by alkenes in AG20. trial chemical feedstock (shown in Fig. 5) was character- In addition to secondary acetaldehyde formed by the oxi- ized by very little contribution of alkanes and aromatics and dation of ethanol, most aromatics were mainly emitted by large amounts of 3-ethyltoluene (29.4 %), 3-methylheptane vehicle exhaust. The decreased RIRs of aromatics together (51.0 %), and n-hexane (47.1 %), which are typical proxies with the decreased contribution ratios of acetaldehyde to the for industrial chemical feedstock (Liu et al., 2008; Mo et PA radical formation during G20 both indicated the effec- al., 2015). The fifth source was characterized by abundant 2- tiveness of control measures on vehicle exhaust in reducing methylpentane (61.7 %) and BTEX, which is a typical tracer atmospheric PAN concentration. Similar to PAN, the day- for vehicle exhaust (Liu et al., 2008; Li et al., 2015). In ad- time average RIRs for major groups of O3 precursors dur- dition, 2,2,4-trimethylpentane is a fuel additive used to gain ing the episodes are shown in Fig. 4b. Overall, the in situ higher octane ratings (McCarthy et al., 2013) with high abun- ozone formation was also controlled by VOCs from BG20 dance of 21.4 % in this source, and thus it is identified as ve- to AG20. AVOCs were dominated by alkenes and aromatics, hicle exhaust. The sixth source profile shown in Fig. 5 was in along with their increasing and decreasing RIRs. With con- relation to 48.9 % of the total measured ethylene mixing ra- www.atmos-chem-phys.net/20/5391/2020/ Atmos. Chem. Phys., 20, 5391–5403, 2020
5398            G. Zhang et al.: Exploring the inconsistent variations in atmospheric primary and secondary pollutants

Figure 3. Contributions of individual pathways to PA radical formation during the episodes of BG20, DG20 I, DG20 II, and AG20.

tios, major species of which were emitted from the fuel com-         dustrial manufacturing, chemical feedstock, and solvent uti-
bustion process (Li et al., 2015). It was also characterized by      lization) together accounted for 50.0 % of the total VOC
significant amounts of ethane, propane, n-butane, propene,           mixing ratios. The vehicle-related emission sources (vehi-
and benzene. Ethane and propane are the tracers of natu-             cle exhaust and gasoline evaporation) accounted for 31.7 %
ral gas and liquid petroleum gas (LPG) usage, respectively,          of the total VOC mixing ratios. This indicated that traffic
and the source profiles of resident fuel combustion in China         and industry sources were the major VOC sources before
contained alkenes (Wang et al., 2013). Coal combustion can           the control period. Compared with BG20, the contribution
release a large amount of BTEX into the atmosphere and               of solvent utilization was reduced to the largest extent, with
styrene is a typical indictor of industrial manufacturing in         a magnitude of 1.43 ppbv, followed by industrial manufac-
China (Liu et al., 2008; Li et al., 2015). Thus, this source was     turing (0.69 ppbv) and vehicle exhaust (0.38 ppbv), during
believed to be fuel combustion related to industrial processes       the first emission control period (DG20 I). According to the
and residual usage. The seventh source was distinguished by          control strategy during G20, the control measures of source
a significant amount of isoprene, a representative indicator         emission were mainly on the industry and power plants in
of biogenic emissions. About 93.1 % of the total isoprene            DG20 I, and thus they were responsible for the large reduc-
mixing ratios are apportioned to this factor (Guenther et al.,       tion of industry-related emissions including solvent utiliza-
1995). There were very small quantities of the other species         tion (76.0 %), industrial manufacturing (44.0 %), and vehicle
such as aromatics (0 %–1.8 %) in this factor. Therefore, it          exhaust (21.0 %). With the acceleration of emission control
was excluded from biomass burning but mainly identified              (DG20 II), the contribution of vehicle-related emissions was
as biogenic emissions. Figure 6 shows the variation in the           reduced as expected in vehicle exhaust (66.1 %) and gaso-
seven sources during the four periods. Clearly, anthropogenic        line evaporation (61.8 %) relative to DG20 I, while a signif-
sources such as solvent utilization, industrial manufacturing,       icant increase was also found in fuel combustion with the
vehicle exhaust, fuel combustion, and industrial chemical            increment of 0.7 ppbv (152.6 %). After G20, the contribu-
feedstock were the predominant sources of the total VOCs             tions of vehicle-related emissions and industry-related emis-
before and after G20, as high as 52.4 %–81.7 %. Further-             sions both showed rebounds due to lifting a ban on industry,
more, anthropogenic emission showed significant reductions           power plant, and transport in and around Zhejiang Province.
during the G20 response to the stringent emission control. In        It should be mentioned that biogenic emissions also played
BG20, solvent utilization was the predominant contributor to         a role in the VOC mixing ratios, contributing from 0.81
VOC mixing ratios, contributing 1.88 ppbv, followed by ve-           to 1.29 ppbv. About 20.9 % of the total VOC mixing ratios
hicle exhaust (1.77 ppbv, 21.6 %), industrial manufacturing          could be ascribed to biogenic emissions, acting as the second
(1.55 ppbv, 19.0 %), biogenic emission (1.16 ppbv, 14.1 %),          major source, during the G20 II period. This indicated that
gasoline evaporation (0.83 ppbv, 10.1 %), and fuel combus-           biogenic VOCs might make more of a contribution to the
tion (0.35 ppbv, 4.3 %). The industry-related emissions (in-         VOC mixing ratios, especially when anthropogenic VOCs

Atmos. Chem. Phys., 20, 5391–5403, 2020                                                www.atmos-chem-phys.net/20/5391/2020/
G. Zhang et al.: Exploring the inconsistent variations in atmospheric primary and secondary pollutants                                5399

                                                                       Figure 5. Seven source profiles and their respective contribution
                                                                       resolved from PMF model. The bars are the profiles (ppbv, left axis),
                                                                       and the dots are the percentage contribution (%, right axis) from
                                                                       individual factors.
Figure 4. Sensitivity of PAN (a) and O3 (b) production rate to major
precursor groups and individual species (09:00–17:00 CST). Error
bars are standard deviations.                                          ined the fire spots derived from the NCAR Fire Inventory
                                                                       version 1.5 (FINNV1.5) in eastern China before, during, and
                                                                       after the period of 2016 G20 (see Fig. S4). Straw combus-
were substantially reduced following the process of control            tion was excluded according to the decrease in the number
measures.                                                              of fire spots in the same time period from BG20 to AG20.
   Moreover, we quantified their respective ozone formation            As mentioned above, industrial processes with coal combus-
potential (OFP) before, during, and after G20 by using the             tion were strictly limited throughout the whole G20 period.
latest maximum incremental reactivity (MIR) and the ap-                To ensure clean energy was used in 2016 G20, local govern-
pointed concentration profiles above (see Fig. 7). Overall, the        ments accelerated a supply of liquid natural gas during the
total OFP in DG20 was significantly reduced by the imple-              13th Five-Year Plan period in Hangzhou. In 2016, the con-
ment of stringent control measures compared with BG20 and              sumption amounts of natural gas and liquid petroleum gas
AG20. Specifically, the OFPs of solvent utilization, industrial        both increased up to 4.55×10⁹ kg (54.4 %) and 5.09×10⁸ kg
manufacturing, and vehicle exhaust both showed significant             (13.4 %) compared with those in 2015, respectively (Statis-
decreases (17.3 %–77.2 %) compared with BG20, while fuel               tics Bureau of Zhejiang Province, 2016, 2017). Thus, liquid
combustion significantly increased by 52.2 % with the OFP              natural gas and petroleum gas were identified as the ma-
of 6.9 ppbv, accounting for 25.6 % of the total during G20.            jor fuel used residentially during G20. After G20, all an-
Thus, it is clear that the high OFP of fuel combustion con-            thropogenic sources showed significant increments of OFP,
tributed by ethylene was also responsible for the enhanced             among which the fastest growth of a source was vehi-
concentration of O3 during G20. Such a high OFP from fuel              cle exhaust (17.6 ppbv, 638.4 %), followed by fuel combus-
combustion was also elucidated in APEC in Beijing (Li et               tion (9.4 ppbv, 35.1 %), industrial manufacturing (7.7 ppbv,
al., 2015). To classify the specific fuel type, we first exam-         89.2 %), and solvent utilization (7.4 ppbv, 258.1 %).

www.atmos-chem-phys.net/20/5391/2020/                                                    Atmos. Chem. Phys., 20, 5391–5403, 2020
5400 G. Zhang et al.: Exploring the inconsistent variations in atmospheric primary and secondary pollutants
Figure 6. Variation in the sources (percentage) during the four periods.
we found acetaldehyde and methylglyoxal (MGLY) to be
the most important second-generation precursors of PAN, ac-
counting for 37.3 %–51.6 % and 22.8 %–29.5 % of the total
production rates. Furthermore, we confirmed that the pro-
duction of PAN was sensitive to anthropogenic and biogenic
VOCs (isoprene) throughout the whole period, specifically
aromatics in BG20 and DG20 I but also alkenes in AG20.
Similarly, the sensitivity of ozone formation was also un-
der a VOC-limited regime throughout the G20 period. These
findings suggest that reducing emissions of alkanes, alkenes,
and aromatics would mitigate photochemical smog, includ-
ing PAN and O3 formation. Furthermore, traffic (vehicle ex-
haust and gasoline evaporation) and industrial sources (sol-
vent utilization, industrial manufacturing, and chemical feed-
stock) were found to be the major VOC sources before G20,
Figure 7. Ozone formation potential (ppbv) of each source before, accounting for ca. 50.0 % and 31.7 % of the total, respec-
during, and after the control period during 2016 G20 in China.
tively, with ozone formation potential (OFP) of 14.4 and
16.1 ppbv. Large decreases were found in the sources and
OFPs of solvent utilization (74.1 % and 17.3 %), followed
4 Conclusions by vehicle exhaust (57.4 % and 77.2 %) and industrial manu-
facturing (56.0 % and 40.3 %) response to the stringent con-
In this study, ground-based concentrations of atmospheric trol measures during G20. We recommend paying attention
trace gases and particulate matter, together with meteoro- to controlling fuel combustion and biogenic emissions, es-
logical parameters, were measured at a NRCS site in ur- pecially when anthropogenic VOCs have been substantially
ban Hangzhou before, during, and after G20. We found sig- reduced following control measures.
nificant decreases in atmospheric VOCs, PM2.5 , NOx , and
SO2 in DG20 relative to BG20 and AG20, under unfavor-
able meteorological conditions (e.g., stable weather pattern Data availability. The data in the figures in both the main text and
and regional transport). This evidence indicated that the pow- the Supplement are available upon request to the corresponding au-
erful control measures had an effect on their emissions in thor (Gen Zhang, zhanggen@cma.gov.cn).
Hangzhou. Conversely, observed DMA8 O3 increased from
BG20 to DG20 I, which was attributed to regional transport
from the northern provinces and enhanced solar radiation in- Supplement. The supplement related to this article is available on-
tensity. Then it decreased from DG20 II to AG20. The de- line at: https://doi.org/10.5194/acp-20-5391-2020-supplement.
creases in the peak concentration of daily O3 and the OFP
estimated from various VOC sources both suggested the ef-
fectiveness of stringent control measures in reducing atmo- Author contributions. GZ and HX designed the research. HW, BQ,
spheric O3 concentrations. Unlike O3 , PAN exhibited a grad- RD, and XM performed research. GZ, LX, JH, WX, CL, LL, ZL,
ual decrease from BG20 to DG20. With the OBM model, KG, YY, and WJ analyzed data. GZ, HX, and LX wrote the paper.
Atmos. Chem. Phys., 20, 5391–5403, 2020 www.atmos-chem-phys.net/20/5391/2020/G. Zhang et al.: Exploring the inconsistent variations in atmospheric primary and secondary pollutants 5401
Competing interests. The authors declare that they have no conflict Guenther, A., Hewitt, C. N., Erickson, D., Fall, R., Geron, C.,
of interest. Graedel, T., Harley, P., Klinger, L., Manuel, L., Mckay, W. A.,
Pierce, T., Scholes, B., Steinbrecher, R., Tallamraju, R., Taylor,
J., and Zimmerman, P.: A global model of natural volatile organic
Acknowledgements. The authors appreciate the editor and four compound emissions, J. Geophys. Res.-Atmos., 100, 8873–8892,
anonymous reviewers for their valuable comments. The authors are 1995.
grateful to Xiaobin Xu for the help in discussions. Hopke, P. K.: Recent developments in receptor modeling, J.
Chemometr., 17, 255–265, 2003.
Huang, R. J., Zhang, Y. L., Bozzetti, C., Ho, K. F., Cao, J. J., Han,
Financial support. This research has been supported by the Na- Y. M., Daellenbach, K. R., Slowik, J. G., Platt, S. M., Canonaco,
tional Key Research and Development Program of China (grant F., Zotter, P., Wolf, R., Pieber, S. M., Bruns, E. A., Crippa, M.,
no. 2016YFC0202300), the National Natural Science Foundation Ciarelli, G., Piazzalunga, A., Schwikowski, M., Abbaszade, G.,
of China (grant nos. 41775127 and 41505108), Basic Research Schnelle-Kreis, J., Zimmermann, R., An, Z. S., Szidat, S., Bal-
Fund of CAMS (2020Z002), the State Environmental Protection tensperger, U., El Haddad, I., and Prevot, A. S. H.: High sec-
Key Laboratory of the Cause and Prevention of Urban Air Pol- ondary aerosol contribution to particulate pollution during haze
lution Complex (grant no. Y201701), and the Zhejiang Provincial events in China, Nature, 514, 218–222, 2014.
National Science Foundation (grant no. LY19D050002). Jenkin, M. E., Saunders, S. M., Wagner, V., and Pilling, M. J.:
Protocol for the development of the Master Chemical Mecha-
nism, MCM v3 (Part B): tropospheric degradation of aromatic
volatile organic compounds, Atmos. Chem. Phys., 3, 181–193,
Review statement. This paper was edited by Rolf Müller and re-
https://doi.org/10.5194/acp-3-181-2003, 2003.
viewed by four anonymous referees.
Kondo, Y., Morino, Y., Fukuda, M., Kanaya, Y., Miyazaki, Y.,
Takegawa, N., Tanimoto, H., McKenzie, R., Johnston, P., Blake,
D. R., Murayama, T., and Koike, M.: Formation and trans-
port of oxidized reactive nitrogen, ozone, and secondary or-
References ganic aerosol in Tokyo, J. Geophys. Res.-Atmos., 113, D21310,
https://doi.org/10.1029/2008JD010134, 2008.
Cai, C., Geng, F., Tie, X., Yu, Q., and An, J.: Characteristics and Koukouli, M. E., Balis, D. S., van der A, R. J., Theys, N., Hedelt, P.,
source apportionment of VOCs measured in Shanghai, China, Richter, A., Krotkov, N., Li, C., and Taylor, M.: Anthropogenic
Atmos. Environ., 44, 5005–5014, 2010. sulphur dioxide load over China as observed from different satel-
Chameides, W. L., Xingsheng, L., Xiaoyan, T., Xiuji, Z., Luo, C., lite sensors, Atmos. Environ., 145, 45–59, 2016.
Kiang, C. S., St. John, J., Saylor, R. D., Liu, S. C., Lam, K. S., LaFranchi, B. W., Wolfe, G. M., Thornton, J. A., Harrold, S. A.,
Wang, T., and Giorgi, F.: Is ozone pollution affecting crop yields Browne, E. C., Min, K. E., Wooldridge, P. J., Gilman, J. B.,
in China?, Geophys. Res. Lett., 26, 867–870, 1999. Kuster, W. C., Goldan, P. D., de Gouw, J. A., McKay, M., Gold-
Cheng, Y. F., Zheng, G. J., Wei, C., Mu, Q., Zheng, B., Wang, Z. B., stein, A. H., Ren, X., Mao, J., and Cohen, R. C.: Closing the
Gao, M., Zhang, Q., He, K. B., Carmichael, G., Pöschl, U., and peroxy acetyl nitrate budget: observations of acyl peroxy nitrates
Su, H.: Reactive nitrogen chemistry in aerosol water as a source (PAN, PPN, and MPAN) during BEARPEX 2007, Atmos. Chem.
of sulfate during haze events in China, Sci. Adv., 2, e1601530, Phys., 9, 7623–7641, https://doi.org/10.5194/acp-9-7623-2009,
https://doi.org/10.1126/sciadv.1601530, 2016. 2009.
de Foy, B., Lu, Z. F., and Streets, D. G.: Satellite NO2 re- Li, J., Xie, S. D., Zeng, L. M., Li, L. Y., Li, Y. Q., and Wu, R.
trievals suggest China has exceeded its NOx reduction goals R.: Characterization of ambient volatile organic compounds and
from the twelfth Five-Year Plan, Sci. Rep.-UK, 6, 35912, their sources in Beijing, before, during, and after Asia-Pacific
https://doi.org/10.1038/srep35912, 2016. Economic Cooperation China 2014, Atmos. Chem. Phys., 15,
Ding, A. J., Fu, C. B., Yang, X. Q., Sun, J. N., Zheng, L. F., Xie, 7945–7959, https://doi.org/10.5194/acp-15-7945-2015, 2015.
Y. N., Herrmann, E., Nie, W., Petäjä, T., Kerminen, V.-M., and Li, K., Li, J., Wang, W., Tong, S., Liggio, J., and Ge, M.: Evaluating
Kulmala, M.: Ozone and fine particle in the western Yangtze the effectiveness of joint emission control policies on the reduc-
River Delta: an overview of 1 yr data at the SORPES station, At- tion of ambient VOCs: Implications from observation during the
mos. Chem. Phys., 13, 5813–5830, https://doi.org/10.5194/acp- 2014 APEC summit in suburban Beijing, Atmos. Environ., 164,
13-5813-2013, 2013. 117–127, 2017.
Feng, C., Gao, X., Tang, Y., and Zhang, Y.: Comparative life cycle Li, L., An, J. Y., Shi, Y. Y., Zhou, M., Yan, R. S., Huang, C., Wang,
environmental assessment of flue gas desulphurization technolo- H. L., Lou, S. R., Wang, Q., Lu, Q., and Wu, J.: Source appor-
gies in China, J. Clean. Prod., 68, 81–92, 2014. tionment of surface ozone in the Yangtze River Delta, China in
Gao, Y., Liu, X., Zhao, C., and Zhang, M.: Emission controls ver- the summer of 2013, Atmos. Environ., 144, 194–207, 2016.
sus meteorological conditions in determining aerosol concentra- Li, Z., Xue, L., Yang, X., Zha, Q., Tham, Y. J., Yan, C., Louie, P. K.
tions in Beijing during the 2008 Olympic Games, Atmos. Chem. K., Luk, C. W. Y., Wang, T., and Wang, W.: Oxidizing capacity of
Phys., 11, 12437–12451, https://doi.org/10.5194/acp-11-12437- the rural atmosphere in Hong Kong, Southern China, Sci. Total
2011, 2011. Environ., 612, 1114–1122, 2018.
Geng, F. H, Zhao, C. S, Tang, X., Lu, G. L, and Tie, X. X: Analysis
of ozone and VOCs measured in Shanghai: A case study, Atmos.
Environ., 41, 989–1001, 2007.
www.atmos-chem-phys.net/20/5391/2020/ Atmos. Chem. Phys., 20, 5391–5403, 20205402 G. Zhang et al.: Exploring the inconsistent variations in atmospheric primary and secondary pollutants Liu, Y., Shao, M., Fu, L., Lu, S., Zeng, L., and Tang, D.: Source pro- Wang, Y. Q., Zhang, X. Y., Arimoto, R., Cao, J. J., and Shen, Z. X.: files of volatile organic compounds (VOCs) measured in China: The transport pathways and sources of PM10 pollution in Bei- Part I, Atmos. Environ., 42, 6247–6260, 2008. jing during spring 2001, 2002 and 2003, Geophys. Res. Lett., 31, Liu, Z., Wang, Y. H., Gu, D. S., Zhao, C., Huey, L. G., Stickel, R., L14110, https://doi.org/10.1029/2004GL019732, 2004. Liao, J., Shao, M., Zhu, T., Zeng, L. M., Liu, S. C., Chang, C. C., Wang, Y. G., Ying, Q., Hu, J. L., and Zhang, H. L.: Spatial and Amoroso, A., and Costabile, F.: Evidence of reactive aromatics temporal variations of six criteria air pollutants in 31 provincial as a major source of peroxy acetyl nitrate over China, Environ. capital cities in China during 2013–2014, Environ. Int., 73, 413– Sci. Technol., 44, 7017–7022, 2010. 422, 2014. McCarthy, M. C., Aklilu, Y.-A., Brown, S. G., and Lyder, D. A.: Watson, J. G., Chow, J. C., and Fujita, E. M.: Review of volatile Source apportionment of volatile organic compounds measured organic compound source apportionment by chemical mass bal- in Edmonton, Alberta, Atmos. Environ., 81, 504–516, 2013. ance, Atmos. Environ., 35, 1567–1584, 2001. McFadyen, G. G. and Cape, J. N.: Peroxyacetyl nitrate in eastern Williams, J., Roberts, J. M., Bertman, S. B., Stroud, C. A., Fehsen- Scotland, Sci. Total Environ., 337, 213–222, 2005. feld, F. C., Baumann, K., Buhr, M. P., Knapp, K., Murphy, P. C., Miao, Y. C., and Liu, S. H.: Linkages between aerosol pollution and Nowick, M., and Williams, E. J.: A method for the airborne mea- planetary boundary layer structure in China, Sci. Total Environ., surement of PAN, PPN, and MPAN, J. Geophys. Res.-Atmos., 650, 288–296, 2019. 105, 28943–28960, 2000. Miao, Y. C., Liu, S. H., Guo, J. P., Huang, S. X., Yan, Y., and Xu, Z., Liu, J. F., Zhang, Y. J., Liang, P., and Mu, Y. J.: Ambient lev- Lou, M. Y.: Unraveling the relationships between boundary els of atmospheric carbonyls in Beijing during the 2008 Olympic layer height and PM2.5 pollution in China based on four-year Games, J. Environ. Sci., 22, 1348–1356, 2010. radiosonde measurements, Environ. Pollut., 243, 1186–1195, Xue, L., Gu, R., Wang, T., Wang, X., Saunders, S., Blake, D., 2018. Louie, P. K. K., Luk, C. W. Y., Simpson, I., Xu, Z., Wang, Z., Mo, Z., Shao, M., Lu, S., Qu, H., Zhou, M., Sun, J., and Gou, Gao, Y., Lee, S., Mellouki, A., and Wang, W.: Oxidative capac- B.: Process-specific emission characteristics of volatile organic ity and radical chemistry in the polluted atmosphere of Hong compounds (VOCs) from petrochemical facilities in the Yangtze Kong and Pearl River Delta region: analysis of a severe photo- River Delta, China, Sci. Total Environ., 533, 422–431, 2015. chemical smog episode, Atmos. Chem. Phys., 16, 9891–9903, Pentti, P. and Unto, T.: Positive matrix factorization: a non-negative https://doi.org/10.5194/acp-16-9891-2016, 2016. factor model with optimal utilization of error estimates of data Xue, L. K., Wang, T., Louie, P. K. K., Luk, C. W. Y., Blake, D. values, Environmetrics, 5, 111–126, 1994. R., and Xu, Z.: Increasing external effects negate local efforts Roberts, J. M., Stroud, C. A., Jobson, B. T., Trainer, M., Hereid, to control ozone air pollution: a case study of Hong Kong and D., Williams, E., Fehsenfeld, F., Brune, W., Martinez, M., and implications for other Chinese cities, Environ. Sci. Techol., 48, Harder, H.: Application of a sequential reaction model to PANs 10769–10775, 2014a. and aldehyde measurements in two urban areas, Geophys. Res. Xue, L. K., Wang, T., Gao, J., Ding, A. J., Zhou, X. H., Blake, D. R., Lett., 28, 4583–4586, 2001. Wang, X. F., Saunders, S. M., Fan, S. J., Zuo, H. C., Zhang, Q. Z., Saunders, S. M., Jenkin, M. E., Derwent, R. G., and Pilling, M. and Wang, W. X.: Ground-level ozone in four Chinese cities: pre- J.: Protocol for the development of the Master Chemical Mech- cursors, regional transport and heterogeneous processes, Atmos. anism, MCM v3 (Part A): tropospheric degradation of non- Chem. Phys., 14, 13175–13188, https://doi.org/10.5194/acp-14- aromatic volatile organic compounds, Atmos. Chem. Phys., 3, 13175-2014, 2014b. 161–180, https://doi.org/10.5194/acp-3-161-2003, 2003. Xue, L. K., Wang, T., Wang, X. F., Blake, D. R., Gao, J., Nie, W., Shao, M., Lu, S. H., Liu, Y., Xie, X., Chang, C. C., Huang, Gao, R., Gao, X. M., Xu, Z., Ding, A. J., Huang, Y., Lee, S. C., S., and Chen, Z. M.: Volatile organic compounds mea- Chen, Y. Z., Wang, S. L., Chai, F. H., Zhang, Q. Z., and Wang, W. sured in summer in Beijing and their role in ground-level X.: On the use of an explicit chemical mechanism to dissect per- ozone formation, J. Geophys. Res.-Atmos., 114, D00G06, oxy acetyl nitrate formation, Environ. Pollut., 195, 39–47, 2014c. https://doi.org/10.1029/2008JD010863, 2009. Zhang, G., Mu, Y. J., Liu, J. F., and Mellouki, A.: Direct and Statistics Bureau of Zhejiang Province: Zhejiang Statistical Year- simultaneous determination of trace-level carbon tetrachloride, book, China Statistical Publishing House, Beijing, 646 pp., 2016. peroxyacetyl nitrate, and peroxypropionyl nitrate using gas Statistics Bureau of Zhejiang Province: Zhejiang Statistical Year- chromatography-electron capture detection, J. Chromatogr. A, book, China Statistical Publishing House, Beijing, 663 pp., 2017. 1266, 110–115, 2012. Verstraeten, W. W., Neu, J. L., Williams, J. E., Bowman, K. W., Zhang, G., Mu, Y. J., Liu, J. F., Zhang, C. L., Zhang, Y. Y., Zhang, Worden, J. R., and Boersma, K. F.: Rapid increases in tropo- Y. J., and Zhang, H. X.: Seasonal and diurnal variations of atmo- spheric ozone production and export from China, Nat. Geosci, spheric peroxyacetyl nitrate, peroxypropionyl nitrate, and carbon 8, 690–695, 2015. tetrachloride in Beijing, J. Environ. Sci., 26, 65–74, 2014. Wang, Q., Geng, C., Lu, S., Chen, W., and Shao, M.: Emission Zhang, G., Mu, Y. J., Zhou, L. X., Zhang, C. L., Zhang, Y. Y., Liu, J. factors of gaseous carbonaceous species from residential com- F., Fang, S. X., and Yao, B.: Summertime distributions of perox- bustion of coal and crop residue briquettes, Front. Environ. Sci. yacetyl nitrate (PAN) and peroxypropionyl nitrate (PPN) in Bei- Eng., 7, 66–76, 2013. jing: Understanding the sources and major sink of PAN, Atmos. Wang, T., Xue, L. K., Brimblecombe, P., Lam, Y. F., Li, L., and Environ., 103, 289–296, 2015. Zhang, L.: Ozone pollution in China: A review of concentrations, Zhang, G., Xu, H., Qi, B., Du, R., Gui, K., Wang, H., Jiang, meteorological influences, chemical precursors, and effects, Sci. W., Liang, L., and Xu, W.: Characterization of atmospheric Total. Environ., 575, 1582–1596, 2017. trace gases and particulate matter in Hangzhou, China, At- Atmos. Chem. Phys., 20, 5391–5403, 2020 www.atmos-chem-phys.net/20/5391/2020/
You can also read