The evolution of microphysical and optical properties of an A380 contrail in the vortex phase
←
→
Page content transcription
If your browser does not render page correctly, please read the page content below
Atmos. Chem. Phys., 12, 6629–6643, 2012
www.atmos-chem-phys.net/12/6629/2012/                                                                     Atmospheric
doi:10.5194/acp-12-6629-2012                                                                                Chemistry
© Author(s) 2012. CC Attribution 3.0 License.                                                             and Physics

The evolution of microphysical and optical properties of an A380
contrail in the vortex phase
J.-F. Gayet1 , V. Shcherbakov1,2 , C. Voigt3,4 , U. Schumann3 , D. Schäuble3 , P. Jessberger3 , A. Petzold3 , A. Minikin3 ,
H. Schlager3 , O. Dubovik5 , and T. Lapyonok5
1 LAMP,    UMR6016 CNRS/Université Blaise Pascal, Clermont-Ferrand, France
2 LAMP,    Institut Universitaire de Technologie d’Allier, Montluçon, France
3 Institut für Physik der Atmosphäre, Deutsches Zentrum für Luft- und Raumfahrt (DLR), Oberpfaffenhofen, Germany
4 Institut für Physik der Atmosphäre, Johannes Gutenberg Universität Mainz, Mainz, Germany
5 LOA, UMR 8518 CNRS/Université des Sciences et Technologies de Lille, Villeneuve d’Ascq, France

Correspondence to: J.-F. Gayet (j.f.gayet@opgc.univ-bpclermont.fr)

Received: 24 June 2011 – Published in Atmos. Chem. Phys. Discuss.: 28 September 2011
Revised: 10 May 2012 – Accepted: 9 July 2012 – Published: 26 July 2012

Abstract. A contrail from a large-body A380 aircraft at            size with an inversion code shows that the number fraction of
cruise in the humid upper troposphere has been probed with         aspherical ice crystals increased from 2 % initially to 56 % at
in-situ instruments onboard the DLR research aircraft Fal-         4 min contrail age. The observed crystal size and habit dif-
con. The contrail was sampled during 700 s measurement             ferences in the primary and secondary wakes of an up to
time at contrail ages of about 1–4 min. The contrail was in        4 min old contrail are of interest for understanding ice crystal
the vortex regime during which the primary wake vortices           growth in contrails and their climate impact. Aspherical con-
were sinking 270 m below the A380 flight level while the           trail ice particles cause less radiative forcing than spherical
secondary wake remained above. Contrail properties were            ones.
sampled separately in the primary wake at 90 and 115 s con-
trail age and nearly continously in the secondary wake at
contrail ages from 70 s to 220 s. The scattering phase func-
tions of the contrail particles were measured with a polar         1   Introduction
nephelometer. The asymmetry parameter derived from these
data is used to distinguish between quasi-spherical and as-        Contrails may have a climate impact similar in magnitude
pherical ice particles. In the primary wake, quasi-spherical       to the radiative forcing from aircraft CO2 emissions (Lee et
ice particles were found with concentrations up to 160 cm−3 ,      al., 2009, 2010; Burkhardt and Kärcher, 2011; Schumann et
mean effective diameter Deff of 3.7 µm, maximum extinction         al., 2012). Still the uncertainties of this estimate are large
of 7.0 km−1 , and ice water content (IWC) of 3 mg m−3 at           (Heymsfield et al., 2010; Burkhardt et al., 2010; Toohey et
slightly ice-subsaturated conditions. The secondary and pri-       al., 2010). In particular, information on ice particle shape is
mary wakes were separated by an almost particle-free wake          missing (Yang et al., 2010) which may modify the radiative
vortex gap. The secondary wake contained clearly aspherical        forcing estimate from contrails. The shape of ice crystals de-
contrail ice particles with mean Deff of 4.8 µm, mean (maxi-       termines the forward scattering ratio (g), which in turn has
mum) concentration, extinction, and IWC of 80 (350) cm−3 ,         a strong impact on the cloud reflectance and hence on the
1.6 (5.0) km−1 , and 2.5 (10) mg m−3 , respectively, at condi-     shortwave radiative forcing (Meerkötter et al., 1999; Yang et
tions apparently above ice-saturation. The asymmetry pa-           al., 2010; Schumann et al., 2012).
rameter in the secondary wake decreased with contrail age             Contrails form typically within one wingspan behind the
from 0.87 to 0.80 on average indicating a preferential aspher-     aircraft at temperatures below −40 ◦ C when saturation with
ical ice crystal growth. A retrieval of ice particle habit and     respect to liquid water is reached in the exhaust plume (Schu-
                                                                   mann, 1996). After the jet phase, the engine emissions are

Published by Copernicus Publications on behalf of the European Geosciences Union.
6630 J.-F. Gayet et al.: A380 contrail in the vortex phase captured within two counter-rotating wake vortices in the Quasi-spherical particles have an aspect ratio near one as far downwash behind the aircraft induced by the aircraft lift as measurable. Ice formation in contrails results from freez- (Scorer and Davenport, 1970). The primary vortices descend ing in liquid water droplets which favor a primary quasi- downwards until the rotational vortex motion gets unstable, spherical shape of the fresh ice particles. Quasi-spherical turbulent and dissipates. The maximum sinking distance de- shape of the fresh ice particles have been reported from lab- pends on ambient stratification, shear, and turbulence and oratory studies (Gonda and Takahashi, 1984). From photos on aircraft properties (Lewellen and Lewellen, 2001; Suss- of particles collected on a replicator, Schröder et al. (2000) mann and Gierens, 2001; Holzäpfel, 2003; Unterstrasser, found mainly quasi-spherical ice particles of a few µm sizes. 2008; Misaka et al., 2012; Schumann 2012). Ice crystals Febvre et al. (2009) measured ice particles in young con- form early in the jet phase within some tenths of a second. trails using a polar nephelometer and size spectrometers sim- They nucleate in liquid droplets formed by condensation in ilar to the present study and found that the optical properties the liquid-supersaturated exhaust jets on coated and activated were controlled mainly by quasi-spherical ice particles with soot particles emitted from the aircraft engine or in back- Deff below 5 µm, while larger aspherical ice crystals gov- ground aerosol, which is entrained into the exhaust plume ern the optical properties of 20 min old contrails. Kübbeler (Kärcher and Yu, 2009). Some ice crystals remain near the et al. (2011) interpret observations of large cirrus ice crys- flight level or are detrained from the descending vortices. tals in spreading contrails to originate mainly from ambient They form the secondary wake contrail. A large fraction of cirrus. the ice crystals remains in the primary wake (Lewellen and Similarly, extinction measurements in young contrails are Lewellen, 2001; Sussmann and Gierens, 2001). During ice scarce. Sussmann and Gierens (1999) report Lidar extinc- particle formation, humidity inside the contrail drops to ice tion profiles with peak values of 3 to 70 km−1 in a 20 s old saturation. Thereafter, ice particles may grow only from hu- contrail. Extinctions near 1 km−1 are reported by Voigt et midity entrained from ice-supersaturated ambient air. In sub- al. (2010, 2011) in 1–5 min old contrails based on calcula- saturated ambient air, the contrail particles start sublimat- tions from ice crystal size distributions. Febvre et al. (2009) ing. The humidity inside the wake gets further reduced dur- measured extinctions between 0.3–0.5 km−1 in less than ing descent when the air in the sinking primary wake gets 20 min old contrails. compressed and, hence, adiabatically heated (Lewellen and Measuring ice crystal concentration, size, shape and ex- Lewellen, 2001; Unterstrasser and Gierens, 2010). Sussmann tinction of contrails in the vortex phase is crucial for the and Gierens (1999) simulated the impact of ambient humid- initialization and validation of contrail models, since it de- ity on contrail formation including vortex descent and com- termines contrail evolution (Lewellen and Lewellen, 2001; pared the results to Lidar observations. However, only a few Unterstrasser et al., 2008; Unterstrasser and Gierens, 2010; in-situ measurements of contrails in the vortex phase exist Paugam et al., 2010; Naiman et al., 2011; Schumann, 2012). (Heymsfield et al., 2010; Schumann et al., 2011a) and none In addition, improving our understanding on microphysical of them differentiates between contrail properties in the pri- and optical properties of young contrails may help to re- mary and in the secondary wake. duce the uncertainties in contrail radiative forcing (Yang et Previous studies revealed information on ice particle sizes al., 2010; Schumann et al., 2011a). The reduction of the cli- and concentrations. Ice crystals with effective diameters mate impact from contrails e.g. via the modification of jet Deff below 3.5 µm and number concentrations Ni above engine emissions (Kärcher and Yu, 2009) or via mitigation 1000 cm−3 have been detected in contrails younger than 10 s studies to avoid contrail formation regions (Mannstein et al., (Petzold et al., 1997; Heymsfield et al., 1998; Baumgardner 2005) requires a detailed knowledge on contrail formation and Gandrud, 1998). Voigt et al. (2010) measured ice crys- and growth. Therefore further measurements of aircraft con- tals with Deff of 5.2 µm and Ni slightly above 100 cm−3 in trails of different ages were encouraged (Toohey et al., 2010; the 1–2 min old contrail of a CRJ-2 aircraft. Deff of 4.8 µm Heymsfield et al., 2010). and Ni near 100 cm−3 were observed in an extensive data Here, we present in-situ observations of the contrail from a set of 14 sub-10 min old contrails from nine different aircraft large-body A380 aircraft in the vortex regime. The measure- (Voigt et al., 2011), including some results on the A380 case ments were performed with instruments onboard the DLR discussed further below. Poellot et al. (1999) and Schröder research aircraft Falcon during the CONCERT (CONtrail et al. (2000) measured contrails in the dispersion regime and Cirrus ExperRimenT) campaign from 22 October to 20 between 3 min and 1 h contrail age. These data were also November 2008 above Germany (Voigt et al., 2010). The used for comparison to contrail models (Unterstrasser and present analysis used more than 700 s of observation data in Gierens, 2010; Naiman et al., 2011; Schumann, 2012). The the 70 s to 220 s old contrail of an A380 aircraft sampled measurements and model results show that mean ice parti- on 19 November 2008. Microphysical and optical particle cle concentrations decrease and mean ice particle diameters properties of the primary and the secondary wakes are pre- increase in ice supersaturated air masses with contrail age. sented. We further investigate the evolution of the ice particle Less is known about ice particle shapes. Here, we dis- shape with contrail age in the secondary wake. An inversion tinguish between quasi-spherical and aspherical particles. approach is used to interpret the optical contrail properties Atmos. Chem. Phys., 12, 6629–6643, 2012 www.atmos-chem-phys.net/12/6629/2012/
J.-F. Gayet et al.: A380 contrail in the vortex phase                                                                       6631

in terms of the fraction of ice particles with non-spherical       of sphere deformation and waviness. It was shown that for a
shape. A closure study between different in-situ instruments       particle with diameter D of 4 µm (size parameter of 15.7 for
is given in Appendix A.                                            the PN laser wavelength of 0.8 µm) and for a diameter devi-
                                                                   ation from spherical of 1D = 0.1 D the error of the asym-
                                                                   metry parameter estimation is about 4 %. This means that
2     Instrumentation and methods                                  within the measurement errors on g, a sphere deformation
                                                                   of 10 % cannot be detected by the Polar Nephelometer be-
During the CONCERT campaign, the DLR Falcon research               cause the deformation effect is below the sensitivity of the
aircraft was equipped with a set of instruments to measure         instrument. The corresponding particles hereafter are called
microphysical particle properties and trace gas composition        “quasi-spherical”.
in the UTLS (Upper Troposphere/Lower Stratosphere) re-                The FSSP-300 (Baumgardner et al., 1992) measures scat-
gion. Voigt et al. (2010) provide a detailed description of the    tering light energy at forward angles which is governed
instruments installed on the aircraft. Below, we briefly intro-    mainly by diffraction and therefore depends on (i) the refrac-
duce the instruments used for our study.                           tive index of the particles, and (ii) the projected area of the
                                                                   particle which itself depends on the particle shape. The size
2.1    Particle probes                                             of an aspherical particle is expressed in terms of equivalent
                                                                   surface diameter, i.e. the diameter of a sphere that has the
Four particle instruments were used in under-wing stations         same projected area (Mishchenko et al., 1997). The method
to detect microphysical and optical properties of contrails        to calibrate the FSSP size for spherical and aspherical parti-
and cirrus clouds: (1) the Polar Nephelometer (PN), (2) the        cles is presented in Appendix A together with definitions of
Cloud Particle Imager (CPI), (3) the 2D-C, all operated by         the microphysical parameters used in this study (extinction
LaMP, and (4) the FSSP-300 operated by DLR. Thanks to the          coefficient Ext, ice water content IWC, and effective diam-
combination of these independent techniques, particles char-       eter Deff ). The effective diameter Deff , relevant for extinc-
acterization within a range of diameters varying from typi-        tion and optical depth, is defined as the ratio of volume V
cally 0.5 µm to 2 mm was possible. Since this study addresses      to projected cross-section area A, Deff = (3/2) V /A, where V
the properties of a young contrail with ice particle diameters     and A are computed from the given size distribution. For
smaller than 20 µm, only data of the Polar Nephelometer and        given ice water content IWC = ρice V and bulk ice density
the FSSP-300 are presented.                                        ρice (0.917 g cm−3 ), this diameter is also Deff = 3 V /Ext ∼
                                                                                                                               =3
   The Polar Nephelometer (Gayet et al., 1997) measures the        IWC/(ρice Ext) (Garret et al., 2003; Schumann et al., 2011a).
scattering phase function of an ensemble of cloud particles           According to Field et al. (2003) and Heymsfield (2007),
ranging from less than 1 µm to about 1 mm diameter, which          the FSSP-300 and Polar Nephelometer measurements are not
intersect a collimated laser beam (wavelength λ = 804 nm)          likely to be affected by ice crystal–shattering effects since
near the focal point of a parabolic mirror. The sampling           the recorded ice particles are quite small (effective diameter
volume is defined by the cross sectional area of the beam          of 4 µm, maximum particle diameter of 20 µm). The compar-
(10 mm long and 5 mm diameter) multiplied by the distance          ison of our contrail data to cirrus observations confirms this
travelled during the sample period, i.e. 1 d m−3 at a cruise       hypothesis (Schröder et al., 2000; Voigt et al., 2010).
speed of 200 m s−1 and a sampling frequency of 10 Hz. Di-
rect measurement of the scattering phase function allows to
distinguish particle types (water droplets or ice crystals) and    3   Trace gas instruments
to calculate optical parameters (extinction coefficient Ext and
                                                                   Measurements of water vapor inside and outside of ice clouds
asymmetry parameter g, see Gayet et al., 2002). The g-value
                                                                   have been performed with the high precision hygrometer
is used as indicator for sphericity; g decreases with increas-
                                                                   FISH (Fast In situ Stratospheric Hygrometer) operated by FZ
ing asphericity of the particles (Gayet et al., 2002). Non-
                                                                   Jülich (Zöger et al., 1999; Schiller et al., 2008) and a CR-2
absorbing ice particles randomly oriented in the sampling
                                                                   frost point hygrometer operated by DLR (Busen and Buck,
section are assumed in deriving bulk quantities. The accu-
                                                                   1995; Voigt et al., 2010; Schumann et al., 2011b). Both wa-
racies of the extinction coefficient and asymmetry parameter
                                                                   ter vapor instruments use a backward facing inlet to exclude
are 25 % and 4 % respectively (Gayet et al., 2002; Jourdan et
                                                                   the sampling of ice crystals, thus sample ambient water va-
al., 2010).
                                                                   por.
   For classification of sphericity and for assessment of errors
                                                                      The FISH instrument is based on the Lyman-α photofrag-
of the asymmetry parameter, we note the sensitivity of the
                                                                   ment fluorescence technique with a measurement frequency
Polar Nephelometer measurements to the particle-shape de-
                                                                   of 1 Hz. The overall uncertainties in the water vapor mix-
viation from a perfect sphere. Mugnai and Wiscombe (1986)
                                                                   ing ratio is ±6 % and in the relative humidity over ice (RHi )
used a model of Chebyshev particles to evaluate differences
                                                                   ±10% under the assumption of an uncertainty of 0.5 K in the
in optical properties between spherical and aspherical parti-
                                                                   temperature measurement (Kübbeler et al., 2011).
cles. They studied different aspherical particles as a function

www.atmos-chem-phys.net/12/6629/2012/                                              Atmos. Chem. Phys., 12, 6629–6643, 2012
6632 J.-F. Gayet et al.: A380 contrail in the vortex phase
The ambient air temperature was measured on the Falcon
with a calibrated PT100 Rosemount sensor and a second un-
calibrated one. The individual temperatures detected on that
flight differ systematically by about 0.5 K, but the calibration
result should be accurate to better than 0.5 K. Still this is a
potential source for a systematic underestimation of humid-
ity in the measurements on that day.
The frost point hygrometer CR-2 (Buck Research Instru-
ments) measures the temperature of a mirror carrying a thin
frost layer held in equilibrium with the ambient water vapor.
The detection limit of the frost point hygrometer is better
than 2 µmol mol−1 at a pressure of 200 hPa for a time res-
olution of 2 s. Depending on water vapor gradients, the re-
sponse time of the frost point hygrometer is in the order of
∼1 s–1 min. The uncertainty in the water vapor mixing ratio
is ±8 % (Schumann et al., 2011b). The uncertainty in RHi
again depends on the temperature uncertainty and amounts
to ±15 %, therefore.
NO and NOy mixing ratio measurements were performed
using the chemiluminescence technique (Schlager et al.,
1997). The technique has extensively been used in previous
campaigns for the identification of aircraft exhaust plumes
and for the detection of NO and NOy in contrails and cirrus
clouds (Schlager et al., 1997; Ziereis et al., 2000; Voigt et al.,
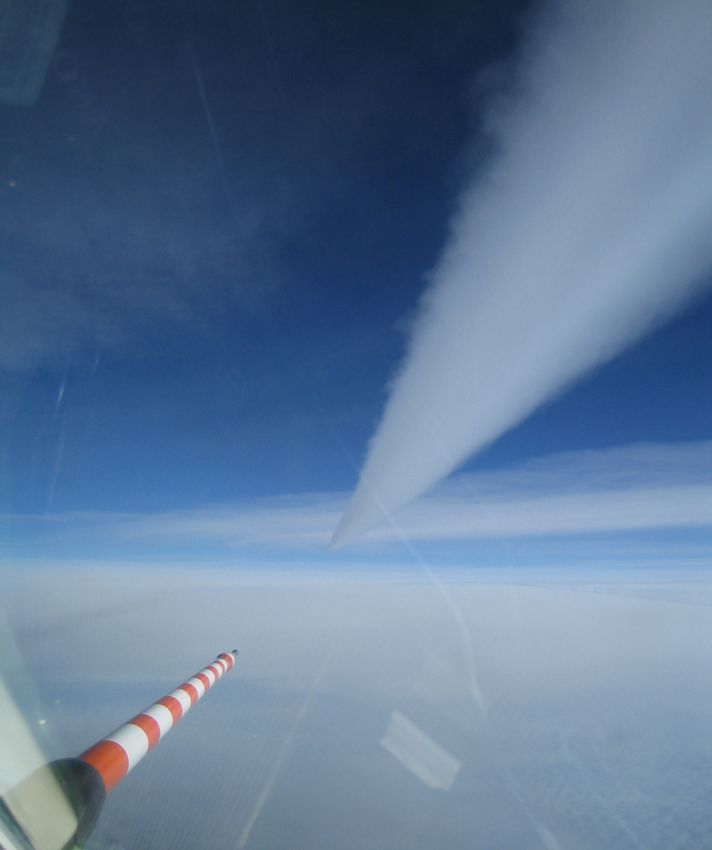
2006, 2007; Schäuble et al., 2009). Sample air passes through Fig. 1. Photo taken from the Falcon cockpit a few minutes prior the
a backward facing inlet with a fluoropolymer (PFA) tube to penetration to the A380 contrail (courtesy of T. Jurkat).
sample reactive nitrogen compounds from outside the air-
craft. Inside the cabin, the sample air is split into the NO and
NOy channels of the instrument. In the NOy channel, the air
first passes through a heated gold converter where the differ- northern Scandinavia transporting cold and humid air into
ent NOy compounds are reduced to NO using CO as catalyst. the upper troposphere over Germany. At noon that day, a
Subsequently the chemiluminescence reaction of NO with cirrus region moved from the north over Germany. The op-
O3 is detected. In young tropospheric aircraft plumes NOy tically thick A380 contrail was produced above this cirrus
is mainly composed of NO and NO2 . The accuracy/precision region and partly sandwiched in between thin cirrus layers
of the NO and NOy measurements are 7/10 % and 10/15 %, as shown on the photo in Fig. 1 taken a few min before the
respectively (Ziereis et al., 2000). The data are recorded with contrail sampling. At the flight level 350 hectofeet of the
a time resolution of 1 s. Here, we use the NOy measurements A380 (10 700 m, 239 hPa), the threshold temperature for con-
for the identification of contrails and the differentiation be- trail formation (for estimated ambient RHi at ice saturation
tween observations in the primary wake with NOy mixing and for an overall propulsion efficiency of 0.35) is −48.4 ◦ C
ratios >30 nmol mol−1 and in the secondary wake. (±1.2 ◦ C). The ambient temperature was −56.5 ◦ C, far be-
low the threshold temperature, so that contrail formation was
to be expected according to the Schmidt-Appleman criterion
4 Detection of the contrail from an A380 passenger (Schumann, 1996).
aircraft The Falcon pilots managed to track the contrail using vi-
sual navigation and the guidance of the European air traffic
Contrail observations were performed on 19 November 2008 controllers in Maastricht and the German air traffic control
on a flight over Germany from Hamburg to Oberpfaffen- (DFS). The real-time indication of several measurements on-
hofen. The contrail was generated by a commercial A380 board the aircraft (NO/NOy and CN data, as well as FSSP-
aircraft passing Germany at noon on its flight from London 300 and Polar Nephelometer counts) were used to confirm
to Singapore. It was detected for 16 min between 12:14 to the contrail penetrations and for guidance to adjust the flight
12:31 universal time (UT) at altitudes of 10 420–10 700 m, altitude. The Falcon successfully flew inside the contrail for
the upper level indicating the flight altitude of the A380 air- 16 min at a speed near 200 m s−1 , slightly lower than the
craft. The meteorological situation over Germany on that day A380 cruise speed, so that the observations were performed
was influenced by a high pressure system located northwest at contrail ages from about 70 s to 270 s progressively. The
of France over the Atlantic and a low pressure system over contrail was entered from below and penetrated shortly five
Atmos. Chem. Phys., 12, 6629–6643, 2012 www.atmos-chem-phys.net/12/6629/2012/J.-F. Gayet et al.: A380 contrail in the vortex phase 6633
100 150 200 250 Contrail age (s)
10700 Alt
(m)
10600
10500
10400
40 NOy
30 (nmol/mol)
20
10
0
110
100
90 RHi
80 (%)
300 N1
200 (cm-3)
100
0
6 Ext
(km-1)
4
2
0
0.88 g
0.84
0.82
0.015
IWC
0.010 (g/m3)
0.005
100
Deff
(µ
µm)
10
1
121000 121500 122000 122500 123000
A B Time (UTC) C
Figure 2
Fig. 2. Time-series at 1-s resolution of measured altitude, NOy mixing ratio, relative humidity with respect to ice (RHi ), concentrations
of particles with diameter greater than 0.9 µm (N1), extinction coefficient (Ext), asymmetry parameter (g), ice water content (IWC), and
effective diameter (Deff ). The top axis shows the separation time between the A380 and Falcon aircraft, indicating the A380 contrail age
versus sampling time. The color shading of the altitude time-series reflects this contrail age. The red and blue shaded areas in the top bar
represent sampling periods inside the primary and inside the secondary wake of the contrail, respectively. At the lower figure edge, arrows,
labeled A, B and C, identify periods selected for retrieval analysis (see Sect. 5).
times initially, followed by an extensive measurement period quence, changes of contrail properties with age may be par-
in the upper contrail part, which turned out to be the sec- tially caused by changes of ambient properties with space
ondary wake of the A380. A video movie taken from the along the A380 flight path.
cockpit of the Falcon confirms the penetration of the pri- Figure 2 displays time-series of the altitude, the NOy mix-
mary wake twice, which was clearly separated from the sec- ing ratio and the relative humidity with respect to ice (RHi )
ondary wake by a vertical wake gap. Later, mainly the sec- along with the microphysical and optical parameters of ice
ondary wake was probed. The vertical wake gap is typical for crystals such as the concentration of particles with diameter
twin/four engine aircraft and situations with scattered natural >0.9 µm (N1) derived from FSSP-300 data, the extinction
cirrus being present (see scenario 2 on Fig. 2 from Sussmann coefficient (Ext), and the asymmetry parameter (g) from Po-
and Gierens, 1999). lar Nephelometer (PN) data, and the ice water content (IWC)
The Falcon performed measurements flying along the con- and effective diameter (Deff ) derived from FSSP-300 data.
trail, sampling the contrail at different contrail ages. The The approximate contrail age at the sampling time is also re-
measurements neither provide a purely Lagrangian (at con- ported. The contrail age is computed from the observed A380
stant space coordinate versus time) nor Eulerian picture and Falcon flight tracks taking into account the plume mo-
(at constant time versus spatial coordinates). As a conse- tion for given wind speeds. The altitude time-series is color
www.atmos-chem-phys.net/12/6629/2012/ Atmos. Chem. Phys., 12, 6629–6643, 20126634 J.-F. Gayet et al.: A380 contrail in the vortex phase
Secondary
wake
Altitude (m)
Primary
vortex
a b c
0 10 20 30 40 50 0 100 200 300 400 0 50 100 150 200 250 300
NOy (nmol mol-1) N1 (cm-3) N3 (cm-3)
Secondary
wake
Altitude (m)
Primary
vortex
d e f
0 1 2 3 4 5 6 7 8 0 5 10 15 20 0 2 4 6 8 10 12 14
Extinction (km-1) IWC (mg m-3) Deff (µ
µm)
h Secondary
wake
Altitude (m)
Primary
vortex
g FISH means
CR-2 means
h
0.75 0.80 0.85 0.90 70 80 90 100 110
Asymmetry parameter RHi (%)
Figure 3
Fig. 3. Vertical distribution of parameters (1-s data) measured in the contrail from 12:14:00 UT to 12:26:00 UT (70–220 s contrail age,
see Fig. 2). (a): NOy mixing ratio, (b): concentration of particles d > 0.9 µm, (c): concentration of particles d > 2.5 µm, (d): extinction
coefficient (PN), (e): ice water content, (f): effective diameter, (g): asymmetry parameter, and (h): relative humidity over ice. Mean FISH and
CR-2 values are reported with error bars (±10 and ±15 %, respectively) which include systematic water vapor mixing ratio and temperature
errors. The colors of the symbols indicate contrail ages as shown in Fig. 2.
shaded as a function of contrail age in order to facilitate good agreement on average (see also Fig. A1b in Ap-
the discussion of the results represented on the next figure pendix A).
(Fig. 3). Small scale heterogeneities of the primary wake on the or-
The results show that the Falcon explored the contrail ver- der of the horizontal distances of the probe mounting posi-
tical structure five times from 10 450 m/−54.0 ◦ C to 10 700 tions on the Falcon (5–10 m) and a low sampling statistics
m/−56.5 ◦ C and thereafter remained near the 10 650 m level. reduce the representativeness of the derived mean contrail
Generally, the particle data are strongly correlated and FSSP- parameters in the primary wake, while the secondary wake is
300 and Polar Nephelometer measurements are in a very well captured by the observations.
Atmos. Chem. Phys., 12, 6629–6643, 2012 www.atmos-chem-phys.net/12/6629/2012/J.-F. Gayet et al.: A380 contrail in the vortex phase 6635
5 Vertical profile of microphysical and optical contrail the time-series in Fig. 2, near 12:15:37 and 12:17:40 UTC).
properties in the vortex regime Maximum Ext of 7.0 km−1 , IWC of 3 mg m−3 and Ni of
140 cm−3 were detected. Due to a low sampling statistics
Figure 3 displays the vertical profiles of several parame- and strong gradients in the observed particle fields, we re-
ters measured between the beginning of the contrail obser- frain from giving mean values for these parameters. Deff in
vations (12:14:00 UT, 70 s contrail age) until 12:26:00 UT the primary wake ranges between 3–6 µm, with mean value
(220 s contrail age, see Fig. 2). We ignore the contrail ob- of 3.7 µm. The asymmetry parameter g is maximal in the pri-
servations thereafter, at 220–270 s plume age, occasionally mary wake, reaching up to 0.87. This high value suggests that
containing large ice crystals mixed in from ambient cirrus the contrail particles in the primary wake are predominantly
clouds, characterized by sharp increases in Deff (see Fig. 2). spherical or quasi-spherical. This observation is consistent
As before, the shaded colors of the data points reflect the with the vertical humidity gradient within the contrail. The
contrail ages. We observe a general increase in NOy mix- pressure increase associated with the vortex sinking leads to
ing ratios with decreasing altitude. The highest NOy peak adiabatic heating and subsequent sublimation processes of
of up to 49 nmol mol−1 , indicating lowest dilution, is de- the ice crystals (Lewellen and Lewellen, 2001). The humid-
tected at the lowest sampling levels, in the primary wake. ity measurements of the Lyman-α and the frost point mea-
Assuming NOy mixing ratios >30 nmol mol−1 as represen- surements displayed on Fig. 3h are near saturation in the
tative for the primary wake, the primary wake altitudes are secondary wake at the upper level of the contrail and de-
found below 10 470 m (shadowed area in Fig. 3). Directly crease to 84 % in the lower part, the primary wake. Part of
above the primary wake vortex, the wake vortex gap with low the measured humidity profile may originate from vertical
concentrations of ice particles is observed. Above the pri- humidity variations also outside the contrail. However, in an
mary counter-rotating vortex pair, buoyancy and detrainment air parcel at ice saturation at p = 239 hPa, T = 217 K, de-
leaves a secondary wake with vertically decreasing particle scending adiabatically by 200 m without phase change, the
number concentrations (Gerz et al., 1998; Sussmann, 1999). humidity would reduce from 100 % to 78 %. The observed
Smaller mean NOy mixing ratios of about 6.4 nmol mol−1 humidity reduction reduction is slightly smaller possibly be-
are detected in the upper part of the secondary wake contrail cause of sublimating ice particles and entrainment of drier
near the flight altitude. Consequently, the secondary wake ex- ambient air. Hence the ice particles in the primary wake at
periences stronger dilution than the primary wake. ages larger 90 s, showing smallest measured sizes and largest
The altitude differences between the top and bottom of the asymmetry parameter values, were very likely sublimating.
contrail (∼270 m) at a contrail age of ∼110 s, implies a de- Sublimating ice particles become more spherical with time
scent speed of 2.5 m s−1 for the vortex pair. The theoretically (Nelson, 1998). Therefore the observations of near-spherical
expected initial downward vortex speed (w) is (see Holzäpfel ice particles in the primary wake are reasonable.
and Gerz, 1999):
5.2 Contrail properties in the secondary wake
w = −0/(2π b) (1)
with Quasi continuous observations were performed in the sec-
ondary wake at contrail ages 70–220 s (see blue shaded areas
b=s B (2) in Fig. 2). These observations were interrupted by two cross-
ings of the primary wake (red shaded bars) and two short
and periods outside the contrail indicated by white areas in the
top bar in Fig. 2. Hence, a representative set of data of mi-
0 = g M/(ρ b U ) (3) crophysical properties has been measured in the secondary
b is the initial vortex spacing, s the spanwise load factor (s = wake of the A380 at quasi-constant altitude near cruise alti-
π/4 for an elliptic loading), B the wingspan, 0 the wake vor- tude (10 600–10 700 m). The mean (maximum) values of N1,
tex circulation, M the aircraft mass, ρ the air density and U Ext and IWC are 80 (350) cm−3 , 1.6 (5.0) km−1 and of 2.5
the true airspeed. For the A380 aircraft (M = 500 Mg, B = (10) mg m−3 respectively. The mean Deff and g are 4.8 µm
80 m) flying at 10 500 m/−58 ◦ C (i.e. ρ = 0.383 kg m−3 ) at and 0.82 respectively. In a few cases, the effective diameter
U = 230 m s−1 for Mach 0.85, the expected wake sinking approaches 14 µm. These cases are likely caused by entrain-
velocity is w = 2.25 m s−1 . This value agrees well with the ment of larger ice crystals into the contrail, potentially pre-
observations. cipitating from the thin scattered cirrus clouds that was ob-
served above the A380 contrail (see Fig. 1). These large ice
5.1 Contrail properties in the primary wake crystals were detected from both 2D-C and CPI instruments.
Figure 3g shows the vertical profile of the asymmetry pa-
The primary wake has been observed twice for a dozen of rameter g as derived from the nephelometer measurements.
seconds at altitudes below 10 470 m at contrail ages of 90 Contrasting with the large scatter of the most other parti-
s and 115 s in the vortex regime (see red shaded areas on cle properties shown in Fig. 3 (explained by small scale
www.atmos-chem-phys.net/12/6629/2012/ Atmos. Chem. Phys., 12, 6629–6643, 20126636 J.-F. Gayet et al.: A380 contrail in the vortex phase
A
Angular scattering coefficent (µm sr )
1E-6
-1
6 measured
-1
10
Concentration (l-1 µm-1)
FSSP - Mie
fitted
n=1.31 χ=0.0005
4 1E-8 Aspect Ratio Distribution: 1,0
10 Residual 13.6 %
2
10
1E-10
Measured
0
10 Retrieved
1E-12
-1 0 1 2 0 20 40 60 80 100 120 140 160 180
10 10 10 10
Diameter (µ
µm) Scattering angle (°)
Angular scattering coefficent (µm sr )
1E-6
-1
6
10 measured
B
-1
Concentration (l-1 µm-1)
FSSP - Mie
fitted
n=1.31 χ=0.0005
4 1E-8 Aspect Ratio Distribution: 0.68
10 Residual 7.7 %
2
10
1E-10
Measured
0 Retrieved
10
measured 1E-12
-1 0 1 2 0 20 40 60 80 100 120 140 160 180
10 10 10 10
Diameter (µ
µm) Scattering angle (°)
Angular scattering coefficent (µm sr )
1E-6
-1
measured
C
Concentration (l-1 µm-1)
-1
FSSP - Mie
fitted
n=1.31 χ=0.0005
1E-8 Aspect Ratio Distribution: 0.442
Residual 9.7 %
1E-10
Measured
Retrieved
measured 1E-12
-1 0 1 2 0 20 40 60 80 100 120 140 160 180
10 10 10 10
Diameter (µ
µm) Scattering angle (°) Figu
Fig. 4. Left panel: Directly measured particle size distribution (FSSP-300, black lines) and particle size distribution retrieved from the
measured scattering phase function (solid black circles). Right panel: Average scattering phase function (solid red circles), theoretical phase
function (blue plus-symbols) calculated for spherical ice particles from the FSSP-300 size distribution, and retrieved (solid black circles)
scattering phase function. Cases A, B and C refer to the sampling times shown in Fig. 2 at different contrail ages, 50 s, 105 s and 205 s,
respectively.
heterogeneities of the plume), the vertical profile of g shows the g-values, the more aspherical particles are (Gayet et al.,
a rather smooth decrease with the altitude from 0.87 to 2002; Mishchenko et al., 2002: their Fig. 10.14). The FSSP-
0.80. Based on the measured effective diameters Deff > 3 µm 300 size response dependence on the particle shape is dis-
(Fig. 3f), the size parameter πDeff /λ is larger 10. For this size cussed in Appendix A.
range, the large g-values (>0.85 in our study) are character-
istic for spherical or quasi-spherical particles. The smaller
Atmos. Chem. Phys., 12, 6629–6643, 2012 www.atmos-chem-phys.net/12/6629/2012/J.-F. Gayet et al.: A380 contrail in the vortex phase 6637
ing the complex refractive index and parameters represent-
Spherical / aspherical partitioning (%)
0.90
Asymmetry parameter
100
0.86
ing size and shape distributions. The software is employed in
80 the operational processing of AERONET (AErosol RObotic
60 0.82 NETwork) for retrieving detailed properties from observa-
40 tions of ground-based sun/sky-radiometers (Eck et al., 2008).
0.78
20 In this work, the model was applied for the first time to the
0 0.74
analysis of ice particle observations in a fresh contrail with
0 50 100 150 200 250 0 50 100 150 200 250 diameters below 20 µm or size parameters below 80 (for the
Contrail age (s) Contrail age (s)
PN wavelength of 0.8 µm). It should be noted that the original
Fig. 5. (a) Spherical/aspherical partitioning ratio (SAR) and (b) kernels generated by Dubovik et al. (2006) cover the range of
asymmetry parameter g versus contrail age. The colored symbols the real part of the refractive index from 1.33 to 1.6. For pure
are the measured g-values as in Fig. 3g. The black dots represent water ice, at the laser wavelength of λ = 0.8 µm, we expect a
the mean retrieval results (see Sect. 5), and the red lines approximate
Figure 5 refractive index of about 1.31 + i1.3×10−7 . Therefore, the
fits. The single open circle shows the result of Febvre et al. (2009). kernels were extended down to 1.29 for our study.
The contrail clouds are modeled as a mixture of two par-
ticle types, one consisting of spherical and one of aspher-
6 Evolution of the partitioning of spherical and ical particles. Although ice particles are never ellipsoidal,
aspherical ice particles in the secondary wake of the we consider randomly oriented spheroids as a reasonable ap-
A380 contrail proximation of small aspherical ice particles. For the distri-
bution of axis ratios of the aspherical fraction, we assume
In the secondary wake, the mean asymmetry parameter g de- a mixture of oblate and prolate spheroids with the modes at
creases with contrail age from about 0.85 to 0.80, see Fig. 5b. the values of 0.5 and 1.5, respectively. Furthermore, the par-
Hence, these ice particles are progressively loosing spherical titioning ratio is assumed to be constant over the full size
shape and become more and more aspherical. The observed range of the particle size distribution.
increase of the effective diameters from 3.7 to 4.8 µm on av- Three representative examples of retrievals are discussed
erage (see Fig. 4f) and the formation of aspherical particles below. They were selected to represent the contrail in the sec-
during ageing of the secondary wake contrail imply uptake ondary wake at ages of 70 s, 105 s and 205 s. The correspond-
of water from ambient air. The measured amount of ice water ing time-sequences A, B and C are identified in the time-
content in the contrails cannot be explained with the amount series in Fig. 2 by horizontal arrows. In Fig. 4a–c, the left
of water emitted by the aircraft engines alone (Schumann, panel displays the particle size distribution measured with
2012; Voigt et al., 2011). Instead, RHi in the secondary wake FSSP-300 together with the retrieved one. The size distri-
contrail or in the air entrained into the spreading contrail bution was retrieved along with the refractive index and the
must have been significantly above 100 % over the contrail spherical/aspherical partitioning ratio (SAR) of ice particles.
life time on average. At the time of contrail observation, the In the following, the SAR defines the percentage in number
dense contrail might have taken up all previously available of spherical particles relative to the total number of particles.
supersaturation and just arrived at saturation. The measured We underscore that the information content of the PN data
RHi is systematically below saturation inside the secondary- is inadequate to retrieve a size-dependent partitioning ratio.
wake contrail. However, a small systematic correction by just Variations of the shape and/or the refractive index (from 1.31
7 % would bring the mean RHi from 93 % to 100 %. Before to 1.33) of small particles lead to variations of a phase func-
and after the measurements inside the contrail, the RHi time tion that are smaller than the PN measurement errors.
series (see Fig. 2) also contains some weak hints to supersat- Table 1 summarizes the results. For all three cases, the re-
uration in ambient air, in particular when increased by 7 %. trieved real part of the refractive index was 1.31±0.002. The
Hence, within the experimental uncertainties of the water va- retrievals indicate that the particles were either nonabsorbing
por and temperature instruments (±10–15 % in RHi ), the ob- or weakly absorbing with an upper bound for the imaginary
servations are consistent with ice saturation inside the con- part of 10−4 . Variations of the phase functions for the imag-
trail and ice supersaturation outside. inary part within the interval [0; 10−4 ] are smaller than the
In order to determine the fraction of aspherical ice par- measurement errors (Verhaege et al., 2008). For case A, the
ticles and their temporal evolution in the secondary wake retrieval results imply that the SAR value was larger than
contrail, we use the inversion code developed by Dubovik et 98 %; the SAR estimation error was ±3 % for other cases.
al. (2006). This code contains kernel look-up tables which al- Measured and retrieved averaged scattering phase func-
low describing the ensemble of ice particels as an “aerosol” tions are plotted in Fig. 4 for the three cases, A, B, and C,
composed of a mixture of spheroids of different aspect ra- corresponding to increasing contrail ages. The right panel of
tios and sizes. The code has been used for remote sensing Fig. 4a–c shows the phase functions (without normalization)
retrievals of atmospheric aerosols. The code offers the possi- measured by the Polar Nephelometer and the FSSP phase
bility to retrieve a complete set of aerosol parameters, includ- function as calculated from the FSSP-300 size distribution
www.atmos-chem-phys.net/12/6629/2012/ Atmos. Chem. Phys., 12, 6629–6643, 20126638 J.-F. Gayet et al.: A380 contrail in the vortex phase
Table 1. Mean parameter values in the indicated time-intervals and corresponding contrail ages for the three selected contrail regions A, B
and C (see Fig. 2). The parameters are: age, altitude, temperature T , NOy mixing ratio, concentration of particles (d > 0.9 µm), effective
diameter Deff , ice water content IWC, direct (PN) and retrieved extinction coefficients (Ext and Ext R, respectively), asymmetry parameter
g, spherical/aspherical partitioning ratio (SAR) and residual (Res).
# UTC time Age Alt. T NOy N1 Deff IWC Ext Ext R g SAR Res.
(h:min:s) (s) (m) (◦ C) (nmol mol−1 ) (cm−3 ) (µm) (mg m−3 ) (km−1 ) (km−1 ) (%) (%)
A 12:14:01 12:14:21 70 10 536 −54.5 17.1 219 3.5 4.7 3.50 2.77 0.873 98 13.6
B 12:16:44 12:17:05 105 10 640 −55.7 6.6 193 4.4 5.9 4.29 4.08 0.850 68 7.7
C 12:23:43 12:25:04 205 10 651 −56.8 8.5 63 4.8 1.9 1.08 1.15 0.805 44 9.7
assuming that all ice particles are spherical. The retrieved trieved size distributions (Fig. 4c, left panel) are interrelated
phase function was computed from the retrieved size dis- because the theoretical phase function and retrieved scatter-
tribution and the retrieved SAR. Phase functions were com- ing phase functions match closely at the forward scattering
puted for the refractive index 1.31 + i1.0×10−4 . As before, angles (Fig. 4c, right panel).
we note that the phase functions are insensitive to changes in Noteworthy results are found by interpreting the optical
the imaginary refractive index below 10−4 . properties of the three contrail parts. In the secondary wake
The main result of Fig. 4 is that the retrieved phase func- of the age of 70 s (Fig. 4a), most ice particles (98 %) are
tions agree quite well with the observations from the Polar of quasi-spherical shape, as supported by the close agree-
Nephelometer. This agreement is quantified with the residual ment between PN measurements and the theoretical FSSP-
values: 300 phase function. This means that in the younger con-
v trail part, spherical particles control the optical properties
N
Iret (θi ) − I (θi )meas 2 of the plume. Figure 4b, for the 105 s old contrail, the dif-
u
u1 X
Res = 100 t , ferences between the measured (PN) and theoretical (FSSP-
N i=1 I (θi )meas
300) phase functions at sideward scattering angles again un-
doubtedly reveal the occurrence of non-spherical particles.
where I (θi ) is the light intensity at the scattering angle θi ,
Indeed, the retrieved partitioning ratio of 68 % (see Table 1)
and the subscripts “meas” and “ret” refer to the measured
indicates that 68 % of the ice particles are spherical and 32 %
and retrieved values, respectively. The residuals are lower
are aspherical (oblates and prolates). In Fig. 4c, for the 205
than 13.6 %, as listed in Table 1. The remaining residuals
s old secondary wake contrail, the differences between the
are mainly due to uncertainties in the Polar Nephelometer
phase functions (PN and FSSP-300) at sideward scattering
measurements at backward scattering angles (θ > 150◦ , see
angles are larger than in the previous case indicating a larger
Fig. 4). The small residual values show that the employed
proportion of aspherical ice particles. This feature is con-
model fits the measured phase functions quite well. That is, a
firmed by the retrieved partitioning ratio of 44 %. Therefore
model using a mixture of spheroids with a size-independent
aspherical particles (assumed as 28 % oblates and 28 % pro-
partitioning ratio and the retrieved value of the refractive in-
lates) dominated the optical properties of the secondary wake
dex gives results which are in good agreement with the ob-
contrail.
served optical data.
Figure 5 summarizes these results, showing the relation-
Retrievals were also calculated assuming a model with
ships between the partitioning ratio from the inversion ap-
spherical particles only. In contrast to the mixture of
proach (Fig. 5a) and the measured asymmetry parameter
spheroids, the retrieved phase functions for spheres exhibit
(Fig. 5b) versus contrail age (additional inversion results
high residual values for cases B and C. Hence, these cases
have been drawn on Fig. 5). Extrapolating these results to
can be explained only with aspherical particles.
larger contrail ages, for constant environmental conditions,
Compared to the observed size distributions (Fig. 4 left),
implies that all ice particles could be aspherically-shaped af-
the retrieved size distributions show roughly the same mode
ter 5 min contrail age. The asymmetry parameter may then
size and spreading for the cases A and B, but a bimodal fea-
reach values of 0.77, which is a typical value for natural cir-
ture for case C (Fig. 4c). In all cases, the computed extinc-
rus at mid-latitudes (Gayet et al., 2004). The g-value reported
tion coefficient values match quite well the measured one
by Febvre et al. (2009) for a 150 s old contrail fits well to the
(see Table 1), highlighting quite robust results with respect
present observations (see open circle on Fig. 5b).
to small variations of the observations. We recall that the
It has to be noted that this study is based on 200 s of mea-
FSSP-300 probe measures the energy scattered only in the
surements in a vortex-phase contrail. This part is a small
forward direction (between 6◦ and 15◦ ). Thus, the FSSP-300
subset of the 16-min contrail data collected in total behind
data are less sensitive to the particle shape than the PN mea-
the A380. Since the shape and size of ice particles depend
surements, which cover a larger interval of scattering angles.
It would appear reasonable that the FSSP-300 and the re-
Atmos. Chem. Phys., 12, 6629–6643, 2012 www.atmos-chem-phys.net/12/6629/2012/J.-F. Gayet et al.: A380 contrail in the vortex phase 6639
strongly on ambient conditions, the reported results have to after roughly 5 min contrail age for constant environmental
be taken as a case study. conditions. This might have implications for the radiative ef-
fects from young contrails and contrail cirrus.
7 Conclusions
Appendix A
This paper presents for the first time in-situ measurements
in the vortex stage of a contrail from a large-body A380 FSSP-300 size calibration and validation with Polar
commercial aircraft. The observations cover the contrail vor- Nephelometer measurements
tex regime for contrail ages from 70 s to 220 s. The mea-
surements cover a large part of the full contrail depth. The The contrail data were first analyzed assuming the FSSP-300
measured contrail depth agrees with theoretical predictions. size bin limits related to spherical ice particles. Mie calcu-
Unique measurements were performed in the primary wake lations were used to derive: (i) the size bin limits for spher-
vortex (at 90 and 115 s contrail age) and in the secondary ical particles composed of pure ice with a refractive index
wake (70–220 s contrail age) at temperatures from −54.0 ◦ C of 1.31+i0, and (ii) the extinction efficiency for the corre-
to −56.5 ◦ C. sponding size bins. The results were adjusted to the cali-
In the primary wake, spherical or quasi-spherical ice par- brated probe response of the specific FSSP-300 used dur-
ticles with Deff of 3.7 µm and maximum Ni of ∼160 cm−3 ing CONCERT. In order to minimize the Mie ambiguities
prevail and control the optical properties of the contrail. Max- related to the probe size response, 22 channels (10–31) were
imum values of the extinction coefficient of 7.0 km−1 and the rebinned to 8 channels giving a diameter range from 0.9 µm
ice water content of 3 mg m−3 were measured. The observed to 22.9 µm in this case. For dense contrail encounters, FSSP-
ice subsaturation in the primary wake suggests that ice par- 300 channels no. 30 and 31 were found to be overcounting,
ticles were likely sublimating as confirmed by small particle while this was not the case for less dense cirrus encounters.
sizes and a large asymmetry parameter of 0.87. Coincidence effects may explain this effect (Baumgardner et
In the secondary wake at contrail ages of 70 to 220 s, al., 1992) and therefore these channels were excluded from
mean (maximum) values Ni of 80 (350) cm−3 , Ext of 1.6 the data analysis.
(5.0) km−1 , and IWC of 2.5 (10) mg m−3 were measured. The extinction coefficient (Ext) is calculated from the
The temporal evolution of the secondary wake contrail could FSSP-300 size distribution with the ice water content (IWC)
be followed over 150 s plume age at a quasi-constant level and the effective diameter (Deff ) with the following equa-
near the A380 cruising altitude. The asymmetry parameter tions:
decreased from 0.85 at 1 min plume age to 0.80 on aver- i=8
X
age at 4 min plume age. This feature illustrates very well the Ext = π/4 i
βext Ni Di2 (A1)
time-evolution of ice crystals towards more aspherical shapes i=1
and larger effective diameters (4.8 µm on average), obviously i=8
X
caused by ice supersaturation during ice crystals growths in- IWC = π/6 · ρice Ni Di3 (A2)
side the contrail or in ambient air entrained into the contrail i=1
at this level. Deff = 3271 · IWC/Ext (A3)
A detailed interpretation of the results concerning the
shape of the ice particles has been presented. We em- with β iext the extinction efficiency, Di the mean diameter in
ployed the approach, the code, and the kernels developed channel i, Ni the number concentration and ρ ice the ice bulk
by Dubovik et al. (2006). This method offers the possibil- density (0.917 g cm−3 ). Equation (3) is based on the rela-
ity to retrieve a consistent set of ice particle parameters fit- tion between projected cross sectional area of particles and
ting the measured scattering phase functions (PN). The re- extinction for constant extinction efficiency and particle ice
trieved parameters include the size distribution, the refractive bulk density ρ ice (Garrett et al., 2003). Deff is expressed in
index, and the spherical/aspherical ice particle partitioning µm, IWC in g m−3 and Ext in km−1 .
SAR. This technique, applied to the secondary wake sampled Figure A1a displays the comparison between the extinc-
at different ages, gives quite robust results. In the younger tion coefficients derived from the FSSP-300 and the Polar
contrail (70 s) most of the ice particles (98 %) have a quasi- Nephelometer. As shown in Sect. 4.2 the asymmetry pa-
spherical shape. Fractions of aspherical ice particles of 32 % rameter (g), gives an indication on the particle shape (see
and 56 % are retrieved in the secondary wake at 105 s and also Febvre et al., 2009), with quasi-spherical particles ex-
205 s contrail age, respectively. This means that the number pected for g larger than 0.85 and aspherical ice crystals for
of spherical ice particles decreases with contrail age in accor- smaller values. The red and blue square symbols on Fig. A1a
dance with a subsequent decrease of the asymmetry parame- were sorted out according to the g-values, i.e. g > 0.85
ter. Extrapolating the results to older contrail ages, suggests and g < 0.85, respectively. The results clearly show a rather
that most ice crystals are significantly aspherically-shaped good agreement between the two extinction measurements
www.atmos-chem-phys.net/12/6629/2012/ Atmos. Chem. Phys., 12, 6629–6643, 20126640 J.-F. Gayet et al.: A380 contrail in the vortex phase
8 In Fig. A1a and b, some data (red symbols) reveal a large
Polar Nephelometer Extinction (km-1)
overestimation of the PN measurements. These data corre-
6 spond to primary wake vortex observations during which the
PN sampled the plume whereas the FSSP-300 (mounted on
4 the opposite wing) was likely out of the contrail due to small-
scale heterogeneities of the vortex properties.
2
a b Acknowledgements. The CONCERT campaign was organized by
0 the HGF-young investigators group AEROTROP under the grant
0 2 4 6 8 0 2 4 6 8
FSSP-300 Extinction (km-1) FSSP-300 Extinction (km-1) VH-NG-309. Part of this work was funded within the DLR-project
CATS (Climate-compatible Air Transport System) and by the DFG
Fig. A1. Comparison of extinction coefficients derived from FSSP- SPP HALO 1294 (grant number VO-1504/2-1). This work was
300 and from Polar Nephelometer (PN) measurements. FSSP-300 Figure A1
funded by a grant from the CNRS/INSU. We thank the DLR flight
with different size calibrations: (a) for spherical particles, (b) for department for extraordinary flights. We thank M. Kübbeler and M.
spherical (red data) and aspherical (blue data) depending on the Krämer for providing FISH humidity measurements and detailed
value of the PN-derived asymmetry parameter g. The red and blue discussions leading to improvements of the analysis, and T. Ham-
square symbols refer to asymmetry parameter values g > 0.85 and burger for FSSP-300 instrument preparation. K. Gierens is thanked
g < 0.85, respectively. for helpful discussions. We thank C. Gourbeyre and J.-F. Fournol
(LaMP) for their technical assistance. The Deutsche Lufthansa
(A. Waibel) and the European and German air traffic control (DFS)
for quasi-spherical ice particles (red data). As for the as- are gratefully acknowledged for their excellent support of the
pherical particles (blue data) the extinction from the FSSP- campaign. The authors are grateful to D. Baumgardner and the
300 is significantly overestimated with respect to the Polar anonymous reviewer for important comments that strengthened the
Nephelometer data. This result is a strong indication that the manuscript.
FSSP-300 size calibration is dependent on the particle shape
Edited by: P. Spichtinger
and that the assumption of spherical particles for the FSSP
size calibration is not valid for data points with g < 0.85.
Size bins for non-spherical particles were defined from
T-matrix calculations by Borrmann et al. (2000) assuming
aspherical (i.e. rotationally symmetric ellipsoid) particles
(composed of pure ice) with an aspect ratio of 1:2. The size
calibration is expressed in terms of equivalent surface diam-
eter, i.e. the diameter of a sphere that has the same projected
area (Mishchenko et al., 1997). In this case, nine channels The publication of this article is financed by CNRS-INSU.
describe the diameter range from 0.9 µm to 19.5 µm. For data
characterized by g smaller than 0.85 (aspherical particles),
the microphysical parameters are derived with the equations References
above by considering Di the equivalent surface diameter. The
subsequent extinction coefficients are compared to the Polar Baumgardner, D. and B. W. Gandrud: A comparison of the micro-
Nephelometer measurements on Fig. A1b with blue square physical and optical properties of particles in an aircraft contrail
symbols (g < 0.85). The results show a much better agree- and mountain wave cloud, Geophys. Res. Lett., 25(8), 1129–
1132, doi:10.1029/98GL00035, 1998.
ment than before between the two measurements whatever
Baumgardner, D., Dye, J. E., Gandrup, B. W., and Knollenberg, R.
the particle shape. This closure method validates the pro- G.: Interpretation of measurements made by the Forward Scat-
posed FSSP-300 size calibrations. tering Spectrometer Probe (FSSP-300) during the Airborne Arc-
The g-threshold of 0.85 to separate spherical and aspheri- tic Stratosphere Expedition, J. Geophys. Res., 97, 8035–8046,
cal particle shapes is warranted by the best fit and the smaller 1992.
dispersion of the scattered data on Fig. A1b (the slope param- Borrmann, S., Luo, B., and Mishchenko, M.: Application of the
eter of the linear fit and correlation coefficient are 0.93 and T-matrix method to the measurement of aspherical (ellipsoidal)
0.92, respectively). Of course, these results could be refined particles with forward scattering optical particle counters, J.
by considering a smooth FSSP size-bin transition between Aerosol Sci., 31, 789–799, 2000.
the two considered particle-shape calibrations. It should be Burkhardt, U. and Kärcher, B.: Global radiative forcing
noticed that particles with diameters below 0.9 µm can be from contrail cirrus, Nature Clim. Change 1, 54–58,
doi:10.1038/nclimate1068, 2011.
neglected since they contribute little to the extinction coef-
Burkhardt, U., Kärcher, B., and Schumann, U.: Global modelling of
ficient, showing that the contrail optical properties are con- the contrail and contrail cirrus climate impact, B. Am. Meteorol.
trolled by larger particles. Soc., 91, 479–484, doi:10.1175/2009BAMS2656.1, 2010.
Atmos. Chem. Phys., 12, 6629–6643, 2012 www.atmos-chem-phys.net/12/6629/2012/J.-F. Gayet et al.: A380 contrail in the vortex phase 6641
Busen, R. and Buck, A. L.: A high-performance hygrometer for Holzäpfel, F.: Probabilistic two-phase wake vortex decay and trans-
aircraft use: Description, installation, and flight data, J. Atmos. port model, J. Aircraft, 40, 323–331, 2003.
Ocean. Technol., 12, 73–84, doi:10.1175/1520-0426, 1995. Holzäpfel, F. and Gerz, T.: Two-dimensional wake vortex physics in
Dubovik, O., Sinyuk, A., Lapyonok, T., Holben, B. N., Mishchenko, the stably stratified atmosphere, Aerosp. Sci. Technol., 5, 261–
M., Yang, P., Eck, T. F., Volten, H., Muñoz, O., Veihelmann, B., 270, 1999.
van der Zande, W. J., Leon, J.-F., Sorokin, M., and Slutsker, I.: Jourdan, O., Mioche, G., Garret, T. J., Schwarzenbock, A., Vidot,
Application of spheroid models to account for aerosol particle J., Xie, Y., Shcherbakov, V., Duroure, C., Yang, P., and Gayet,
nonsphericity in remote sensing of desert dust, J. Geophys. Res., J.-F.: Coupling of the microphysical and optical properties of
111, D11208, doi:10.1029/2005JD006619, 2006. arctic clouds during the ASTAR 2004 experiment: Implications
Eck, T. F., Holben, B. N., Reid, J. S., Sinyuk, A., Dubovik, O., for light scattering modelling, J. Geophys. Res., 115, D23206,
Smirnov, A., Giles, D., O’Neill, N. T., Tsay, S.-C., Ji, Q., Al Man- doi:10.1029/2010JD014016, 2010.
doos, A., Ramzan Khan, M., Reid, E. A., Schafer, J. S., Sorokine, Jurkat, T., Voigt, C., Arnold, F., Schlager, H., Kleffmann, J.,
M., Newcomb, W., and Slutsker, I.: Spatial and temporal variabil- Aufmhoff, H., Schäuble, D., Schäfer, M., and Schumann, U.:
ity of column-integrated aerosol optical properties in the south- Measurements of HONO, NO, NOy and SO2 in aircraft ex-
ern Arabian Gulf and United Arab Emirates in summer, J. Geo- haust plumes at cruise, Geophys. Res. Lett., 38, L10807,
phys. Res., 113, D01204, doi:10.1029/2007JD008944, 2008. doi:10.1029/2011GL046884, 2011.
Febvre, G., Gayet, J.-F., Minikin, A., Schlager, H., Shcherbakov, Kärcher, B. and Yu, F.: The role of aircraft soot emissions
V., Jourdan, O., Busen, R., Fiebig, M., Kärcher, B., and in contrail formation, Geophys. Res. Lett., 36, L01804,
Schumann, U.: On optical and microphysical characteristics doi:10.1029/2008GL036649, 2009.
of contrails and cirrus, J. Geophys. Res., 114, D02204, Kübbeler, M., Hildebrandt, M., Meyer, J., Schiller, C., Ham-
doi:10.1029/2008JD010184, 2009. burger, T., Jurkat, T., Minikin, A., Petzold, A., Rautenhaus, M.,
Field, P. R., Wood, R., Brown, P. R. A., Kaye, P. H., Hirst, E., Green- Schlager, H., Schumann, U., C. Voigt, Spichtinger, P., Gayet, J.
away, R., and Smith, J. A.: Ice particle interarrival times mea- F., Gourbeyre, C., and Krämer, M.: Thin and subvisible cir-
sured with a fast FSSP, J. Atmos. Ocean. Technol., 20, 249–261, rus and contrails in a subsaturated environment, Atmos. Chem.
2003. Phys., 11, 5853–5865, doi:10.5194/acp-11-5853-2011, 2011.
Garrett, T. J., Gerber, H., Baumgardner, D. G., Twohy, C. Lee, D. S., Fahey, D. W., Forster, P. M., Newton, P. J., Wit, R. C.
H., and Weinstock, E. M.: Small, highly reflective ice crys- N., Lim, L. L., Owen, B., and Sausen, R.: Aviation and global
tals in low-latitude cirrus, Geophys. Res. Lett., 30, 2132, climate change in the 21st century, Atmos. Environ., 43, 3520–
doi:10.1029/2003GL018153, 2003. 3537, doi:10.1016/j.atmosenv.2009.04.024, 2009.
Gayet, J. F., Crépel, O., Fournol, J. F., and Oshchepkov, S.: A new Lee, D. S., Pitari, G., Grewe, V., Gierens, K., Penner, J. E., Petzold,
airborne polar Nephelometer for the measurements of optical and A., Prather, M. J., Schumann, U., Bais, A., Berntsen, T., Iachetti,
microphysical cloud properties. Part I: Theoretical design, Ann. D., Lim, L. L., and Sausen, R.: Transport impacts on atmosphere
Geophys., 15, 451–459, doi:10.1007/s00585-997-0451-1, 1997. and climate: Aviation, Atmospheric Environment, Atmos. Envi-
Gayet, J.-F., Asano, S., Yamazaki, A., Uchiyama, A., Sinyuk, ron., 44, 4678–4734, doi:10.1016/j.atmosenv.2009.06.005, 2010.
A., Jourdan, O., and Auriol, F.: Two case studies of winter Lewellen, D. C. and Lewellen, W. S.: The effects of aircraft wake
continental-type water and mixed-phase stratocumuli over the dynamics on contrail development, J. Atmos. Sci., 58, 390–406,
sea: 1. Microphysical and optical properties, J. Geophys. Res., 2001.
107, 4569, doi:10.1029/2001JD001106, 2002. Mannstein, H., Spichtinger, P., and Gierens, K.: A note on how to
Gayet, J.-F., Ovarlez, J., Shcherbakov, V., Ström, J., Schumann, U., avoid contrail cirrus, Transp. Res., 421–426, 2005.
Minikin, A., Auriol, F., Petzold, A., and Monier, M.: Cirrus cloud Meerkötter, R., Schumann, U., Minnis, P., Doelling, D. R., Naka-
microphysical and optical properties at southern and northern jima, T., and Tsushima, Y.: Radiative forcing by contrails,
midlatitudes during the INCA experiment, J. Geophys. Res., 109, Ann. Geophys., 17, 1080–1094, doi:10.1007/s00585-999-1080-
D20206, doi:10.1029/2004JD004803, 2004. 7, 1999.
Gerz, T., Dürbeck, T., and Konopka, P.: Transport and effective Misaka, T., Holzäpfel, F., Hennemann, I., Gerz, T., Manhart,
diffusion of aircraft emissions, J. Geophys. Res., 103, 25905– M., and Schwertfirm, F.: Vortex bursting and tracer transport
25913, doi:10.1029/98JD02282, 1998. of a counter-rotating vortex pair, Phys. Fluids, 24, 025104,
Gonda R. and Takahashi, T.: Initial growth forms of snow crystals doi:10.1063/1.3684990, 2012.
growing from frozen droplets, J. Meteor. Soc. Jpn., 62, 190–192, Mishchenko, M. I., Travis, L. D., Kahn, R. A., and West, R.
1984. A.: Modeling phase functions for dustlike tropospheric aerosols
Heymsfield, A., Baumgardner, D., DeMott, P., Forster, P., Gierens, using a mixture of randomly oriented polydisperse spheroids.
K., and Kärcher, B.: Contrail microphysics, B. Am. Meteor. J. Geophys. Res., 102, 16831–16847, doi:10.1029/96JD02110,
Soc., 91, 465–472, doi:10.1175/2009BAMS2839.1, 2010. 1997.
Heymsfield, A. J.: On measurements of small ice particles in clouds, Mishchenko, M. I., Travis, L. D., and Lacis, A. A.: Scattering, Ab-
Geophys. Res. Lett., 34, L23812, doi:10.1029/2007GL030951, sorption, and Emission of Light by Small Particles, Cambridge
2007. University Press, Cambridge, UK, 2002.
Heymsfield, A. J., Lawson, P. R., and Sachse, G. W.: Growth of Mugnai, A. and Wiscombe, W. R.: Scattering from nonspherical
ice crystals in a precipitating contrail, Geophys. Res. Lett., 25, Chebyshev particles. I: Cross-sections, single-scattering albedo,
1335–1338, 1998. asymmetry factor and backscatterd fration, Appl. Optics, 25,
1235–1244, 1986.
www.atmos-chem-phys.net/12/6629/2012/ Atmos. Chem. Phys., 12, 6629–6643, 2012You can also read