Systemic induction of phosphatidylinositol based signaling in leaves of arbuscular mycorrhizal rice plants - Nature

Page created by Ronnie Schneider
 
CONTINUE READING
Systemic induction of phosphatidylinositol based signaling in leaves of arbuscular mycorrhizal rice plants - Nature
www.nature.com/scientificreports

            OPEN           Systemic induction
                           of phosphatidylinositol‑based
                           signaling in leaves of arbuscular
                           mycorrhizal rice plants
                           Sonia Campo1* & Blanca San Segundo1,2

                           Most land plants form beneficial associations with arbuscular mycorrhizal (AM) fungi which improves
                           mineral nutrition, mainly phosphorus, in the host plant in exchange for photosynthetically fixed
                           carbon. Most of our knowledge on the AM symbiosis derives from dicotyledonous species. We show
                           that inoculation with the AM fungus Funneliformis mosseae stimulates growth and increases Pi
                           content in leaves of rice plants (O. sativa, cv Loto, ssp japonica). Although rice is a host for AM fungi,
                           the systemic transcriptional responses to AM inoculation, and molecular mechanisms underlying
                           AM symbiosis in rice remain largely elusive. Transcriptomic analysis identified genes systemically
                           regulated in leaves of mycorrhizal rice plants, including genes with functions associated with the
                           biosynthesis of phospholipids and non-phosphorus lipids (up-regulated and down-regulated,
                           respectively). A coordinated regulation of genes involved in the biosynthesis of phospholipids and
                           inositol polyphosphates, and genes involved in hormone biosynthesis and signaling (jasmonic acid,
                           ethylene) occurs in leaves of mycorrhizal rice. Members of gene families playing a role in phosphate
                           starvation responses and remobilization of Pi were down-regulated in leaves of mycorrhizal rice. These
                           results demonstrated that the AM symbiosis is accompanied by systemic transcriptional responses,
                           which are potentially important to maintain a stable symbiotic relationship in rice plants.

                           Arbuscular mycorrhizal fungi (AMF or AM fungi) are soil-borne obligate biotrophs that form mutualistic asso-
                           ciations with most terrestrial p­ lants1–6. The fungus provides the host plant with nutrients, mainly phosphorus,
                           which generally improves plant growth and fitness. In return, the host plant provides the AM fungus with sugars
                           and lipids, both representing a major source of organic carbon in the ­fungus7. In this symbiosis, the fungus pen-
                           etrates and colonizes the root cortex, forming differentiated symbiotic structures, known as arbuscules, which are
                           the sites for nutrient exchange between the two organisms. Besides plant nutrition improvement, AM fungi often
                           confer tolerance to biotic and abiotic ­stresses8–14. The molecular mechanisms of interactions between plants and
                           AM fungi have mainly been investigated using the model legumes of Medicago truncatula and Lotus japonicus15.
                               Rice is one of the most important cereal crops in the world and a staple for more than half of the global
                           population. Rice is also a host for AM fungi, and several studies have found positive effects of AM fungi on
                           growth, pathogen resistance, and drought tolerance in rice ­plants16. Even though rice can establish symbiotic
                           relationships with AM fungi, the molecular and physiological responses to inoculation with an AM fungus in rice
                           plants remain less explored. The main reason for this backwardness is that rice is mostly grown under flooded
                           conditions (paddy fields), and plants growing in aquatic environments have been traditionally considered to be
                           non-mycorrhizal. However, natural colonization with AM fungi has been reported in rice plants under aerobic
                           and flooded c­ onditions17,18.
                               Root colonization by AM fungi involves drastic reprogramming of gene expression for the control AM symbi-
                           osis. Most studies focused on transcriptional responses in roots of mycorrhizal ­plants19–22, whereas transcriptional
                           responses in leaves of mycorrhizal plants have not yet been systematically investigated. Most AM-responsive
                           genes in roots are involved in transcriptional regulation (e.g., transcription factors) and signal transduction (e.g.,

                           1
                            Centre for Research in Agricultural Genomics (CRAG) CSIC‑IRTA‑UAB‑UB, Campus Universitat Autònoma de
                           Barcelona (UAB), Bellaterra (Cerdanyola del Vallés), Barcelona, Spain. 2Consejo Superior de Investigaciones
                           Científicas (CSIC), Barcelona, Spain. *email: sonia.campo@cragenomica.es

Scientific Reports |   (2020) 10:15896               | https://doi.org/10.1038/s41598-020-72985-6                                              1

                                                                                                                                          Vol.:(0123456789)
Systemic induction of phosphatidylinositol based signaling in leaves of arbuscular mycorrhizal rice plants - Nature
www.nature.com/scientificreports/

                                      A                                                              B    23d
                                                     50             -F.m
                                                                   +F.m                       ***

                                       Height (cm)
                                                                                     ***
                                                     25

                                                                                                               -F.m                        +F.m
                                                      0
                                                                            10d      17d      23d

                                           C                                                          D

                                                                                                           free Pi (µmol/g FW)
                                                                                                                             12
                                                      Chlorophyll content

                                                                            40
                                                                                        *                                                  *
                                                                            35
                                                                                                                                 6

                                                                            30

                                                                             0                                                   0
                                                                                  -F.m +F.m                                          -F.m +F.m

                                      Figure 1.  Phenotype of rice (Oryza sativa spp. japonica, cv Loto) inoculated with the AM fungus F. mosseae.
                                      (A) Rice plants were inoculated with F. mosseae (+ F.m; red line), or non-inoculated (-F.m; black line). Height
                                      of Loto rice plants was determined at the indicated times after inoculation with F. mosseae. Data are mean ± SE
                                      (n = 10). Asterisks denote statistical differences (*p < 0.05, ANOVA test; F. mosseae-inoculated vs non-
                                      inoculated). (B) Appearance of Loto rice plants at 23 days post-inoculation (dpi). (C) Chlorophyll content in
                                      leaves of mycorrhizal and non-mycorrizal plants at 23 dpi. Data are mean ± SE (n = 10). (D) Pi content in leaves
                                      of mycorrhizal and non-mycorrhizal Loto plants at 23 dpi. Data are mean ± SE (n = 5, each biological replicate is
                                      a pool of 2 individual leaves). FW fresh weight.

                                      components of the “common symbiosis signaling” pathway), as well as in nutrient transport, or sugar and lipid
                                      ­transport15,23. Phytohormones are also important regulators of AM ­symbiosis6,24,25.
                                          This study aimed to investigate systemic transcriptional alterations in leaves of mycorrhizal rice plants. These
                                       studies were carried out on the rice cultivar Loto (Oryza sativa, ssp. japonica) interacting with the AM fungus
                                       Funneliformis mosseae. Evidence is presented that the AM symbiosis triggers coordinated regulations in the
                                       expression of genes involved in lipid signaling (phospholipids and non-phosphorus lipids), hormone biosynthesis
                                       and signaling (jasmonic acid, ethylene), and genes involved in Pi homeostasis. These results provided a global
                                       view of genes, and members of gene families, that will advance our understanding on mechanisms underlying
                                       the AM symbiosis in rice.

                                      Results
                                      Effect of F. mosseae inoculation on growth of rice plants. It is known that rice cultivars differ widely
                                      for colonization with the AM fungus R. irregularis26. In this work, we observed that inoculation with the AM
                                      fungus F. mosseae has an important effect on growth of Loto rice plants (Fig. 1A). F. mosseae-inoculated plants
                                      grew faster than non-inoculated plants, the stimulatory effect on plant growth being observed as early as 17 days
                                      after F. mosseae inoculation (Fig. 1A,B). Chlorophyll content, and indicator of the physiological status of plants,
                                      also increased in mycorrhizal plants (Fig. 1C). Inoculation with F. mosseae significantly increased Pi content
                                      in leaves of Loto plants (Fig. 1D), thus, supporting the formation of a functional AM symbiosis. Microscopic
                                      observations of cotton blue-stained roots confirmed root colonization by F. mosseae. Typical AM fungal struc-
                                      tures, such as hyphae, vesicles and arbuscules were clearly observed in roots of F. mosseae-inoculated Loto plants
                                      (Fig. 2).

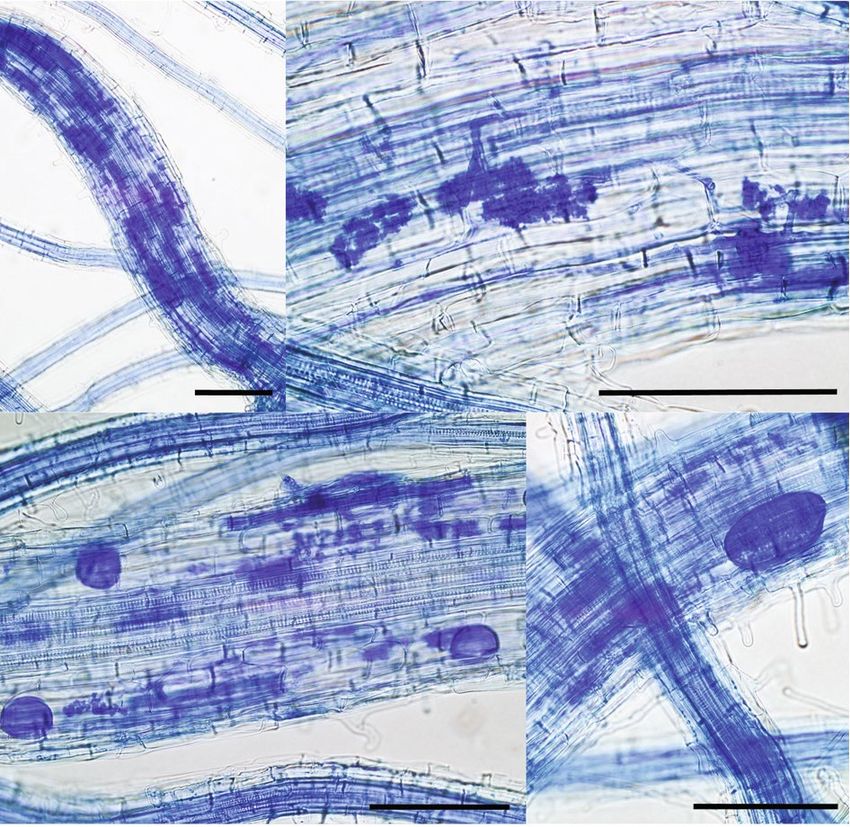
                                      Transcriptome analysis reveals the impact of AM symbiosis in rice leaves. To investigate the
                                      molecular mechanisms underlying AM symbiosis in rice, we performed transcriptome analysis of leaves from
                                      mycorrhizal and non-mycorrhizal plants. Differentially expressed genes (DEGs) were identified based on
                                      significance level (FDR ≤ 0.01) and log2 fold change (FC) as the threshold for up-regulated (FC ≥  + 0.5) and
                                      down-regulated (FC ≤—0.5) genes. Using these criteria, 4993 and 5221 genes were found to be up-regulated and
                                      down-regulated, respectively, in leaves of mycorrhizal plants relative to non-inoculated plants (Fig. 3A; Supple-
                                      mentary Fig. S1A,B; Supplementary Table S1). Principal component analysis revealed a clear separation between
                                      non-inoculated and F. mosseae-inoculated plants (Supplementary Fig. S1C). These results support that the AM
                                      symbiosis has a strong impact on the leaf transcriptome of Loto rice plants. Similarly, massive transcriptional
                                      changes were reported in rice roots during AM ­symbiosis19.

          Scientific Reports |   (2020) 10:15896 |                                            https://doi.org/10.1038/s41598-020-72985-6                2

Vol:.(1234567890)
Systemic induction of phosphatidylinositol based signaling in leaves of arbuscular mycorrhizal rice plants - Nature
www.nature.com/scientificreports/

                            A

                                                                                             ih
                                                                                                      a

                                                                           a

                                                                                                  a

                                                                         v a               v
                                                   ih
                                v a
                                                                                 a

                              B                               19
                                           colonization (%)
                                            Estimation of

                                                              16

                                                              13

                                                               0
                                                                   M%          A%

                            Figure 2.  Colonization by F. mosseae in roots of rice (cv Loto) plants. (A) Representative cotton blue staining
                            of roots colonized by F. mosseae at 8 wpi. Light micrographs show intracellular hyphae (ih), arbuscules (a) and
                            vesicles (v). Scale bar = 100 μm. (B) Estimation of root colonization was determined by the Trouvelot method
                            at 8 weeks post-inoculation. M%, Intensity of the mycorrhizal colonization in the root system; A%, Arbuscule
                            abundance in the root system.

                                Gene Ontology (GO) enrichment analysis of Biological Process (Supplementary Table S2) revealed that GO
                            annotations related to “Phosphatidylinositol phosphorylation” were over-represented in the set of up-regulated
                            genes in leaves of mycorrhizal plants (Fig. 3B, left panel). The GO categories of “Gene silencing”, “RNA modifi-
                            cation and RNA processing”, and “Regulation of translation”, were also enriched among the up-regulated genes
                            (Fig. 3B, left panel).
                                A significant enrichment in the GO term of “Cellular response to phosphate starvation” occurred in the set
                            of down-regulated DEGs (Fig. 3B, right panel). Other GO categories enriched among the down-regulated genes
                            were “Proteasomal protein catabolism”, or “Catabolic processes”. Results obtained by RNA-Seq analysis were
                            validated by qRT-PCR (Supplementary Fig. S2A, B). A good correlation between qRT-PCR and RNA-seq data
                            was observed (Supplementary Fig. S2C).

                            Transcriptional regulation of phosphoinositide and inositol polyphosphate biosynthesis genes
                            in mycorrhizal rice plants. As previously mentioned, GO analysis revealed that genes involved in “Phos-
                            phatidylinositol phosphorylation” were significantly enriched in leaves of mycorrhizal rice. In plants, Phosphati-
                            dylinositol (PtdIns) (or phosphoinositide, PI) is an essential phospholipid that is required for the production
                            of both membrane-bound phosphoinositides and soluble inositol polyphosphates (InsPs, or IPs). Besides their
                            roles as membrane building blocks, phosphoinositides also exert regulatory functions through interaction with
                            a wide range of cellular ­proteins27. As for inositol polyphosphates, they function as cofactors, regulators, and
                            second messengers in plants. At present, however, there are major gaps in our knowledge about the possible con-
                            tribution of phosphoinositides and inositol polyphosphates in interactions between plants and AM fungi. This
                            fact prompted us to further investigate the expression of genes involved in inositol polyphosphate and phospho-
                            inositide metabolism in mycorrhizal rice plants. To note, we found that the expression of phosphoinositide and
                            inositol polyphosphate biosynthesis was highly regulated in leaves of mycorrhizal rice plants (Fig. 4A; Table 1;
                            Supplementary Table S3). The mycorrhiza-regulated genes in the phosphoinositide and inositol polyphosphate
                            biosynthesis pathway identified in this study are presented in Fig. 4B.

Scientific Reports |   (2020) 10:15896 |                           https://doi.org/10.1038/s41598-020-72985-6                                  3

                                                                                                                                        Vol.:(0123456789)
Systemic induction of phosphatidylinositol based signaling in leaves of arbuscular mycorrhizal rice plants - Nature
www.nature.com/scientificreports/

                                      Figure 3.  Differentially expressed genes (DEGs) in leaves of F. mosseae-inoculated rice plants relative to non-
                                      inoculated plants by RNA-seq analysis. Leaves of 30-day old rice plants (cv Loto) were collected after 23 dpi
                                      of root inoculation with the AM fungus F. mosseae (+ F. mosseae). No inoculum was added to non-inoculated
                                      plants (-F. mosseae). (A) Number of DEGs (+ F. mosseae vs -F. mosseae). Up-regulated (log2 fold change
                                      [FC] ≥ 0.5; purple) and down-regulated (log2FC ≤ -0.5; green) genes (p < 0.05, false discovery rate [FDR] < 0.01,
                                      n = 3). (B) GO terms enriched in up- (left panel) and down- (right panel) regulated DEGs. The most enriched
                                      GO terms were identified (number of DEG ≥ 10; Enrichment Score ≥ 2.5) and visualized using REVIGO after
                                      reducing redundancy and clustering of similar GO terms (https​://revig​o.irb.hr/). Disc color (blue to red)
                                      represent the degree of GO enrichment (Enrichment Score) and disc size is proportional to the frequency of the
                                      GO term in the GO Oryza sativa database (larger and smaller discs represent more general and more specific
                                      terms, respectively). Full list of genes in enriched GO terms is presented in Supplementary Table S2.

                                            Among the genes up-regulated in leaves of mycorrhizal plants there were genes involved in: (i) the synthesis of
                                       PtdIns, namely cytidine diphosphate-diacylglycerol (CDP-DAG) synthase (OsCDS2), and PtdIns synthase (OsPIS);
                                       (ii) kinase genes acting in the production of phosphorylated derivatives of PtdIns, either PtdIns monophosphates
                                       [PtdIns3P, PtdIns4P] (PI3K and PI4K family proteins), or PtdIns bisphosphates [PtdIns(3,5)P2, PtdIns(4,5)P2]
                                       (FAB1/PIKFYVE and PIP5K family proteins) (Fig. 4A,B; Table 1). Genes encoding PtdIns3P and PtdIns4P phos-
                                       phatases, and PtdIns(3,5)P2 (Myotubularin, SAC1, and 5´phosphatases family proteins) were also up-regulated.
                                       The production of Ins3P from Glucose-6P appears to be repressed in leaves of mycorrhizal plants, as revealed by
                                       the down-regulation of myo-inositol-1-phosphate synthase (INO1 or MIPS) (Fig. 4B). Altogether these findings
                                       point to fine-tuning of phosphoinositide levels in mycorrhizal rice.
                                            In plants, InsPs are synthesized via two pathways: the lipid-independent (or soluble) and lipid–dependent
                                      ­pathways28. In the lipid-independent pathway, soluble inositol is phosphorylated through the action of kinases,
                                       whereas in the lipid-dependent pathway, different InsP intermediates originate through degradation of PtdIns
                                       by the action of phosphoinositide-specific ­phospholipases28. Here, the unique pathway that appears to be acti-
                                       vated in leaves of mycorrhizal plants is the soluble pathway, as revealed by the up-regulation the myo-inositol
                                       kinase (MIK1) and down-regulation of the phosphoinositide-specific phospholipase C (PI-PLC4) (Fig. 4A,B;
                                       Table 1). Also, the expression of genes encoding kinases responsible for the production of the different inositol

          Scientific Reports |   (2020) 10:15896 |               https://doi.org/10.1038/s41598-020-72985-6                                               4

Vol:.(1234567890)
www.nature.com/scientificreports/

                       A                                                                Expression level Fold change
                                                                                        [log10(FPKM+1]     [log2FC]      B                InsP8                  SPX-PHR1 interaction
                                                                                   0            1    2      −4    0 4                                            (Pi homeostasis)
                                                                                        - F.m       + F.m        +F.m/                                  VIP1
                                                                                       R1 R2 R3 R1 R2 R3         -F.m                                   VIP2        JA signalling. Activation
                                                                               VIP1                                                                                 of COI1-JAZ complex

                       Inositol Phosphate
                                                                               VIP2                                                     InsP7
                                                                               IPK1

                          metabolism
                              kinases
                                                                               IPK2                                                                     IPTK1
                                                                             IPTK1
                                                                             IPTK3                                                                      IPTK3
                                                                             IPTK5                                                                      IPTK5
                                                                             IPTK6
                                                                              INO1                                                        InsP6
                                                                              MIK1                                                                                      Pi homeostasis
                                                                              IMP1                                                        (PA)
                                                                                                                                                        IPK1 (IPKK)
                                                                              NPC1                                                                                            JA signalling. Cofactor
                                                                             NPC2                                                           Ins(1,3,4,5,6)P5                  of COI1-JAZ complex
                                                                             NPC3
                                                                             PAP-1                                                                                   IPK
                                                                             PAP-2                                                              IPK2                     2          Pi homeostasis
                                                                             PAP-3                                                                                  (IPM
                                                                             PAP-4                                                                                       K)
                                                                                                                                            Ins(1,3,4,5)P4
                                                                             DGK5                                                                                          Ins(1,4,5,6)P4
                                                                             DGK4                                                           Ins(1,3,4,6)P4
                                                                             CDS2
                                                                                                                                           IPTK1
                                                                                 PIS                                                       IPTK3                                 IPK2
                                                                               PI3K                                                        IPTK5                                 (IPMK)
                                                                             PI3K-2                                                        IPTK6
                                                                              PI4K1
                                                                              PI4Kα                                                              Ins(1,3,4)P3              Ins(1,4,5)P3
                                                                           Fab1b-1                                         Glu6P
                                                                           Fab1b-2
                                                                           Fab1b-3
                                                           kinases

                                                                           Fab1b-4                                                       Ins(3,4)P2       Ins(1,3)P2        Ins(1,4)P2

                                                                                                                          IN PS)
                                                                                                                           (M
                                                                           Fab1b-5

                                                                                                                            O1
                                                                                                                              I
                                                                            Fab1c-1
                                                                           Fab1c-2                                                          Ins3P            Ins1P           Ins4P
                                                                            Fab1c-3                                                             M                                                    PtdChol
                                                                              Fab1d                                                          IM IK1

                                                                                                                                                         P1
                         Phosphatidylinositol metabolism

                                                                              PIPK1                                                            P1                P1                                      NPC1

                                                                                                                                                        IM
                                                                           PIP5K-1                                                                             IM                                        NPC2
                                                                                                                                4                                                           DGK4         NPC3
                                                                           PIP5K-2                                          3       5             Ins
                                                                           PIP5K-3                                          2       6                                       CDS2            DGK5
                                                                              MTM1                                              1                               CDP-DAG            PtdOH              DAG
                                                                               SAC1                                                                                                         PAP-1
                                                                              SAC2                                                                        PIS                               PAP-2
                                                                            SAC3-1                                                                                                          PAP-3
                                                                            SAC3-2                                                          PtdIns                                          PAP-4
                                                           phosphatases

                                                                                GH1                                                                   PI-PLC4
                                                                              SAC7                                                                      P
                                                                                                                                      3 K -2           PI I4K
                                                                              SAC8
                                                                           5PTase1                                                  PI I3K          G
                                                                                                                                                         4K 1
                                                                                                                                     P        1   S H       α
                                                                           5PTase6                                                         TN    SAAC 1
                                                                                                                                                                                             LC4
                                                                          5PTase7a                                                       M         C8 7                                  PI-P
                                                                          5PTase9a                                             PtdIns3P                  PtdIns4P
                                                                          5PTase11
                                                                          D50/FAR3                                         Fab1b-1                            GH1
                                                                           PI-PLC4                                         Fab1b-2 SAC1             PIPK1 5PTase1

                                                                                                                                                                                                     4
                                                                                                                                                                                                LC
                                                                              PITP3                                        Fab1b-3 SAC2           PIP5K-1 5PTase6
                                                                                                                                                              5PTase7a

                                                                                                                                                                                                -P
                                                                                                                           Fab1b-4                PIP5K-2 5PTase9a
                                                                              PITP6                                        Fab1b-5 SAC3-1 PIP5K-3 5PTase11

                                                                                                                                                                                            PI
                                                                              PITP8                                                  SAC3-2
                                                           transferases

                                                                            PITP10                                         Fab1c-1                            D50/FAR3
                                                                                                                           Fab1c-2
                                                                             PITP11                                        Fab1c-3                    PtdIns(4,5)P2
                                                                            PITP12                                           Fab1d
                                                                             SNDP4
                                                                            SNDP8                                            PtdIns(3,5)P       MTN1       PtdIns5P
                                                                             SNDP9                                                                2
                                                                              PATL1
                                                                              PATL2

                                                               Figure 4.  Differential expression of genes involved in inositol polyphosphates (InsP) and phosphoinositides (PtdIns)
                                                               metabolism in leaves of rice (cv Loto) plants. RNA-Seq was used to identify DEGs in leaves of F. mosseae-inoculated vs
                                                               non-inoculated (− F.m vs − F.m) rice at 23 dpi. (A) Heatmaps showing expression level (left panel; log10 [FPKM + 1])
                                                               and Fold Change (right panel; log2FC) of DEGs. Gene expression is represented from pale yellow (less expressed)
                                                               to orange (more expressed). Upregulated (log2FC ≥ 0.5; purple) and downregulated (log2FC ≤ − 0.5; green) DEGs.
                                                               Data represented are individual replicates (n = 3, each biological replicate (R) consisting in a pool of 6 leaves from
                                                               individual plants). The full gene names and ID list are in listed in Table 1 and Supplementary Table S3. (B) Biochemical
                                                               pathways for the synthesis of InsP and PtdInsP. Interactions with JA signaling and Pi homeostasis are indicated. DEGs
                                                               in leaves of AM-inoculated vs leaves of non-inoculated rice plants are indicated in purple (up-regulated) and green
                                                               (down-regulated). Phosphoinositides species identified in plants include PtdIns monophosphates (PtdIns3P, PtdIns4P,
                                                               PtdIns5P), and PtdIns biphosphates (PtdIns(3,5)P2, PtdIns(4,5)P2). The presence of PtdIns(3,4)P2 or PtdIns(3,4,5)P3
                                                               in plants has not been reliable confirmed. Enzyme abbreviations are as follows: 5PTase Phosphatidylinositol
                                                               5-phosphatase, CDS Cytidine diphosphate diacylglycerol synthase, D50 DWARF50, CDP-DAG Cytidine diphosphate
                                                               diacylglycerol, DAG diacylglycerol, DGK Diacylglycerol kinase, FAB Phosphatidylinositol 3phosphate 5-kinase, GH1
                                                               Grain number and plant Height1, IMP Inositol monophosphatase, Ins myo-inositol (the positions on the inositol
                                                               ring are designated 1–6), IPKK Inositol-pentakisphosphate 2-kinase, IPMK Inositol polyphosphate multikinase,
                                                               IPTK Inositol 1,3,4-trisphosphate 5/6-kinase, MIK Myo-inositol kinase, MTM Phosphatidylinositol 3-phosphatase
                                                               myotubularin, NPC Non-specific phospholipase C, PA phytic acid, PAP Phosphatidic acid phosphatase, PATL Patellin
                                                               Sec14-domain, PI3K Phosphatidylinositol 3-kinase, PI4K Phosphatidylinositol 4-kinase, PIP5K Phosphatidylinositol
                                                               4-phosphate 5-kinase, PI-PLC Phosphatidylinositol-specific phospholipase, PIS Phosphatidylinositol synthase, PITP
                                                               Phosphatidylinositol-transfer proteins, PtdChol Phosphatidylcholine, PtdIns Phosphatidylinositol, PtdOH Phosphatidic
                                                               acid, VIP VIP/PPIP5K diphosphoinositol pentakisphosphate kinase, SAC Phosphatidylinositol 3,5-bisphosphate
                                                               5-phosphatase and Phosphatidylinositol 4-phosphate phosphatase, SNDP Sec14-nodulin domain-containing protein.

Scientific Reports |       (2020) 10:15896 |                                                          https://doi.org/10.1038/s41598-020-72985-6                                                                    5

                                                                                                                                                                                                               Vol.:(0123456789)
www.nature.com/scientificreports/

                                       Gene name     Gene ID         Gene product                                                EC number              FC
                                       VIP1          Os01g0777700                                                                                       − 0.96
                                                                     Diphosphoinositol-pentakisphosphate kinase (PPIP5K)         2.7.4.24
                                       VIP2          Os03g0689100                                                                                       2.57
                                       IPK1          Os04g0661200    Inositol-pentakisphosphate 2-kinase (IPKK)                  2.7.1.158              0.86
                                       IPK2          Os02g0523800    Inositol polyphosphate multikinase (IPMK)                   2.7.1.151; 2.7.1.140   − 1.13
                                       IPTK1         Os10g0103800                                                                                       0.80
                                       IPTK3         Os03g0726200                                                                                       1.37
                                                                     Inositol 1,3,4-trisphosphate 5/6-kinase (IPTK)              2.7.1.159
                                       IPTK5         Os10g0576100                                                                                       − 1.54
                                       IPTK6         Os09g0518700                                                                                       0.61
                                       INO1          Os03g0192700    Inositol-3-phosphate synthase 1 (MIPS)                      5.5.1.4                − 1.52
                                       MIK1          Os07g0507300    Myo-inositol kinase (MIK)                                                          0.55
                                       IMP1          Os03g0587000    Inositol monophosphatase (IMP)                              3.1.3.- ; 3.1.3.25     − 2.37
                                       NPC1          Os03g0826600                                                                                       − 1.84
                                       NPC2          Os01g0955000    Non-specific phospholipase (NPC)                            3.1.4.3                − 1.80
                                       NPC3          Os03g0852800                                                                                       − 5.50
                                       PAP-1         Os01g0666000                                                                                       − 3.73
                                       PAP-2         Os05g0549900                                                                                       − 2.91
                                                                     Phosphatidate phosphatase (PAP)                             3.1.3.4
                                       PAP-3         Os08g0359200                                                                                       0.55
                                       PAP-3         Os09g0308900                                                                                       0.66
                                       DGK5          Os03g0425300                                                                                       2.04
                                                                     Diacylglycerol kinase (DGK)                                 2.7.1.107
                                       DKK4          Os12g0576900                                                                                       0.88
                                       CDS2          Os01g0758400    Cytidine diphosphate diacylglycerol synthase (CDS)          2.7.7.41               0.83
                                       PIS           Os06g0492000    Phosphatidylinositol synthase (PIS)                         2.7.8.11               0.93
                                       PI3K          Os05g0180600                                                                                       1.24
                                                                     Phosphatidylinositol 3-kinase (PI3K)                        2.7.1.137
                                       PI3K-2        Os08g0307400                                                                                       2.07
                                       PI4K1         Os11g0209700                                                                                       1.04
                                                                     Phosphatidylinositol 4-kinase (PI4K)                        2.7.1.67
                                       PI4Kα         Os03g0711200                                                                                       1.00
                                       Fab1b-1       Os03g0399532                                                                                       1.21
                                       Fab1b-2       Os04g0691900                                                                                       2.48
                                       Fab1b-3       Os08g0104700                                                                                       0.88
                                       Fab1b-4       Os08g0450700                                                                                       1.40
                                       Fab1b-5       Os08g0450800    Phosphatidylinositol 3phosphate 5-kinase (FAB/PIKFYVE)      2.7.1.150              1.32
                                       Fab1c-1       Os06g0259000                                                                                       1.39
                                       Fab1c-2       Os08g0428900                                                                                       0.96
                                       Fab1c-3       Os09g0402300                                                                                       1.06
                                       Fab1d         Os12g0236700                                                                                       1.58
                                       PIPK1         Os03g0701800                                                                                       1.53
                                       PIP5K-1       Os02g0822500                                                                                       0.70
                                                                     Phosphatidylinositol 4-phosphate 5-kinase (PIP5K)           2.7.1.68
                                       PIP5K-2       Os03g0356582                                                                                       1.14
                                       PIP5K-3       Os07g0658700                                                                                       1.21
                                       MTM1          Os08g0556700    Phosphatidylinositol 3-phosphatase myotubularin-1 (MTM)     3.1.3.64; 3.1.3.95     0.60
                                       SAC1          Os08g0109100                                                                                       0.68
                                       SAC2          Os03g0182400                                                                                       0.68
                                                                     Phosphatidylinositol 3,5-bisphosphate 5-phosphatase (SAC)
                                       SAC3-1        Os02g0782600                                                                                       1.12
                                       SAC3-2        Os06g0195600                                                                3.1.3.                 1.36
                                       GH1           Os02g0554300                                                                                       0.94
                                       SAC7          Os11g0309000    Phosphatidylinositol 4-phosphate phosphatase (SAC)                                 1.15
                                       SAC8          Os03g0290500                                                                                       0.96
                                       5PTase1       Os01g0716800                                                                                       1.03
                                       5PTase6       Os03g0663700                                                                                       1.65
                                       5PTase7a      Os05g0489000                                                                                       1.01
                                                                     Phosphatidylinositol 5-phosphatase                          3.1.3.36
                                       5PTase9a      Os03g0238300                                                                                       − 2.42
                                       5PTase11      Os03g0626500                                                                                       0.83
                                       D50           Os02g0477700                                                                                       0.68
                                       PI-PLC4       Os05g0127200    Phosphatidylinositol‐specific phospholipase C (PI-PLC)      3.1.4.11               − 1.62
                                       Continued

          Scientific Reports |   (2020) 10:15896 |                  https://doi.org/10.1038/s41598-020-72985-6                                                   6

Vol:.(1234567890)
www.nature.com/scientificreports/

                             Gene name     Gene ID         Gene product                                         EC number          FC
                             PITP3         Os01g0926800                                                                            − 1.48
                             PITP6         Os02g0321500                                                                            0.55
                             PITP8         Os02g0752000                                                                            1.19
                             PITP10        Os05g0267800                                                                            1.54
                             PITP11        Os05g0267100                                                                            1.27
                             PITP12        Os03g0850700    Sec14-like phosphatidylinositol transfer proteins                       − 1.62
                             SNDP4         Os02g0133100                                                                            0.80
                             SNDP8         Os02g0721800                                                                            0.66
                             SNDP9         Os08g0497300                                                                            0.69
                             PATL1         Os05g0429400                                                                            − 0.90
                             PATL2         Os01g0874700                                                                            − 0.62

                            Table 1.  DEGs genes involved in the biosynthesis of Phosphatidylinositol and Inositol polyphosphates
                            in leaves of F. mosseae-inoculated rice plants. The EC (Enzyme Commission) number for each enzyme is
                            indicated. FC log2 Fold Change.

                            polyphosphates was found to be regulated in leaves of mycorrhizal plants (Fig. 4A,B; Table 1). They were: OsIPK1
                            (Inositol-pentakisphosphate 2-kinase, IPPK), involved in the phosphorylation of Ins(1,3,4,5,6)P5 to produce
                            Ins(1,2,3,4,5,6)P6 (phytic acid, or I­ nsP6), OsIPK2 (Inositolpolyphosphate multikinase, IPMK), involved in sequen-
                            tial phosphorylations from inositol triphosphates Ins(1,4,5)P3] to inositol-pentakisphosphate Ins(1,3,4,5,6)P5]
                            and OsIPTK1, OsIPTK3, OsIPTK5, OsIPTK6 (Inositol 1,3,4-trisphosphate 5/6-kinase, IPTK), involved in phos-
                            phorylation of the 5/6-position of inositol triphosphates Ins(1,3,4)P3] to produce inositol-tetrakisphosphate
                            Ins(1,3,4,5)P4 and Ins(1,3,4,6)P4 and Ins(1,3,4)P3. OsIPTK1, OsIPTK3, OsIPTK5 have ­InsP6 kinase activity
                            in vitro, and produce InsP7 and InsP8 from phytic a­ cid29. Also, OsVIP1 and OsVIP2, encoding inositol hexaki-
                            sphosphate and diphosphoinositol-pentakisphosphate kinase Vip1/PPIP5K-like proteins, produce InsP7 and
                            InsP8. VIP2, the rice homolog for the Arabidopsis VHI2 protein, critical for InsP8 ­production30, was upregulated
                            in leaves of mycorrhizal rice plants.
                                Collectively, results here presented support that the inoculation of rice roots with the AM fungus F. mosseae
                            results in systemic alterations in the expression of genes involved in the biosynthesis of inositol polyphosphates
                            and phosphoinositides. It is worth mentioning that although several studies described a correlation between
                            inositol phosphate metabolites and Pi homeostasis in the model dicotyledonous ­Arabidopsis30–34, at present, no
                            systematic study of phosphoinositide or inositolpolyphosphate signaling has been performed in AM symbiosis in
                            cereal species, as rice is. Similarly, cross-talk between inositol polyphosphates and JA signaling has been described
                            in ­Arabidopsis35–37. Taking into account that inositol phosphate metabolites act as important signaling molecules,
                            the observed mycorrhiza-induced alterations in the expression of genes involved in inositol phosphate metabolic
                            pathways is expected to have an impact on multiple signaling processes in mycorrhizal rice plants, including Pi
                            homeostasis and hormonal regulation. Along with this, genes involved in hormone signaling were also found to
                            be regulated in leaves of mycorrhizal rice plants, as described below.

                            Expression of genes related to hormone signaling in leaves of mycorrhizal rice plants.                           In addi-
                            tion to developmental regulation, plant hormones also play important roles in symbiotic interactions between
                            plants and AM ­fungi38. Each of the plant hormones possesses specific functions and they also interact with each
                            other either in an antagonistic or cooperative way. However, contradictory results have been reported in studies
                            related to hormone signaling in AM symbiosis, such as Jasmonic acid (JA), ethylene (ET), Salicylic acid (SA) and
                            auxins, which led to the notion that these regulatory mechanisms are dependent on the plant species and growth
                            conditions (e.g., Pi supply conditions)38. Contrary to what was previously described in Medicago truncatula and
                            tomato, the establishment of AM symbiosis appears to occur independently of Jasmonic Acid in r­ ice39.
                                Transcriptome analysis revealed a down-regulation of many genes involved in JA biosynthesis and signal-
                            ing in leaves of mycorrhizal plants (Fig. 5A; Supplementary Table S4). The mycorrhiza-regulated genes in the
                            JA biosynthesis pathway identified in this study are presented in Fig. 5B. Although most of our knowledge in
                            JA biosynthesis and signaling comes from studies in Arabidopsis, all homologs of Arabidopsis genes have been
                            identified in ­rice40. JA (and JA-derivatives) originates from lipids, preferentially α–linolenic acid, which is released
                            from galactolipids of chloroplast membranes. Linoleic acid is then converted to OPDA through the enzymes
                            Lipoxygenase (LOX), allene oxidase synthase (AOS), and allene oxide cyclase (AOC) in the chloroplast. OPDA
                            is then transported to peroxisomes where it is reduced by OPDA reductase (OPR), and after three rounds of
                            β-oxidation JA is produced. To note, among the mycorrhiza down-regulated genes in rice leaves, we identified
                            genes involved in the different steps of JA biosynthesis, namely Phospholipases A (PLA1-IIδ, PLA1-Iβ1, PLA1-Iγ1,
                            pPLA-IIIα, pPLA-IIϕ, pPLA-IIIβ, pPLA-IIIζ), Phospholipases C (PLC4, NPC1, NPC2, NPC3), Phospholipases D
                            (PLDα2, PLDα3, PLDζ2, PLDφ), Lipoxygenases (OsLOX1, OsLOX2, OsLOX5, OsLOX6, OsLOX7, OsLOX8, OsHI-
                            LOX, OsLOX), AOS (OsAOS1, OsAOS2), AOC (represented by a unique member in the rice genome), and OPR
                            (OsOPR1, OsOPR7, OsOPR10) genes (Fig. 5A,B; Supplementary Table S4). Although the functional implication
                            of this negative regulation of JA biosynthesis genes remains to be investigated, these findings suggest that JA

Scientific Reports |   (2020) 10:15896 |                  https://doi.org/10.1038/s41598-020-72985-6                                               7

                                                                                                                                              Vol.:(0123456789)
www.nature.com/scientificreports/

                         A                           Expression level Fold change
                                                     [log10(FPKM+1]     [log2FC]        B                                 Membrane lipids
                                                                                                                                   PLA1-II    PLC4      PLD   2
                                                                                                                                   PLA1-I 1 NPC1        PLD   3
                                                 0            1     2     −4    0 4                                                PLA1-I 1 NPC2        PLD   1
                                                                                                                   Phospholipases PLA-III     NPC4      PLD   2
                                                      - F.m       + F.m        +F.m/
                                                                               -F.m
                                                                                                                                   PLA-II               PLD
                                                     R1 R2 R3 R1 R2 R3                                                             PLA-III
                                        PLA1-II                                                                                    PLA-III
                                        PLA1-I 1                                                                            Linoleic acid
                                        PLA1-I 1
                                         PLA-III                                                                                   LOX1

                                                                                               Chloroplast
                                          PLA-II                                                                                   LOX2
                                         PLA-III                                                                    Lipoxygenases LOX5
                                         PLA-III                                                                                   LOX6
                                            PLC4                                                                                   LOX7
                                           NPC1                                                                                    LOX8
                                           NPC2                                                                                    HI−LOX
                                           NPC4                                                                                    LOX
                                          PLD 2
                                          PLD 3                                                                    13-hydroperoxylinoleic acid
                                          PLD 1                                                              Allene oxide synthase AOS1
                                          PLD 2                                                                                    AOS2
                                            PLD                                                                      12,13-epoxy linoleic acid
                           metabolism

                                            LOX1
                                            LOX2                                                              Allene oxide cyclase AOC
                               JA

                                            LOX5
                                            LOX6                                                              12-oxo-phylodienoic acid (12-OPDA)
                                            LOX7
                                            LOX8
                                          HI-LOX                                                                               12-OPDA
                                             LOX
                                           AOS1                                                                   OPDA Reductase OPR1
                                                                                                                                     OPR7

                                                                                               Peroxisome
                                           AOS2                                                                                      OPR10
                                             AOC
                                           OPR1                                                                                      Beta-oxidation
                                           OPR7
                                          OPR10                                                                          Jasmonic Acid (JA)
                                            COI2
                                            JAZ1
                                            JAZ3                                                                                  JA-Ile
                                            JAZ4
                                            JAZ6                                                                                        JAZ1
                                            JAZ7                                                             s                    JA-Ile
                                           JAZ11                                                    leu                                 JAZ3
                                                                                                Nuc               TPL                   JAZ4
                                         SAMS1                                                                          COI1   COI1-JAZ JAZ6 COI2
                           metabolism

                                         SAMS2                                                                   SCF                    JAZ7
                                          ACS5                                                                                          JAZ11
                               ET

                                          ACS6                                                                                            TFs
                                          ACO1                                                                                   JAZs
                                          ACO3                                                                   26S proteasome        JA-responsive genes
                                          ACO5

                                             Figure 5.  Differential expression of genes involved in biosynthesis of Jasmonic Acid and Ethylene in leaves of
                                             rice (cv Loto) plants. RNA-Seq was used to identify DEGs in leaves of F. mosseae-inoculated vs non-inoculated
                                             (+ F.m vs − F.m) plants at 23 dpi. (A) Heatmaps showing RNA-seq expression level and fold change as indicated
                                             in Fig. 4A legend. The full gene names and ID list are in listed in Supplementary Table S4. (B) Biochemical
                                             pathway for the synthesis of Jasmonic acid (JA). DEGs in leaves of AM-inoculated rice plants are indicated in
                                             purple (up-regulated) and green (down-regulated). Enzyme abbreviations are as follows: AOC Allene oxide
                                             cyclase, AOS Allene oxide synthase, COI Coronatine insensitive 1, HPL3 Hydroperoxide lyase 3, JAZ jasmonate
                                             ZIM-domain protein, LOX Lipoxygenase, NPC Non-specific phospholipase C, OPR 12-oxo-phylodienoic acid,
                                             PLA Phospholipase A, PLC Phospholipase C, PLD Phospholipase D, SCF SKp1, Cullin and F-box proteins, TPL
                                             TOPLESS protein.

                                             biosynthesis is repressed in leaves of mycorrhizal rice plants which is consistent with previous observations
                                             indicating that JA biosynthesis is dispensable for AM symbiosis in ­rice39.
                                                 Regarding JA signaling, it is known that perception of JA-Ile (the bioactive JA derivative) by CORONATINE
                                             INSENSITIVE 1 (COI1) and JASMONATE ZIM DOMAIN (JAZ) proteins triggers the degradation of JAZ pro-
                                             teins by the ­SCFCOI1 complex-mediated 26 proteasome for activation of downstream JA-responsive genes (Fig. 5).
                                             Whereas the Arabidopsis genome has a single COI1 gene (COI1), the rice genome contains three closely related
                                             COI genes (OsCOI1, OsCOI2, OsCOI3). The three COI genes play a role in JA signaling in rice by interacting with
                                             JAZ proteins in ­rice41. Our transcriptome analysis revealed up-regulation of OsCOI2, whereas 6 OsJAZ genes
                                             (OsJAZ1, OsJAZ3, OsJAZ4, OsJAZ6, OsJAZ7, OsJAZ11) were repressed in leaves of mycorrhizal plants (Fig. 5;
                                             Supplementary Table S4).
                                                 Among the set of down-regulated genes in leaves of mycorrhizal rice, we also identified the three key genes
                                             involved in ethylene biosynthesis, namely the S-adenosyl-L-methionine synthetase (OsSAMS1, OsSAMS2), which
                                             catalyzes the conversion of S-adenosylmethionine (AdoMet) from methionine, the 1-aminocyclopropane-1-car-
                                             boxylic acid (ACC) synthases (OsACS5) which catalyzes the conversion of AdoMet to ACC, the rate-limiting step
                                             in ET biosynthesis, and ACC oxidases (OsACO1, OsACO3, OsACO5) which catalyzes oxidation of ACC to form
                                             ethylene (Fig. 5A; Supplementary Table S4). Although not proven, this observation points to the repression of
                                             ethylene biosynthesis in rice leaves during AM symbiosis.

          Scientific Reports |          (2020) 10:15896 |                  https://doi.org/10.1038/s41598-020-72985-6                                             8

Vol:.(1234567890)
www.nature.com/scientificreports/

                       A                             - F.m       + F.m
                                                    R1 R2 R3 R1 R2 R3
                                                                          +F.m/
                                                                          -F.m
                                                                                      B
                                          PHT1;1                                                            Pi-limiting
                                          PHT1;4                                                            conditions
                                          PHT1;8
                                          PHT2;1
                                          PHT3;1                                                     InsP
                                          PHT3;5
                                   Pi     PHT4;1
                                          PHT4;3
                       transporters       PHT4;5
                                         PHO1-2                                                  SPX1         PHR1                PTF1
                                         PHO1-3                                                  SPX2         PHR3               WRKY74
                                       SPX-MFS1                                                  SPX3         PHR4               MYB4P
                                      SPX-MFS2                                                   SPX5         PHR5
                                       SPX-MFS3                                                  SPX6         PHR7
                                            VPE1                                                              PHR8
                                            VPE2                                                              PHR10
                                            SPX1                                                              PHR11
                                            SPX2
                                            SPX3
                               Signalling SPX5
                                            SPX6
                                           CK2α3                                                 miR399                   InsP            miR827
                                            PHR1
                                            PHR3
                                            PHR4
                                            PHR5                                                              PHO1-2
                         Transcription      PHR7                                                 PHO2         PHO1-3
                                factors     PHR8
                                           PHR10                                                                                     SPX-MFS1
                                           PHR11                                                                                     SPX-MFS2
                                             PTF1                                                PHT1;1
                                          MYB4P                                                  PHT1;4
                                        WRKY74                                                   PHT1;8
                                             IPS2

                                                                                                                                     SP
                                           mir827

                                                                                                                                          X-
                                                                                                                               SP
                                            PHO2                                         CK2α3

                                                                                                                                           MF
                                                                                                                                 X-
                                           PAP1a                                                                          SP

                                                                                                                                     M

                                                                                                                                             S1
                                                                                                                            X-
                                           PAP1c

                                                                                                                                      FS
                                                                                                                               MF
                                                                                                                                     S3

                                                                                                                                          2
                                           PAP1d                                                                                                  e
                                           PAP3c                                                                                               ol
                                           PAP9b                                                                                             cu
                                     Acid PAP10a                                                                        VPE1              Va
                          phosphatases PAP10c                                                                           VPE2
                                          PAP10d
                                           PAP15
                                          PAP21b
                                                                                                    1;1
                                           PAP23                                                  1;4

                                                                                                                            PHT2;1
                                                                                                 1;8
                                                                                               PHT

                                           PAP26
                                                                                              PHT
                                                                                             PHT
                                          PAP27a
                                          PAP27b
                          Ribonucleases RNS3ACP1
                                                                                                            xilem loading
                                           PR10a
                                            MGD1
                                           MGD2
                                            MGD3
                              Glycolipid DGD1-1
                           biosynthesis DGD1-2                                           Expression level Fold change
                                         DGD2-1                                          [log10(FPKM+1]     [log2FC]
                                         DGD2-2
                                            SQD1
                                          SQD2.1                                     0       1       2      −5 0 5
                                          SQD2.2

                              Figure 6.  Differential expression of genes involved in Pi signaling and homeostasis in leaves of rice (cv Loto)
                              plants. RNA-Seq was used to identify DEGs in leaves of F. mosseae-inoculated vs non-inoculated (+ F.m vs
                              − F.m) plants at 23 dpi. (A) Heatmap showing RNA-seq expression level and fold change as indicated in Fig. 4A
                              legend. The full gene names and ID list are in listed in Supplementary Table S5. (B) Regulatory network of Pi
                              starvation responses. The PHR and related transcription factors are negatively regulated by the SPX proteins,
                              which can sense Inositol polyphosphates (InsPs). Under P limitation, PHR relieves negative post-transcriptional
                              control of Pi transporters responsible of Pi uptake through the induction of MIR399 (targeting PHO2). In rice,
                              miR827 targets SPX-MFS1 and SPX-MSF2 transcripts. The SPX-MFS1 and SPX-MSF2 proteins, as well as the
                              Vacuolar Efflux Proteins (VPEs) modulate Pi homeostasis by regulating Pi influx and efflux from vacuoles.
                              Under sufficient Pi-conditions, the CK2α3/β3 kinase phosphorylates PHT1 resulting in retention of PHT1
                              transporters in the endoplasmic reticulum. InsPs are sensed by the SPX domain of SPX-EXS proteins (e.g.,
                              PHO1-2, PHO1-3) and SPX-MFS proteins. Most of these studies have been done in ­Arabidopsis43.

                              Expression pattern of genes involved in Pi signaling and homeostasis. As previously mentioned,
                              genes in the “Cellular Response to Phosphate starvation” GO term were highly represented among down-regu-
                              lated DEGs in leaves of mycorrhizal rice plants (Fig. 3B, right panel). This category included genes that mediate
                              Pi signaling, transport, and remobilization. In particular, the expression of an important number of phosphate
                              transporters was found to be down-regulated. They included: members of the PHT phosphate transporters
                              belonging to the PHT1 (OsPHT1;1, PHT1;4, OsPHT1;8), PHT2 (OsPHT2;1), PHT3 (OsPHT3;1, OsPHT3;5)
                              and PHT4 (OsPHT4;1, OsPHT4;3, OsPHT4;5) families, and PHOSPHATE1 (PHO1) transporters (OsPHO1-2,

Scientific Reports |     (2020) 10:15896 |              https://doi.org/10.1038/s41598-020-72985-6                                                         9

                                                                                                                                                      Vol.:(0123456789)
www.nature.com/scientificreports/

                                       OsPHO1-3) (Fig. 6A; Supplementary Table S5). In Arabidopsis, phosphorylation of PHT1 phosphate transport-
                                       ers by CK2α3/β3 kinase negatively affects trafficking to the plasma membrane from the endoplasmic ­reticulum42.
                                       We noticed that the CK2α3 subunit gene was up-regulated in leaves of mycorrhizal rice pointing to a possible
                                       retention of PHT1 transporters in the ER (Fig. 6A; Supplementary Table S5). Figure 6B represents the signaling
                                       events involved in Pi homeostasis altered in mycorrhizal rice plants.
                                            PHR1 (PHOSPHATE STARVATION RESPONSE 1), a member of the MYB superfamily of transcription fac-
                                       tors, has been shown to control the transcriptional activation and repression responses to phosphate starvation
                                       in ­plants43–46 In particular, PHR1 and related transcription factors are known to be key players in Pi signaling in
                                      Arabidopsis and r­ ice43,45,46. To note, the expression of several PHR transcription factors were regulated in leaves
                                      of mycorrhizal plants (Fig. 6; Supplementary Table S5). Of them, OsPHR4 was strongly down-regulated, indicat-
                                      ing that this particular PHR family member might have a specific function in regulating Pi homeostasis in leaves
                                      of mycorrhizal rice. Other transcription factors that are involved in the phosphate starvation responses were
                                      also regulated in leaves of mycorrhizal rice, such as OsMYB4P and OsWRKY74 (down-regulated), or PTF1 (up-
                                      regulated) (Fig. 6; Supplementary Table S5)47–49. Furthermore, the expression of several SPX domain-containing
                                       protein genes was repressed in leaves of mycorrhizal plants (OsSPX1, OsSPX2, OsSPX3, OsSPX5, OsSPX6). SPX
                                       domain-containing proteins are known to function as a sensor for Pi level in controlling Pi h   ­ omeostasis50,51.
                                            Pi import and export from the vacuole, the primary intracellular compartment for Pi storage in plant cells,
                                       serve as a critical mechanism for the maintenance of appropriate cytosolic Pi levels. In rice, three members of
                                       SPX proteins possess an MFS (Major Facilitator Superfamily) domain, and are involved in Pi transport across the
                                       tonoplast, SPX-MSF1, SPX-MSF2, and SPX-MSF3. An opposite behavior in the expression of these genes could
                                       be observed in leaves of mycorrhizal rice plants (down-regulation of OsSPX-MSF2; up-regulation of OsSPX-MSF1
                                       and OsSPX-MSF3). In this respect, Pi deficiency was reported to induce (OsSPX-MSF2) or repress (OsSPX-MSF1,
                                       OsSPX-MSF3) the expression of these genes in r­ ice51. Expression of the vacuolar Pi efflux transporters OsVPE1
                                      and OsVPE2 was also down-regulated in leaves of mycorrhizal rice (Fig. 6A,B; Supplementary Table S5).
                                            Genes that have proven to be implicated in the remobilization of Pi from organic P resources, such as pur-
                                       ple acid phosphatases (PAPs), acid phosphatase (ACP1), and ribonucleases (RNS3, PR10a) were repressed in
                                       leaves of mycorrhizal rice plants, indicating that these plants have an adequate P status (Fig. 6A; Supplementary
                                       Table S5). In this respect, it is well known that membrane phospholipids (a major source for internal Pi supply)
                                       are degraded under Pi limiting conditions, which are then replaced by non-phosphorus lipids (galactolipids and
                                       sulfolipids). Galactolipids are essential for a functional photosynthetic apparatus in the chloroplast, and include
                                       monogalactosyldiacylglycerol (MGDG) and digalactosyldiacylglycerol (DGDG) lipids, which are synthesized by
                                       MGDG synthase (or MGD) and DGDG synthase (or DGD). Plants have evolved various acclimation responses to
                                       cope with phosphate depletion, including Pi remobilization from endogenous phosphorus-containing resources
                                       like ­phospholipids52. Thereby membrane phospholipids are dephosphorylated and can be used as an internal
                                      phosphate source, while galactolipids are incorporated into the membrane to maintain membrane functionality.
                                      Remarkably, the expression of genes involved in the biosynthesis of these major galactolipids, MGDG (OsMGD1,
                                      OsMGD2, OsMGD3) and DGDG (OsDGD1-1, OsDGD1-2, OsDGD2-1, OsDGD2-2) was regulated in leaves
                                      of mycorrhizal rice, their expression being mainly down-regulated in leaves of mycorrhizal rice (Fig. 6; Sup-
                                      plementary Table S5). These observations suggest that membrane lipid remodeling toward galactolipids, most
                                      probably, does not occur in leaves of mycorrhizal plants because of the greater capacity of mycorrhizal roots to
                                      take up Pi. On the other hand, the synthesis of sulfolipids is catalyzed by uridine diphosphate-sulfoquinovose syn-
                                      thase (encoded by OsSQD1) and sulfoquinovosyldiacylglycerol synthase (OsSQD2). The expression of OsSQD1,
                                      OsSQD2.1 and OsSQD2.2 was repressed in leaves of mycorrhizal rice.
                                            On the other hand, the implication of the microRNAs miR399 and miR827 in regulating Pi starvation
                                       responses in plants is well d­ ocumented50,53. Our transcriptome analysis revealed down-regulation of miR827, and
                                      up-regulation of its target gene SPX-MSF1 encoding a vacuolar Pi transporter (Fig. 6; Supplementary Table S5),
                                      which was further confirmed by qRT-PCR and statistical analysis of miR827 precursor transcripts and SPX-MSF1
                                      (Fig. 7A). miR827 transcripts were barely detectable in mycorrhizal rice. Thus, a miR827-mediated cleavage of
                                      SPX-MSF1 transcripts would regulate the intracellular distribution of Pi between the cytoplasm and v­ acuoles50,51.
                                            On the other hand, the rice miRNA399 family consists of 11 members (miRNA399a to miR399k; miR-
                                      BASE v22.1) (Supplementary Fig. S3), all of then targeting the PHOSPHATE2 (OsPHO2, also named LTN,
                                      Leaf Tip Necrosis) gene, which encodes a ubiquitin-conjugating E2 enzyme that mediates the degradation of Pi
                                      ­transporters54,55. As for most rice miRNAs, no RAP-DB gene ID is currently assigned to any of the miR399 fam-
                                       ily members, and, accordingly, this miRNA was not identified as DEG in our RNA-seq analysis. Nevertheless,
                                       the miR399 target OsPHO2 was significantly up-regulated in leaves of mycorrhizal rice (Fig. 6; Supplementary
                                       Table S5). Accordingly, the expression of each miR399 member was analyzed by qRT-PCR. Precursor tran-
                                       scripts for seven out of the eleven miR399 family members (MIR399a, MIR399b, MIR399c, MIR399d, MIR399e,
                                       MIR399i, MIR399j) accumulated in leaves of non-mycorrhizal control plants, these plants being grown under low
                                       Pi supply (Fig. 7A). Of them, MIR399a, MIR399b, MIR399c, MIR399d, MIR399j were barely detectable in leaves
                                       of mycorrhizal plants. Conversely, MIR399e and MIR399i precursor transcripts accumulated at higher or similar
                                       level, respectively, in mycorrhizal plants compared with non-mycorrhizal plants. These results demonstrated
                                       a statistically significant differential regulation (from repression to activation) of miR399 family members in
                                       leaves of mycorrhizal rice plants. In this study, precursor transcripts for MIR399f, MIR399g, and MIR399h were
                                       undetectable. As expected and in accordance with RNA-seq data, anticorrelation between MIR399 and OsPHO2
                                       occurred in leaves of mycorrhizal rice (Fig. 7B).
                                            Overall, comparative analysis of leaf transcriptomes of mycorrhizal and non-mycorrhizal rice plants revealed
                                       systemic regulation of distinct members of genes involved in Pi signaling and homeostasis. Repression of phos-
                                       phate starvation-responsive genes and those involved in the biosynthesis of non-phosphorus membrane lipids

          Scientific Reports |   (2020) 10:15896 |               https://doi.org/10.1038/s41598-020-72985-6                                             10

Vol:.(1234567890)
www.nature.com/scientificreports/

                            A                      0.06
                                                          pre-miR827      x100
                                                                          0.12   SPX-MFS1

                                Expression level
                                                                                          *
                                                                                                           -F.m (non-inoculated)
                                                   0.03                   0.06                             +F.m (+ Funneliformis mosseae)

                                                   0.00           *       0.00
                                                          - F.m + F.m            - F.m + F.m

                            B               x1000
                                                   0.10
                                                          pre-miR399a x1000
                                                                       0.10
                                                                            pre-miR399b x100 pre-miR399c x10 pre-miR399d
                                                                                        0.10             0.10

                                Expression level   0.05                   0.05                   0.05                  0.05

                                                   0.00           *       0.00            *      0.00           *      0.00           *
                                                   x100   pre-miR399e     x10    pre-miR399i      x10 pre-miR399j x10 PHO2
                                                   0.12                   0.06                   0.02             0.08
                                Expression level

                                                                  *                                                                   *
                                                   0.06                   0.03                   0.01                  0.04

                                                   0.00
                                                          - F.m + F.m
                                                                          0.00
                                                                                 - F.m + F.m
                                                                                                 0.00           *
                                                                                                        - F.m + F.m
                                                                                                                       0.00
                                                                                                                              - F.m + F.m

                            Figure 7.  Accumulation of miR399 and miR827 precursor transcripts in leaves of mycorrhizal plants. RNA was
                            obtained from leaves of non-inoculated (− F.m) and AM inoculated (+ F.m) rice (cv. Loto) plants at 23 dpi. The
                            expression level was determined by qRT-PCR. Primers used sequences are listed in Supplementary Table S6.
                            Data are mean ± SE (n = 3; each sample consisted of a pool of 3 individual leaves; *p < 0.05, ANOVA test). (A)
                            Accumulation of precursor transcripts for miR827 and its target genes OsSPX-MFS1. (B) Accumulation of
                            precursor transcripts for miR399 family members and its target genes OsPHO2.

                            is consistent with an improved Pi nutrition, as revealed by the observation that mycorrhizal Loto plants have a
                            higher Pi content in leaves than non-mycorrhizal plants (Fig. 1D).

                            Discussion
                            Although rice is the staple food of more than half of the world’s population, very few studies focused on the
                            impact of root colonization by AM fungi on rice. Here, we show that inoculation with F. mosseae stimulates
                            growth and increases Pi content in leaves of rice plants (cv Loto), supporting that Loto plants are effectively
                            colonized by this AM fungus. We also show that root colonization by F. mosseae is associated to massive systemic
                            transcriptional alterations in the rice leaf transcriptome. The transcriptional responses in leaves of mycorrhizal
                            rice plants appear to differ substantially from those previously reported in roots of rice plants colonized by R.
                            irregularis19,56. Here, alterations in the expression of genes related to mineral transport were described in lateral
                            roots, whereas secondary cell wall and phytohormone metabolism genes are regulated in adult crown ­roots19.
                            As AM symbiosis improves Pi nutrition with the potential to optimize rice production, a deeper understanding
                            of transcriptional regulatory mechanisms underlying AM symbiosis in rice is a requisite to ultimately use this
                            symbiotic association in rice cultivation while avoiding the adverse impact of chemical fertilizers.
                                Diverse processes were regulated in leaves of mycorrhizal rice plants, such as those related to phospholipid
                            and hormone signaling, as well as regulatory mechanisms controlling Pi homeostasis (summarized in Fig. 8).
                            Reprogramming of host gene expression in leaves is potentially important to maintain an appropriate Pi status
                            in the plant and a stable symbiotic relationship.
                                Results here presented revealed systemic alterations in the expression of genes involved in phosphatidylino-
                            sitol metabolism and signaling, including major phospholipids (phosphoinositides), inositol polyphosphates,
                            and non-phosphorus lipids (galactolipids and sulfolipids). Whereas most genes involved in phosphoinositide
                            and inositol polyphosphate biosynthesis were up-regulated in leaves of mycorrhizal rice, genes involved in the
                            biosynthesis of non-phosphorus lipids (galactolipids and sulfolipids) were essentially down-regulated. Studies
                            in Arabidopsis have shown that plants adapt to low P status by replacing phospholipids by galactolipids and
                            sulfolipids. Accordingly, non-phospholipid biosynthesis is induced while phospholipid biosynthesis is repressed
                            in Pi-starved p­ lants58,59. Our transcriptome analysis showed activation of phospholipid biosynthesis genes (Fig. 4)
                            and repression of non-phosphorus lipid biosynthesis genes (Fig. 6) in leaves of mycorrhizal rice plants (sum-
                            marized in Fig. 8). These findings suggest that inoculation with F. mosseae provides an adequate Pi level to the
                            rice plant and that Pi acquired in AM colonized roots is used efficiently. Regulation of phospholipid biosynthesis
                            genes reinforces the notion that phospholipids might play a central role in the AM symbiosis.
                                Transcript profiling also revealed up-regulation of kinase genes involved in phosphatidylinositol biosynthetic
                            processes. Plant phosphoinositides and inositol polyphosphates are formed via phosphorylation of the phospho-
                            lipid PtdIns by the activity of specific kinases. Dynamic changes in phosphoinositide levels occur in plant tissues
                            in which enzymes mediating biosynthesis and degradation of phosphoinositides are continuously synthesized

Scientific Reports |   (2020) 10:15896 |                                https://doi.org/10.1038/s41598-020-72985-6                              11

                                                                                                                                            Vol.:(0123456789)
www.nature.com/scientificreports/

                                                                                           Phosphatidylnositol/Inositol metabolism
                                                                              PI3K                    MTM1      PITP3        VIP1
                                                                            PI3K-2                    SAC1      PITP6       VIP2
                                                                             PI4K1                    SAC2      PITP8        IPK1
                                                                             PI4Kα                   SAC3-1    PITP10       IPK2          2.5
                                                                           Fab1b-1                   SAC3-2    PITP11      IPTK1

                                                                                                                                                Log2 FC
                                                                           Fab1b-2                     GH1     PITP12      IPTK3            0
                                                                           Fab1b-3                    SAC7     SNDP4       IPTK5
                                                                           Fab1b-4                    SAC8     SNDP8       IPTK6
                                                                           Fab1b-5                  5PTase1    SNDP9        INO1           −8
                                                                           Fab1c-1                  5PTase6     PATL1       MIK1
                                                                           Fab1c-2                 5PTase7a     PATL2       IMP1
                                                                           Fab1c-3                 5PTase9a
                                                                             Fab1d                 5PTase11                 Post-trancriptional
                                                                             PIPK1                      D50                   regulation (Pi)
                                                                           PIP5K-1
                                                                           PIP5K-2                      PIS                         miR399a
                                                                           PIP5K-3                  PI-PLC4                         miR399b
                                                                                                                                    miR399c
                                                                                                                                    miR399d
                                                                 AM symbiosis                                                       miR399e
                                                                                                                                    miR399i
                                                                  CASTOR                                                            miR399j
                                                                  POLLUX                                                             miR827
                                                                   NUP85                                                               IPS2
                                                                  NUP133
                                                                    NOPE                                                        Transcriptional
                                                                    STR2                                                          regulation
                                                                                                                                       PHR1
                                                                   Non-phosphorus                                                      PHR3
                                                                 lipids biosynthesis                                                   PHR4
                                                                                                                                       PHR5
                                                                                       MGD1
                                                                  Sulfol. Galactolipids

                                                                                                                                       PHR7
                                                                                       MGD2                                            PHR8
                                                                                       MGD3                                           PHR10
                                                                                      DGD1-1                                          PHR11
                                                                                      DGD1-2                                            PTF1
                                                                                      DGD2-1
                                                                                      DGD2-2                                        Signaling (Pi)
                                                                                       SQD1                                            SPX1
                                                                                      SQD2.1                                           SPX2
                                      Phosphate remobilization

                                                                                      SQD2.2                                           SPX3
                                                                                                                                       SPX5
                                                                          Ribonucleases                                                SPX6
                                                                                                                                      PHFL1
                                                                                           RNS3                                       CK2α3
                                                                                          PR10a                                        PHO2
                                                                                                                                     Phosphate
                                                                                       Acid                                         transporters
                                                                                   Phosphatases
                                                                                                                                  PHT1;1
                                                                                           PAP1a                                 PHT1;4
                                                                                           PAP1c                                 PHT1;8
                                                                                           PAP1d                                  PHT2;1
                                                                                           PAP3c                                  PHT3;1
                                                                                           PAP9b                                 PHT3;5
                                                                                          PAP10a                                  PHT4;1
                                                                                          PAP10c                                 PHT4;3
                                                                                          PAP10d                                 PHT4;5
                                                                                           PAP15                                 PHO1-2
                                                                                          PAP21b                                 PHO1-3
                                                                                           PAP23                               SPX-MFS1
                                                                                           PAP26                               SPX-MFS2
                                                                                          PAP27a                               SPX-MFS3
                                                                                          PAP27b                                   VPE1
                                                                                            ACP1                                   VPE2
                                                 AM symbiosis:
                                                 CERK1
                                                 NOPE
                                                 SYMRK1
                                                 CASTOR                                                                     +F. mosseae
                                                 POLLUX
                                                 CCaMK
                                                 CYCLOPS
                                                 STR1, STR2
                                                 PT11, PT13
                                                 AM-related genes

                                      Figure 8.  Summary of systemically regulated genes in leaves of mycorrhizal rice plants. Genes involved in
                                      phosphatidylinositol biosynthesis and phospholipid-based signaling events are indicated. Heatmaps showing
                                      log2 fold change (AMF-inoculated vs non inoculated) rice (cv. Loto) plants are included. Up-regulated (purple)
                                      and down-regulated (green) DEGs. The expression of genes involved in AM symbiosis has been mostly studied
                                      in roots of mycorrhizal ­plants57. In this study, several AM symbiosis-related genes were also found to be
                                      up-regulated in leaves of mycorrhizal rice plants, such as two cation channels OsCASTOR (Os03g0843600) and
                                      OsPOLLUX (Os01g0870100), and two nuclear porins OsNUP85 (Os01g074620) and OsNUP133 (Os03g022550).

                                      and ­degraded27. With this in mind, it is not surprising to find that kinase and phosphatase genes regulating a par-
                                      ticular reaction opposite one another are both up-regulated. In comparison to enzymes of phosphatidylinositol
                                      biosynthesis, however, there is only limited information about phosphatases and/or phospholipases involved in
                                      phosphatidylinositol degradation. Whereas biochemical assays can only reveal global kinase activity, transcript
                                      profiling allowed us to discriminate among members of the same family that are specifically regulated in leaves
                                      of mycorrhizal rice (e.g., IPTKs or inositol kinases).

          Scientific Reports |   (2020) 10:15896 |                                                      https://doi.org/10.1038/s41598-020-72985-6        12

Vol:.(1234567890)
www.nature.com/scientificreports/

                                 As phospholipids are one of the main structural components of membranes, alterations in the expression of
                            phospholipid biosynthesis genes might influence membrane structure and/or function. But phospholipids and
                            inositol polyphosphates are also important signaling molecules that function as cofactors of partner proteins.
                            It is tempting to hypothesize that alterations in phospholipid biosynthesis genes are accompanied by changes
                            in the level of these metabolites, which would then have an impact on diverse cellular processes. However, the
                            functional implications of alterations in phospholipid biosynthesis genes in AM symbiosis in rice have yet to be
                            clarified. It will now be of interest to investigate whether mycorrhiza-induced alterations in phospholipids have a
                            consequence in long-distance signaling. In this respect, the presence of phospholipids and phospholipid-binding
                            proteins, in the phloem of several plant species has long been ­reported60–62. A phospholipid-based signaling
                            mechanism might then operate during AM symbiosis.
                                 Moreover, alterations in inositol polyphosphate biosynthesis genes might have an effect on hormonal signal-
                            ing processes, particularly with regard to JA signaling. In favor of this hypothesis, InsP5 and InsP4 were found to
                            interact with the COI/JAZ complex involved in JA perception in ­Arabidopsis36. In other studies, InsP7 and InsP8
                            were reported to promote the binding between COI1 and JAZ1 for the regulation of JA-dependent ­responses30.
                            The VIP gene functioning in phosphorylation of PP-IP5 (named as VIH2 in Arabidopsis) regulates the synthesis
                            of InsP8, the cofactor of the COI-JAZ receptor ­complex30. Results here presented, together with those obtained
                            by other authors, broadens our view on the existence of cross-talk between phospholipid metabolism and JA
                            signaling processes during AM symbiosis. Clearly, many efforts are still needed to understand the connections
                            between these signaling pathways in AM symbiosis.
                                 Plants associate with AM fungi when grown under low Pi soil conditions and, accordingly, AM symbiosis is
                            generally studied in plants grown in low Pi. In line with this, down-regulation of Pi starvation-responsive genes
                            occurs in leaves of mycorrhizal rice compared with non-mycorrhizal plants (the later ones responding to the
                            situation of low Pi supply). Among the down-regulated genes in leaves of mycorrhizal rice, we identified genes
                            belonging to different families of Pi-responsive genes. They included genes involved in: (i) Pi transport (e.g.
                            several PHT, vacuolar transporters; PHO1); (ii) signaling processes (SPX domain, CK2α3, PHO2); (iii) tran-
                            scriptional regulation (PHR, PTF1 transcription factors); (iv) post-transcriptional regulation (miR399, miR827);
                            (v) Pi recycling (phosphatases, RNases); and (vi) non-phosphorus membrane lipid biosynthesis (galactolipids,
                            sulpholipids). Pi starvation-responsive genes whose expression is regulated in leaves of mycorrhizal rice are
                            summarized in Fig, 8. A differential regulation of genes belonging to each one of these families points to a
                            specialization of these mycorrhiza-regulated family members in controlling Pi homeostasis in rice leaves. As
                            an example, a functional specialization of miR399 species in regulating Pi homeostasis in leaves of mycorrhizal
                            plants can be anticipated. Also, down-regulation of genes involved in Pi starvation responses or Pi remobiliza-
                            tion from macromolecules (PAPs, RNases, galactolipid and sulfolipid biosynthesis genes) further supports that
                            rice plants have a normal level of Pi.
                                 As an additional level of complexity in the regulation of Pi homeostasis in plants, there is growing evidence
                            on a regulatory role of inositol polyphosphates in Pi ­signaling33. Indeed, the SPX domain was recently defined as
                            a Pi sensor in Arabidopsis plants that regulates Pi transport activity of SPX domain-containing proteins through
                            binding inositol polyphosphate signaling m      ­ olecules32,33. Additionally, the Arabidopsis PHR1 and rice PHR2
                            transcription factors, which are recognized as central components of the phosphate starvation response, have
                            been shown to interact with SPX p    ­ roteins63,64. The interaction between SPX proteins and the AtPHR1 transcrip-
                            tion factor results in PHR1 inactivation, being this interaction promoted by inositol p    ­ olyphosphates34. Results
                            here presented demonstrated connections between inositol polyphosphate metabolism and Pi homeostasis in
                            AM symbiosis. Furthermore, mechanisms involved in Pi homeostasis and hormonal signaling must be tightly
                            regulated in leaves of mycorrhizal rice, which would then allow the host plant to maximize the benefits of Pi
                            acquisition during association with the AM fungus. Additional studies are, however, needed to determine the
                            exact mechanisms by which phospholipids might exert a regulatory function in maintaining Pi homeostasis and
                            how this would affect hormonal processes in mycorrhizal rice plants.
                                In conclusion, our work provided new insights on the systemic alterations in gene expression during the
                            symbiotic association of rice plants with an AM fungus. Phosphorus deficiency is widespread in all major rice
                            ecosystems and is the major growth-limiting factor in acid upland soils where soil P-fixation capacity is often
                            high (https​://www.knowl​edgeb​ank.irri.org). To circumvent this problem, P fertilizers are applied extensively
                            in rice farming to improve plant performance, but their use has negative effects on the environment. Although
                            there are still numerous issues that still need to be addressed, pieces of evidence here presented might accelerate
                            research on the AM symbiosis in rice, which will open new avenues for improvement of sustainability in rice
                            production. A more sustainable way to improve mineral nutrition in rice would be through the use of AM fungi,
                            which would also avoid the overuse of chemical fertilizers.

                            Materials and methods
                            Plant and fungal material. The rice cultivar Loto (Oryza sativa ssp japonica) was used in this study. Loto
                            rice is a heritage variety of short-grain rice widely cultivated in northern Italy (the first rice producer in Europe),
                            also grown in southern Switzerland (the northern-most rice-growing region in Europe) and northern United
                            States (Vermont State), making Loto a suitable rice variety for rice farming in northern latitudes.
                                The AMF fungus Funneliformis mosseae (formerly Glomus mosseae; FR140) was purchased from MycAgro
                            (Bretenière, France; https​://www.mycag​rolab​.com/) in a granular form composed of mineral inert solid particles
                            (clay, zeolite) and F. mosseae propagules at a concentration of minimum 10 propagules/gram.

                            Inoculation with F. mosseae and growth of AMF‑inoculated plants. Rice Loto seeds were
                            dehusked, surface-sterilized twice with 5% sodium hypochlorite for 15 min, and washed extensively with sterile

Scientific Reports |   (2020) 10:15896 |                https://doi.org/10.1038/s41598-020-72985-6                                              13

                                                                                                                                            Vol.:(0123456789)
www.nature.com/scientificreports/

                                      water. Seeds were germinated on Petri dishes with sterile water for 7 days and then transplanted to 150 ml-cones
                                      (20.5 cm; 2 plants/cone) containing a mix of 63.3% quartz sand (0.3–0.8 mm), 31.6% soil (turface and ver-
                                      miculite 2:1), and 5% of granular inoculum of Funneliformis mosseae. No inoculum was added to the substrate
                                      for the non-inoculated, control plants. Transplanted seedlings were then grown under aerobic conditions at
                                      the greenhouse under a 14 h/10 h day/night cycle, 28 ºC/25 ºC, and 60% humidity for the required time. Rice
                                      seedlings were bottom-watered during the whole experiment. Fertirrigation was supplied at nine days after
                                      F. mosseae inoculation, using a modified Hoagland half-strength solution (15 ml, every two days) containing
                                      2.5 mM ­KNO3, 2.5 mM Ca(NO3)2·4H2O, 1 mM ­MgSO4·7H2O, 0.5 mM ­NH4NO3, 25 μM ­KH2PO4, 23.15 μM
                                      ­H3BO3, 4.55 μM M ­ nCl2·4H2O, 0.38 μM Z ­ nSO4·7H2O, 0.1 μM C   ­ uSO4·5H2O, 0.14 μM N  ­ a2MoO4·2H2O, 26 μM
                                      Fe-EDDHA, pH 5.5)65.

                                      Analysis of root colonization. Root fragments were collected at eight weeks post-inoculation with F.
                                      mosseae and stained with 0.1% cotton blue in acid lactic as previously d­ escribed66. Fifty root fragments (1 cm)
                                      per biological replicate (n = 3) were examined with a light microscope, and the intensity of root cortex coloniza-
                                      tion was ­determined67. AMF structures were examined using an Axiophot Zeiss microscope equipped with a
                                      Digital color camera (DP70 Olympus) and 40 × magnification.

                                      Transcriptome analysis by RNA‑Seq. Total RNA was extracted from rice leaves of 30-day old plants that
                                      had been root-inoculated with F. mosseae (23 days post-inoculation), or not, using Maxwell(R) RSC Plant RNA
                                      Kit (Promega). Three biological replicates for each condition were examined, each biological replicate consisting
                                      of leaves from five individual plants (the youngest totally expanded leaf was selected from each individual plant).
                                      RNA concentration and purity were checked using a spectrophotometer (NanoDrop, ND-1000). RNA quality
                                      and integrity were evaluated using an Agilent 2100 Bioanalyzer (Agilent Technologies, Inc.), and only samples
                                      with an. RNA integrity number (RIN) ≥ 8 were used. RNA was analyzed by sequencing six libraries. An average
                                      of 32 736 498 clean reads/library were reported (Supplementary Table S6). Raw 125 bp paired-end reads process-
                                      ing and analysis were carried out as previously d ­ escribed65. RNA‐Seq raw data are available at the NCBI GEO
                                      database (https​://www.ncbi.nlm.nih.gov/geo) under the accession number GSE148574.
                                          Reads were mapped against the reference genome, Oryza sativa Japonica (IRGSP-1.0). To identify genes
                                      with significant differences in expression, an FDR cutoff < 0.01 and log2FC -0.5 ≤ or ≥ 0.5 was applied. Gene
                                      Ontology (GO) enrichment analysis (GOEA) was performed with AgriGO based on the hypergeometric test,
                                      and a minimum FDR of 0.05 was considered. Multiple testing corrections controlling false positives were also
                                      performed with the Benjamini–Hochberg method both for differential expression analysis and GOEA. (https​://
                                      bioin​fo.cau.edu.cn/agriG​Ov2/)68. Enriched GO terms were clustered and plotted with the online analysis tool
                                      ReviGO (https​://revig​o.irb.hr/)69.

                                      Expression analysis by qRT‑PCR.            Total RNA was extracted as described above. Quantitative RT-PCR
                                      (qRT-PCR) analyses were performed using 1 μg of total RNA and poly-dT using the High Capacity cDNA
                                      Reverse Transcription kit (Life technology, Applied Biosystems). PCR amplification was carried out using Light-
                                      Cycler 480 thermocycler (Roche Diagnostics, Mannheim, Germany) from 2 μl cDNA (5 ng/μl) with SYBR Green
                                      I dye and gene-specific primers (Supplementary Table S7). The rice Ubiquitin1 (Ubi1) or Ubiquitin-conjugating
                                      Enzyme 1 (UBC1) were used as housekeeping gene for normalization with the same results. For statistical analy-
                                      sis, the means and standard errors were calculated using Microsoft Excel. Significant differences were assessed
                                      using ANOVA test (p-value ≤ 0·05).

                                      Chlorophyll and Pi content. Rice plants were F. mosseae-inoculated or not, and grown under greenhouse
                                      conditions as described above. At 23 days after AMF inoculation, the youngest totally expanded leaves were
                                      harvested. Chlorophyll content of rice leaves was determined using a chlorophyll meter (SPAD 502 Plus Chloro-
                                      phyll Meter, Spectrum Technologies) as previously d ­ escribed65. Pi content of rice leaves was determined using a
                                                                           70
                                      colorimetric as previously ­described .

                                      Data availability
                                      The RNA‐Seq data that support the findings of this study are available at the NCBI GEO repository (https:​ //www.
                                      ncbi.nlm.nih.gov/geo) under the Accession Number GSE148574.

                                      Received: 17 April 2020; Accepted: 9 September 2020

                                      References
                                       1. Parniske, M. Arbuscular mycorrhiza: the mother of plant root endosymbioses. Nat. Rev. Microbiol. 6, 763–775 (2008).
                                       2. Bonfante, P. & Genre, A. Mechanisms underlying beneficial plant–fungus interactions in mycorrhizal symbiosis. Nat. Commun.
                                          1, 48 (2010).
                                       3. Smith, S. E. & Read, D. J. Mycorrhizal Symbiosis (Academic Press, Cambridge, 2008).
                                       4. Choi, J., Summers, W. & Paszkowski, U. Mechanisms underlying establishment of arbuscular mycorrhizal symbioses. Annu. Rev.
                                          Phytopathol. 56, 135–160 (2018).
                                       5. MacLean, A. M., Bravo, A. & Harrison, M. J. Plant signaling and metabolic pathways enabling arbuscular mycorrhizal symbiosis.
                                          Plant Cell 29, 2319–2335 (2017).
                                       6. Müller, L. M. & Harrison, M. J. Phytohormones, miRNAs, and peptide signals integrate plant phosphorus status with arbuscular
                                          mycorrhizal symbiosis. Curr. Opin. Plant Biol. 50, 132–139 (2019).

          Scientific Reports |   (2020) 10:15896 |                  https://doi.org/10.1038/s41598-020-72985-6                                                      14

Vol:.(1234567890)
You can also read