Chlorophyll fluorescence analysis in diverse rice varieties reveals the positive correlation between the seedlings salt tolerance and ...
←
→
Page content transcription
If your browser does not render page correctly, please read the page content below
Tsai et al. BMC Plant Biology   (2019) 19:403
https://doi.org/10.1186/s12870-019-1983-8

 RESEARCH ARTICLE                                                                                                                                Open Access

Chlorophyll fluorescence analysis in diverse
rice varieties reveals the positive correlation
between the seedlings salt tolerance and
photosynthetic efficiency
Yu-Chang Tsai, Kuan-Chuan Chen, Tung-Shan Cheng, Chuan Lee, Shih-Hung Lin and Chih-Wei Tung*

  Abstract
  Background: Photosynthetic efficiency might be a key factor determining plant resistance to abiotic stresses.
  Plants can sense when growing conditions are not favorable and trigger an internal response at an early stage before
  showing external symptoms. When a high amount of salt enters the plant cell, the membrane system and function of
  thylakoids in chloroplasts could be destroyed and affect photosynthetic performance if the salt concentration is not
  regulated to optimal values. Oryza species have salt-tolerant and salt-sensitive genotypes; however, very few studies
  have investigated the genetic architecture responsible for photosynthetic efficiency under salinity stress in cultivated
  rice.
  Results: We used an imaging-based chlorophyll fluorometer to monitor eight rice varieties that showed different salt
  tolerance levels for four consecutive days under control and salt conditions. An analysis of the changes in chlorophyll
  fluorescence parameters clearly showed the maximum quantum efficiency of PSII in sensitive varieties was significantly
  reduced after NaCl treatment when compared to tolerant varieties. A panel of 232 diverse rice accessions was then
  analyzed for chlorophyll fluorescence under salt conditions, the results showed that chlorophyll fluorescence
  parameters such as F0 and NPQ were higher in Japonica subspecies, ΦPSII of Indica varieties was higher than
  that in other subgroups, which suggested that the variation in photosynthetic efficiency was extensively
  regulated under salt treatment in diverse cultivated rice. Two significant regions on chromosome 5 were
  identified to associate with the fraction of open PSII centers (qL) and the minimum chlorophyll fluorescence
  (F0). These regions harbored genes related to senescence, chloroplast biogenesis and response to salt stress
  are of interest for future functional characterization to determine their roles in regulating photosynthesis.
  Conclusions: Rice plant is very sensitive to salinity stress, especially at young seedling stage. Our work
  identified the distribution pattern of chlorophyll fluorescence parameters in seedlings leaf and their correlations with
  salt tolerance level in a diverse gene pool. We also revealed the complexity of the genetic architecture regulating rice
  seedling photosynthetic performance under salinity stress, the germplasm analyzed in this study and the associated
  genetic information could be utilized in rice breeding program.
  Keywords: Oryza sativa, Photosynthetic efficiency, Chlorophyll fluorescence, Salt stress, Genetic variation, Subspecies,
  Genome-wide association

* Correspondence: chihweitung@ntu.edu.tw
Department of Agronomy, National Taiwan University, No. 1, Sec. 4,
Roosevelt Rd, Taipei 10617, Taiwan

                                        © The Author(s). 2019 Open Access This article is distributed under the terms of the Creative Commons Attribution 4.0
                                        International License (http://creativecommons.org/licenses/by/4.0/), which permits unrestricted use, distribution, and
                                        reproduction in any medium, provided you give appropriate credit to the original author(s) and the source, provide a link to
                                        the Creative Commons license, and indicate if changes were made. The Creative Commons Public Domain Dedication waiver
                                        (http://creativecommons.org/publicdomain/zero/1.0/) applies to the data made available in this article, unless otherwise stated.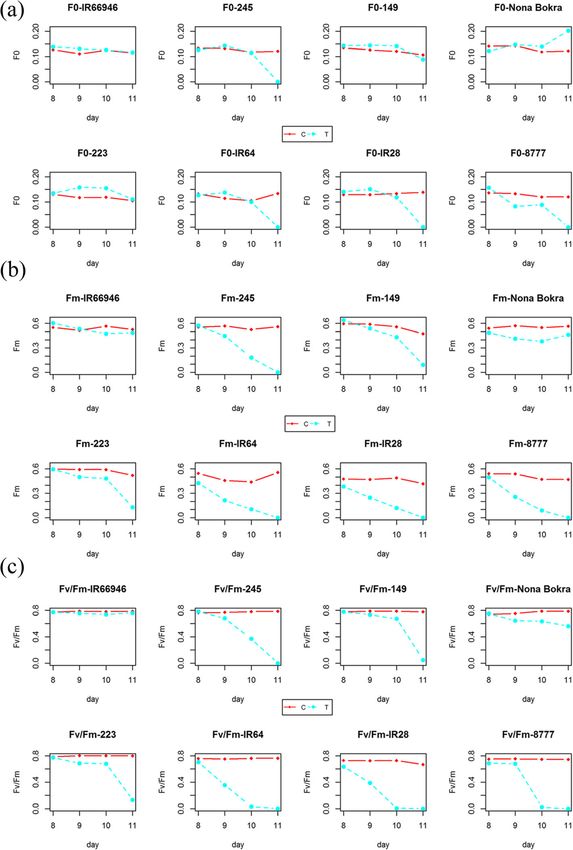
Tsai et al. BMC Plant Biology   (2019) 19:403                                                                       Page 2 of 17

Background                                                       in Table 1 of Flood et al. [8]). These results highlighted
Photosynthesis is an essential process that generate             that photosynthetic efficiency was regulated differentially
energy to support plant growth. Components participat-           in diverse genetic backgrounds.
ing in photosynthetic machinery, such as photosynthetic             Several studies have examined changes in chlorophyll
pigments, photosystems, electron transport systems, gas-         fluorescence parameters under salinity stress in rice. F0
exchange processes and enzymes involved in carbon                (minimum fluorescence yield in the absence of photosyn-
metabolism, are important for photosynthetic efficiency          thetic light) increased under the salinity stress [7, 18, 19].
and could be potentially affected by abiotic stresses [1].       Chloroplast ultrastructure, such as the thylakoid mem-
   In recent years, technology to detect chlorophyll fluor-      brane, was damaged by salt stress [20]. It is possible that
escence in leaves has advanced rapidly, and its power to         increased F0 values were due to the disassociation of light-
reflect photosynthetic efficiency in vivo needs to be            harvesting complex II (LHC II) and the PSII reaction cen-
examined. Light energy captured by chlorophyll molecules         ter on swollen thylakoids [7]; however, Fm (maximum
is used in photochemical reactions to drive photosynthesis       fluorescence yield in the absence of photosynthetic light)
or, if in excess, dissipated as heat (nonphotochemical           was decreased in plants under salinity stress compared
quenching, NPQ) or emitted as chlorophyll fluorescence           with control plants [7, 18]. Fv/Fm (maximum efficiency of
[2]. These three processes mutually compete with each            PSII) is highly consistent (approximately 0.78–0.84) in dif-
other, e.g., increasing photosynthesis will lead to a decrease   ferent species under normal growth conditions; it was
in extra energy dissipation; therefore, by measuring the         decreased in sensitive varieties under moderate salt stress
yield of chlorophyll fluorescence, the efficiency of the         or a long period of salt treatment [7, 15, 18, 19, 21, 22].
photochemical reactions and the degree of heat dissipation       ΦPSII, which is also the effective PSII quantum yield, rep-
could also be estimated.                                         resents the fraction of absorbed energy used in photo-
   When a high amount of salt was accumulated in                 chemistry, which determines the efficiency of PSII. It is
the plant cell for a period of time, the membrane                affected by the rate of electron transport or the concentra-
permeability and function of thylakoids in chloro-               tions of electron acceptors, e.g., NADP+, available at the
plasts was damaged [3]; a gradual decrease in the ac-            acceptor side of PSI. The value of ΦPSII declined under
tivity of photosystems (PSI and PSII) and chlorophyll            moderate salt stress, and the tolerant lines exhibited
fluorescence was also observed [4]. Because the re-              higher values than the sensitive lines [15]. However, an-
pair of photosystem II (PSII) was affected in salt-              other study [23] had the opposite result; ΦPSII did not
treated plants, photoinhibition was enhanced, and                change, but the electron transport rate (ETR) declined,
the photosynthetic efficiency was reduced [5]. The               and they speculated that photosynthetically active radi-
correlation between chlorophyll fluorescence and                 ation (PAR) was not uniform in the experiment. Another
chloroplast ultrastructure, such as the morphology of            study also indicated that ΦPSII decreased severely when
thylakoids, under salt stress has been examined in               Fv/Fm decreased slightly under different levels of salinity
barley and rice [4, 6, 7]. These studies showed that             stress [7]. The parameter qL is the coefficient of photo-
salt-tolerant varieties had reduced thylakoid swelling,          chemical quenching based on a lake model in which the
relatively high PSII electron transport activity, slowly         PSII reaction centers are connected by shared antenna
decreasing maximum chlorophyll fluorescence yield                [24]. qL reflects the fraction of open PSII reaction centers,
and delayed senescence.                                          which is highly correlated with ΦPSII and declines under
   Compared to its physiological and biochemical regula-         salt stress in sensitive varieties [21]. NPQ reflects the level
tion, the genetic nature of photosynthetic efficiency has        of excess energy dissipation as heat. A previous study
been less explored [8, 9]. The activity of plant photosyn-       showed that the NPQ value increased in tolerant varieties
thesis could be expressed and quantified in many forms,          and decreased in sensitive varieties under salt stress [21],
such as rate of CO2 fixation (gas-exchange) per unit leaf        but in another study, NPQ in both tolerant and sensitive
area, production of carbohydrates or dry mass per plant,         lines was increased substantially under salt stress [23]. It is
and chlorophyll fluorescence. To investigate the genetic         still not clear how NPQ is related to plant salt tolerance
characteristics of plant photosynthetic efficiency, re-          levels.
searchers analyzed the properties of diverse genotypes:             An image-based phenotyping platform has been ap-
the response of photosynthetic light use efficiency              plied to increase the accuracy and throughput of the
(ΦPSII) to different light conditions in Arabidopsis [10],       trait evaluation process in studying the effect of abiotic
chlorophyll fluorescence kinetics under heat stress in           stress in various crops [25, 26]. A recent study combined
wheat [11], leaf chlorophyll content in rice [12–14],            digital imaging and an automated robotic system (the
photosynthetic responses of rice seedlings to salinity           Plant Accelerator) to measure the relative growth rate
stress [15], cold responses of photosynthesis in Arabi-          (RGR), transpiration rate (TR) and transpiration use effi-
dopsis and maize [16, 17] and other traits (summarized           ciency (TUE) in diverse rice accessions and identified
Tsai et al. BMC Plant Biology          (2019) 19:403                                                                                                       Page 3 of 17

Table 1 The eight accessions used in the pilot experiment
ID                         Name                         Country of origin                Subspecies                 Injury scoreb               Salinity tolerance levelc
8777                       Munao PS405                  Philippines                      Indica                     7.86                        S
IR28                       IR28                         Philippines                      Indica                     5.2                         M to S
IR64                       IR64                         Philippines                      Indica                     5.12                        M to S
223                        Priano Guaira                Brazil                           Japonica                   5                           M
Nona Bokra                 Nona Bokra                   India                            Indica                     2.1                         M to T
149                        Sinaguing                    Philippines                      Japonica                   2                           M to T
245a                       Sab Ini                      Egypt                            Japonica                   1.57                        M to T
IR66946                    FL478                        Philippines                      Indica                     1                           T
a
 Variety 245 was excluded from discussion due to its erratic behavior; it is likely that the tested samples were contaminated
b
  The injury score was the average of three replicates
c
 Salinity tolerance level was assigned to five classes based on the injury score. M Moderate (Injury score = 5), S Sensitive (Injury score > = 7), T Tolerant
(Injury score = 1)

several new genetic loci controlling the early responses                               to day 9 and was fully expanded on day 8 under both
to salinity through association studies [27]. In this work,                            control and salt conditions. To assess the changes in the
we aimed to understand how natural genetic variation                                   fluorescence parameters under the control and salt treat-
correlates with plant photosynthetic efficiency under sal-                             ments at the young seedling stage, the second leaves of
inity stress using a chlorophyll fluorometer. The leaf                                 eight varieties were evaluated before starting 150 mM
chlorophyll fluorescence of eight rice varieties that ex-                              NaCl treatment (day 8) and 24, 48, and 72 h after 150
hibited different levels of salt tolerance were monitored                              mM NaCl treatment (day 9, 10, 11) using a pulse-ampli-
for four consecutive days under control and salinity con-                              tude modulation (PAM) fluorometer (Fig. 1). The sec-
ditions. The results were examined to determine how in-                                ond leaf of the control group from the same eight
ternal chlorophyll fluorescence parameters correspond                                  varieties was evaluated at the same time point.
to the symptoms of salt toxicity in older seedlings. Based                               As shown in Fig. 2 and S1, the changes in six chloro-
on these findings, we further investigated a diverse panel                             phyll fluorescence parameters were relatively stable in
of 232 rice cultivars for their seedling leaf chlorophyll                              the control group (red line) compared to the salt treat-
fluorescence performance under salt conditions. The                                    ment group (blue line) from day 8 to day 11. A varietal
genetic architecture controlling photosynthetic efficiency                             difference was observed in the parameters of the control
was analyzed based on the association of selected                                      group such as ΦPSII, qL and NPQ, which strongly sug-
chlorophyll fluorescence parameters and SNP variations.                                gested that the photosynthetic potential varies in nature
                                                                                       by genotype and could be regulated genetically. The F0,
Results                                                                                Fm and Fv/Fm values of all varieties were stable under
Evaluating the performance of leaf fluorescence                                        control conditions over the observation period (red line
parameters in time series under control and salinity                                   in Fig. 2) but declined at different rates in the tested ac-
conditions using eight rice varieties that show different                              cessions except the extremely tolerant variety IR66946
salt tolerance levels                                                                  under salt treatment (blue line in Fig. 2). For the param-
In the pilot experiment, we aimed to identify the optimal                              eters associated with energy partitioning, such as ΦPSII,
seedling stage and target leaf tissue displaying a wide                                qL and NPQ, the pattern of chlorophyll fluorescence
range of chlorophyll fluorescence variation under salt                                 was difficult to interpret when control and salt treatment
stress. We selected eight rice varieties based on their salt                           profiles were compared side by side across varieties
tolerance level and classified them as tolerant, moderate                              (Additional file 7: Figure S1). It is likely that the capacity
and sensitive (Table 1).                                                               of the photosystem was already compromised in both
  To synchronize seed germination, we soaked sterilized                                the control and salt treatment groups, which com-
seeds in water at 37 °C for 2 days until the embryonic                                 pounded with the natural variation in photosynthetic
plumule protruded. After growing in the hydroponic sys-                                efficiency that already existed between genotypes. To
tem for 3 days, rice seedlings were treated with salt levels                           accurately evaluate the salt tolerance level through
that increased daily (50, 100, 150 mM of NaCl) over sub-                               chlorophyll fluorescence across genotypes, the ratio of
sequent days (days 6, 7, 8) and then maintained at 150                                 treatment to control (T/C) values for each parameter
mM for 3 days for a visual evaluation of salt tolerance                                was then calculated and used to infer the regulation of
(injury score, IS) on day 11. As shown in Fig. 1, the sec-                             photosynthetic efficiency (Fig. 3; Additional file 2: Table
ond leaf was the major photosynthetic organ from day 6                                 S2). Y(II) significantly declined in the second leaves of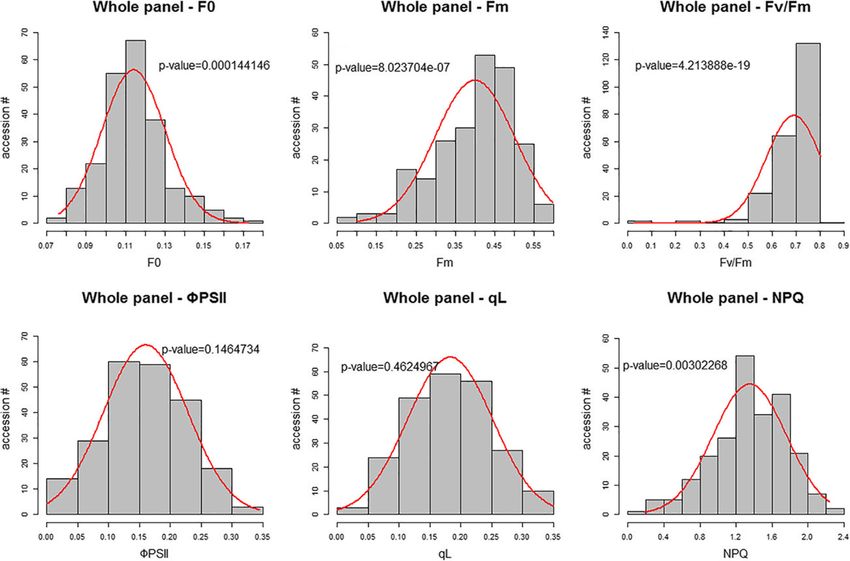
Tsai et al. BMC Plant Biology (2019) 19:403 Page 4 of 17
Fig. 1 Experimental workflow of the rice salinity regime and phenotyping at the seedling stage. Rice seeds were sterilized and germinated at
37 °C for two days. Germinated seeds were transferred to the hydroponic system on day 3. Salinity treatment was started from 50 mM NaCl on
day 6 and progressively increased to 150 mM on day 8, which allowed the seedling to acclimate to salt stress. The fully developed second leaf
was selected for chlorophyll fluorescence measurement from day 8 to day 11. Salt tolerance level was evaluated and assigned an injury score on
day 11
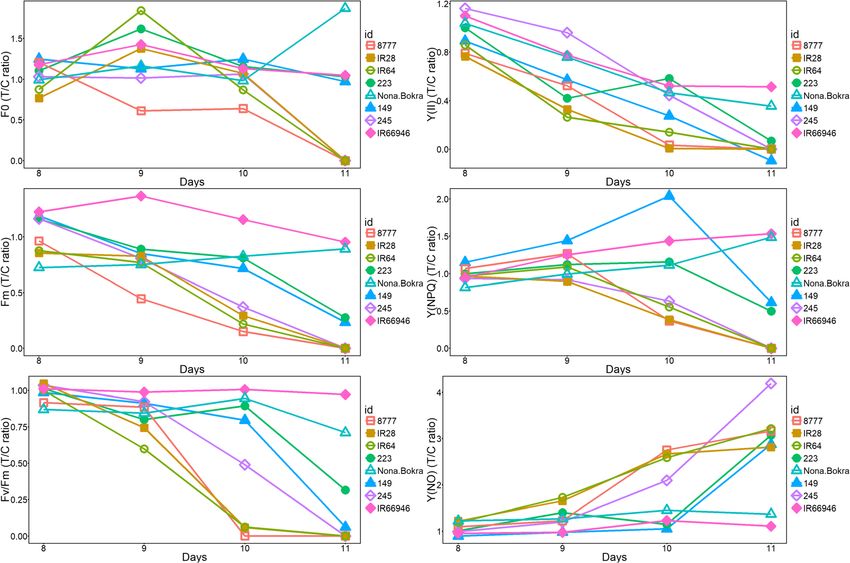
all seedlings treated with 150 mM NaCl compared to the 11, and the extremely tolerant varieties still looked
control seedlings from days 8 to 11. Both the quantum healthy. We suspected that the photosynthetic machin-
yield of regulated [Y(NPQ)] and nonregulated [Y(NO)] ery had already been affected since the first day of salt
energy dissipation were elevated from day 8 to day 9 in treatment (50 mM on day 6, Fig. 1); however, the pheno-
the sensitive varieties (Fig. 3). The Y(NPQ) increased typic effect was not shown until the leaf tissue started sen-
from days 8 to 11 in the tolerant varieties IR66946 and escing and dying from day 9 to day 11, which depended on
Nona Bokra but decreased from day 9 to 11 in the sensi- the tolerance level of the variety. We closely examined the
tive varieties. The NPQ was regulated in response to salt changes in the six chlorophyll fluorescence parameters
stress in moderate varieties 149 and 223 and in tolerant across eight varieties from day 8 to day 11. The pattern of
varieties Nona Bokra and IR66946 at day 10. The actual each parameter varied greatly among eight varieties in our
quantum yield of nonregulated NPQ, Y(NO), remained time-series observation, suggesting that chlorophyll fluores-
low in the moderate and tolerant varieties (IR66946, cence is a sensitive and complex phenomenon that reflects
Nona Bokra, 149 and 223) compared to the sensitive the seedling’s salt tolerance level. Fv/Fm and ΦPSII values of
variety 8777 under salt treatment at day 10. salt-treated moderate and sensitive varieties were close to 0
on day 10 (Fig. 2c and Additional file 7: Figure S1), which
The time point displaying the maximum difference in cannot be treated as a quantitative phenotype in a genome-
photosynthetic efficiency in seedling leaves of diverse wide association study (GWAS). We then decided to meas-
varieties under salt stress ure six chlorophyll fluorescence parameters on day 9 in 223
The second leaves displayed no significant visual differ- diverse rice accessions under salt stress and used these
ence between the control and salt-treated groups before measurements as quantitative traits for follow-up associ-
the salt concentration increased to 150 mM NaCl on day ation analysis (Additional file 3: Table S3).
8. Twenty-four hours after 150 mM NaCl incubation
began (day 9), the seedlings of the sensitive varieties Distribution of chlorophyll fluorescence parameters under
8777 and IR28 started to show weak senescence symp- salinity stress in 232 diverse rice varieties
toms in the second leaf. Forty-eight hours after 150 mM After 150 mM salt treatment for 2 days, Fv/Fm was be-
NaCl incubation began (day 10), the moderate and sensi- tween 0.7 and 0.8 in the majority of the accessions, as
tive varieties started withering; moderate to tolerant var- we expected; F0, Fm, ΦPSII, qL and NPQ values showed
ieties started showing mild senescence symptoms on day a normal distribution in 232 diverse accessions (Fig. 4).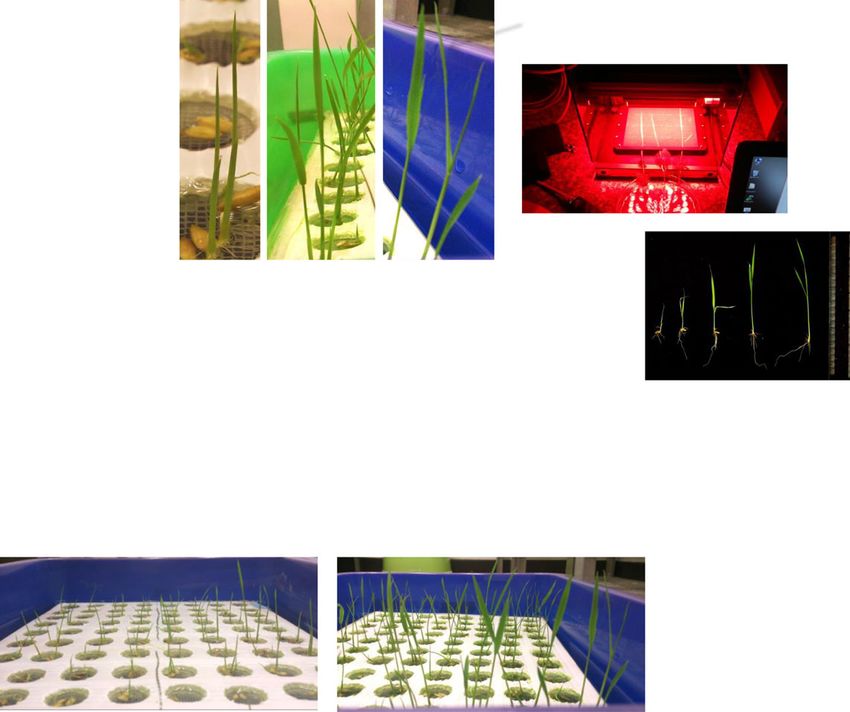
Tsai et al. BMC Plant Biology     (2019) 19:403                                                                                           Page 5 of 17

 Fig. 2 Daily changes in chlorophyll fluorescence parameters in eight rice varieties under control and salt conditions. The data in (a), (b), and (c)
 represent F0, Fm and Fv/Fm, respectively. Each data point represents the average value of 3 replicates. Red line represents control sample; blue line
 represents salt treated sample

We then investigated the variation in the parameters in five                 (Additional file 8: Figure S2a and f). ΦPSII of the Indica
subgroups and two subspecies and found that Japonica                         subgroup is slightly higher than that in the other four sub-
subspecies have significantly higher F0 and NPQ values                       groups (Additional file 8: Figure S2d), and for Fm, Fv/Fm
than Indica subspecies (P-value < 0.0001 by Student’s t-test,                and qL, we did not detect a significant difference between
Additional file 8: Figure S2); within Japonica subspecies,                   the two subspecies (Additional file 8: Figure S2b, c and e).
tropical japonica varieties have higher F0 values than other                 The value of chlorophyll fluorescence parameters were
varieties, and aromatic varieties have higher NPQ values                     widely distributed in each subgroup, which could reflect
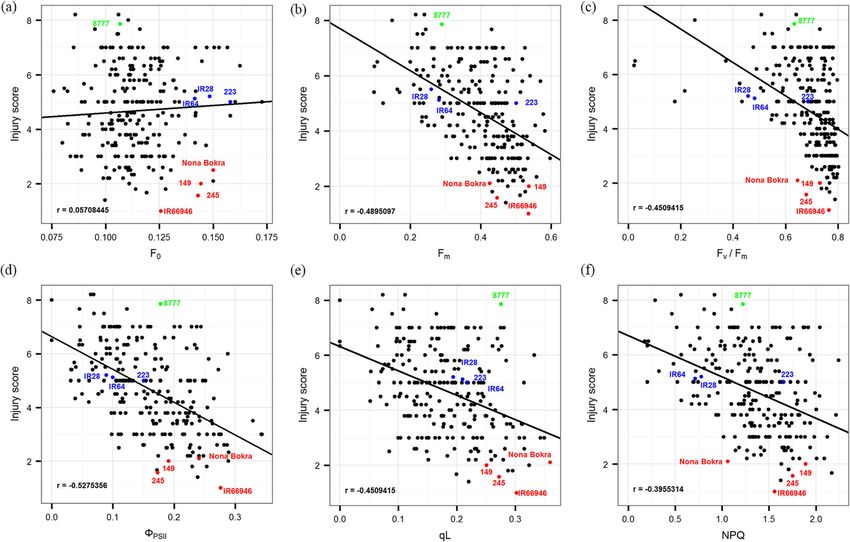
Tsai et al. BMC Plant Biology     (2019) 19:403                                                                                              Page 6 of 17

 Fig. 3 Regulation of the chlorophyll fluorescence index in eight rice varieties under salinity stress. The T/C ratio of chlorophyll fluorescence (F0,
 Fm, and Fv/Fm) and quantum yield (Y(II), Y(NPQ), and Y(NO)) parameters were determined in control (C) and treatment (T) groups from day 8 to
 day 10. Each variety is indicated by a different colored line and symbol. 149: Blue/ filled triangle, 223: green/ filled circle, 245: violet/ open
 diamond, 8777: orange/ open square, IR28: brown/ filled square, IR64: light green/ open circle, IR66946: pink/ close diamond, Nona Bokra: jade/
 open triangle

the extensive genetic variation in photosynthetic efficiency                   rice accessions with related genetic backgrounds do
in rice.                                                                       not necessarily share similar chlorophyll fluorescence
  To evaluate how the chlorophyll fluorescence of these                        patterns, which was reflected by their diverse re-
232 rice accessions recorded on day 9 was related to                           sponses to salt toxicity, strongly supporting the com-
their visual salt toxicity symptoms (i.e., injury score) ob-                   plexity of salt response mechanisms.
served on day 11, we plotted these variables in pairs and
calculated their correlations (Fig. 5 and Additional file 4:                   GWAS of chlorophyll fluorescence parameters under salt
Table S4). The five fluorescence parameters other than                         stress
F0 were moderately correlated with injury score. Consid-                       To identify the chromosomal regions that are potentially
ering that chlorophyll fluorescence parameters dif-                            involved in the photosynthetic efficiency response to salt
fered among subpopulations, we investigated whether                            stress, we conducted GWAS using five fluorescence pa-
these parameters and the salt tolerance level were                             rameters in three panels – a whole panel (232 acces-
correlated by genetic relatedness in each subpopula-                           sions, Fig. 2), a Japonica-specific panel (165 accessions,
tion (temperate japonica in Fig. 6 and other five sub-                         Additional file 10: Figure S4) and an Indica-specific
populations in Additional file 9: Figure S3). Colors in                        panel (66 accessions, Additional file 11: Figure S5). Fv/
the heatmap near red indicated that the value of each                          Fm was excluded because of its narrow variation and
chlorophyll fluorescence parameter was higher than the                         skewed distribution (Fig. 2). For the whole panel, the P
average value of all accessions. For the injury score, red                     model, K model and P + K model were applied to reduce
represented a lower injury score, which suggested that                         false-positive signals compared to the naïve model re-
the variety was more tolerant to salinity toxicity than                        sults; for Japonica-specific panels, only the K model was
the other varieties. These results clearly showed that                         applied. According to the quantile-quantile (QQ) plot, the
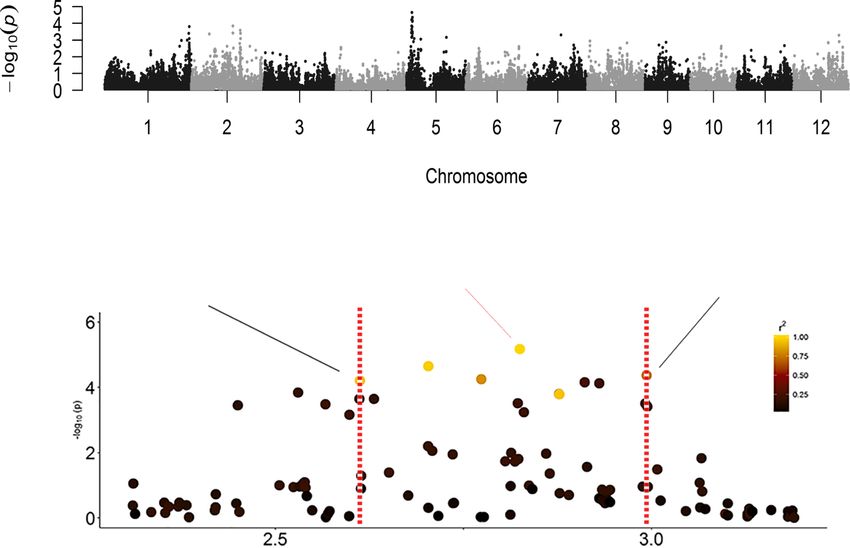
Tsai et al. BMC Plant Biology    (2019) 19:403                                                                                        Page 7 of 17

 Fig. 4 Distribution of six chlorophyll fluorescence parameters in 232 diverse varieties. Each histogram showed the distribution of chlorophyll
 fluorescence parameter in 232 rice accessions. The normality of each parameter was examined using the Shapiro-Wilks test. The P-value of each
 test is provided

significant SNPs were selected by a P-value < 10− 4 in the P               chloroplast ultrastructure of Ygl8 showed that the lamellae
model and a P-value < 10− 3 in the K and P + K models, and                 were intricately stacked and swollen [32]. Another signifi-
the singleton SNP was not considered in further analysis.                  cant peak, located on chromosome 6 from 2.9 to 3.05 Mb,
Manhattan plots and QQ plots of the SNPs associated with                   was observed for four traits (Fm, ΦPSII, qL, NPQ) (Table 2).
each chlorophyll fluorescence parameter in the whole panel                 Fm and NPQ are related to the dissipation of excess energy
and two subspecies-specific panels are provided in supple-                 as heat, and significant SNP peaks were detected in three
mentary files (Additional file 12: Figure S6). To identify                 chromosome regions (Table 2). Here, we used F0 and qL as
candidate genes in significant genomic regions, we calcu-                  examples to describe the gene mining process in detail. The
lated the linkage disequilibrium (LD) between the most sig-                most significant SNP peak associated with F0 in the whole
nificant SNP and its neighboring SNPs. The chromosomal                     panel and Japonica-specific panel was on chromosome 5
region in high LD with a significant SNP could potentially                 (Fig. 7a). We investigated the LD structure flanking the most
harbor the causal gene affecting the photosynthetic effi-                  significant SNP at 2,825,199 bp, and the region between 2,
ciency under salt stress. Several photosynthesis-associated                612,417 and 2,993,493 bp was identified based on the decay
loci under salt stress were identified in this study (Table 2).            of the LD (Fig. 7b). According to the Plant Genes 60 data-
Significant peaks on chromosome 1 (41.7–42.5 Mb) were                      base in Gramene Mart (www.gramene.org), 61 genes were
detected for five different parameters (F0, Fm, ΦPSII, qL,                 annotated in this area (Additional file 5: Table S5). OsNHX3
NPQ). This region overlapped with one quantitative                         (LOC_Os05g05590 or Os05g0148600, located at chr5: 2,777,
trait locus (QTL), and this QTL was related to seed-                       359 - 2,783,546 bp) encoded the NHX-type Na+/H+ antipor-
ling height under salt stress [28]. The Ygl8 gene en-                      ter and was near the most significant SNP (Fig. 7b). A previ-
coding a UMP kinase (LOC_Os01g73450) was found                             ous study showed that the expression of OsNHX3 was
near this significant SNP cluster. UMP kinase may                          upregulated by salt treatment [35]. Another gene (LOC_
control the UMP/UMP/UTP level in chloroplasts. Chloro-                     Os05g05600 or Os05g0148700) next to OsNHX3 was called
phyll biogenesis was affected in a mutant of Ygl8, and the                 the “senescence-associated protein OSA15” and is located in
Tsai et al. BMC Plant Biology     (2019) 19:403                                                                                            Page 8 of 17

 Fig. 5 Pattern of correlation between injury score and each chlorophyll parameter. a to f showed distribution of injury score and F0, Fm, Fv/Fm,
 ΦPSII, qL and NPQ, respectively. Pearson correlation coefficient (r) represents the level of correlation between two traits. The variety labeled in
 color corresponds to the salt tolerance level described in Table 1

the chloroplast, but how it regulates leaf senescence in rice                 Discussion
needs to be examined. Two other genes (LOC_Os05g05830                         To explore the potential genetic resources for salinity-
or Os05g0150800 and LOC_Os05g05950 or Os05g0151400)                           tolerant breeding in rice, chlorophyll fluorescence pa-
were also predicted to target chloroplasts, but their roles in                rameters could serve as reliable selection indicators, the
photosynthetic efficiency need to be confirmed. For qL, a                     pixelated chlorophyll fluorescence data can be used to
total of seven significant SNP peaks (P-value < 10− 3 based                   evaluate the level of stress tolerance days before the in-
on the P + K model) located among chromosomes 1, 2, 5, 6                      jury symptom were expressed externally. The chloro-
and 12 were detected in the whole panel (Additional file 13:                  phyll fluorescence parameters F0 and Fm were directly
Figure S7a). The LD around the most significant SNP                           determined from the leaves, however, the alteration in
(at 26,473,167 bp) on chromosome 5 was analyzed                               F0 can be attributed to PSI fluorescence, which can be
(Additional file 13: Figure S7b). Based on the decay of                       positively or negatively affected under stress [39]. In our
the LD, the region harboring candidate genes was between                      study, F0 had the lowest correlation with the injury score
26,164,849 and 26,862,431 bp, and 113 genes were anno-                        in both the pilot experiment and the 232 varieties ex-
tated in this region (Additional file 6: Table S6). Four QTLs                 periment. Among the chlorophyll fluorescence parame-
related to root length and root dry weight under salt stress                  ters, Fm had a higher correlation with the injury score in
[30] and salt tolerance level [33] resided in this region                     our pilot experiment than the others. However, ΦPSII
(Table 2). The gene OsCBL4 (OsSOS3, LOC_Os05g45810                            had the highest correlation of the parameters with the
or Os05g0534400) encoded an EF-hand-type calcineurin B-                       injury score in 232 diverse varieties. Considering that
like protein in this region (Additional file 13: Figure S7b).                 the whole panel includes Indica- and Japonica-specific
OsCBL4 has the same function as AtSOS3 in Arabi-                              panels, the correlation of injury score and the six
dopsis and is involved in the regulatory pathway                              chlorophyll fluorescence parameters was better in
controlling intracellular Na+ and K+ homeostasis and                          each subgroup than in the whole. In the Indica-spe-
salt tolerance [36].                                                          cific panel, the correlation of the injury score with Fm
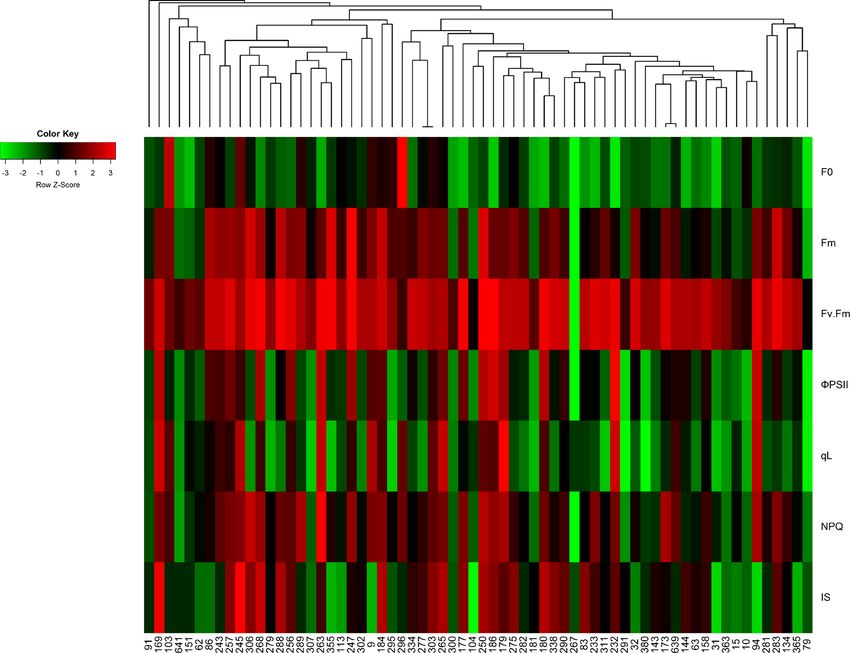
Tsai et al. BMC Plant Biology     (2019) 19:403                                                                                           Page 9 of 17

 Fig. 6 Genetic relationships and phenotypic distributions of varieties in temperate japonica populations. Each column represents a single variety,
 and the sample ID is labeled at the bottom of the heatmap. Each row represents the chlorophyll fluorescence parameter and injury score of each
 variety. The colors closest to red indicate that the value of each chlorophyll fluorescence parameter is higher than its average value of all
 accessions; for injury score, the red colors represent the lower injury scores, which suggest that the variety is more tolerant to salt toxicity. The
 color key of the Z-score was calculated from the distance between the raw score and the population mean in units of the standard deviation

was improved from − 0.490 to − 0.617, which was also                         increased for all varieties except the most sensitive var-
similar to the value in the pilot experiment that in-                        iety “8777” from day 8 to day 9 under salt stress and
cluded five Indica rice varieties. In addition, the cor-                     then gradually declined until the end of the 150 mM salt
relations of NPQ and ΦPSII to the injury score were                          treatment in most varieties (not the two extremely toler-
also improved in the subgroups. The correlation of                           ant varieties Nona Bokra and IR66946). It is possible
injury score with ΦPSII was slightly better when in                          that the changes of F0 and Fm were due to the damages
the Japonica varieties alone. The pattern of chloro-                         of the chloroplast, which could be seen in the ultrastruc-
phyll fluorescence parameters and how they correlated                        ture of the membrane system [7, 18, 20]. In addition, the
with injury score may indicate the different strategies                      malfunction of proteins involves in photosystem II or I
operating in Indica and Japonica rice for survival of                        could also relate to the reduction of Fm [7]. Unlike the
salinity stress.                                                             tolerant rice varieties, which have stable Fv/Fm and Fm
  The decrease in Fm was shown to be an indicator of a                       values, sensitive varieties exhibited significantly de-
PSII reaction center made inactive by the stress [40]. In                    creased F0 and Fm values after day 9, which may indicate
addition, the increase in F0 can also be a negative trait                    severe damage to the antenna structure or inactivation
associated with stress, which could result in the separ-                     of the PSII reaction center. We suspected that the
ation of LHCII and PSII or the inactivation of the PSII                      chloroplast ultrastructure of extremely sensitive variety
reaction center [41, 42]. In our pilot experiment, F0                        8777 was already severely damaged, since the seedling
Tsai et al. BMC Plant Biology     (2019) 19:403                                                                                  Page 10 of 17

Table 2 The significant SNPs detected in a GWAS for five chlorophyll parameters and associated QTLs and genes
Trait   SNP ID      Chr. Position      Statistical   P-value Known QTL                                        Known gene
                         (IRGSP-1.0)   model
NPQ id1003509       1    4,209,827     All - P       4.17E-   QKr1.1 [28]; qRNC-1, qRRNC4, qRKC1, qRRKC1,
                                                     07       qRNa/K1–1, qRRNa/K1–1 [29]
F0      id1004960   1    6,508,269     IND - K       2.17E-   qRL-1, qNAUP-1b [30]
                                                     04
qL      id1016791   1    28,594,265    All - P + K   7.95E-   qNAUP-1a, qFWSH-1 [30]; QKr1.2, Qnar/Kr1 [28]
                                                     05
        id1016825   1    28,599,615    All - K       8.10E-
                                                     04
NPQ id1024223       1    38,162,791    All - P       4.95E-
                                                     05
ΦPSII id1026852     1    41,787,616    All - P       3.99E-   qSH1–3 [31]                                     Ygl8 (LOC_Os01g73450, Zhu et
                                                     05                                                       al. [32])
        id1027309   1    42,134,803    All - K       2.20E-
                                                     04
NPQ id1026852       1    41,787,616    All - P       4.67E-   qSH1–3 [31]
                                                     06
F0      id1027269   1    42,082,183    All - K       1.01E-   qSH1–3 [31]
                                                     04
                                       JPN - K       7.39E-
                                                     04
        id1027563   1    42,339,408    All - P       7.63E-   qSH1–3 [31]
                                                     06
                                       All - P + K   1.53E-
                                                     04
qL      id1027309   1    42,134,803    All - P       4.26E-   qSH1–3 [31]
                                                     05
                                       All - K       5.44E-
                                                     04
Fm      id1027821   1    42,581,986    All - P       1.55E-   qSH1–3 [31]
                                                     05
ΦPSII id2001842     2    3,253,759     All - P       7.78E-
                                                     05
                                       All - K       3.05E-
                                                     04
                                       All - P + K   2.35E-
                                                     04
qL      id2001842   2    3,253,759     All - K       7.90E-   qSST2 [33]
                                                     04
NPQ id2006687       2    16,648,368    All - P       4.10E-   qPL-2 [30]; QSsst2b, QDss2b [34]
                                                     05
NPQ id2007192       2    17,927,911    All - P       5.81E-   qPL-2 [30]; QSsst2b, QDss2b [34]
                                                     05
F0      id2008158   2    20,817,846    All - P       7.91E-   QDss2a, QSkc2, QKna2 [34]
                                                     05
                                       All - K       2.06E-
                                                     04
                                       All - P + K   1.41E-
                                                     04
NPQ id2008679       2    21,812,170    All - P       5.36E-   QDss2a, QSkc2, QKna2 [34]
                                                     05
F0      id2010410   2    24,565,561    All - P + K   2.62E-   QDss2a, QSkc2, QKna2 [34]; qRRNa/K1–2 [29]
                                                     04
        id2010572   2    24,696,197    All - P       1.25E-
Tsai et al. BMC Plant Biology (2019) 19:403 Page 11 of 17
Table 2 The significant SNPs detected in a GWAS for five chlorophyll parameters and associated QTLs and genes (Continued)
Trait SNP ID Chr. Position Statistical P-value Known QTL Known gene
(IRGSP-1.0) model
05
id2010581 2 24,713,963 All - K 5.03E-
04
NPQ id2010932 2 25,236,351 All - P 5.50E- QDss2a, QSkc2, QKna2 [34]; qRRNa/K1–2 [29]
05
Fm id4000429 4 686,361 All - P 1.90E-
05
All - K 7.32E-
04
qL id4002349 4 5,526,924 IND - K 3.61E- qRL4 [30]
04
Fm id4002319 4 5,487,935 IND - K 5.13E-
04
F0 id5001540 5 2,773,921 All - P 1.70E- QKs5 [28] OsNHX3 (LOC_Os05g05610,
06 Fukuda et al. [35])
id5001584 5 2,825,199 All - K 9.66E-
05
All - P + K 6.82E-
06
JPN - K 3.06E-
04
Fm id5001738 5 3,064,389 IND - K 2.25E- QSst5, QDss5a, QDss5b [34]
05
NPQ IND - K 7.46E-
04
qL id5012588 5 26,473,167 All - P 3.40E- qRL-5, qDWRO-5a, qDWRO-5b [30]; qSST5 [33] OsCBL4 (LOC_Os05g45810,
06 Martinez-Atienza et al. [36])
All - K 5.61E-
04
All - P + K 4.95E-
04
ΦPSII id6002261 6 2,930,916 All - P 8.97E-
07
All - P + K 4.12E-
05
id6002494 6 3,113,730 All - K 6.48E-
05
IND - K 8.00E-
04
Fm id6002261 6 2,930,916 All - P 2.77E-
05
All - K 5.39E-
04
All - P + K 4.79E-
04
qL id6002261 6 2,930,916 All - P 3.90E-
05
All - P + K 5.85E-
04
id6002286 6 2,974,286 All - K 3.95E-
04
NPQ id6002389 6 3,042,568 All - P 2.10E-
06Tsai et al. BMC Plant Biology (2019) 19:403 Page 12 of 17
Table 2 The significant SNPs detected in a GWAS for five chlorophyll parameters and associated QTLs and genes (Continued)
Trait SNP ID Chr. Position Statistical P-value Known QTL Known gene
(IRGSP-1.0) model
All - P + K 4.59E-
04
NPQ id6005326 6 8,187,911 All - P 1.31E- qDRW6 [31]
08
All - K 3.98E-
04
All - P + K 2.35E-
04
NPQ id6006336 6 10,184,310 All - P 3.32E- qDRW6 [31]
05
All - K 1.70E-
04
All - P + K 1.83E-
04
JPN - K 2.29E-
04
NPQ id7000336 7 1,865,306 All - P 3.43E-
05
F0 id7003938 7 22,819,640 All - P 2.00E- QSkc7; [34] qSST7 [33]
05
qL id10000081 10 407,964 JPN - K 6.21E-
04
ΦPSII id10003594 10 13,662,830 All - K 5.63E-
04
All - P + K 4.98E-
04
JPN - K 3.21E-
04
Fm id10003623 10 13,782,039 All - P 3.03E-
05
Fm id10006610 10 20,943,116 All - P 1.43E-
06
NPQ id11008520 11 22,516,795 All - P 6.39E- qSNC11 [37]
06
Fm id11008950 11 23,178,265 All - P 4.04E- qSNC11 [37]
06
Fm id12001261 12 3,059,845 All - K 4.65E-
05
All - P 1.30E-
06
JPN - K 5.35E-
05
id12001332 12 3,223,671 All - P + K 6.34E-
05
NPQ id12001256 12 3,027,442 All - P 1.23E-
05
qL id12001769 12 4,044,980 All - P + K 6.57E- qRRNC12 [29]
04
ΦPSII id12004053 12 10,470,139 All - P 5.14E- qRRNC12 [29]; qSUR12, qSES12, qCNL12 [38]
06
All - K 3.54E-
04
ΦPSII id12007270 12 21,906,089 All - P 1.48E- QSst12, QDss12 [34]; qSUR12, qSES12, qCNL12Tsai et al. BMC Plant Biology (2019) 19:403 Page 13 of 17
Table 2 The significant SNPs detected in a GWAS for five chlorophyll parameters and associated QTLs and genes (Continued)
Trait SNP ID Chr. Position Statistical P-value Known QTL Known gene
(IRGSP-1.0) model
04 [38]
ΦPSII id12008292 12 23,734,278 All - P 2.45E- qSH12.1, qSH12.2, qDSW12.1 [31]; qSUR12,
05 qSES12, qCNL12 [38]
All - K 4.67E-
04
qL id12008234 12 23,663,599 All - P 5.21E- qSH12.1, qSH12.2, qDSW12.1 [31]; qSUR12,
05 qSES12, qCNL12 [38]
All - K 8.73E-
04
ΦPSII id12010084 12 27,378,310 All - P 1.65E- qSUR12, qSES12, qCNL12 [38]
05
All - K 1.76E-
04
was already grown in 50–100 mM saline solution for 2 our study, the dynamics of Y(II), Y(NPQ) and Y(NO) from
days (from day 6 to day 7). We anticipate that the mem- day 9 to day 11 in the tolerant lines (IR66946, Nona Bokra)
brane system of variety 8777 was relatively fragile com- and sensitive lines (8777, IR28) strongly suggest that enhan-
pared to that of other sensitive varieties tested in our cing PSII efficiency could improve the salt tolerance; there-
study, which was also reflected by the low Fv/Fm ratio of fore, the quantum yield of energy dissipation in PSII
variety 8777. (including Y(NPQ) and Y(NO) components) may provide a
PSII efficiency can be determined by chlorophyll fluores- hint of the different salinity tolerance levels among diverse
cence indexes, which include Y(II), Y(NPQ), and Y(NO). rice varieties. The increase in Y(NPQ) depends on the for-
These indexes represent the total energy distribution in the mation of a transthylakoid pH gradient, and proton pump-
photosynthetic reaction center in PSII. Reduction in Y(II) ing appears to be inefficient in the sensitive lines [44]. Low
levels and increased Y(NPQ) and Y(NO) levels have been Y(NPQ) values may also represent low xanthophyll cycle
shown to be responses to salt stress in cucumber [43]. In activity [45, 46], while Y(NPQ) is an indicator of ΔpH-
Fig. 7 GWAS of F0 in 232 diverse varieties and LD pattern of the most significant SNP. a Manhattan plot showing the significance of each SNP
tested by a mixed linear model. b The most significant SNP is at 2,825,199 bp. The dot color of each SNP represents its LD with the most
significant SNP, and the decay of the LD is bordered by two vertical dashed lines. The location of the OsNHX3 gene is marked with a blue barTsai et al. BMC Plant Biology (2019) 19:403 Page 14 of 17
dependent dissipation of excess light energy in the PSII an- to answer these two questions by phenotyping a diverse
tennae that causes photoinhibition or the xanthophyll cycle panel of rice seedling chlorophyll fluorescence under salt
[47–49]. Y(NO) corresponds to nonregulated dissipation of stress. Our results revealed the quantitative trends in
excess energy and may be used as a stress indicator [50]. photosynthetic efficiency, and a significant genetic het-
Combining responses to salinity and submergence stresses, erogeneity in photosynthetic efficiency that implied that
ETR, qN, qP and Y(NO) can be used as indicators to distin- photosynthetic efficiency is highly genetic background-
guish the stress tolerances of different rice genotypes [51]. dependent was detected. Considering that the popula-
Associating photosynthetic efficiency with the level tion size is relatively small in our study, we recommend
of salinity tolerance is challenging, especially when that future association studies should increase the num-
photosynthetic performance and plant growth rate ber of varieties to enrich favorable alleles; alternatively,
vary among diverse genotypes regardless of salt treat- using a biparental mapping population created by cross-
ment. We know that the accumulation of excess salt in ing tolerant and susceptible varieties that show contrast-
the plant cell triggered internal physiological changes be- ing chlorophyll fluorescence imaging patterns would
fore external symptoms appeared [52]. In our study, vis- allow us to dissect and identify the genetic components
ible senescence was not detected in the salt-treated and genes that control photosynthetic efficiency.
varieties during day 6 to day 9, and the fluorescence pa-
rameters of the second leaf on day 9 were partially corre- Methods
lated with the injury score assessed on day 11 in 232 Plant material and growth conditions
diverse varieties. Therefore, we hypothesized that these Eight rice accessions, including four salt-tolerant, three
results could be due to the existence of multiple salt toler- moderate and one salt-sensitive accessions, were evalu-
ance mechanisms in the diverse germplasms. Three major ated in the pilot experiment (Table 1). For the GWAS
salt tolerance mechanisms were proposed: tissue toler- experiment, 232 accessions from 71 countries were used
ance, osmotic tolerance and ion exclusion [53]. Consider- for the study (Additional file 3: Table S3). This global
ing that all accessions received the same amount of panel included 5 subpopulations: 59 tropical japonica,
salt treatment from day 6, the varieties with better 65 temperate japonica, 38 indica, 21 aus, 9 aromatic and
tissue tolerance would mobilize the sodium to vacuole 42 admixed accessions. Rice accessions were obtained
more efficiently and leave the chloroplast with only from the USDA-ARS, Dale Bumpers National Rice Re-
minor damage to conduct photosynthesis. If the var- search Center, Stuttgart, Arkansas, Genetic Stocks Oryza
ieties mainly generate salt tolerance through ion Collection (www.ars.usda.gov/GSOR). Each accession
exclusion from roots, the chlorophyll fluorescence de- was genotyped on a 44,000 SNP array as described in
tected in the leaf may mostly reflect the natural aging Zhao et al. [55]. After removing the SNPs with missing
(senescence) process in plants and not the net toxic rates larger than 10% and minor allele frequencies less
effect from salt accumulation. As described in Negrão than 5%, a total of 29,195, 14,750, and 21,514 SNP
et al. [54], it is difficult to differentiate cause-effect markers were identified in the 232, 165 and 66 acces-
relationships between photosynthesis and growth re- sions that belong to the whole panel, Japonica-specific
duction when quantifying the effects of salinity on panel, and Indica-specific panel, respectively.
photosynthesis; therefore, the phenotypes associated Sterilized seeds were soaked at 37 °C in water for 2 days
with chlorophyll biosynthesis could confound the in- to synchronize the germination, and germinated seeds
terpretation of association results. Through our experi- were placed in a hydroponic culture system in a phytotron
mental process, we identified several chromosomal regions on day 3. Three replicates for each rice accession were in-
associated with chlorophyll fluorescence parameter vari- cluded in each experiment. The photoperiod was set to a
ation, some significant SNPs closely linked to the genes 12-h-day/12-h-night cycle, and the temperature was set at
which were previously shown to be involved in salt toler- 28 °C / 25 °C (day/night). The light intensity was con-
ance (e.g. Ygl8, OsNHX3, OsCBL4), however, the effects of trolled at 350 μmole m− 2 s− 1. The hydroponic solution
most novel SNPs were small (R2 less than 10%) and could was a half-strength Kimura B solution [56]. After growing
be partially attributed to developmental aging variation in in the hydroponic system for 3 days, rice seedlings were
the tested varieties. A careful experimental design that con- treated with salt levels that increased daily (50, 100, 150
siders the natural senescence process is required when the mM) over subsequent days (days 6, 7, 8) and then main-
objective is to identify the chromosomal regions that are re- tained at 150 mM for 3 days for a visual evaluation of salt
sponsive solely to salinity stress. tolerance (injury score, IS) on day 11 (Fig. 1). In compari-
son, the control group was grown under the same condi-
Conclusions tions without any added salt. The hydroponic solution was
Is photosynthetic efficiency a quantitative trait and how refreshed every 3 days, and the pH of the culture solution
does it vary under salinity stress? In this study, we tried was adjusted to 4.9.Tsai et al. BMC Plant Biology (2019) 19:403 Page 15 of 17
In the pilot experiment, chlorophyll fluorescence im- Establish a visual standard system to evaluate the salt
aging was conducted on days 8, 9, 10, and 11 in the con- stress level
trol and treatment groups; for the GWAS experiment, To quantify and compare the symptoms of salt toxicity
chlorophyll fluorescence imaging was conducted on day among rice varieties, we modified the International Rice
9 in the salt treatment group only. Research Institute (IRRI) standard evaluation system
(SES) [59] according to our observations and assigned
Chlorophyll fluorescence imaging of the seedling leaf an injury score on a scale of 1 to 9, where a low score
A PAM fluorometer (the MAXI version of IMAGING- (near 1) represents tolerant individuals and a higher
PAM; Heinz Walz GmbH, Effeltrich, Germany) was used score represents sensitive individuals (Additional file 1:
to capture the images reflecting several chlorophyll fluores- Table S1).
cence parameters from a leaf. The imaging was conducted
in the dark room (temperature was set at 25 °C). The rice
Genome-wide association analysis
seedlings were dark-adapted at least 30 min before taking
Four statistical models were applied to identify the associ-
measurements on the second leaf of the seedling. To
ation between SNPs and trait variations: naïve, P, K, and
minimize the effect of circadian rhythms on the photosyn-
P + K models. The naïve model was represented by Y =
thesis efficiency, all measurements were taken at the same
Xβ + ε, where Y was phenotype data, X was genotype data,
time during the day. Minimum fluorescence (F0) was mea-
β was the SNP effect and ε was random effects. The P
sured under weak modulating radiation (0.5 μmol m− 2 s− 1),
model was represented by Y = Xβ + Pγ + ε, where P was the
and maximum fluorescence (Fm) was recorded by applying
population structure and γ was the effect of the population
a saturating pulse of radiation (2700 μmol m− 2 s− 1). To
structure. The K model was represented by Y = Xβ + Zu + ε,
measure the light responses, the actinic light (350 μmol m−
2 −1 where u was the random effect of kinship and Z was a coin-
s ) was switched on to drive photosynthesis for 5 min.
cidence matrix. The P + K model was represented by Y =
Steady-state fluorescence under light illumination (Ft) was
Xβ + Pγ + Zu + ε. The population structure was analyzed by
continuously monitored under weak modulating radiation
principal component analysis [60]. Association analyses
(0.5 μmol m− 2 s− 1), the maximum fluorescence in the
were conducted in TASSEL 4.0 [61] and R/GAPIT [62].
light (Fm′) was assessed by applying a saturating
The LD between the most significant SNP and its
pulse of radiation (2700 μmol m− 2 s− 1), and the mini-
neighboring SNPs was estimated using Tagger in Haplo-
mum fluorescence was calculated as F0’ = F0 / (Fv/
view 4.2 [63]. The candidate region was determined
Fm + F0/Fm′). These basic measurements were used
based on the LD (r2 > 0.7) between the most significant
to derive the relevant fluorescence parameters: Fv/
SNP and its neighboring SNPs, and the candidate genes
Fm, ΦPSII, qL, and NPQ [57].
within the region were identified using Gramene Bio-
The actual photosynthetic efficiency [Y(II)] was calcu-
Mart (http://ensembl.gramene.org/biomart). The SNP
lated as described by Genty et al. [58]. The quantum
position was based on IRGSP 1.0 annotation.
yield of regulated energy dissipation in PSII [Y(NPQ)]
and the quantum yield of nonregulated energy dissipa-
tion in PSII [Y(NO)] were calculated according to Kra- Statistical analysis
mer et al.’s [24] method. Pearson correlation was used to estimate the level of
The definition and calculation of six major chlorophyll correlation between traits. The normality of each trait
fluorescence parameters are described below: was tested using the Shapiro-Wilk method. The genetic
distance between the diverse accessions was calculated
1. F0 (minimum fluorescence) using the “euclidean” method, and agglomerative hier-
2. Fm (maximal fluorescence) archical clustering using the “complete” method was ap-
3. Fv/Fm (maximal PSII quantum yield), Fv/Fm = (Fm- plied to evaluate the relationship between traits and rice
F0)/Fm accession genetic backgrounds and was plotted as a
4. ΦPSII (effective PSII quantum yield), ΦPSII = (Fm heatmap. All analyses were conducted using publicly
′-Ft)/Fm′ available R packages.
5. qL (coefficient of photochemical quenching),
qL = (Fm′-Ft)/(Fm′-F0’) * (F0’/Ft)
Additional files
6. NPQ (nonphotochemical quenching), NPQ = (Fm-
Fm′)/Fm′ Additional file 1: Table S1. Phenotypic evaluation to score the visual
7. Y(II) = (Fm′-Fs)/Fm′ symptoms of salt toxicity at the seedling stage (DOCX 14 kb)
8. Y(NO) = 1/(NPQ + 1 + qL(Fm/Fo-1)) Additional file 2: Table S2. The quantum yield calculated from the
9. Y(NPQ) = 1-Y(II)-1/(NPQ + 1 + qL(Fm/Fo-1)) ratio of treatment to control (T/C) values of each parameter in eight
varieties (XLSX 14 kb)
10. Y(II) + Y(NO) + Y(NPQ) = 1Tsai et al. BMC Plant Biology (2019) 19:403 Page 16 of 17
Additional file 3: Table S3. Chlorophyll fluorescence and injury score Authors’ contributions
of 232 accessions and their subpopulation assignment (XLSX 33 kb) YCT, KCC, TSC and CWT conceived and designed the experiments; KCC, CL,
SHL optimized and performed the experiments; YCT, KCC, TSC and CWT
Additional file 4: Table S4. Correlation between chlorophyll analyzed the data and wrote the manuscript. All authors have read and
florescence parameters and injury score (IS) in the global panel (232 approved the manuscript.
varieties) (DOCX 16 kb)
Additional file 5: Table S5. The genes inside the LD region of the Funding
most significant SNP detected in the F0 GWAS (XLSX 75 kb) This research work was supported by the Ministry of Science and
Additional file 6: Table S6. The genes inside the LD region of the Technology Taiwan (grant numbers MOST 102–2313-B-002-001-MY3 and
most significant SNP detected in the qL GWAS (XLSX 112 kb) MOST 105–2311-B-002-024-MY3). The funding body had no role in the
design of this study and collection, analysis, and interpretation of data and in
Additional file 7: Figure S1. Daily changes in chlorophyll fluorescence
writing the manuscript.
parameters (ΦPSII, qL, NPQ) in eight rice varieties under control (red line)
and salt (blue line) conditions. Each data point represents the average
value of 3 replicates. (PPTX 10924 kb) Availability of data and materials
All data generated or analyzed during this study are included in this
Additional file 8: Figure S2. Box plot of six chlorophyll fluorescence
published article and its supplementary information files.
measurements and injury score in six subpopulations and two
subspecies. Student’s t-test was used to determine whether any two
subpopulations or two subspecies were different. *, **, and **** Ethics approval and consent to participate
represent the significance level at P < 0.05, 0.01 and 0.0001, Not applicable
respectively. (PDF 979 kb)
Additional file 9: Figure S3. Genetic relationship and phenotypic Consent for publication
distributions of varieties in five subpopulations. Each column represents a Not applicable
single variety, and the sample ID is labeled at the bottom of the
heatmap. Each row represents the chlorophyll fluorescence parameter Competing interests
and injury score of each variety. The colors close to red indicate that the The authors declare that they have no competing interests.
value of each chlorophyll fluorescence parameter is higher than its
average value over all accessions; for the injury score, the red represents Received: 11 April 2019 Accepted: 21 August 2019
the lower injury scores, which suggest that the variety is more tolerant to
salt toxicity. The color key of the Z-score was calculated from the
distance between the raw score and the population mean in units of the References
standard deviation. (PDF 1686 kb) 1. Ashraf M, Harris PJC. Photosynthesis under stressful environments: an
Additional file 10: Figure S4. Distribution of six chlorophyll overview. Photosynthetica. 2013;51:163–90.
fluorescence parameters in Japonica varieties. The normality of each 2. Maxwell K, Johnson GN. Chlorophyll fluorescence--a practical guide. J Exp
parameter was examined using the Shapiro-Wilks test. The P-value of Bot. 2000;51:659–68.
each test is provided. (PPTX 7609 kb) 3. Wang RL, Hua C, Zhou F, Zhou QC. Effects of NaCl stress on
Additional file 11: Figure S5. Distribution of six chlorophyll photochemical activity and thylakoid membrane polypeptide
fluorescence parameters in Indica varieties. The normality of each composition of a salt-tolerant and a salt-sensitive rice cultivar.
parameter was examined using the Shapiro-Wilks test. The P-value of Photosynthetica. 2009;47:125–7.
each test is provided. (PPTX 7606 kb) 4. Tiwari BS, Bose A, Ghosh B. Photosynthesis in rice under a salt stress.
Photosynthetica. 1998;34:303–6.
Additional file 12: Figure S6. Genome-wide association analysis of six 5. Murata N, Takahashi S, Nishiyama Y, Allakhverdiev SI. Photoinhibition of
chlorophyll fluorescence parameters in 232 diverse varieties or in two photosystem II under environmental stress. Biochim Biophys Acta. 2007;
subspecies (Japonica and Indica). Manhattan plot showing the 1767:414–21.
significance of each SNP tested by the appropriate statistical models 6. Belkhodja R, Morales F, Abadia A, Gomez-Aparisi J, Abadia J. Chlorophyll
described in “Methods”. (PDF 4610 kb) fluorescence as a possible tool for salinity tolerance screening in barley
Additional file 13: Figure S7. Genome-wide association analysis of qL (Hordeum vulgare L.). Plant Physiol. 1994;104:667–73.
in 232 diverse varieties and LD pattern of the most significant SNP. (a) 7. Yamane K, Kawasaki M, Taniguchi M, Miyake H. Correlation between
Manhattan plot showing the significance of each SNP tested by a mixed chloroplast ultrastructure and chlorophyll fluorescence characteristics in
linear model. (b) The most significant SNP is at 26,473,167 bp. The dot the leaves of rice (Oryza sativa L.) grown under salinity. Plant Prod Sci.
color of each SNP represents its LD with the most significant SNP, and 2008;11:139–45.
the decay of LD is bordered by two vertical dashed lines. The location of 8. Flood PJ, Harbinson J, Aarts MG. Natural genetic variation in plant
the OsCBL4 gene is marked with a blue bar. (PPTX 14234 kb) photosynthesis. Trends Plant Sci. 2011;16:327–35.
9. Van Bezouw R, Keurentjes JJB, Harbinson J, Aarts MGM. Converging
phenomics and genomics to study natural variation in plant photosynthetic
efficiency. Plant J. 2019;97:112–33.
Abbreviations 10. Van Rooijen R, Aarts MGM, Harbinson J. Natural genetic variation for
ETR: Electron transfer rate; GWAS: Genome-wide association study; acclimation of photosynthetic light use efficiency to growth irradiance in
IRRI: International Rice Research Institute; LD: Linkage disequilibrium; Arabidopsis. Plant Physiol. 2015;167:1412–29.
LHC: Light-harvesting complex; NPQ: Nonphotochemical quenching; 11. Azam FI, Chang X, Jing R. Mapping QTL for chlorophyll fluorescence kinetics
PAM: Pulse-amplitude modulation; PS: Photosystem; Q-Q: Quantile-quantile; parameters at seedling stage as indicators of heat tolerance in wheat.
QTL: Quantitative trait loci; RGR: Relative growth rate; SES: Standard Euphytica. 2015;202:245–58.
evaluation system; TEJ: Temperate japonica; TR: Transpiration rate; TRJ: Tropical 12. Takai T, Kondo M, Yano M, Yamamoto T. A quantitative trait locus for
japonica; TUE: Transpiration use efficiency chlorophyll content and its association with leaf photosynthesis in rice. Rice.
2010;3:172–80.
13. Wang Q, Xie W, Xing H, Yan J, Meng X, Li X, et al. Genetic architecture of
Acknowledgements natural variation in rice chlorophyll content revealed by a genome-wide
We thank Dr. Susan McCouch and USDA-ARS, Dale Bumpers National Rice association study. Mol Plant. 2015;8:946–57.
Research Center-GSOR for providing the rice seeds, and the specialists from 14. Lin P-C, Tsai Y-C, Hsu S-K, Ou J-H, Liao C-T, Tung C-W. Identification of
the Oldinburgh Co., Ltd., Taiwan for advising regarding the operation of the natural variants affecting chlorophyll content dynamics during rice seedling
IMAGING-PAM instrument. development. Plant Breed. 2018;137:355–63.Tsai et al. BMC Plant Biology (2019) 19:403 Page 17 of 17
15. Dionisio-Sese ML, Tobita S. Effects of salinity on sodium content and 40. Tikkanen M, Mekala NR, Aro EM. Photosystem II photoinhibition-repair cycle
photosynthetic responses of rice seedlings differing in salt tolerance. J Plant protects photosystem I from irreversible damage. Biochim Biophys Acta.
Physiol. 2000;157:54–8. 2014;1837:210–5.
16. Fracheboud Y, Jompuk C, Ribaut JM, Stamp P, Leipner J. Genetic analysis of 41. Yamane Y. In: Mathis P, editor. Photosynthesis: from light to biosphere Effects
cold-tolerance of photosynthesis in maize. Plant Mol Biol. 2004;56:241–53. of high temperatures on photosynthetic systems in higher plants. 1. Causes of
17. Ehlert B, Hincha DK. Chlorophyll fluorescence imaging accurately quantifies the increase in the fluorescence Fo level. Dordrecht: Springer; 1995. p. 849–52.
freezing damage and cold acclimation responses in Arabidopsis leaves. Plant 42. Yamane Y, Kashino Y, Koike H, Satoh K. Increases in the fluorescence Fo level
Methods. 2008;4:12. and reversible inhibition of photosystem II reaction center by high-
18. Lutts S, Kinet JM, Bouharmont J. NaCl-induced senescence in leaves of temperature treatments in higher plants. Photosynth Res. 1997;52:57–64.
rice (Oryza sativa L) cultivars differing in salinity resistance. Ann Bot. 43. Wu Y, Jin X, Liao WBA, Hu LL, Dawuda MM, Zhao XJ, et al. 5-Aminolevulinic
1996;78:389–98. acid (ALA) alleviated salinity stress in cucumber seedlings by enhancing
19. Sarkar RK, Mahata KR, Singh DP. Differential responses of antioxidant system chlorophyll synthesis pathway. Front Plant Sci. 2018;9:635.
and photosynthetic characteristics in four rice cultivars differing in sensitivity 44. Cardona T, Shao SX, Nixon PJ. Enhancing photosynthesis in plants: the light
to sodium chloride stress. Acta Physiol Plant. 2013;35:2915–26. reactions. Essays Biochem. 2018;62:85–94.
20. Yamane K, Rahman S, Kawasaki M, Taniguchi M, Miyake H. Pretreatment 45. Horton P, Ruban AV, Young AJ. Regulation of the structure and function of
with antioxidants decreases the effects of salt stress on chloroplast the light harvesting complexes of photosystem II by the xanthophyll cycle.
ultrastructure in rice leaf segments (Oryza sativa L.). Plant Prod Sci. In: Frank HA, Young AJ, Britton G, Cogdell RJ, editors. The photochemistry of
2004;7:292–300. carotenoids. Dordrecht: Springer; 1999. p. 271–91.
21. Lee MH, Cho EJ, Wi SG, Bae H, Kim JE, Cho JY, et al. Divergences in 46. Yamamoto HY, Bugos RC, Hieber AD. Biochemistry and molecular
morphological changes and antioxidant responses in salt-tolerant and salt- biology of the xanthophyll cycle. In: Frank HA, Young AJ, Britton G,
sensitive rice seedlings after salt stress. Plant Physiol Biochem. 2013;70:325–35. Cogdell RJ, editors. The photochemistry of carotenoids. Dordrecht:
22. Singh DP, Sarkar RK. Distinction and characterisation of salinity tolerant and Springer; 1999. p. 293–303.
sensitive rice cultivars as probed by the chlorophyll fluorescence characteristics 47. Bilger W, Björkman O. Role of the xanthophyll cycle in photoprotection elucidated
and growth parameters. Funct Plant Biol. 2014;41:727–36. by measurements of light-induced absorbance changes, fluorescence and
23. Moradi F, Ismail AM. Responses of photosynthesis, chlorophyll fluorescence photosynthesis in leaves of Hedera canariensis. Photosynth Res. 1990;25:173–85.
and ROS-scavenging systems to salt stress during seedling and reproductive 48. Ishida S, Morita KI, Kishine M, Takabayashi A, Murakami R, Takeda S, et al. Allocation
stages in rice. Ann Bot. 2007;99:1161–73. of absorbed light energy in PSII to thermal dissipations in the presence or absence
24. Kramer DM, Johnson G, Kiirats O, Edwards GE. New fluorescence parameters of PsbS subunits of rice. Plant Cell Physiol. 2011;52:1822–31.
for the determination of QA redox state and excitation energy fluxes. 49. Roháček K, Soukupová J, Barták M. In: Schoefs B, editor. Plant cell
Photosynth Res. 2004;79:209–18. compartments-selected topics Chlorophyll fluorescence: a wonderful
25. Rajendran K, Tester M, Roy SJ. Quantifying the three main components of tool to study plant physiology and plant stress. Kerala: Research
salinity tolerance in cereals. Plant Cell Environ. 2009;32:237–49. Signpost; 2008. p. 41–104.
26. Hairmansis A, Berger B, Tester M, Roy SJ. Image-based phenotyping for non- 50. Qu CX, Liu C, Gong XL, Li CX, Hong MM, Wang L, et al. Impairment of maize
destructive screening of different salinity tolerance traits in rice. Rice. 2014;7:16. seedling photosynthesis caused by a combination of potassium deficiency
27. Al-Tamimi N, Brien C, Oakey H, Berger B, Saade S, Ho YS, et al. Salinity and salt stress. Environ Exp Bot. 2012;75:134–41.
tolerance loci revealed in rice using high-throughput non-invasive 51. Pradhan B, Chakraborty K, Prusty N, Deepa MAK, Chattopadhyay K, et al. Distinction
phenotyping. Nat Commun. 2016;7:13342. and characterisation of rice genotypes tolerant to combined stresses of salinity and
28. Ahmadi J, Fotokian MH. Identification and mapping of quantitative trait loci partial submergence, proved by a high-resolution chlorophyll fluorescence
associated with salinity tolerance in rice (Oryza Sativa) using SSR markers. imaging system. Functional Plant Biol. 2019;46:248–61.
Iran J Biotechnol. 2011;9:21–30. 52. Munns R, Tester M. Mechanisms of salinity tolerance. Annu Rev Plant Biol.
29. Sun J, Zou DT, Luan FS, Zhao HW, Wang JG, Liu HL, et al. Dynamic QTL 2008;59:651–81.
analysis of the Na+ content, K+ content, and Na+/K+ ratio in rice roots 53. Roy SJ, Negrao S, Tester M. Salt resistant crop plants. Curr Opin Biotechnol.
during the field growth under salt stress. Biol Plant. 2014;58:689–96. 2014;26:115–24.
30. Sabouri H, Sabouri A. New evidence of QTLs attributed to salinity tolerance 54. Negrao S, Schmockel SM, Tester M. Evaluating physiological responses of
in rice. Afr J Biotechnol. 2008;7:4376–83. plants to salinity stress. Ann Bot. 2017;119:1–11.
55. Zhao K, Tung CW, Eizenga GC, Wright MH, Ali ML, Price AH, et al. Genome-
31. Wang Z, Cheng J, Chen Z, Huang J, Bao Y, Wang J, et al. Identification of
wide association mapping reveals a rich genetic architecture of complex
QTLs with main, epistatic and QTL x environment interaction effects for salt
traits in Oryza sativa. Nat Commun. 2011;2:467.
tolerance in rice seedlings under different salinity conditions. Theor Appl
56. Ma JF, Goto S, Tamai K, Ichii M. Role of root hairs and lateral roots in silicon
Genet. 2012;125:807–15.
uptake by rice. Plant Physiol. 2001;127:1773–80.
32. Zhu X, Guo S, Wang Z, Du Q, Xing Y, Zhang T, et al. Map-based cloning and
57. Baker NR. Chlorophyll fluorescence: a probe of photosynthesis in vivo. Annu
functional analysis of YGL8, which controls leaf colour in rice (Oryza sativa).
Rev Plant Biol. 2008;59:89–113.
BMC Plant Biol. 2016;16:134.
58. Genty B, Briantais J-M, Baker NR. The relationship between the quantum
33. Qiu X, Yuan Z, Liu H, Xiang X, Yang L, He W, et al. Identification of salt tolerance-
yield of photosynthetic electron transport and quenching of chlorophyll
improving quantitative trait loci alleles from a salt-susceptible rice breeding line by
fluorescence. Biochim Biophys Acta Gen Subj. 1989;990:87–92.
introgression breeding. Plant Breed. 2015;134:653–60.
59. IRRI. Standard evaluation system for rice. Philippine: International Rice
34. Cheng L, Wang Y, Meng L, Hu X, Cui Y, Sun Y, et al. Identification of salt-
Research Institute; 2002.
tolerant QTLs with strong genetic background effect using two sets of
60. Price AL, Patterson NJ, Plenge RM, Weinblatt ME, Shadick NA, Reich D.
reciprocal introgression lines in rice. Genome. 2012;55:45–55.
Principal components analysis corrects for stratification in genome-wide
35. Fukuda A, Nakamura A, Hara N, Toki S, Tanaka Y. Molecular and functional analyses
association studies. Nat Genet. 2006;38:904–9.
of rice NHX-type Na+/H+ antiporter genes. Planta. 2011;233:175–88.
61. Bradbury PJ, Zhang Z, Kroon DE, Casstevens TM, Ramdoss Y, Buckler ES.
36. Martinez-Atienza J, Jiang X, Garciadeblas B, Mendoza I, Zhu JK, Pardo JM, et TASSEL: software for association mapping of complex traits in diverse
al. Conservation of the salt overly sensitive pathway in rice. Plant Physiol. samples. Bioinformatics. 2007;23:2633–5.
2007;143:1001–12. 62. Lipka AE, Tian F, Wang Q, Peiffer J, Li M, Bradbury PJ, et al. GAPIT: genome
37. Zheng H, Zhao H, Liu H, Wang J, Zou D. QTL analysis of Na+ and K+ association and prediction integrated tool. Bioinformatics. 2012;28:2397–9.
concentrations in shoots and roots under NaCl stress based on linkage and 63. Barrett JC, Fry B, Maller J, Daly MJ. Haploview: analysis and visualization of
association analysis in japonica rice. Euphytica. 2015;201:109–21. LD and haplotype maps. Bioinformatics. 2005;21:263–5.
38. Thomson MJ, de Ocampo M, Egdane J, Rahman MA, Sajise AG, Adorada DL,
et al. Characterizing the saltol quantitative trait locus for salinity tolerance in
rice. Rice. 2010;3:148–60. Publisher’s Note
39. Berry JA, Downton WJS. Environmental regulation of photosynthesis. In: Springer Nature remains neutral with regard to jurisdictional claims in
Photosynthesis, vol. 2; 1982. p. 263–343. published maps and institutional affiliations.You can also read