Distribution, fisheries interactions and assessment of threats to Australia's sea snakes
←
→
Page content transcription
If your browser does not render page correctly, please read the page content below
Distribution, fisheries interactions
 and assessment of threats to
 Australia’s sea snakes
Vinay Udyawer, Katie Oxenham, Mathew Hourston & Michelle Heupel

Project A8 - Exploring the status of Western Australian sea snakes

 April 2021

 Milestone 19

 www.nespmarine.edu.au
Enquiries should be addressed to:
Dr. Vinay Udyawer
v.udyawer@aims.gov.au

Preferred Citation
Udyawer V, Oxenham K, Hourston M & Heupel M. (2020). Distribution, fisheries interactions and
assessment of threats to Australia’s sea snakes. Report to the National Environmental Science
Program, Marine Biodiversity Hub.

Copyright
This report is licensed by the University of Tasmania for use under a Creative Commons Attribution
4.0 Australia Licence. For licence conditions, see https://creativecommons.org/licenses/by/4.0/

Acknowledgement
This work was undertaken for the Marine Biodiversity Hub, a collaborative partnership supported
through funding from the Australian Government’s National Environmental Science Program (NESP).
NESP Marine Biodiversity Hub partners include the University of Tasmania; CSIRO, Geoscience
Australia, Australian Institute of Marine Science, Museum Victoria, Charles Darwin University, the
University of Western Australia, Integrated Marine Observing System, NSW Office of Environment and
Heritage, NSW Department of Primary Industries.

Important Disclaimer
The NESP Marine Biodiversity Hub advises that the information contained in this publication
comprises general statements based on scientific research. The reader is advised and needs to be
aware that such information may be incomplete or unable to be used in any specific situation. No
reliance or actions must therefore be made on that information without seeking prior expert
professional, scientific and technical advice. To the extent permitted by law, the NESP Marine
Biodiversity Hub (including its host organisation, employees, partners and consultants) excludes all
liability to any person for any consequences, including but not limited to all losses, damages, costs,
expenses and any other compensation, arising directly or indirectly from using this publication (in part
or in whole) and any information or material contained in it.
Contents

Executive Summary ................................................................................................... 1
1. Introduction ....................................................................................................... 3
 1.1 Current status of sea snakes in Australia ................................................... 3
2. Distribution of Sea snakes within Australian waters ...................................... 6
 2.1 Species habitat suitability modelling ........................................................... 6
 2.1.1 Species occurrence records ......................................................... 6
 2.1.2 Environmental, biophysical and habitat variables.......................... 8
 2.1.3 Modelling framework .................................................................... 9
 2.1.4 Model evaluation and influence of environmental covariates ...... 10
 2.1.5 Identification of suitable habitats ................................................. 13
 2.2 Identifying hotspots of sea snake biodiversity and endemism................... 13
 2.2.1 Diversity and Endemism of sea snakes within Marine Protected Areas
 ................................................................................................... 15
3. Sea snake interactions with fisheries in Northern Australia ........................ 17
 3.1 Fishing effort information .......................................................................... 17
 3.2 Species assemblages and interactions rates with fisheries on the
 North West Shelf ...................................................................................... 21
 3.3 Assemblage of sea snakes within coastal protected areas within the
 Gulf of Carpentaria ................................................................................... 23
4. Conclusions and recommendations .............................................................. 26
References ................................................................................................................ 31
Appendices ............................................................................................................... 38
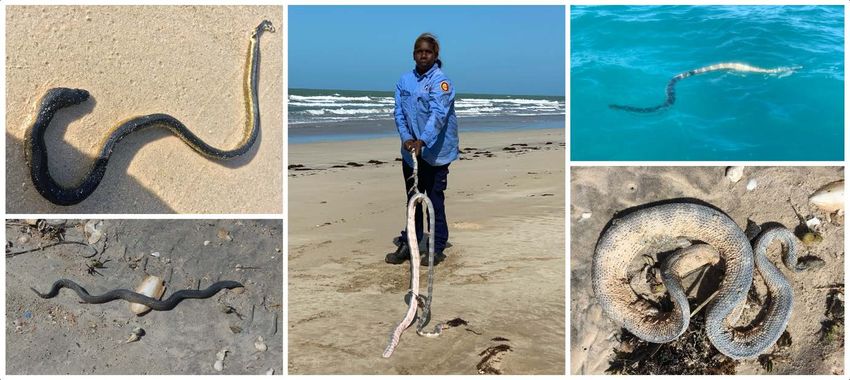
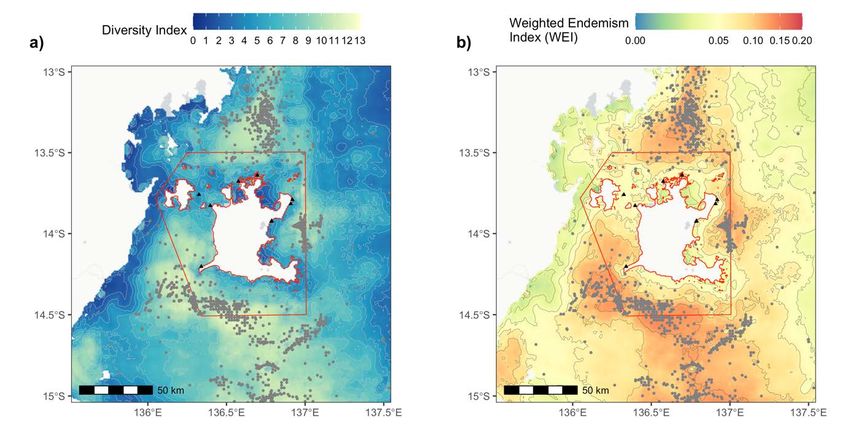
List of Figures
Figure 1. Locations of geo-referenced occurrences of 27 species of sea snakes used to build species
 distribution models. Data were run through a quality check by removing duplicated records, and
 potential misidentifications. Where video/photographs were available (i.e. BRUVs footage,
 fisheries photographs), these were used to verify occurrence records. ............................................... 7
Figure 2. Summary of the relative variable contribution for each environmental variable used in optimal
 MaxEnt model for each of the 23 species for which sufficient data was available. Variable
 contribution was calculated for each tuned model. Variable on the y-axis are ranked in decreasing
 order based on average overall variable importance across all species models. ............................ 12
Figure 3. Spatially explicit species diversity (a) and endemism (b) maps for sea snake species across
 Northern Australia, within the Australian EEZ and in regions shallower than 1000 m. Note the
 colour scale in panel b is log scaled to highlight regions of high WEI within the North-west Shelf.14
Figure 4. Diversity and endemism index of sea snake species within Marine Protected Areas (left
 panel) identified the North and North-west networks to have the highest diversity and endemism
 (right panels). Points in the right panel represent mean index values within AMPs, with error bars
 representing standard error of index values. Ashmore Reef Marine Park in the North-west
 network, and Gulf of Carpentaria Marine Park in the North network had the highest levels of
 species diversity and endemism. ............................................................................................................. 15
Figure 5. Diversity and endemism index of sea snake species with declared Indigenous Protected
 Areas (left panel) identified that sea country within the Gulf of Carpentaria, and within Roebuck
 Bay had high levels of sea snake diversity and endemism (right panels). Points in right panel
 represent mean index values within IPAs, with error bars representing standard error of index
 values. .......................................................................................................................................................... 16
Figure 6. Estimated mean annual fishing effort in hours between 2012 – 2016 within the North-west
 and Northern marine region. Annual fishing effort was estimated using AIS data from the AMSA
 Craft Tracking System and Global Fishing Watch datasets. Note colour bar on the bottom is log
 scaled to highlight regions with high mean annual fishing effort. ........................................................ 18
Figure 7. Mean Fishing Exposure Index across 23 species of sea snake highlighting regions with high
 fishing exposure of sea snakes to trawl fishing effort within the Australian EEZ. ............................. 19
Figure 8. Mean and standard error of species-level fishing exposure index within the North-west and
 North marine region, highlighting high exposure indices for species with restricted ranges that fall
 entirely within highly productive trawl grounds within the Pilbara, Shark Bay and Exmouth Gulf
 regions. ........................................................................................................................................................ 20
Figure 9. (a) Map of locations of trawl surveys conducted on the RV Naturaliste where sea snakes
 were captured within the four broad regions. (b) Species-specific encounter rates and condition of
 sea snakes within the four broad regions with total duration of trawls conducted (hrs) in
 parentheses in graph titles. ....................................................................................................................... 21
Figure 10. Survivorship curves for sea snakes encountered in trawl surveys broken down into the two
 main lineages (Aipysurus/Emydocephalus and Hydrophis). Species and regional level analyses
 was not possible due to limited regional and species-specific data. Histogram on the top highlights
 the counts of snakes within the two main lineages encountered across the full range of trawl
 duration. ....................................................................................................................................................... 22
Figure 11. Sea snakes recorded within the Anindilyakwa IPA by the Anindilyakwa Land and Sea
 Rangers during beach activities and during on-water activities. (Photo Credit: Katie Oxenham, Jeff
 Paul, Keith Lambert) .................................................................................................................................. 24
Figure 12. Distribution of records of sea snakes within the Anindilyakwa Indigenous Protected Area
 (IPA; red boundary), with maps highlighting the high diversity (a) and relative weighted endemism
 (b) of sea snakes in surrounding waters of the IPA. Black triangles represent coastal records of
sea snakes recorded by the Anindilyakwa Land and Sea Rangers during marine operations and
 from sightings recorded by the Rangers and other Groote Eylandt residents on the Australian Sea
 Snakes page (https://www.facebook.com/groups/australianseasnakes). Grey points represent
 records from the Atlas of Living Australia and records from the NPF scientific observer program
 (Milton et al. 2008). .................................................................................................................................... 24
Figure 13. Assemblage of sea snakes recorded within and adjacent to the Anindilyakwa IPA. ............ 25

List of Tables
Table 1. Environmental, biophysical and habitat parameters used as covariates to model sea snake
 distribution. .................................................................................................................................................... 8
Table 2. Summary table of model evaluation scores including the area under the receiver operating
 curve (AUC) and true skill statistic (TSS). AUC scores range between 0 and 1, where a score of 0
 represents a complete mismatch between the model projection and actual occurrence data, while
 a score of 1 represents a perfect alignment between the projection and occurrence data. The true
 skill statistic (TSS) ranges from -1 to +1, where +1 indicates perfect agreement and values of zero
 or less indicate a performance no better than random ......................................................................... 11
EXECUTIVE SUMMARY

Reported declines in sea snake abundance within multiple locations in Australia have
increased concern about the status of sea snake species. Many regions of Australia,
including the North-west shelf were once a global hotspot for sea snake abundance
including the three endemic species that are listed as Endangered or Critically
Endangered (Aipysurus apraefrontalis, A. foliosquama and A. fuscus). The extent
and underlying causes of sea snake declines are still unknown, which hinders
assessments of population status and development of management and recovery
plans. Recent findings of new populations of species once thought locally extinct
have made our current understanding of distribution patterns and their status
outdated.

This project integrated existing sea snake occurrence data, field surveys and trawl
interaction data to define the habitat suitability, distribution and area of occurrence of
27 species of sea snakes within the Australian Economic Exclusion Zone (EEZ).
Areas of high diversity and endemism within the North-west and Northern Marine
Region were defined, identifying south-west Gulf of Carpentaria as a region with the
highest diversity, with the North-west Shelf region (i.e. Scott Reef and the north-west
shoals) as a region of high sea snake endemism. Habitat suitability model spatial
outputs were overlayed with annual fishing effort data using Automated Identification
System (AIS) data from fishing vessels, to assess sea snake species exposure to
trawl fishing. Overlap analysis identified regions along the Pilbara coastline and
within the Gulf of Carpentaria as regions with significant overlap between trawl
fishing effort and highly suitable habitats for sea snakes. Species with restricted
ranges that fell within fishing grounds within the North-west marine region were
identified to have high levels of spatial exposure to fishing activities.

Data obtained during field surveys and using fisheries-independent survey data
identified high proportions of A. apraefrontalis and A. foliosquama within regional
trawl surveys. Analysis of condition of encountered individuals from trawl surveys
found that Aipysurus species had high survival rates in the surveys, whereas larger

Distribution, fisheries interactions and assessment of threats to Australia’s sea snakes • April 2021 Page | 1
bodied species of the Hydrophis lineage were more susceptible to mortality in trawl
nets. Using updated information, including that generated from this project,
recommendations are made to update the status of key species identified as
vulnerable or of conservation priority within Australian waters. In summary, due to the
lack of certainty of causes of extirpation in the two Critically Endangered species
from Ashmore and Hibernia Reefs (Aipysurus apraefrontalis and A. foliosquama),
and the high degree of overlap of their newly described coastal populations with trawl
fisheries, we recommend these species remain as a conservation priority. Due to the
significant reduction of geographic range, unknown causes of local extinctions of
Aipysurus fuscus at Ashmore Reef, and mounting evidence of high rates of
hybridisation within the surviving populations, we recommend that this species be
considered for elevated conservation status, and be assessed for listing under the
EPBC Act.

Distribution, fisheries interactions and assessment of threats to Australia’s sea snakes • April 2021 Page | 2
INTRODUCTION

1. INTRODUCTION

Sea snakes are an ecologically diverse clade of more than 70 species globally, that
represent the only truly marine reptiles (comprising ca. 90% of extant marine reptile
species; Rasmussen et al. 2014). Of the >70 species described, ~27 are found within
Australian waters and are listed marine species under the Environmental Protection
and Biodiversity Conservation Act of 1999 (EPBC), with 2 endemic species
(Aipysurus apraefrontalis and A. foliosquama) listed as Critically Endangered. Well
documented declines in sea snake abundance in Western Australia, specifically
within protected waters of the Ashmore Marine Park (Lukoschek et al. 2013), and the
high representation of sea snakes in bycatch in coastal trawl fisheries have
highlighted concerns about the status of sea snake species (Pears et al. 2012;
Wassenberg et al. 2001). All the causes of the observed declines have not been
defined, indicating an urgent need for research and exploration of the status of these
species, in particular, knowledge on the distribution, threats and range of sea snake
species in Northern Australia. These data are needed to define the status of these
species to assist with updating EPBC listing status, as well as designing and
implementing effective management and Recovery Plans.

This project aimed to compile existing information about sea snake occurrence,
assemblages and bycatch rates from the northwest marine region, and collect
additional data in regions with information gaps to; i) define sea snake distribution
patterns, ii) identify key hotspots of high diversity and endemism, and iii) assess
interaction rates and identify species vulnerable to fisheries bycatch. The new
information generated will be discussed in the context of updating the status of key
species that are identified as vulnerable or of conservation priority within Australian
waters.

1.1 Current status of sea snakes in Australia

Over the last decade, molecular studies have continued to refine sea snake
taxonomy, with new integrated assessment of genetic and morphological data

Distribution, fisheries interactions and assessment of threats to Australia’s sea snakes • April 2021 Page | 3
INTRODUCTION

indicating that many widespread ‘species’ include multiple cryptic species, each with
narrow distributions (e.g. Emydocephalus spp.: Nankivell et al. 2020; Hydrophis spp.:
Ukuwela et al. 2013; Ukuwela et al. 2014). Additionally, recorded hybridization
between closely related species with overlapping ranges is likely to affect the true
diversity of sea snakes within Australia (Lukoschek 2018; Sanders et al. 2014). With
increased molecular work and genetic assessments, it is estimated that there are
likely an additional ~20 species that remain to be discovered, increasing global and
Australian sea snake diversity (Udyawer et al. 2018).

Of the ~27 species of sea snakes currently described in Australia, seven species
have highly restricted geographic ranges and are endemic to Australian waters
(Aipysurus apraefrontalis, A. foliosquama, A. fuscus, Hydrophis pacificus, A.
pooleorum, A. tenuis, and H. donaldi; see Appendix 1 for known distributions). Two of
the six short-range endemics (A. apraefrontalis and A. foliosquama) are also
currently listed as Critically Endangered under the International Union for the
Conservation of Nature (IUCN) Red List criteria (Elfes et al. 2013). Until 2001,
breeding populations of these two species were only known from Ashmore and
Hibernia Reefs in the Timor Sea (Cogger 1975). However, neither species has been
recorded at those two reefs since 2001, and both species were presumed extirpated,
coinciding with a drastic decline in the overall sea snake assemblage in the area
(Guinea 2013; Lukoschek et al. 2013; Sanders et al. 2015). Subsequently, breeding
populations of both A. apraefrontalis and A. foliosquama were recently discovered in
coastal Western Australia up to 800 km away from their previously known range in
the Timor Sea (D'Anastasi et al. 2016b). A. fuscus, listed by IUCN as Endangered
(Elfes et al. 2013), is historically recorded only from the Ashmore and Scott Reef
complexes in the Timor Sea and has declined throughout that restricted range
(Lukoschek et al. 2013). Hydrophis pacificus is currently listed by IUCN as Near
Threatened (Elfes et al. 2013), and is primarily only known from bycatch records in
the Northern Prawn Fishery (NPF) that operates within the Gulf of Carpentaria. The
listing of this species as Near Threatened has been primarily due to its extremely
localised catch distribution within the Gulf of Carpentaria, and their recorded declines
in abundance of catch within fishing grounds (Milton et al. 2008).

Distribution, fisheries interactions and assessment of threats to Australia’s sea snakes • April 2021 Page | 4
INTRODUCTION

 Three species, A. tenuis, A. pooleorum and Hydrophis donaldi, are among the
least-studied species, and are currently categorised as Data-Deficient and
unassessed by IUCN, due to the lack of information on their geographic ranges and
population trends (Elfes et al. 2013). Although A. pooleorum forms a closely related
subpopulation of the more widely studied A. laevis, very little is known about this
highly localised species, currently only recognised from Shark Bay in Western
Australia (D'Anastasi et al. 2016a). Similarly, H. donaldi is a recently described
species, and has only been recorded within estuarine habitats of Weipa, northeast
Gulf of Carpentaria (Ukuwela et al. 2012).

Distribution, fisheries interactions and assessment of threats to Australia’s sea snakes • April 2021 Page | 5
DISTRIBUTION OF SEA SNAKES WITHIN AUSTRALIAN WATERS

2. DISTRIBUTION OF SEA SNAKES WITHIN AUSTRALIAN
 WATERS

A significant challenge in conserving rare species, and managing threats to
populations of conservation priority, is accurately identifying suitable habitats and
distributions of populations (Hoffmann et al. 2008). Long-term monitoring datasets
are key to understanding spatial distributions and population trends, however for rare
species like some short-range endemic species of sea snake, this information is
often lacking. Systematic sampling is the most reliable way of filling knowledge gaps
relating to the spatial distribution of species. However, achieving adequate
spatiotemporal replication over large geographical areas or in difficult to survey
habitats is impractical and inefficient. Correlative models linking species presence
records to a set of environmental characteristics of those locations (hereafter species
distribution models; SDMs; Peterson et al. 2011) are a practical and efficient tool that
can be used to inform data collection strategies (Jackson and Robertson 2011),
improve estimates of species distributions (Gherghel et al. 2018) and identify suitable
habitats (Guisan et al. 2006). When applied to understanding the distributions of rare
or information-deficient species, SDMs can identify geographic regions that have
similar habitats to those known to be occupied, but that have no known records
(Maycock et al. 2012). These areas represent high priority targets for future survey
efforts and for consideration when planning for conservation management.

2.1 Species habitat suitability modelling
2.1.1 Species occurrence records

 We compiled occurrence records for sea snakes found within Australian waters
from four sources: (a) Records of sea snake sightings from one national (The Atlas of
Living Australia; www.ala.org.au) and one international (Reef Life Survey;
www.reeflifesurvey.com) data repository, (b) snorkel, SCUBA and boat-based day
and night-time surveys conducted by Hub researchers and project partners (collected
between 2014 and 2017), (c) sightings on baited remote underwater video stations
collected by the Australian Institute of Marine Science (BRUVs; collected between

Distribution, fisheries interactions and assessment of threats to Australia’s sea snakes • April 2021 Page | 6
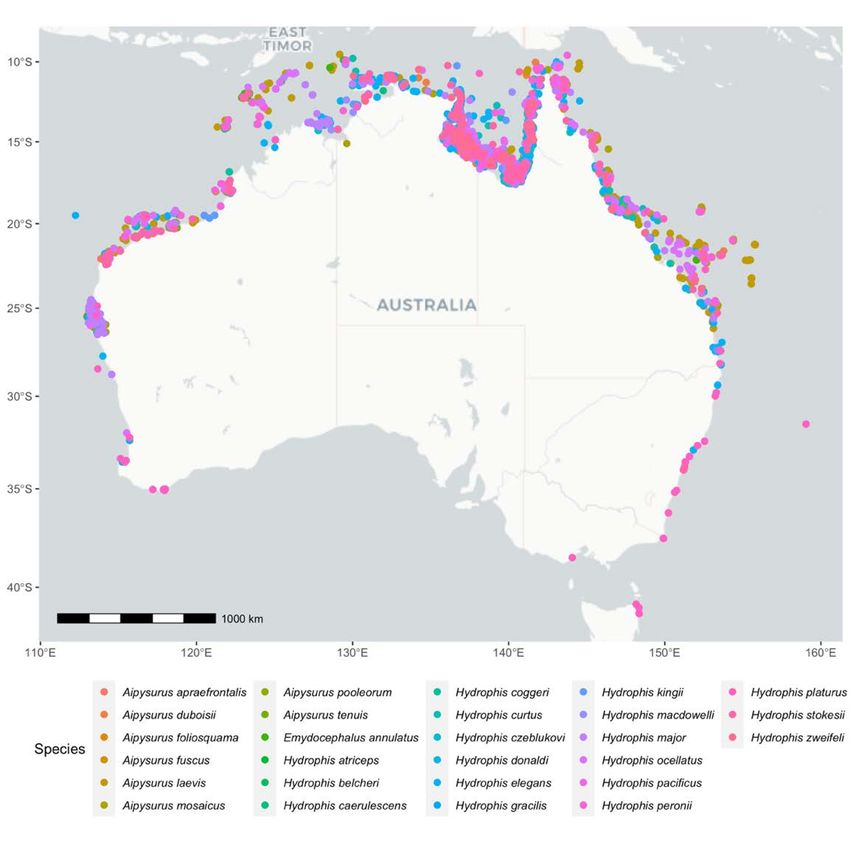
DISTRIBUTION OF SEA SNAKES WITHIN AUSTRALIAN WATERS

1999 and 2016), and (d) fisheries-independent trawl bycatch data collected between
2016 and 2017 by Hub Researchers in collaboration with the Western Australian
Department of Fisheries (Figure 1, Appendix 1). Each occurrence record was quality
checked to remove duplicated records, suspect or imprecise data, and verify the
identification of species where photographic or video records were available (i.e.
BRUVs and fisheries data). Together, we assembled a total of 8,359 records from 27
species (Appendix 1). Confirmed sea snake sightings and occurrence data were
used to construct species distribution models (SDMs) within the Australian Exclusive
Economic Zone to assess the extent of occurrence of all sea snake species where
sufficient data was available.

Figure 1. Locations of geo-referenced occurrences of 27 species of sea snakes used to build species
distribution models. Data were run through a quality check by removing duplicated records, and
potential misidentifications. Where video/photographs were available (i.e. BRUVs footage, fisheries
photographs), these were used to verify occurrence records.

Distribution, fisheries interactions and assessment of threats to Australia’s sea snakes • April 2021 Page | 7
DISTRIBUTION OF SEA SNAKES WITHIN AUSTRALIAN WATERS

2.1.2 Environmental, biophysical and habitat variables

 A wide array of climatic, habitat and geomorphological correlates were compiled to
model species distributions within the Australian EEZ. Expert opinion and knowledge
of sea snake ecology was used to make an a priori selection of 16 variables relating
to oceanic climate, geophysical and habitat conditions (Table 1). Environmental data
was standardised to the highest spatial resolution available (0.0083 degrees; 30 arc-
seconds).

Table 1. Environmental, biophysical and habitat parameters used as covariates to model sea snake
distribution.
 Environmental Variable Variable name Source Range Mean ± SD
 Oceanic climatic variables
 Mean annual sea surface sst_mean AODN 9.9 – 28.8 21.7 ± 0.5
 temperature (˚C)
 Mean sea surface temperature sst_cold_mnth AODN -1.7 – 26.7 19.3 ± 5.1
 during coldest month (˚C)
 Mean sea surface temperature sst_warm_mnth AODN 11.1 – 32.1 24.1 ± 5.0
 during warmest month (˚C)
 Mean annual salinity (psu) sal_mean AODN 33.9 – 36.3 35.2 ± 0.4
 Mean salinity during wettest sal_fresh_mnth AODN 32.2 – 36.1 34.9 ± 0.6
 month (psu)
 Mean salinity during driest month sal_salt_mnth AODN 34.7 – 36.1 35.4 ± 0.2
 (psu)
 Seabed geomorphology
 Proportion of gravel substrate (%) gravel GA 0 – 88.1 7.4 ± 7.7
 Proportion of mud substrate (%) mud GA 0 – 99.1 50.3 ± 26.3
 Proportion of sand substrate (%) sand GA 0.8 – 100 42.1 ± 22.6
 Seabed topography
 Bathymetry (m) bathy GA 0 – 6878 2309.1 ±
 1996.7
 Habitat variables
 Proximity to the coast (km) dist_to_land Calculated from 1 – 616 210.9 ± 140.7
 GeoData Coast
 100K
 Proximity to reef systems (km) dist_to_reef Calculated from 0 – 16855 444.9 ± 469.1
 Seamap habitat
 layer
 Proximity to seagrass habitats dist_to_seagrass Calculated from 0 – 940.5 212.1 ± 183.1
 (km) Seamap habitat
 layer
 Proximity to mangrove habitats dist_to_mangrove Calculated from 0 – 1124.0 367.6 ± 250.2
 (km) Seamap habitat
 layer
 Geographic position
 Longitude lon 109.23 –
 163.18
 Latitude lat -8.88 – -47.18
Note: Data were sourced at 30 arc-second resolutions from the Australian Ocean Data Network (AODN;
http://portal.aodn.org.au/), Geosciences Australia (GA; https://www.ga.gov.au/data-pubs) or calculated using
habitat distribution spatial layers from Seamap Australia (https://seamapaustralia.org).

Distribution, fisheries interactions and assessment of threats to Australia’s sea snakes • April 2021 Page | 8
DISTRIBUTION OF SEA SNAKES WITHIN AUSTRALIAN WATERS

2.1.3 Modelling framework

 A correlative modelling approach was used to identify suitable habitats for each
species using maximum entropy modelling (MaxEnt [version 3.4.1]; Phillips et al.
2006). Sufficient occurrence data was available for 23 out of the 27 species to
produce suitability models. For these 23 species models, the default settings were
used for fitting models. Correlative modelling is subject to biases from ‘ad hoc’
sampling (e.g. some museum records or opportunistic sightings), and variable
detectability of target species during surveys (Yackulic et al. 2013). Sampling bias in
geographic space was addressed in two ways. First, occurrence records were
regularised through consolidation of multiple records within each grid cell of the
raster resolution used for model projection (30 arc second). Second, a `bias grid` (as
per Clements et al. 2012) was constructed, which was a Gaussian probability
distribution function based on all known records of each taxa from the region. This
bias grid was used for selecting pseudo-absence points from within the model space.

 The background used to generate pseudo-absences for all models was defined to
within the Australian EEZ. 10,000 pseudo-absence points were randomly selected at
the same spatial density as the bias grid for each species model. Model projections
were restricted to the same region as the training domain (background), to avoid the
dangers of extrapolating correlative models (Elith and Leathwick 2009) either outside
the univariate range of covariates (Type 1 novelty; Mesgaran et al. 2014) or into
novel covariate combinations (correlations) still within the univariate range of
covariates (Type 2 novelty). All data pre-processing and spatial modelling was
conducted in the R statistical environment (R Development Core Team 2019). Model
tuning was undertaken using the ‘ENMeval’ R package (Muscarella et al. 2014),
which undertakes a maximum likelihood process to estimate ideal hyperparameters
for models.

Distribution, fisheries interactions and assessment of threats to Australia’s sea snakes • April 2021 Page | 9
DISTRIBUTION OF SEA SNAKES WITHIN AUSTRALIAN WATERS

2.1.4 Model evaluation and influence of environmental covariates

 The area under the receiver operating curve (henceforth AUC; Fourcade et al.
2017), and a true skill statistic (TSS) were used to assess the ability of the model to
discriminate between presence and background points. An AUC score ranges
between 0 and 1, where a score of 0 represents a complete mismatch between the
model projection and actual occurrence data, while a score of 1 represents a perfect
alignment between the projection and occurrence data. The true skill statistic (TSS)
accounts for both model omission and commission errors, and ranges from -1 to +1,
where +1 indicates perfect agreement and values of zero or less indicate a
performance no better than random (Fourcade et al. 2017). AUC and TSS scores
across all species models were high (> 80) indicating all model projections matched
well with the occurrence records for species on which they were trained (Table 2).
Variable contributions were used to identify key environmental covariates that
influence species-specific habitat suitability. Bathymetry, distance to reef systems
and water temperatures contributed significantly to most species models overall
(Figure 2).

 A more detailed assessment of habitat suitability, distributions and effectiveness of
current Marine Protected Areas has been conducted for a subset of short-range
endemic species of high conservation priority within the North-west Shelf (Aipysurus
apraefrontalis, A. foliosquama, A. fuscus, A. pooleorum, A. tenuis), with follow up
field validation conducted as part of this project by Hub Researchers and
collaborators in Udyawer et al. (2020).

Distribution, fisheries interactions and assessment of threats to Australia’s sea snakes • April 2021 Page | 10
DISTRIBUTION OF SEA SNAKES WITHIN AUSTRALIAN WATERS

Table 2. Summary table of model evaluation scores including the area under the receiver operating
curve (AUC) and true skill statistic (TSS). AUC scores range between 0 and 1, where a score of 0
represents a complete mismatch between the model projection and actual occurrence data, while a
score of 1 represents a perfect alignment between the projection and occurrence data. The true skill
statistic (TSS) ranges from -1 to +1, where +1 indicates perfect agreement and values of zero or less
indicate a performance no better than random
 Common Name Species AUC TSS
 Short-nosed sea snake Aipysurus apraefrontalis 0.867 0.904
 Reef-shallows sea snake Aipysurus duboisii 0.978 0.855
 Leaf-scaled sea snake Aipysurus foliosquama 0.989 0.969
 Dusky sea snake Aipysurus fuscus 0.943 0.999
 Olive sea snake Aipysurus laevis 0.981 0.885
 Mosaic sea snake Aipysurus mosaicus 0.991 0.918
 Shark Bay sea snake Aipysurus pooleorum 0.999 0.977
 Brown-lined sea snake Aipysurus tenuis 0.934 0.959
 Turtle-headed sea snake Emydocephalus annulatus 0.993 0.914
 Dwarf sea snake Hydrophis caerulescens 0.999 0.988
 Slender-necked sea snake Hydrophis coggeri 0.981 0.881
 Spine-bellied sea snake Hydrophis curtus 0.993 0.941
 Geometric sea snake Hydrophis czeblukovi 0.996 0.995
 Elegant sea snake Hydrophis elegans 0.987 0.906
 Spectacled sea snake Hydrophis kingii 0.991 0.935
 Small-headed sea snake Hydrophis macdowelli 0.987 0.881
 Greater sea snake Hydrophis major 0.987 0.898
 Spotted sea snake Hydrophis ocellatus 0.982 0.879
 Large-headed sea snake Hydrophis pacificus 0.999 0.983
 Horned sea snake Hydrophis peronii 0.983 0.881
 Yellow-bellied sea snake Hydrophis platurus 0.979 0.843
 Stokes’ sea snake Hydrophis stokesii 0.986 0.896
 Beaked sea snake Hydrophis zweifeli 0.986 0.911

Distribution, fisheries interactions and assessment of threats to Australia’s sea snakes • April 2021 Page | 11
DISTRIBUTION OF SEA SNAKES WITHIN AUSTRALIAN WATERS

Figure 2. Summary of the relative variable contribution for each environmental variable used in optimal
MaxEnt model for each of the 23 species for which sufficient data was available. Variable contribution
was calculated for each tuned model. Variable on the y-axis are ranked in decreasing order based on
average overall variable importance across all species models.

Distribution, fisheries interactions and assessment of threats to Australia’s sea snakes • April 2021 Page | 12
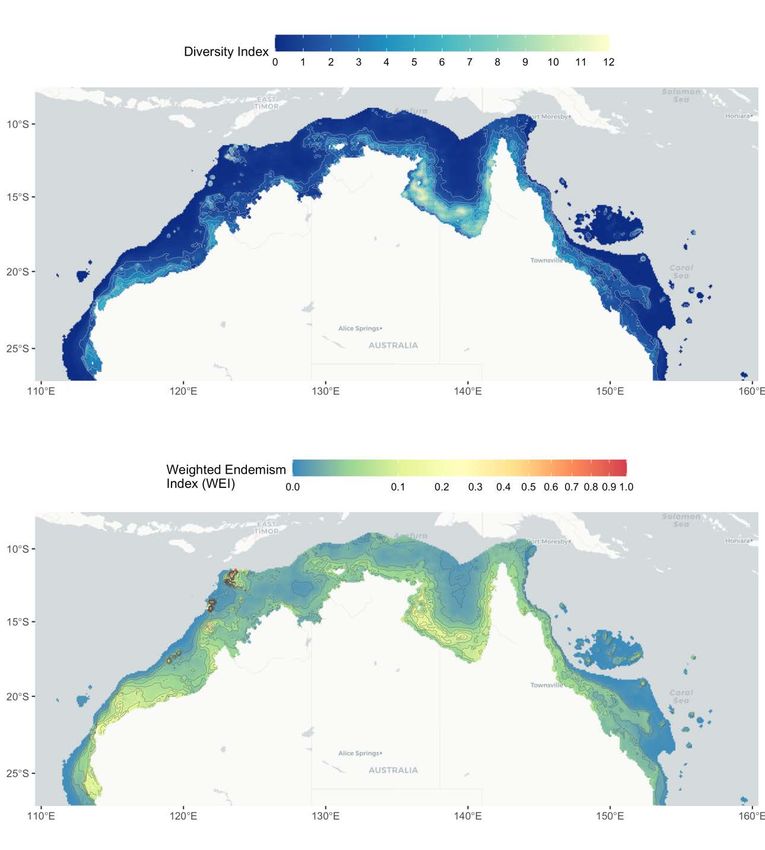
DISTRIBUTION OF SEA SNAKES WITHIN AUSTRALIAN WATERS

2.1.5 Identification of suitable habitats

 To quantify ‘suitable’ and ‘unsuitable’ habitats, thresholds are often applied to model
outputs to simplify continuous outputs into binary maps, which often aids in validating
and interpreting SDMs (Peterson et al. 2011). We defined the threshold level as the
lowest predicted value associated with any of the occurrence records, also known as
the ‘lowest presence threshold’ (LPT; Pearson et al. 2007). This threshold is
considered a conservative estimate of a species’ tolerance to each environmental
variable and can provide an ecological basis to habitat suitability (Peterson et al.
2011). We created binary maps to identify suitable habitat based on this threshold
value. A complete record of all species model outputs are provided as Appendix 1.

2.2 Identifying hotspots of sea snake biodiversity and endemism

 A spatially explicit species assemblage modelling framework was utilised to quantify
indices of species diversity (α-diversity) and endemism (Schmitt et al. 2017).
Individual species-specific continuous predictions were used to calculate an index of
species diversity using a probability stacked species distribution model (pSSDM).
This consisted of a simplified index of summing the continuous species-specific
habitat suitability model predictions across the Australian EEZ model space. Regions
with larger diversity indices indicated regions suitable to more sea snake species and
are likely to support a larger local diversity of species (Figure 3a). In addition to
species diversity, habitat suitability outputs were used to calculate an index of local
species endemism. The Weighted Endemism Index (WEI) was calculated for each
pixel (c) within the model space (30 arc-second resolution within the Australian EEZ),
by summing the inverse of the geographical range size (ri) for each species (n) using
the formula (Schmitt et al. 2017):

 1
 WEI = �
 ,
 =1

Distribution, fisheries interactions and assessment of threats to Australia’s sea snakes • April 2021 Page | 13
DISTRIBUTION OF SEA SNAKES WITHIN AUSTRALIAN WATERS

 a)

 b)

Figure 3. Spatially explicit species diversity (a) and endemism (b) maps for sea snake species across
Northern Australia, within the Australian EEZ and in regions shallower than 1000 m. Note the colour
scale in panel b is log scaled to highlight regions of high WEI within the North-west Shelf.

Distribution, fisheries interactions and assessment of threats to Australia’s sea snakes • April 2021 Page | 14
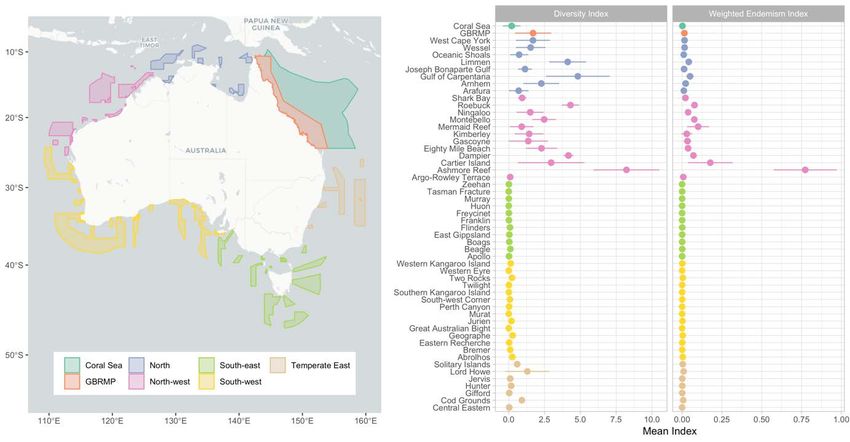
DISTRIBUTION OF SEA SNAKES WITHIN AUSTRALIAN WATERS

2.2.1 Diversity and Endemism of sea snakes within Marine Protected Areas

 Spatial outputs of sea snake species diversity and endemism were intersected with
two types of marine spatial planning units; i) Marine Protected areas; including
Australian Marine Parks (AMPs) managed by Parks Australia and the Great Barrier
Reef Marine Park (GBRMP) managed by the Great Barrier Reef Marine Park
Authority, as well as ii) currently declared Indigenous Protected Areas (IPAs)
managed by seven Indigenous Land Councils across Western Australia
(Nyangumarta Warram and Yawuru), Northern Territory (Dhimurru and Anindilyakwa)
and Queensland (Thuwathu/Bujimulla, Eastern Kuku Yalanji and Girringun). This
assessment identified regions under federal and regional/local management that
contained high diversity of sea snake species, or protected areas that have highly
endemic species (Figure 4).

Figure 4. Diversity and endemism index of sea snake species within Marine Protected Areas (left
panel) identified the North and North-west networks to have the highest diversity and endemism (right
panels). Points in the right panel represent mean index values within AMPs, with error bars
representing standard error of index values. Ashmore Reef Marine Park in the North-west network,
and Gulf of Carpentaria Marine Park in the North network had the highest levels of species diversity
and endemism.

Distribution, fisheries interactions and assessment of threats to Australia’s sea snakes • April 2021 Page | 15
DISTRIBUTION OF SEA SNAKES WITHIN AUSTRALIAN WATERS

 The North-west and North networks were Parks with the highest rates of sea snake
diversity and endemism. Ashmore Reef Marine Park was highlighted as the Park with
the highest diversity and endemism index as the assessment included occurrences
of sea snakes before the declines recorded at this location (Guinea 2013; Lukoschek
et al. 2013), with low sea snake sighting rates from recent surveys (i.e. CSIRO
Ashmore Reef Survey 2019; Somaweera et al. in review). Therefore, it is likely that
the level of endemism and diversity has drastically reduced at Ashmore Reef Marine
Park in light of recorded extirpation events of multiple species, and subsequent low
numbers of individuals sighted in recent surveys (Guinea 2013; Somaweera et al. in
review).

 The overlap between sea snake diversity and endemism maps with declared IPAs
highlighted that sea country within the Anindilyakwa IPA in the Northern Territory had
the highest levels of sea snake diversity and endemism, with Thuwathu/Bujimulla and
Dhimurru IPAs also displaying high levels of diversity within the Gulf of Carpentaria
(Figure 5). The Yawuru IPA within Roebuck Bay was also highlighted as a region
with high sea snake endemism in Western Australia. Hub Researchers worked with
the Anindilyakwa Land and Sea Rangers to conduct preliminary surveys within the
Anindilyakwa IPA to obtain additional information on sea snake assemblages within
the western Gulf of Carpentaria, and is discussed in section 3.3 of this report.

Figure 5. Diversity and endemism index of sea snake species with declared Indigenous Protected
Areas (left panel) identified that sea country within the Gulf of Carpentaria, and within Roebuck Bay
had high levels of sea snake diversity and endemism (right panels). Points in right panel represent
mean index values within IPAs, with error bars representing standard error of index values.

Distribution, fisheries interactions and assessment of threats to Australia’s sea snakes • April 2021 Page | 16
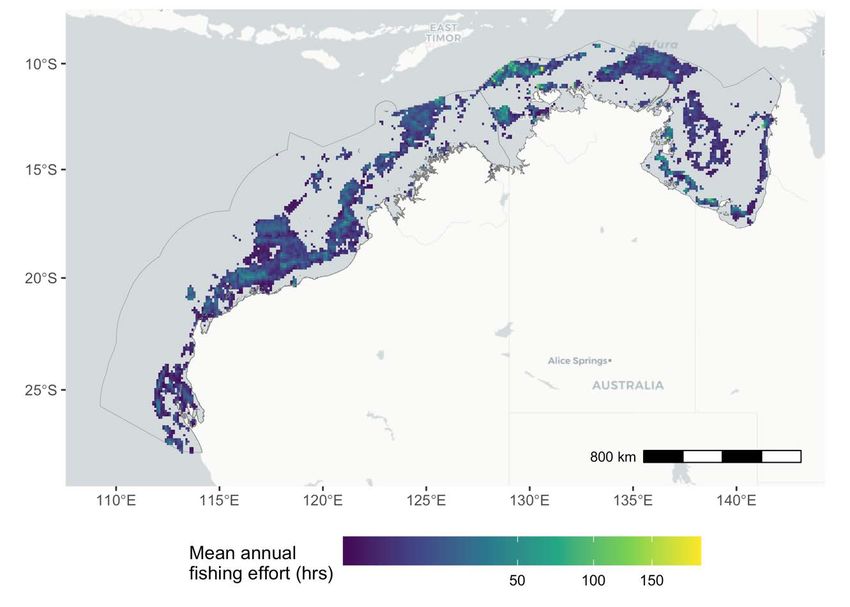
SEA SNAKE INTERACTIONS WITH FISHERIES IN NORTHERN AUSTRALIA

3. SEA SNAKE INTERACTIONS WITH FISHERIES IN
 NORTHERN AUSTRALIA
 Sea snakes are vulnerable to capture in trawl fisheries and represent a large
component of bycatch in the trawl sector across Australia (Wassenberg et al. 2001;
Zhou et al. 2012). Interactions with fishing activity remain a critical concern for sea
snake populations in Australian waters (Milton et al. 2009), however species-specific
assessments have been limited across the different trawl sectors across Northern
Australia. Hub Researchers compiled data from fisheries observer programs and
used modelled habitat suitability to conduct a high-level assessment of exposure to
fishing pressures across the North-west and North marine region.

3.1 Fishing effort information
 Spatial information on fishing effort was obtained from two sources; i) the Automatic
Identification System (AIS) data from vessels flagged as ‘fishing’ vessels within the
Australian EEZ stored by the Australian Maritime Safety Authority on the Craft
Tracking System
(https://www.operations.amsa.gov.au/Spatial/DataServices/DigitalData), and ii) the
Global Fishing Watch (https://globalfishingwatch.org). Where recorded, tracks from
vessels associated with trawl or squid-jiggers were retained for the spatial analysis
as these gear types have the highest interaction with sea snakes. Gear type
information was not available for AIS data from the AMSA Craft Tracking System,
therefore only tracks from known trawl fishing grounds were included (i.e. Gulf of
Carpentaria, Shark Bay, Exmouth Gulf). AIS data for fishing vessels prior to 2012,
and within Queensland waters was sparse, and likely represented an incomplete
dataset available from these open access databases, therefore this spatial analysis
was restricted to the North-west and Northern marine region between 2012 – 2016
where fishing effort data was most complete.

 Tracks were gridded to the same spatial resolution as the sea snake habitat
suitability spatial outputs. AIS data was used to estimate mean fishing hours for each
raster pixel based on the estimation method by Kroodsma et al. (2018). Briefly, yearly
AIS data was binned to the same grid resolution of the sea snake habitat models

Distribution, fisheries interactions and assessment of threats to Australia’s sea snakes • April 2021 Page | 17
SEA SNAKE INTERACTIONS WITH FISHERIES IN NORTHERN AUSTRALIA

(0.0083 degrees; 30 arc-seconds), with time associated to each AIS detection; i.e.
time between consecutive positions within each grid plus half the time to the next AIS
position if it fell in another grid. To obtain an overall effort raster, estimated fishing
time was summed across all tracks per year, and then averaged across the five
years for which reliable data was available (Figure 6).

Figure 6. Estimated mean annual fishing effort in hours between 2012 – 2016 within the North-west
and Northern marine region. Annual fishing effort was estimated using AIS data from the AMSA Craft
Tracking System and Global Fishing Watch datasets. Note colour bar on the bottom is log scaled to
highlight regions with high mean annual fishing effort.

Distribution, fisheries interactions and assessment of threats to Australia’s sea snakes • April 2021 Page | 18
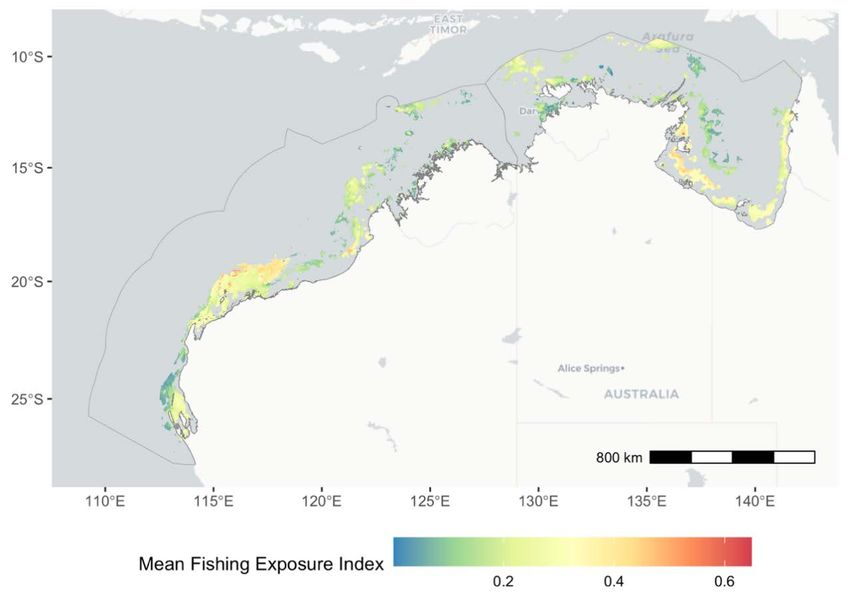
SEA SNAKE INTERACTIONS WITH FISHERIES IN NORTHERN AUSTRALIA

 A spatially explicit co-occurrence index (coined here as Fishing Exposure Index;
FEI) between fishing effort and habitat suitability was estimated to identify locations
where habitats suitable for sea snakes are likely exposed to fishing efforts. The FEI
was calculated for each species of sea snake using indices of co-occurrence
modified from Queiroz et al. (2019) within the North-western and Northern marine
region. Briefly, FEI was calculated for each pixel within the model space by adding
the number of hours of fishing effort within each raster pixel (normalised to between 0
and 1), with the modelled projection of habitat suitability (between 0 and 1) above the
lowest presence threshold (LPT) for each species, then dividing by 2. This produced
a FEI that ranged between 0 and 1 with indices of 1 indicating complete overlap of
highly suitable habitats to high levels of fishing effort, and 0 indicating no overlap at
all. FEI outputs were averaged across all species to produce an overall fishing
exposure map indicating regions with high overlap between fishing activity and
suitable habitats for sea snake species (Figure 7).

Figure 7. Mean Fishing Exposure Index across 23 species of sea snake highlighting regions with high
fishing exposure of sea snakes to trawl fishing effort within the Australian EEZ.

Distribution, fisheries interactions and assessment of threats to Australia’s sea snakes • April 2021 Page | 19
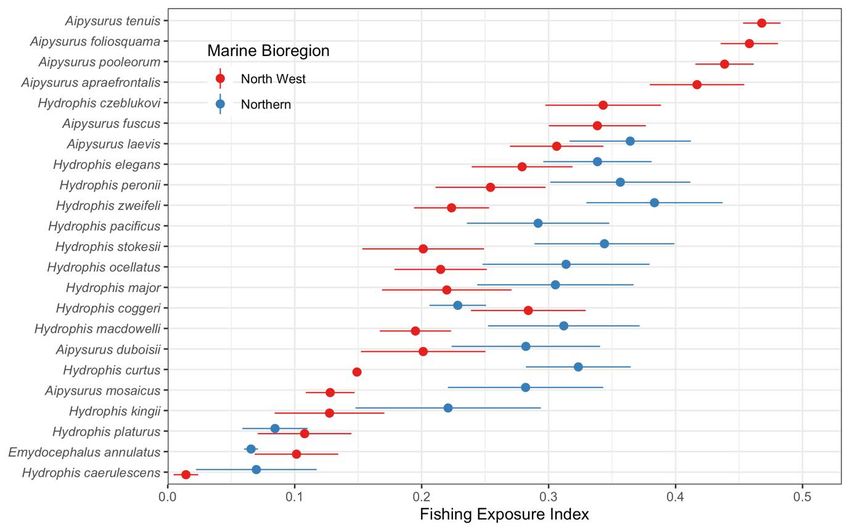
SEA SNAKE INTERACTIONS WITH FISHERIES IN NORTHERN AUSTRALIA

Figure 8. Mean and standard error of species-level fishing exposure index within the North-west and
North marine region, highlighting high exposure indices for species with restricted ranges that fall
entirely within highly productive trawl grounds within the Pilbara, Shark Bay and Exmouth Gulf regions.

 FEI outputs were also used to assess overlap of fishing activities to species-specific
suitable habitats within each of the marine regions (Figure 8). Regional and species-
level FEI indicated short-range species on the West coast that have highly suitable
habitats within known fishing grounds (i.e. A. tenuis, A. foliosquama, A. pooleorum)
were likely to have higher exposure to coastal trawl fishing. Within the Northern
marine region, species that had highly suitable habitats within the Gulf of Carpentaria
displayed high exposure to fishing efforts, and represented species that are known to
frequently occur as bycatch within the Northern Prawn Fishery (e.g. A. laevis, H.
elegans, H. stokesii, H. peronii; Milton 2001). FEI calculated here does not
incorporate measures of interaction rates and mortality with each fishing sector as
this data was not recorded or available at species levels across all fisheries.
Nevertheless, patterns in FEI calculated here broadly show similar patterns in
regional fisheries assessments (Milton 2001; Zhou et al. 2012).

Distribution, fisheries interactions and assessment of threats to Australia’s sea snakes • April 2021 Page | 20
SEA SNAKE INTERACTIONS WITH FISHERIES IN NORTHERN AUSTRALIA

3.2 Species assemblages and interactions rates with fisheries on
 the North West Shelf
 Sea snake interaction was used to conduct a preliminary assessment of species-
specific interaction rates within four coastal areas of Western Australia; Shark Bay,
Exmouth Gulf, Pilbara and the Kimberley (Figure 9). Data used in this assessment
were collected by the scientific observer program of the Western Australian
Department of Fisheries (WA DoF) in collaboration with Hub Researchers on the RV
Naturalist between 2014 and 2018. Surveys consisted of research trawls conducted
within trawl fishing grounds within Shark Bay (118 trawls between 20 – 60 min),
Exmouth Gulf (34 trawls between 15 – 150 min), Pilbara region between Onslow and
Broome (96 trawls between 10 – 120 min), and the Kimberley region north of Broome
(73 trawls between 20 – 60 min). Sea snakes captured in these surveys were
photographed and identified to species level and live snakes were released in
healthy condition. Data were used to assess the assemblage of snakes encountered
in these surveys and conduct a preliminary assessment on survival of sea snakes
that interact with trawl gear within these four broad coastal regions.

Figure 9. (a) Map of locations of trawl surveys conducted on the RV Naturaliste where sea snakes
were captured within the four broad regions. (b) Species-specific encounter rates and condition of sea
snakes within the four broad regions with total duration of trawls conducted (hrs) in parentheses in
graph titles.

Distribution, fisheries interactions and assessment of threats to Australia’s sea snakes • April 2021 Page | 21
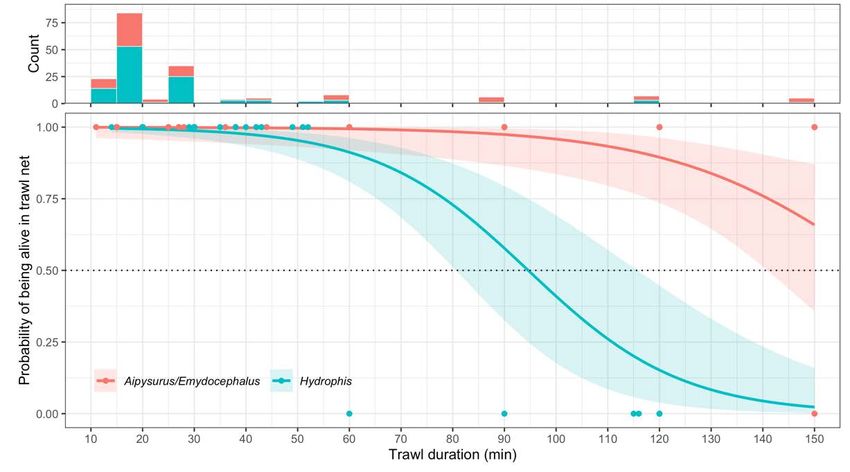
SEA SNAKE INTERACTIONS WITH FISHERIES IN NORTHERN AUSTRALIA

Figure 10. Survivorship curves for sea snakes encountered in trawl surveys broken down into the two
main lineages (Aipysurus/Emydocephalus and Hydrophis). Species and regional level analyses was
not possible due to limited regional and species-specific data. Histogram on the top highlights the
counts of snakes within the two main lineages encountered across the full range of trawl duration.

 Catch composition across all four regions highlighted that sea snakes are
encountered in relatively low numbers, with the highest encounter rates of sea
snakes within Shark Bay (Figure 9b). The two currently classified Critically
Endangered species (A. foliosquama and A. apraefrontalis) were encountered within
Shark Bay and Exmouth Gulf, respectively. Sea snake catch across all four regions
was low despite longer trawls (> 60 min trawl duration) conducted in Exmouth Gulf
and Pilbara regions. Relatively short trawls within Shark Bay (~20 min) yielded
relatively high numbers of sea snakes (Figure 9).

 Survivorship curves were constructed using a binomial logistic regression
examining whether trawl duration influenced whether sea snakes were alive or dead
upon landing on deck (Figure 10). Survivorship curves were constructed for both
lineages of sea snakes (Aipysurus/Emydocephalus and Hydrophis), however
sufficient data was not available to create species-specific or region-specific curves.
The logistic regression showed that sea snakes in general had high rates of pre-
release survival regardless of trawl duration, indicating that overall, snakes

Distribution, fisheries interactions and assessment of threats to Australia’s sea snakes • April 2021 Page | 22
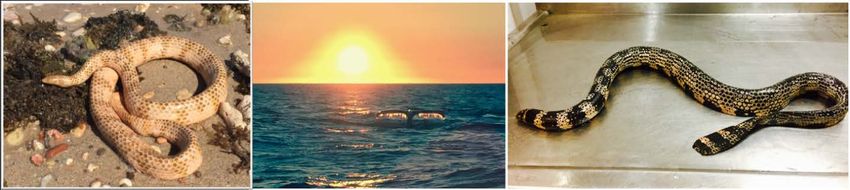
SEA SNAKE INTERACTIONS WITH FISHERIES IN NORTHERN AUSTRALIA

encountered in these surveys were robust to short – moderate durations of trawls.
Lineage-specific curves identified that the larger Hydrophis species (i.e. Hydrophis
elegans, H. major; Figure 9b) were likely to be encountered dead in trawl nets in
trawls longer than ~90 min (Figure 10), whereas Aipysurus/Emydocephalus species
were comparatively more robust across the full range of trawl durations. Similar
assessments within the Northern Prawn Fishery (Milton et al. 2008) and Queensland
Trawl Fishery (Pears et al. 2012) have identified larger-bodied species within the
Hydrophis genus (e.g. H. pacificus, H. elegans) to be highly susceptible to capture
and mortality in nets.

 Post-capture survival in sea snakes is variable among sea snake species and
fishing practices, with most species encountered in commercial trawl fisheries within
Australian waters displaying high short and long-term survival post capture (Milton et
al. 2008; Wassenberg et al. 2001). However, sea snakes with larger body size (e.g.
H. elegans, H. stokesii, A. laevis, and gravid females), and or less frequent
reproduction (e.g. A. laevis and H. elegans, reproducing every 2 to 3 years) are likely
to have higher susceptibility to capture and mortality in trawl and trap fisheries
(Courtney et al. 2010).

3.3 Assemblage of sea snakes within coastal protected areas
 within the Gulf of Carpentaria
 The Gulf of Carpentaria was identified as a region with high diversity of sea snakes
(Figure 3a), and a region with high exposure to fishing impacts (Figure 7). This region
is a highly productive trawl fishing ground, with high seasonal sea snake bycatch
rates within the Northern Prawn Fishery (NPF) (Fry et al. 2018). Coastal areas
protected from trawl activities can provide refugia to populations of sea snakes that
interact with trawl fisheries (Udyawer et al. 2016). This project collaborated with the
Anindilyakwa Land and Sea Rangers to collect preliminary survey data for sea
snakes using opportunistic boat-based field surveys, and recorded sea snakes
encountered during beach activities conducted by the Rangers (Figure 11). Diversity
and endemism models identified the sea country of the Anindilyakwa Indigenous

Distribution, fisheries interactions and assessment of threats to Australia’s sea snakes • April 2021 Page | 23
SEA SNAKE INTERACTIONS WITH FISHERIES IN NORTHERN AUSTRALIA

Protected Area (IPA), in coastal waters of Groote Eylandt, as an important region for
sea snakes (Figure 12).

Figure 11. Sea snakes recorded within the Anindilyakwa IPA by the Anindilyakwa Land and Sea
Rangers during beach activities and during on-water activities. (Photo Credit: Katie Oxenham, Jeff
Paul, Keith Lambert)

Figure 12. Distribution of records of sea snakes within the Anindilyakwa Indigenous Protected Area
(IPA; red boundary), with maps highlighting the high diversity (a) and relative weighted endemism (b)
of sea snakes in surrounding waters of the IPA. Black triangles represent coastal records of sea
snakes recorded by the Anindilyakwa Land and Sea Rangers during marine operations and from
sightings recorded by the Rangers and other Groote Eylandt residents on the Australian Sea Snakes
page (https://www.facebook.com/groups/australianseasnakes). Grey points represent records from the
Atlas of Living Australia and records from the NPF scientific observer program (Milton et al. 2008).

Distribution, fisheries interactions and assessment of threats to Australia’s sea snakes • April 2021 Page | 24
SEA SNAKE INTERACTIONS WITH FISHERIES IN NORTHERN AUSTRALIA

 Occurrence records around Groote Eylandt and elsewhere in the Anindilyakwa IPA
collected from the Anindilyakwa Land and Sea Rangers were compiled with other
sources where species ID were verified (i.e. Atlas of Living Australia, NT Maps,
community sighting records; https://www.facebook.com/groups/australianseasnakes)
to assess the assemblage of sea snakes encountered within the Anindilyakwa IPA
(Figure 13). The assemblage of sea snakes recorded within the IPA reflect commonly
encountered species in adjacent fishing grounds (Fry et al. 2018). Species commonly
encountered included Hydrophis elegans, H. major, H.stokesii, Aipysurus laevis, A.
mosaicus. The movement and residence of these species in shallow habitats within
the IPA may provide some protection from trawl interactions in the highly productive
fishing grounds within and adjacent to the Anindilyakwa IPA. Future work in this
region can utilise the baseline assemblage datasets and assess residency and
movement patterns of sea snakes between those found within the IPA and those that
interact with the NPF through a coordinated mark-recapture program, or through
animal tracking studies. Understanding how vulnerable sea snake species use
shallow habitats within the Gulf of Carpentaria, like IPAs and other marine protected
areas (e.g. Marine Parks, AMPs) that have restricted trawl fishing activity, can help
assess the impacts of the large bycatch rates of sea snakes on populations within the
Gulf of Carpentaria (Udyawer et al. 2016). The data collected within this region
highlight the importance of strong protections and limitations on fishing efforts within
IPAs, that allow vulnerable species like sea snakes to recover from high interactions
in adjacent trawl fishing grounds.

Figure 13. Assemblage of sea snakes recorded within and adjacent to the Anindilyakwa IPA.

Distribution, fisheries interactions and assessment of threats to Australia’s sea snakes • April 2021 Page | 25
CONCLUSIONS AND RECOMMENDATIONS

4. CONCLUSIONS AND RECOMMENDATIONS

 At an EEZ level the habitat suitability modelling highlighted baseline hotspots of
species diversity and endemism within the North-west Shelf and western Gulf of
Carpentaria. Local extirpation events and localised declines of sea snake populations
in key locations along the North-west Shelf (i.e. Ashmore Reef Marine Park;
Lukoschek et al. 2013) has highlighted the need for re-assessment of endemic
species found in this region. The assessment of fishing exposure indicated regions
within the western Gulf of Carpentaria, and areas along the Pilbara coastline that
displayed significant co-occurrence of suitable habitat with high trawl fisheries effort.
Trawl survey information from four regions across the Western Australian coastline
highlighted that although sea snakes were captured in relatively short trawls within
key fishing grounds like Shark Bay and Exmouth Gulf, they displayed a high survival
rate in trawl nets. Larger-bodied species in the Hydrophis lineage (e.g. H. elegans, H.
major) are likely to be more susceptible to mortality within trawl nets, however further
research on post-release mortality, and re-capture rates within confined fishing
grounds (e.g. Shark Bay, Exmouth Gulf) is required to assess population level, and
long-term impacts of high bycatch rates. Although not tested in the present study,
there is likely a significant influence of trawl gear type used, and application of
bycatch reduction devices, to the catchability of sea snakes within these regional
fisheries (Chandrapavan et al. 2012; Milton et al. 2009). Assessment of trawl bycatch
indicate fewer snakes reported in the Pilbara fish trawl fishery and Shark Bay scallop
fishery relative to the prawn trawls, which are likely due to differences in the gear
selectivity/mesh size used within the different fisheries sectors (Evans and Molony
2010; Wassenberg et al. 2001).

 The following section provides a summary of key recommendations to assist in
updating conservation status of species currently listed as Critically Endangered
under the EPBC Act (i.e. Aipysurus apraefrontalis, A. foliosquama), and species
identified as conservation priority (i.e. A. fuscus). These recommendations are made
based on the information on distribution, exposure to fishing pressures, and fisheries
interactions generated in this project.

Distribution, fisheries interactions and assessment of threats to Australia’s sea snakes • April 2021 Page | 26
You can also read