Accepted to: Transportation Research Part C: Emerging Technologies in 2021
←
→
Page content transcription
If your browser does not render page correctly, please read the page content below
1

 How internal and external risks affect the relationships between trust and
                driver behavior in automated driving systems

                                Hebert Azevedo Sá
                                   Huajing Zhao
                                Connor Esterwood
                                  Xi Jessie Yang
                                  Dawn Tilbury
                                   Lionel Robert
                               University of Michigan

Accepted to: Transportation Research Part C: Emerging Technologies in 2021

       DISTRIBUTION A. Approved for public release; distribution unlimited.
                             OPSEC # 3555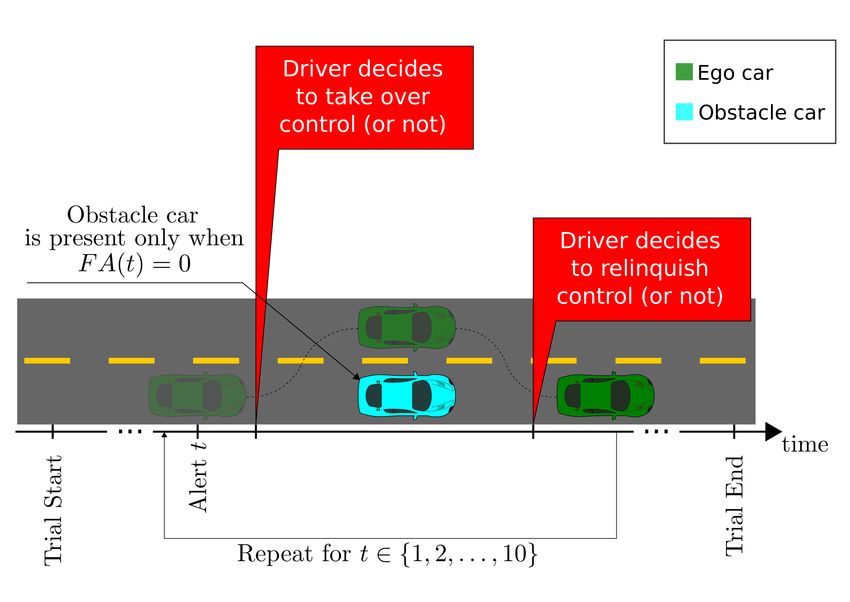
TYPE OF RISK AFFECTS RELATIONSHIPS BETWEEN TRUST AND BEHAVIOR
                                                            2

                                         Abstract

Automated driving systems (ADSs) allow vehicles to engage in self-driving under
specific conditions. Along with the potential safety benefits, the increase in productivity
through non-driving-related tasks (NDRTs) is often cited as a motivation behind the
adoption of ADSs. Although advances have been made in understanding both the
promotion of ADS trust and its impact on NDRT performance, the influence of risk
remains largely understudied. To fill this gap, we conducted a within-subjects
experiment with 37 licensed drivers using a simulator. Internal risk was manipulated by
ADS reliability and external risk by visibility, producing a 2 (ADS reliability) × 2
(visibility) design. The results indicate that high reliability increases ADS trust and
further enhances the positive impact of ADS trust on NDRT performance, while low
visibility reduces the negative impact of ADS trust on driver monitoring. Results also
suggest that trust increases over time if the system is reliable and that visibility did not
have a significant impact on ADS trust. These findings are important for the design of
intelligent ADSs that can respond to drivers’ trusting behaviors.
     Keywords: Trust, Semi-automated Driving, Human-Automation Interaction,
Human-Automation Teaming, Risk.

        DISTRIBUTION A. Approved for public release; distribution unlimited.
                              OPSEC # 3555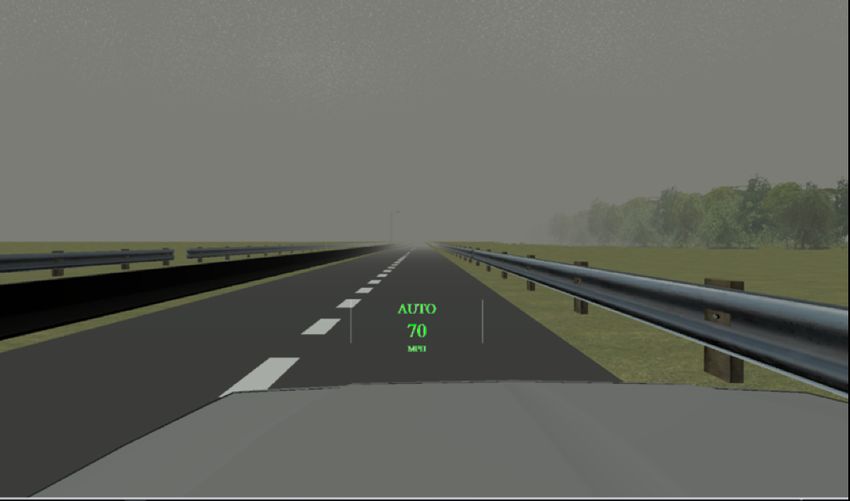
TYPE OF RISK AFFECTS RELATIONSHIPS BETWEEN TRUST AND BEHAVIOR
                                                            3

 How internal and external risks affect the relationships between trust and
                  driver behavior in automated driving systems

                                   1   Introduction

     Automated diving systems (ADSs) are automotive driving technologies that allow
vehicles to engage in self-driving under specific conditions (Maurer, Gerdes, Lenz, &
Winner, 2016). An important benefit of such a system is the potential for drivers to
engage in non-driving-related tasks (NDRTs), such as work activities like checking email
(Diels & Bos, 2015, 2016; Fagnant & Kockelman, 2015; Merat, Jamson, Lai, & Carsten,
2012). Along with the potential safety benefits, the increase in productivity through
NDRTs is often cited as a motivation behind the adoption of ADSs (Gkartzonikas &
Gkritza, 2019; Panagiotopoulos & Dimitrakopoulos, 2018; Petersen, Zhao, Tilbury,
Yang, & Robert, 2018).

     Trust in the ADS — willingness to be vulnerable to the actions of the ADS — is
essential if the driver is to leverage his or her opportunity to accomplish any given
NDRT (Petersen, Robert, Yang, & Tilbury, 2019). Drivers must trust the ADS to feel
comfortable disengaging from the driving and focusing on the NDRT. Drivers who do
not trust the ADS are less likely to either hand over the driving to the ADS or fully
disengage from the driving and shift their attention to the NDRT. Either case would
limit the driver’s ability to perform well on the NDRT. Therefore, it comes as no
surprise that there has been extensive research on promoting drivers’ trust in ADSs (see
for instance Argall and Murphey (2014); Basu and Singhal (2016); Miller and Ju
(2015)).

     Advances have been made in understanding both the promotion of ADS trust and
its impact on NDRT performance, but the influence of risk remains largely
understudied. Risk is defined as the degree of uncertainty associated with a given
outcome (Robert, Denis, & Hung, 2009). Risk is an important factor in trust-related
phenomena because it has been found to determine whether trust translates into actual
trusting behaviors (Cohen, 2015; Hung, Dennis, & Robert, 2004; Mayer, Davis, &
Schoorman, 1995). It is surprising that more research has not been directed at the role

        DISTRIBUTION A. Approved for public release; distribution unlimited.
                              OPSEC # 3555
TYPE OF RISK AFFECTS RELATIONSHIPS BETWEEN TRUST AND BEHAVIOR
4
of risk in ADS trust development. This is also especially problematic as researchers
readily admit that the use of ADSs is often accompanied by some level of risk (Lefèvre,
Vasquez, & Laugier, 2014; Rhodes & Pivik, 2011; Sheehan, Murphy, Ryan, Mullins, &
Liu, 2017).
To address the above questions on the topic of risk on ADS trust, our study has
two goals. One, to examine the impact of two types of risk on ADS monitoring and
ADS trust. Two, to examine whether either type of risk — namely, internal and
external risk — weakens the impact of ADS trust on trusting behaviors such as
monitoring and ultimately on NDRT performance. In this paper, we classify risk by the
source of the uncertainty. Internal risks are associated with the ADS itself and were
manipulated by varying the ADS’s reliability. External risks are not associated with the
ADS itself but involve the driving situation. External risks were manipulated by the
degree of visibility through foggy weather. The specific types of internal and external
risks were chosen based on prior literature and practical relevance (Yan, Li, Liu, &
Zhao, 2014). To this end, we conducted a 2 (ADS reliability) × 2 (visibility)
within-subjects experiment with 37 licensed drivers on an ADS simulator with three
outcome measures: ADS trust, driver monitoring and NDRT performance. Our research
framework illustrating our hypotheses is shown in Figure 1.
Results of our study showed that internal risk (low reliability ADS) reduces ADS
trust but external risk (low visibility) does not. In addition, internal risk moderated the
positive impact that ADS trust had on NDRT performance. The positive impact of
trust on NDRT performance was more prominent when the ADS was reliable (low
internal risk). Moreover, we found that external risk moderated the impact of ADS
trust on driver monitoring. ADS trust decreased monitoring when visibility was high
(low risk) but not when visibility was low (high risk).
Taken as a whole, this study contributes to the literature on ADS trust in several
ways. First, we identified and examined the role of risk in understanding the impacts of
ADS trust. Second, we highlight that the specific type of risk matters. Therefore, future
studies should be careful to articulate the particular type of risk they are examining.
DISTRIBUTION A. Approved for public release; distribution unlimited.
OPSEC # 3555TYPE OF RISK AFFECTS RELATIONSHIPS BETWEEN TRUST AND BEHAVIOR
5
Third, we demonstrate the unique effects associated with driver monitoring and NDRT
performance. Finally, we contribute to the growing literature on the need for ADS
controls to be able to identify risky situations and make decisions independently based
on that information (McAllister et al., 2017).
2 Background
2.1 ADS Trust and Trusting Behaviors
Trust has been conceptualized and utilized across different domains of research.
Examples include user interface design for automotive applications (Miglani, Diels, &
Terken, 2016; Noah, Wintersberger, Mirnig, & McCall, 2017); human factors and
ergonomics (J. D. Lee & See, 2004; Muir & Moray, 1996; Sanders, Kaplan, Koch,
Schwartz, & Hancock, 2019); and human–robot interaction (Chen, Nikolaidis, Soh, Hsu,
& Srinivasa, 2018; Freedy, DeVisser, Weltman, & Coeyman, 2007). In this paper, we
define ADS trust as the willingness of the driver to be vulnerable to the actions of the
ADS. More specifically, ADS actions represent the system’s ability to drive the vehicle
and to alert the driver about hazards that require the driver to take control. This
“willingness to be vulnerable” is based on the drivers’ attitude that the ADS in question
will help them achieve their goals (J. D. Lee & See, 2004; Petersen et al., 2019). Trust is
history dependent and contingent upon drivers’ prior knowledge about the capabilities
and limitations of the ADS (Khastgir, Birrell, Dhadyalla, & Jennings, 2018). Reliance,
however, occurs when drivers willingly cede control to the ADS (Lefèvre et al., 2014).
ADS trust is vital for understanding when drivers will or will not rely on the ADS. A
study by J. Lee et al. (2016) investigated ADS trust and reliance with six participants
riding in a real-world self-driving vehicle. They found that participants failed to fully
trust the ADS even after 6 days of riding. In this regard, the ceding of control as well as
the degree of disengagement from the driving can both be considered as trusting
behaviors (Du et al., 2019; Verberne, Ham, & Midden, 2012; Wickens, Clegg, Vieane, &
Sebok, 2015).
Too much ADS trust is also a situation to be avoided. Over-trust occurs when the
DISTRIBUTION A. Approved for public release; distribution unlimited.
OPSEC # 3555TYPE OF RISK AFFECTS RELATIONSHIPS BETWEEN TRUST AND BEHAVIOR
6
driver’s ADS trust exceeds the ADS’s capabilities. Trust is important because it
influences drivers’ behaviors directly, affecting their propensity to monitor the system
and their ability to execute an NDRT (Körber, Baseler, & Bengler, 2018). Over-trust
leads to a higher chance that automation errors will go unnoticed and result in more
accidents (Mirnig, Wintersberger, Sutter, & Ziegler, 2016; Parasuraman & Riley, 1997).
To avoid this, drivers need to calibrate their ADS trust, aligning it with the system’s
capability (Khastgir et al., 2018; Okamura & Yamada, 2018).
2.2 ADS Trust and Non-Driving-Related Tasks (NDRTs)
ADSs allow drivers to safely disengage from driving and engage in NDRTs. In the
absence of ADSs, NDRTs are viewed as distractions that can lead to accidents
(Domeyer et al., 2016). However, the ability to engage in NDRTs by allowing the ADS
to drive is increasingly viewed as a benefit (Petersen et al., 2019, 2018; Smith, Streeter,
Burnett, & Gabbard, 2015). As a result, researchers have been exploring the factors
that promote better NDRT performance (Kujala, 2009; Petersen et al., 2019). One such
study, by Kujala (2009), focused on selecting the most effective vehicle interface to
support NDRTs.
Several studies have found that ADS trust increases NDRT performance (Körber
et al., 2018; Petersen et al., 2018; Stockert, Richardson, & Lienkamp, 2015). The logic
is simple: the more drivers trust the ADS, the more they focus on the NDRT; in turn,
the better they perform on the NDRT (Petersen et al., 2019). Petersen et al. (2019)
found that when drivers were provided with contextual information, increasing their
situational awareness, ADS trust had a strong positive impact on NDRT performance.
In another example, Helldin, Falkman, Riveiro, and Davidsson (2013) investigated the
impact of uncertainty on trust and takeover speed. They found that drivers who were
provided with a better understanding of the automation’s abilities performed better on
NDRTs. Similarly, Körber et al. (2018) found that participants with higher trust in
automation spent more time on their NDRT and less time looking at the road — also
confirming the trusting behaviors previously described. In summary, the literature has
DISTRIBUTION A. Approved for public release; distribution unlimited.
OPSEC # 3555TYPE OF RISK AFFECTS RELATIONSHIPS BETWEEN TRUST AND BEHAVIOR
7
demonstrated a strong and positive impact of ADS trust on NDRT performance.
2.3 ADS Trust and Risk
Scholars seem to agree that risk is fundamental to understanding trust but most
have focused on the direct relationship between risk and trust. Zhang et al. (2019) found
a significant negative correlation between risk and trust. Notably, this relationship was
found to have been significant only for safety risk and not for privacy risk. They defined
safety risk as the possibility of accidents and physical harm from a system malfunction,
while privacy risk originated from the possibility that travel or behavioral data could be
transmitted to other parties, such as the government, vehicle developers, and insurance
companies without notice, or even be used against the users or be hacked by others. A
study conducted by Verberne et al. (2012) found that ADS trust also increased when
risk was reduced. Yet, other works have focused on understanding when risk reduced
ADS trust (Gremillion, Metcalfe, Paul, & Atwater, 2016; Lefèvre et al., 2014). For
example, Gremillion et al. (2016) found that when the ADS performed poorly, drivers’
trust decreased and they relied less on the automation. Conversely, when the ADS
performed well, drivers’ trust increased and drivers relied more on the ADS.
However, Mayer et al. (1995) also highlighted the potential moderating role of risk
between trust and trusting behaviors in their interpersonal trust model. According to
them, the perceived risk associated with a given outcome determined whether trust led
an individual to engage in trusting behaviors. In their trust model, the impact of trust
on trusting behaviors was stronger when more risk was associated with an outcome.
This was empirically verified in the context of virtual teams by Robert et al. (2009).
They verified that higher risk involved in a given situation led to a stronger correlation
between trust and trusting behavior. In the context of ADS, Liu, Yang, and Xu (2019)
examined the relationship between risk and ADS trust. Similar to other studies, they
found that perceived risk had a negative relationship with trust. But, unlike other
studies, they called attention to the complexity of the interactions between risk and
trust. More specifically, they called for more research to better understand and model
DISTRIBUTION A. Approved for public release; distribution unlimited.
OPSEC # 3555TYPE OF RISK AFFECTS RELATIONSHIPS BETWEEN TRUST AND BEHAVIOR
8
how risk and ADS trust interact with each other. This paper aims to answer that call.
Although the research summarized here is valuable, as pointed out in Liu et al.
(2019) more is needed. In this paper we seek to add to the literature by examining
whether risk undermines the impact of ADS trust. The literature on trust suggests that
risk is vital to understanding the impact of trust. Without a better understanding of
risk in the context of ADS trust, researchers and designers lack insight into an
important mechanism needed to design ADSs. In the next section, we focus on the
relationships between two types of risk on three important outcomes.
3 Present Study
We derived several hypotheses based primarily on the relationship between risk
and trust. These hypotheses were developed in the context of an ADS and a driver
performing an NDRT. The ADS is designed to support NDRTs by providing the driver
with semi-autonomous driving capability and recommendations based on the current
driving situation. We consider our system to be a Level 3 ADS, in accordance with the
classification defined in the SAE J3016 standard (SAE, 2016), because: (i) the
simulated vehicle can drive conditionally under specific situations, (ii) the driver is a
fallback-ready user of the vehicle, receptive to ADS-issued requests to intervene, and
able to take control and drive when necessary, and (iii) the system can issue a request
for the driver to intervene. The ADS’s recommendations are designed to help the driver
know when s/he has to disengage from the NDRT and take over the driving from the
ADS. Drivers also have the option to monitor the driving situation themselves and
determine when they should take over the driving independent of the ADS’s
recommendations. Next, we hypothesize about the implications associated with: (i)
reducing the ADS’s reliability by having it provide incorrect recommendations and (ii)
reducing the visibility in the driving situation by providing foggy weather.
3.1 Risk and ADS Trust
Based on prior ADS literature (Gremillion et al., 2016; Liu et al., 2019; Verberne
et al., 2012; Zhang et al., 2019), we hypothesized that increases in either internal or
DISTRIBUTION A. Approved for public release; distribution unlimited.
OPSEC # 3555TYPE OF RISK AFFECTS RELATIONSHIPS BETWEEN TRUST AND BEHAVIOR
9
external risk (i.e., reduced reliability or visibility) should reduce ADS trust for several
reasons. For internal risk, the reduced reliability should inherently decrease the level of
trust someone has in the ADS. A less reliable ADS is a less capable ADS. In our case,
less reliable means an ADS that provides incorrect recommendations on when the driver
should take over the driving. Drivers who receive incorrect recommendations would be
likely to view the ADS as less capable. This would reduce their confidence in the
system’s ability, hence reducing ADS trust. For external risk, reduced visibility
increases the difficulty of the driving situation. In our case, we used foggy weather to
reduce visibility, which might cast doubt on the ADS’s ability to make correct
recommendations on when the driver should take over. As visibility decreases, drivers
should be less likely to believe that the ADS can assess the situation and make correct
recommendations. Taken together, increases in both internal and external risks in the
form of a less reliable ADS and less visibility should decrease the driver’s trust in the
ADS.
Hypothesis 1: Low ADS reliability reduces ADS trust.
Hypothesis 2: Low visibility reduces ADS trust.
3.2 Risk, ADS Trust and NDRT Performance
Internal risk should moderate the impact of ADS trust on NDRT performance.
Based on prior literature, when internal risk is low we should expect increases in ADS
trust to lead to better NDRT performance (Körber et al., 2018; Petersen et al., 2018;
Stockert et al., 2015). The more the drivers trust the ADS the more they can engage in
the NDRT and disengage from driving. A reliable ADS provides the driver with correct
recommendations, helping the driver to make good decisions. This explains the positive
link between ADS trust and NDRT performance (Petersen et al., 2018). However, when
internal risk is high, we should expect increases in ADS trust to have little impact on
NDRT performance. Trusting an unreliable ADS can actually have negative
consequences for the driver. An unreliable ADS provides incorrect recommendations,
causing the driver to make poor decisions. As such, increases in ADS trust should be
DISTRIBUTION A. Approved for public release; distribution unlimited.
OPSEC # 3555TYPE OF RISK AFFECTS RELATIONSHIPS BETWEEN TRUST AND BEHAVIOR
10
less likely to directly translate to better NDRT performance.
Hypothesis 3: ADS reliability moderates the impact of ADS trust on
NDRT performance in the following ways:
• When ADS reliability is high, ADS trust increases NDRT performance.
• When ADS reliability is low, ADS trust has little or no impact on NDRT
performance.
External risk should also moderate the impact of ADS trust on NDRT
performance. Low visibility should reduce the impact of ADS trust on NDRT
performance. When visibility is low, drivers are likely to engage in monitoring
irrespective of their trust in the ADS. Drivers attempt to double-check the driving
situation even with the information provided by the ADS. Overall, this choice is likely
to weaken the potential impact of ADS trust on NDRT performance. However, when
visibility is high, drivers are more likely to rely on the ADS to sense the environment
and drive safely. Therefore, when there is no external risk, higher ADS trust should
translate into better NDRT performance. When external risk becomes evident for the
drivers, they do not achieve their best NDRT performance, even when they reportedly
trust the ADS. In all, trusting an ADS when visibility is high is likely to have positive
consequences for the driver, and less so when visibility is low.
Hypothesis 4: Low visibility due to foggy weather moderates the
impact of ADS trust on NDRT performance in the following ways:
• When visibility is high, ADS trust increases NDRT performance.
• When visibility is low, ADS trust has little or no impact on NDRT
performance.
3.3 Risk, ADS Trust and Monitoring
Internal risk should moderate the impact of ADS trust on monitoring. Based on
prior literature, when internal risk is low we should expect increases in ADS trust to
DISTRIBUTION A. Approved for public release; distribution unlimited.
OPSEC # 3555TYPE OF RISK AFFECTS RELATIONSHIPS BETWEEN TRUST AND BEHAVIOR
11
decrease the driver’s monitoring of the driving situation (Hergeth, Lorenz, Vilimek, &
Krems, 2016; Hung et al., 2004; Körber et al., 2018; Mayer et al., 1995). The more
drivers trust the ADS, the more likely they will be to focus on the NDRT and refrain
from monitoring the driving themselves. However, when the ADS is unreliable, drivers
are likely to engage in monitoring irrespective of their level of trust in the ADS. When
this occurs, ADS trust should not reduce the degree of monitoring. Thus, increases in
ADS trust should reduce monitoring when internal risk is low but not when internal
risk is high.
Hypothesis 5: ADS reliability moderates the impact of ADS trust on
monitoring in the following ways:
• When ADS reliability is high, ADS trust decreases monitoring.
• When ADS reliability is low, ADS trust has little or no impact on monitoring.
External risk should also moderate the impact of ADS trust on monitoring.
During driving conditions of high visibility, ADS trust should reduce monitoring. When
visibility is high, drivers are more likely to trust and rely on the ADS than to engage in
their own monitoring of the driving situation. This explains the negative impact of ADS
trust on monitoring. However, similarly to H4, when visibility is low, drivers are more
likely to monitor irrespective of their ADS trust. As stated previously, drivers will
double-check the driving situation over and above the information provided to them by
the ADS. Although this might not be a wise decision relative to NDRT performance,
drivers are likely to monitor the driving situation regardless of their reported trust in
the ADS. Therefore, trust in the ADS would not decrease monitoring. In sum, trusting
an ADS should be likely to reduce monitoring when visibility is high but not when
visibility is low.
Hypothesis 6: Low visibility due to foggy weather moderates the
impact of ADS trust on monitoring in the following ways:
• When visibility is high, ADS trust decreases monitoring.
DISTRIBUTION A. Approved for public release; distribution unlimited.
OPSEC # 3555TYPE OF RISK AFFECTS RELATIONSHIPS BETWEEN TRUST AND BEHAVIOR
12
• When visibility is low, ADS trust has little or no impact on monitoring.
Figure 1 presents our research framework, indicating the impacts of one factor on
the other and representing pictorially the hypotheses with the labels H1, H2, H3, H4,
H5 and H6.
Internal Risk: External Risk:
ADS Low
Reliability Visibility
H1 & H2 H3 & H4 H5 & H6
ADS
Monitoring
ADS Trust
NDRT
Performance
Figure 1 . Research framework considered in this study. We hypothesized that risks
reduce drivers’ trust in the ADS. Moreover, ADS trust elicits trusting behaviors
and promotes better NDRT performance. However, this relationship should be
influenced by the risks involved in the context. ADS = automated driving system;
NDRT = non-driving-related task.
4 Methodology
4.1 Participants
We recruited a total of 37 licensed drivers from the [hidden for blind review] area
to participate in the experiment. Participants were recruited via email advertising and
printed posters. They were then directed to a website for eligibility screening. This
screening required all participants to:
DISTRIBUTION A. Approved for public release; distribution unlimited.
OPSEC # 3555TYPE OF RISK AFFECTS RELATIONSHIPS BETWEEN TRUST AND BEHAVIOR
13
• be older than age 18,
• be a licensed driver,
• not be colorblind,
• have normal or corrected-to-normal vision (with contact lenses only — eye glasses
were not allowed because they would interfere with the eye-tracker),
• have normal or corrected-to-normal auditory acuity,
• have no history of disorders or injuries that could affect their ability to use the
simulator,
• not be military or civilian Department of Defense employees, and
• not have participated in the study before.
Participants’ average age was 22.5 years (standard deviation [SD]=3.6 years),
including 11 women, 25 men, and 1 participant who chose not to specify gender.
4.2 Experimental Tasks
4.2.1 Driving task. The primary task for the participants was to drive the
simulated vehicle on the road with help from the ADS, while avoiding any collisions.
The ADS provided the following features to the driver: automatic lane-keeping, cruise
control, forward collision alarm, and emergency braking. However, the vehicle was not
able to switch lanes by itself. Participants could switch between AUTO mode (i.e.,
when the ADS was in charge of driving) and MANUAL mode (i.e., the participant was
in charge of driving) at any point if they desired. The forward collision alarm was the
only feature that did not work correctly in the unreliable ADS condition. The
participants had to take active control to switch lanes and avoid hitting obstacle
vehicles along the road. Figure 2 provides an example of the driving environment.
Occasionally, the simulated vehicle alerted the participant that an upcoming
parked vehicle was standing on the lane ahead. The alert system issued audible alarms.
DISTRIBUTION A. Approved for public release; distribution unlimited.
OPSEC # 3555TYPE OF RISK AFFECTS RELATIONSHIPS BETWEEN TRUST AND BEHAVIOR
14
Figure 2 . Driving task: to drive a vehicle on a highway and avoid the obstacles, with
lane-keeping and alert assistance from the automated driving system.
Alarms sounded two verbal messages: “stopped vehicle ahead,”, displayed
approximately 6.5 s before reaching a stopped vehicle, followed by “take control now,”
which sounded 5 s before reaching the obstacle. In those situations, if the participants
did not take control in time, the emergency brake was triggered and prevented the
collision. Participants received 10 alerts, representing 10 events per trial. In the
unreliable ADS condition, these alerts were false alarms in three of the 10 events.
Figure 3 presents a typical order of events in a trial.
4.2.2 Non-driving-related task (NDRT). The NDRT consisted of a
modified version of the Psychology Experiment Building Language (PEBL) visual
search task (Treisman, 1985). PEBL is a standard tool used by psychologists and social
scientists to design and run behavioral tests (Mueller & Piper, 2014). In this task,
participants used a touchscreen to repeatedly locate and select a target character (i.e., a
“Q”) that were placed among distractor characters (i.e., “O”s). Each time the
participants correctly located and selected the target, they earned 1 point. Figure 4
provides a screenshot of the NDRT. As shown in Figure 5, the NDRT screen was
positioned in a way to force the driver to choose between engaging in the NRDT or
monitoring the driving but not both. Additionally, each time the emergency stop was
DISTRIBUTION A. Approved for public release; distribution unlimited.
OPSEC # 3555TYPE OF RISK AFFECTS RELATIONSHIPS BETWEEN TRUST AND BEHAVIOR
15
... ...
Figure 3 . Timeline for one trial. Participants experienced all four trial conditions. Each
trial had 10 alerts that could be true or false alarms. When the alert t was true,
FA(t) = 0. When it was a false alarm, FA(t) = 1. Drivers were free to take over control
at any time.
triggered to prevent a collision, drivers were penalized. The performance of the
participants, represented by their final scores in the NDRT minus any penalties, was
recorded for compensation purposes and to decide who was eligible to receive a
monetary bonus. Participants received $15 and a cash bonus based on their
performance. We promised a $5 bonus to the best performers under each risk condition,
which encouraged participants to perform well in all four trials. Therefore, the NDRT
functioned as a means of motivating participants to rely on the ADS. By doing so,
participants were able to focus more on the NDRT and possibly receive the cash bonus.
In addition, the loss of points from an emergency stop (and the consequent costs of
losing cash bonuses) gave the participants a concrete sense of risk.
DISTRIBUTION A. Approved for public release; distribution unlimited.
OPSEC # 3555TYPE OF RISK AFFECTS RELATIONSHIPS BETWEEN TRUST AND BEHAVIOR
16
Figure 4 . Non-driving-related task (NDRT): Visual search task where the participant
had to find and point to the target “Q” among the “O”s. Each time participants
correctly selected the target, they earned 1 point on their NDRT score. A penalty of 25
points was deducted from the NDRT score for each time the emergency stop was
triggered. The actual task did not show the red arrow.
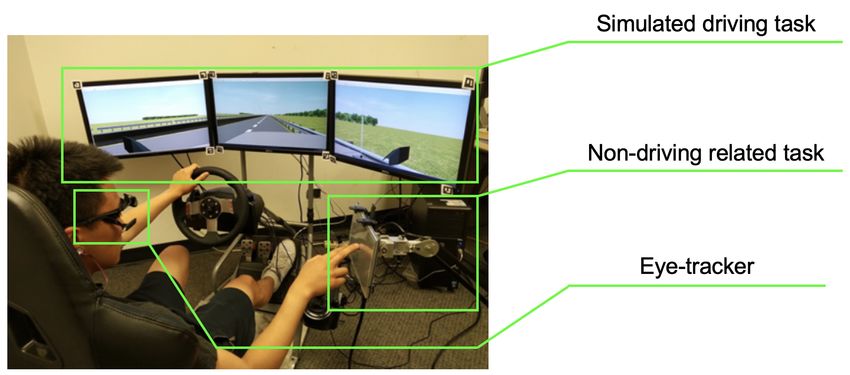
4.2.3 Apparatus. The simulator was composed of 3 LCD monitors integrated
with a Logitech G-27 driving kit. A smaller touchscreen monitor was positioned at the
right hand for the NDRT (see Figure 5).
We developed the simulation with the Automated Navigation Virtual
Environment Laboratory (ANVEL; Durst, Goodin, & Crawford, 2012). The console was
placed to face the central monitoring screen so as to create a driving experience as close
as possible to that of a real vehicle. For the eye-tracking device, we used Pupil Lab’s
Mobileye headset equipped with a fixed “world camera.” This device acquired gaze
positional data from participants’ eyes as well as videos of the participants’ fields of
view and eye orientations.
4.3 Experimental Design
We employed a 2 × 2 within-subject design varying both the reliability of the
automated driving system (ADS) and the visibility in the simulated environment. The
DISTRIBUTION A. Approved for public release; distribution unlimited.
OPSEC # 3555TYPE OF RISK AFFECTS RELATIONSHIPS BETWEEN TRUST AND BEHAVIOR
17
Figure 5 . Experiment setup. The driving task was implemented with the Automated
Navigation Virtual Environment Laboratory, or ANVEL (Durst, Goodin, & Crawford,
2012); the non-driving-related task (NDRT) was implemented with the Psychology
Experiment Building Language, or PEBL (Treisman, 1985); Pupil Lab’s Mobileye
headset was the eye-tracker device used.
ADS reliability was represented by two conditions: reliable (or perfect), when the
automation did not make any mistakes, and unreliable (or imperfect), when the
automation gave some false alarms to the driver. The visibility was manipulated by two
simulated weather conditions: clear or foggy. All conditions of the 2 × 2 design were
experienced by all subjects.
ADS reliability and visibility were the two independent variables we manipulated
to establish the 2 × 2 design. As stated, we manipulated the ADS reliability to assume
two possible levels, represented by the reliable ADS × unreliable ADS conditions. We
manipulated the reliability of the ADS by including false alarms. False alarms occurred
when the ADS warned the driver of an obstacle on the road but, in fact, no obstacle
was present. False alarms were the only system failures included in the simulation to
manipulate the degree of ADS reliability. In the unreliable ADS conditions, false alarms
occurred three times out of the 10 alarms given to the driver per trial. In contrast, in
the reliable ADS conditions, all 10 alarms were correct. This percentage of false alarms
is consistent with the prior literature (Lees & Lee, 2007; Petersen et al., 2018).
DISTRIBUTION A. Approved for public release; distribution unlimited.
OPSEC # 3555TYPE OF RISK AFFECTS RELATIONSHIPS BETWEEN TRUST AND BEHAVIOR
18
We also manipulated the simulated weather conditions to vary visibility in two
levels. In clear weather, the high visibility permitted drivers to spot an obstacle 1, 000
ft (≈ 305 m) away, while the low visibility caused by foggy weather reduced this
distance to 500 ft (≈ 152 m). The speed of the vehicle was regulated to 70 mph (≈ 113
km/h). Therefore, in terms of time to reach the obstacle, those distances represented
time gaps of approximately 9.8 s in high visibility and 4.9 s in low visibility. The choice
of visibility as a variable to represent the level of external risk involved in the driving
context is consistent with prior literature. Low visibility levels have been found to
increase the likelihood of rear-end collisions (Yan et al., 2014). In addition, J. Lee, Lee,
Park, Lee, and Ha (2019) found that users associated ADS risk with system errors or
accidental events, rather than with psychological factors such as self-efficacy or ease of
use, providing further support for both of this study’s manipulations.
To introduce a notation that will be useful for the analyses of results, we defined
the binary Boolean variables Rel and Vis, which respectively represent the levels of
ADS reliability and of visibility conditions in Equations (1) and (2).
0 if the ADS is 70% reliable (unreliable ADS), and
Rel = (1)
1 if the ADS is 100% reliable (reliable ADS).
0 if the visibility is low (foggy weather), and
Vis = (2)
1 if the visibility is high (clear weather).
In our study, Rel and Vis were static indicators in the sense that they did not
vary during each trial. These variables represented the trial conditions and were set
right before the start of each of the four trials experienced by the participants.
To analyze the evolution of some variables over the 10 alerts of each trial, we
defined a sequence FA(t), for which FA(t) = 0 indicated that the ADS alarms worked
properly at the alert t and, conversely, FA(t) = 1 indicated that a false alarm occurred
at the alert t, t ∈ {1, 2, . . . , 10}.
DISTRIBUTION A. Approved for public release; distribution unlimited.
OPSEC # 3555TYPE OF RISK AFFECTS RELATIONSHIPS BETWEEN TRUST AND BEHAVIOR
19
4.4 Measures
We measured the following dependent variables: (a) post-trial trust, (b) alert-wise
dynamic trust, (c) risk perception variables, (d) final NDRT performance score, and (e)
alert-wise dynamic monitoring ratio.
a) Post-trial trust, represented by Tpost , was the numerical average of the answers
to questions contained in the survey given to the participants after each trial
(reproduced in the Appendix).
b) We also defined an alert-wise dynamic trust variable T (t), which was computed
with the increases or decreases in trust after each and every alert, including the false
alarms (i.e., those for which FA(t) = 1). During the trial, subjects were asked after each
ADS alert about their trust change, with the options of {decreased, no change,
increased}. The simulation was paused for some seconds while they answered the trust
change question at the same tablet device they used for the NDRT. Their responses
were translated to a quantized trust difference ∆T (t) ∈ {−1, 0, 1} respectively, for each
event t ∈ {1, 2, . . . , 10}.
To keep consistency between the post-trial trust and the dynamic trust, we
defined T (t) as in Equation (3),
10
Tpost − γ for t ∈ {0, 1, . . . , 9}, and
P
∆T (i),
T (t) = i=t+1 (3)
Tpost , for t = 10.
Note that we defined T (0) as the computed trust at the beginning of the trial,
before any ADS alert. We chose the scaling factor γ = 0.4 to avoid negative values for
the dynamic trust variable T (t). To make sure that our findings would hold for different
coefficients, we also computed the results for γ = 0.2, 0.3, and 0.5. All results involving
the dynamic trust variable were consistent, with the conclusions presented in the
Results section for these γ coefficients.
c) Risk perceptions, represented by perceived reliability risk Rel perc and perceived
visibility risk Vis perc , were also measured through standard surveys adapted from
Robert et al. (2009). These can be found in the Appendix. These variables were used
DISTRIBUTION A. Approved for public release; distribution unlimited.
OPSEC # 3555TYPE OF RISK AFFECTS RELATIONSHIPS BETWEEN TRUST AND BEHAVIOR
20
for a manipulation check, where we evaluated the participants’ perception of how
different were the risk conditions that they had experienced in each trial.
d) NDRT score (SN DRT ) was computed from each participant’s total score
obtained on the search task in each trial, where each correctly chosen “Q” was worth 1
point, and each emergency stop penalty deducted 25 points from the total.
e) Alert-wise dynamic monitoring ratio, represented by rm (t), was computed from
the eye-tracking data to represent the eye movement properties (Hergeth et al., 2016).
When the participants switched their attention between the driving task and the
NDRT, their gaze generally moved from the center monitor to the touchscreen and vice
versa. Monitoring ratio rm (t) was defined as the amount of time spent by the
participant looking at the road (on the simulator monitors) during a time interval
between the alerts t − 1 and t, divided by this time interval.
All variables and their respective basic details are summarized in Table 1.
Table 1
Variable names and interpretations. Presented variables are extracted from experiment
data and are used for linear mixed effects models in the Results section.
Variable Interpretation Type Set/Range
Rel Reliability Independent {0, 1}
Vis Visibility Independent {0, 1}
FA(t) False alarm at alert t Independent {0, 1}
Rel perc Perceived reliability risk Dependent [1, 7]
Vis perc Perceived visibility risk Dependent [1, 7]
Tpost Post trial trust score Dependent [1, 7]
?
T (t) Alert-wise dynamic trust score Dependent [0.2, 8.6]
?
SN DRT Post-trial NDRT performance score Dependent {100, ..., 227}
rm (t) Alert-wise dynamic monitoring ratio Dependent [0, 100%]
Note. ? denoted values observed from the data set. NDRT = non-driving-related-task.
DISTRIBUTION A. Approved for public release; distribution unlimited.
OPSEC # 3555TYPE OF RISK AFFECTS RELATIONSHIPS BETWEEN TRUST AND BEHAVIOR
21
4.5 Experimental Procedure
Upon arrival, participants signed a consent form to participate in the study. Next,
participants completed a pre-experiment survey about demographics and their
experience using driving assistance systems. This survey included questions about their
risk tolerance and propensity to trust automated systems in general. Then, participants
had a training session where they interacted with the simulator and performed the
NDRT. The training drive allowed participants to become familiar with the simulator
and the NDRT prior to the four experimental conditions.
After the training session, participants were equipped with an eye-tracking
headset, which was then calibrated. QR codes on each monitor allowed the eye-tracking
software to determine which screen the participant was looking at. Next, the
eye-tracking device was set up and participants started the first of the four trials. We
counterbalanced the order of the trials to minimize any learning or ordering effects. For
each trial, participants were tasked with both driving and performing the NDRT (which
is described in subsection 4.2 Experimental Tasks). Participants were instructed to
engage the automated driving mode as soon as they felt comfortable and start the
NDRT, but not to totally neglect the driving (as the vehicle would ask them to take
control). It took approximately 10 min for a participant to complete each trial. Finally,
after each trial, participants completed a post-trial survey about their risk and trust
perceptions. Participants were free to ask the experimenter for clarifications about the
post-trial survey at any time. This survey used questions adapted from Muir and
Moray (1996) (see Appendix for the questions). After completing all four trials,
participants were debriefed and received their compensation.
4.6 Analysis
We used linear mixed effects (LME) models (Woltman, Feldstain, MacKay, &
Rocchi, 2012) to investigate the relationships among risk, trust, NDRT performance
and monitoring ratios. Our objective was to identify the parameters (represented by β)
that significantly differed from 0 in each model. When β is significantly different from
DISTRIBUTION A. Approved for public release; distribution unlimited.
OPSEC # 3555TYPE OF RISK AFFECTS RELATIONSHIPS BETWEEN TRUST AND BEHAVIOR
22
zero, we can consider that the associated factor influences the output variable. The
errors associated with the models are represented by .
5 Results
5.1 Manipulation Check
We conducted a manipulation check for risk. We compared Rel perc and Vis perc
between treatments with pairwise t-tests to determine whether the level of perceived
risk differed significantly at the α = 0.001 likelihood level. Table 2 shows that the
means under each condition were significantly different from one another. Based on
these results, we concluded that the manipulation was successful.
Table 2
Manipulation check for risk conditions.
Treatment Condition Perceived Reliability/Visibility Difference p-value
Low ADS Reliability (Rel = 0) Rel perc = 2.10 3.65 × 10⁻⁴ **
High ADS Reliability (Rel = 1) Rel perc = 2.87
Low Visibility (Vis = 0) Vis perc = 2.00 1.40 × 10⁻⁹ **
High Visibility (Vis = 1) Vis perc = 3.70
Note. ADS = automated driving system; NDRT = non-driving-related-task; Rel = reliability;
Rel perc = perceived reliability; Vis = visibility; Vis perc = perceived visibility; Rel perc and
Vis perc range: 1 to 7; ** p < 0.01.
5.2 Hypotheses Verification
The outcomes of the experiment were compared with our hypotheses, in order to
validate them or not. The results are divided in three parts, directly linked to each pair
of hypotheses.
5.2.1 H1 and H2 – Impacts of risk on automated driving system
(ADS) trust. To analyze the impacts of low reliability and low visibility on ADS
DISTRIBUTION A. Approved for public release; distribution unlimited.
OPSEC # 3555TYPE OF RISK AFFECTS RELATIONSHIPS BETWEEN TRUST AND BEHAVIOR
23
trust, we built models considering both the post-trial trust Tpost and the dynamic trust
T (t) as output variables.
For Tpost , we fit the data to the model represented by Equation (4),
Tpost = βI + βRel Rel + βVis Vis + , (4)
where the obtained parameters and their respective significance values are presented in
Table 3. As shown, ADS reliability significantly increased ADS trust, while visibility
from the different weather conditions did not, thus supporting H1 but not H2.
Table 3
Parameters for the linear mixed effects model of post-trial trust (Tpost ), with main
effects for the independent variables Rel and Vis.
Factor affecting Tpost , Equation (4) Coefficient S.E. p-value
[Intercept] βI = 4.88 0.18 1.05 × 10−40 **
Reliability (Rel) βRel = 1.09 0.14 1.60 × 10⁻¹¹ **
Visibility (Vis) βVis = −0.06 0.14 0.65
Note. S.E. = standard error; ** p < 0.01.
Similarly, for the dynamic trust T (t), we built the model represented by Equation
(5),
T (t) = βI + βT (t−1) T (t − 1) + βRel Rel + βVis Vis + , (5)
to understand the influences caused by each risk type on the evolution of trust during a
whole trial, considering the sequence of events indicated by t. In this model, however,
we also considered the parameter βT (t−1) , associated with the “one alert” delayed trust
measurement T (t − 1). The parameters and their respective p-values are presented in
Table 4.
DISTRIBUTION A. Approved for public release; distribution unlimited.
OPSEC # 3555TYPE OF RISK AFFECTS RELATIONSHIPS BETWEEN TRUST AND BEHAVIOR
24
Table 4
Parameters for the linear mixed effects model of dynamic trust, or T (t), with main
effects for the delayed trust measure T (t − 1) and for the independent variables Rel and
Vis.
Factor affecting T (t), Equation (5) Coefficient S.E. p-value
[Intercept] βI = 0.274 0.034 2.48 × 10⁻¹⁴ **
Dynamic (delayed) trust T (t − 1) βT (t−1) = 0.9597 6.1 × 10⁻³ 1.46 × 10−39 **
Reliability (Rel) βRel = 0.083 0.013 1.12 × 10⁻¹⁰ **
Visibility (Vis) βVis = −0.024 0.012 0.036 *
Note. S.E. = standard error; * p < 0.05; ** p < 0.01.
The parameters from Table 4 show that ADS reliability has a significant effect on
trust dynamics, and affects trust’s evolution over time. Visibility’s effect is also
significant at the α = 0.05 likelihood level. In summary, from the models represented by
Equations (4) and (5) as well as their parameters, we observed that higher ADS
reliability had a significant positive impact on ADS trust. Visibility had a significant
positive impact on Vis perc and a significant negative impact on dynamic ADS trust, as
shown in Table 4 and Equation (5). However, visibility did not have an impact on post
trial ADS trust, as shown in Table 3 and Equation (4). Therefore, our first hypothesis
was partially supported by our results.
These results are illustrated in Figures 6 and 7. Figure 6 presents the simulation
of the model represented by Equation (5). For that simulation, we have considered the
initial condition T (0) = 4, which is the midpoint of the 7-point Likert scale. The use of
a reliable ADS (Rel = 1) results in a faster increase in trust, while a low ADS reliability
(Rel = 0) slows this evolution.
On the other hand, Figure 7 shows the average behavior for T (t), considering the
response data of all participants, for the different treatment conditions. The curves for
which Rel = 1 follow the same pattern, indicating a solid trust increase over the usage
DISTRIBUTION A. Approved for public release; distribution unlimited.
OPSEC # 3555TYPE OF RISK AFFECTS RELATIONSHIPS BETWEEN TRUST AND BEHAVIOR
25
time of a reliable ADS. Furthermore, the final values for T (10), which corresponds to
Tpost , are not significantly different, both being close to 5.9 points. In low-reliability
conditions (Rel = 0), the curves indicate decreases for specific alert indexes t, coincident
with the false alarms provided by the ADS. That is, for Rel = 0 and Vis = 1, we had
false alarms for t = 3, 4, 6 while for Rel = 0 and Vis = 0, false alarms occurred for
t = 2, 4, 5. Moreover, for both low ADS reliability conditions, the average value of
T (10) = Tpost was about 4.8.
Trust Evolution Over Alerts by Reliability Level
6.5
6
5.5
5
4.5
4
3.5
0 1 2 3 4 5 6 7 8 9 10
Figure 6 . Curves illustrate the simulation of the model represented by Equation (5). We
chose T (0) = 4 for both conditions to better compare the results. When Rel = 1 (i.e.,
when participants were using a reliable ADS), trust increased faster than when Rel = 0
(i.e., when participants were using an unreliable ADS). For both curves, Vis = 0.
5.2.2 H3 and H4 – Influence of risk on the impacts of ADS trust on
non-driving-related task (NDRT) performance. Our second pair of hypotheses
asserted that both low reliability and low visibility should moderate the impact of ADS
trust on NDRT performance. This claim was only partially supported by our results, as
we concluded by analyzing the model expressed in Equation (6) and its parameters
listed in Table 5.
DISTRIBUTION A. Approved for public release; distribution unlimited.
OPSEC # 3555TYPE OF RISK AFFECTS RELATIONSHIPS BETWEEN TRUST AND BEHAVIOR
26
Average Trust Behavior by Treatment Condition
6.5
6
5.5
!
5
4.5
4
!
! ! ! ! !
3.5
0 1 2 3 4 5 6 7 8 9 10
Figure 7 . Plots of the average T (t) for all participants for each reliability and visibility
condition. When Rel = 1 (i.e., when participants were using a reliable ADS), T (t)
increased steadily over the alerts indicated by t. When Rel = 0 (i.e., when participants
were using an unreliable ADS), the occurrence of false alarms resulted in decrements in
T (t). This happened for t = 2, 4, 5 when Vis = 0 and for t = 3, 4, 6 when Vis = 1. For
these t, FA(t) = 1.
SN DRT = βI + βTpost Tpost +βRel Rel + βVis Vis + βTpost ×Rel [Tpost × Rel]
(6)
+ βTpost ×V is [Tpost × V is] + βRel×V is [Rel × V is] + .
DISTRIBUTION A. Approved for public release; distribution unlimited.
OPSEC # 3555TYPE OF RISK AFFECTS RELATIONSHIPS BETWEEN TRUST AND BEHAVIOR
27
Table 5
Non-driving-related task score (SN DRT ) linear mixed effects model parameters, with
main effects for the post-trial average trust measure Tpost and for the independent
variables Rel and Vis, as well as their interaction effects. The interaction effects
represent the moderating influence on the impacts of ADS trust on NDRT performance.
Factor affecting SN DRT , Equation (6) Coefficient S.E. p-value
[Intercept] βI = 191 14 9.44 × 10⁻²⁵ **
Post-trial Trust Tpost βTpost = 3.1 2.7 0.25
Reliability Rel βRel = −39 19 0.045
Visibility Vis βVis = −4 15 0.785
Interaction Tpost × Rel βTpost ×Rel = 7.3 3.2 0.028 *
Interaction Tpost × Vis βTpost ×Vis = 1.7 3.1 0.58
Interaction Rel × Vis βRel×Vis = −20.8 7.6 0.008 **
Note. SN DRT = non-driving-related task score; S.E. = standard error; * p < 0.05; ** p < 0.01.
From the significant positive value for βTpost ×Rel , we concluded that ADS
reliability moderates the impact of ADS trust on NDRT performance (H3). The
moderating effect of visibility represented by βTpost ×V is was not significant (H4).
Figure 8 represents the relationship corresponding to the results demonstrated by
Equation (6) and its parameters (Table 5). With low reliability, the weaker slopes
indicate that a higher ADS trust level did not result in a significantly better NDRT
performance. When using a reliable ADS, however, the greater slope indicates that a
higher trust corresponded to better performance.
5.2.3 H5 and H6 – Influence of risk on the impacts of ADS trust on
monitoring ratio. H5 and H6 state that both low ADS reliability and low visibility
should moderate the impact of ADS trust on monitoring ratio. These hypotheses are
also partially supported by the model that relates rm (t) with the variables T (t − 1), Rel
and Vis, as we concluded from Equation (7) and its parameters (shown in Table 6).
DISTRIBUTION A. Approved for public release; distribution unlimited.
OPSEC # 3555TYPE OF RISK AFFECTS RELATIONSHIPS BETWEEN TRUST AND BEHAVIOR
28
20
15
10
5
0
-5
-10
-15
-20
4 4.5 5 5.5 6 6.5
Figure 8 . Correspondence between Tpost and respective SN DRT deviations around the
mean. Here, the mean value for Tpost is around µ = 5.4, and the standard deviation is
approximately σ = 1.3. The interval between one standard deviation above and below
the mean (µ ± σ) is considered. The mean values for SN DRT were all brought together
at zero, for the comparison of slopes. For all conditions where Rel = 1, the slope is
greater than when Rel = 0. Therefore, when using an unreliable ADS, participants
could not translate a higher ADS trust level into significantly better NDRT
performance. Visibility does not influence this relationship significantly. ADS =
automated driving system; NDRT = non-driving-related task; Rel = reliability; Vis =
visibility; SN DRT = non-driving-related task score.
The use of T (t − 1) is justified because rm (t) was measured during the time period
between alerts indexed by t − 1 and t. Thus, we computed the impact of the trust
responses on monitoring ratios measured right after the participants were asked about
their trust changes.
DISTRIBUTION A. Approved for public release; distribution unlimited.
OPSEC # 3555TYPE OF RISK AFFECTS RELATIONSHIPS BETWEEN TRUST AND BEHAVIOR
29
rm (t) = βI + βT (t−1) T (t − 1)+βRel Rel + βVis V is + βT (t−1)×Rel [T (t − 1) × Rel]
+ βT (t−1)×V is [T (t − 1) × V is] + βRel×V is [Rel × V is] + .
(7)
Table 6
Monitoring ratio (rm (t)) linear mixed effects model parameters, with main effects for the
delayed trust measure T (t − 1) and for the independent variables Rel and Vis, as well as
their interaction effects. The interaction effects represent the moderating influence on
the impacts of automated driving system trust on monitoring ratio.
Factor affecting rm (t), Equation (7) Coefficient S.E. p-value
[Intercept] βI = 0.403 0.074 1.25 × 10⁻⁷ **
Dynamic (delayed) Trust T (t − 1) βT (t−1) = 0.006 0.017 0.72
Reliability indicator Rel βRel = 0.013 0.095 0.89
Visibility indicator Vis βVis = 0.144 0.084 0.086
Interaction T (t − 1) × Rel βT (t−1)×Rel = −0.004 0.018 0.83
Interaction T (t − 1) × V is βT (t−1)×V is = −0.041 0.018 0.025 *
Interaction Rel × V is βRel×V is = 0.038 0.048 0.42
Note. S.E. = standard error; * p < 0.05; ** p < 0.01.
The value of βI = 0.403 in Table 6 indicates an average basic monitoring ratio for
the participants, specifically when disregarding the impacts of trust and when
Rel = Vis = 0. The results from Table 6 also show that monitoring ratio is negatively
correlated with the interaction between T (t − 1) and Vis. That is, with high visibility
(i.e., in clear weather conditions), the subjects trusted the ADS more, looked at the
road less and focused on the secondary task more. However, under low visibility (i.e.,
foggy weather), such impact of trust was greatly reduced and monitoring ratio was no
longer an effective trusting behavior. Reliability, however, had no significant impact on
rm (t), nor did it moderate the impact of T (t − 1) on rm (t). These results corroborate
H6 but not H5.
DISTRIBUTION A. Approved for public release; distribution unlimited.
OPSEC # 3555TYPE OF RISK AFFECTS RELATIONSHIPS BETWEEN TRUST AND BEHAVIOR
30
The relationship between T (t − 1) and rm (t) indicated by Equation (7) is
illustrated in Figure 9, which summarizes all combinations of Vis and Rel. The figure
shows that better visibility enabled a decrease in monitoring ratios when participants
reported higher ADS trust. This is represented by the negative slopes when Vis = 1.
Contrarily, when Vis = 0, this correlation became irrelevant, with the slope parameter
assuming the value βT (t−1) = 0.006, but with no significance.
0.06
0.04
0.02
0
-0.02
-0.04
-0.06
3.5 4 4.5 5 5.5 6 6.5
Figure 9 . Correspondence between dynamic trust T (t) and respective rm (t) deviations
around the mean. Here, the mean value for T (t) is around µ = 4.9, and the standard
deviation is approximately σ = 1.3. The interval between one standard deviation above
and below the mean (µ ± σ) is considered, and the mean values for rm (t) were all
brought together to zero, for the comparison of slopes. For all conditions where Vis = 1,
the slope was negative, which did not happen when Vis = 0. The result shows that for
Vis = 1, higher trust led to smaller monitoring ratios. In other words, high visibility
allowed drivers to demonstrate their ADS trust by reducing system monitoring.
However, when the visibility conditions were poor (Vis = 0), drivers did not decrease
monitoring, even when they reported having higher ADS trust. ADS reliability did not
influence this relationship significantly. Rel = reliability; Vis = visibility.
DISTRIBUTION A. Approved for public release; distribution unlimited.
OPSEC # 3555TYPE OF RISK AFFECTS RELATIONSHIPS BETWEEN TRUST AND BEHAVIOR
31
6 Discussion
The goals of this paper were: (i) to investigate how different types of risk influence
automated driving system (ADS) trust development, and (ii) to understand when
different risk types undermine or strengthen the impact of automated driving system
(ADS) trust on both non-driving-related task (NDRT) performance and monitoring
ratio. Results of this study can be organized around three overarching findings. First,
the use of an unreliable ADS reduced ADS trust (H1 supported), but foggy weather
with low visibility did not (H2 not supported). This is consistent with what is shown in
Figure 7, that on average trust increases over time if the system is reliable. Second, the
use of an unreliable ADS moderated the positive impact of ADS trust on
non-driving-related task (NDRT) performance (H3 supported), while low visibility did
not (H4 not supported). Third, low visibility moderated the impact of ADS trust on
monitoring (supporting H6), but low reliability did not (not supporting H5). Next, we
discuss our contributions to the literature.
First, our findings contribute to the cumulative research on the antecedents of
ADS trust. Our first major finding is that the type of risk is important when
understanding its effects on ADS trust. Research has suggested that as risk increases,
ADS trust decreases (Gremillion et al., 2016; Verberne et al., 2012). Since our
manipulation check results confirm that our scenarios did induce higher perceptions of
reliability and visibility (Table 2), our findings are consistent with prior literature for
internal risk, represented by low reliability, but are not consistent with regards to
external risk, represented by low visibility. Only low reliability resulted in lower ADS
trust. Thus, our results extend the existing literature by demonstrating the distinct
impacts of internal and external risks. To the authors’ knowledge, no studies have
specifically distinguished between risk types and considered their influence on ADS
trust.
Second, this study contributes to the literature by clarifying the boundary
conditions on the impact of ADS trust on NDRT performance. A large body of research
has focused on the positive impacts of ADS trust on NDRT performance (Körber et al.,
DISTRIBUTION A. Approved for public release; distribution unlimited.
OPSEC # 3555You can also read


