Micro continuum approach for mineral precipitation - Nature
←
→
Page content transcription
If your browser does not render page correctly, please read the page content below
www.nature.com/scientificreports
OPEN Micro‑continuum approach
for mineral precipitation
Fengchang Yang*, Andrew G. Stack & Vitalii Starchenko*
Rates and extents of mineral precipitation in porous media are difficult to predict, in part because
laboratory experiments are problematic. It is similarly challenging to implement numerical methods
that model this process due to the need to dynamically evolve the interface of solid material. We
developed a multiphase solver that implements a micro-continuum simulation approach based
on the Darcy–Brinkman–Stokes equation to study mineral precipitation. We used the volume-of-
fluid technique in sharp interface implementation to capture the propagation of the solid mineral
surface. Additionally, we utilize an adaptive mesh refinement method to improve the resolution
of near interface simulation domain dynamically. The developed solver was validated against both
analytical solution and Arbitrary Lagrangian–Eulerian approach to ensure its accuracy on simulating
the propagation of the solid interface. The precipitation of barite (BaSO4) was chosen as a model
system to test the solver using variety of simulation parameters: different geometrical constraints,
flow conditions, reaction rate and ion diffusion. The growth of a single barite crystal was simulated to
demonstrate the solver’s capability to capture the crystal face specific directional growth.
Mineral precipitation commonly occurs in nature and plays an important role in many energy-related applica-
tions. For instance, minerals precipitate as scale in the pore structure near wellbores and significantly reduce the
permeability of the porous formation1. This can lead to a rapid decrease in production and cause financial loss2.
The need to predict the dynamic properties of such systems has resulted in questions about the fundamental
mechanisms of mineral precipitation in p ores3. Additionally, there is still a discrepancy between laboratory
molecular scale findings and large-scale o bservations4. To address this discrepancy, modeling methods at the
pore scale started gaining interest recently due to the capability of capturing reactive and nonreactive species
transport, effects of pore topology, and interface chemical reaction within the same approach, which typically
is difficult to observe in e xperiments5.
Over the last decade several numerical approaches have been developed to model mineral dissolution and
precipitation processes. Some of the commonly used approaches rely on different numerical formulation such
as Lattice Boltzmann method (LBM), smoothed particle hydrodynamics (SPH), computational fluid dynamics
(CFD). The LBM originated from gas kinetic theory and computes the statistical functions for phenomena such
as fluid flow, species transport, etc. LBM typically divides the computational domain into uniformly distributed
lattices, which are populated by a set of discrete velocity v ectors6. Applied to the problem of reactions on min-
eral–water interface LBM grid cells need to be marked as belonging to the liquid and solid phase respectively.
Figure 1a illustrates the assignment of the grid points: “blue area”—liquid, “yellow area”—solid. Kang and col-
leagues studied a wide range of dissolution and precipitation problems related to reacting flow in pores using
LBM models7–9. Later, using a similar model, Chen et al. found that the precipitation of a secondary solid phase
inhibited the dissolution of the primary solid phase10 due to the surface coverage. Szymczak and Ladd used LBM
to model fluid flow in fractures in combination with random walk algorithm for transport of dissolved species
which was applied to study the wormhole formation phenomenon in natural r ock11,12. Due to the nature of LBM
algorithm that is linked to the regular Cartesian grid, it is easy to implement, and its application shows a great
potential at handling mineral dissolution/precipitation at mesoscale. However, LBM models are accompanied
by a relatively small time step compared to other methods and in turn requires more computational r esources13.
Moreover, in order to capture a multiphase interface, uniformly distributed lattices may require significant
computational resources, which sometimes can be only obtained at Leadership Computing Center level (e.g.,
OLCF, ALCF)14.
Due to the complex geometry of mineral–water interfaces and need to reduce computational load, mesh-
less particle-based methods were adapted to model dissolution and precipitation processes. As an example, a
mineral–water interface representation within smoothed particle hydrodynamics method is shown on Fig. 1b.
This method represents a physical domain by discretizing it into small particles and solving both the flow and
Chemical Sciences Division, Oak Ridge National Laboratory, 1 Bethel Valley Rd., Oak Ridge, TN 37831, USA. *email:
yangf@ornl.gov; starchenkov@ornl.gov
Scientific Reports | (2021) 11:3495 | https://doi.org/10.1038/s41598-021-82807-y 1
Vol.:(0123456789)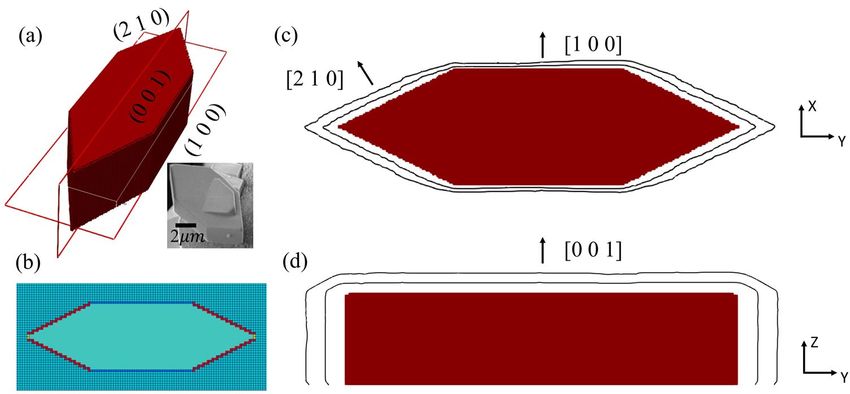
www.nature.com/scientificreports/
Figure 1. Schematic representation of the fluid–solid interface using different methods for pore-scale modeling
of mineral dissolution or precipitation process (a) LBM (b) SPH (c) ALE (d) DBS.
transport equations. Then the fluid flow and species transport are tracked by each individual Lagrangian particle
motion. The original SPH was introduced by L ucy15 and G
ingold16 for simulating the fluid dynamics related to
astrophysical areas. Since 2007, Tartakovsky et al. developed a model using SPH method to study the reactive
transport and mineral precipitation in fractured and porous materials17,18. The particle-based methods do not
rely on a mesh and are good at dealing with evolving geometries. However, the identification and tracking of
liquid/solid interface is not trivial in SPH and requires a coupling of additional methods.
As an alternative, fluid flow and species transport equations can be solved using finite volume (FVM), finite
element (FEM) or finite difference (FDM) m ethods19. The use of unstructured meshes (including complex
geometries with curved boundaries) allows one to resolve the interface and to reduce need for computational
resources. Similarly, to model processes that lead to growing (or dissolving) phases it is necessary to track the
interface between those phases. The most popular approaches that allow one to model and track interfaces during
multiphase CFD modeling include Volume of Fluid (VOF)20, Level Set (LS)21, and Arbitrary Lagrangian–Eulerian
(ALE)22 methods. A boundary can be captured precisely using the ALE approach, in which the surface mesh is
moved continuously following the phase evolution. However, it is hard to implement and topological changes or
remeshing are needed to maintain the mesh quality after significant deformation of the initial shape. The Level Set
method solves an extra level-set equation, which allows the location and curvature of the interface to evolve by
advecting and re-initializing the level-set function. For instance, Jones and Detwiler have used this approach to
fit the experimental observation of calcium carbonate precipitation in f ractures23. Although the LS method allows
one to capture the curvature of interface more accurately, it typically requires more computational resources and
can sometimes lead to non-conservative solutions if no special treatment is implemented.
Recently a micro-continuum Darcy-Brinkman-Stokes (DBS) approach has been successfully applied to model
mineral dissolution24. The DBS model solves a single set of governing equations for liquid/solid/porous phases
similar to fictitious domain method in which a penalty source term is used to switch the behavior of governing
equation according to the volume fraction of certain phase within the computational c ell25. Such treatment of
phases allows one to include in the simulations a flexible geometry of different phases and the reactions at the
interface between phases is captured through an immersed boundary method without explicit tracking. To
include the gas phase production during solid matrix dissolution, which requires surface curvature to take into
account surface tension, Soulaine et al. coupled the DBS approach with the volume of solid (VOS) interface
tracking method26. They demonstrated that the approach captures dynamics of all three phases by comparing
modeling with a microfluidic experiment. Although the DBS method has shown a great potential to model min-
eral phase change with interface evolution, only very limited previous research has been done to study mineral
precipitation to the authors’ best knowledge. Recently, a benchmark study on the performance and robustness
of different approaches (DBS, LBM, ALE, etc.) in respect to a single particle dissolution problem has shown that
all methods mentioned above can achieve a good agreement27. However, one should take into account strength
and weakness of each approach before applying it to a new problem.
Other methods such as the phase field modeling can be also used to simulate mineral precipitation from
solutes28. In contrast to the described above methods, the evolution of solid precipitate in phase field approach
is modeled using an order parameter, which follows a separate differential equation and substitutes the surface
reaction rate equation by the minimization of the free energy difference between solid and liquid p hases29. The
solid–fluid interface in the phase field approach is represented by the diffuse boundary and is controlled by a
parameter that is a part of the differential equation for the order parameter. Although early phase field models
for mineral precipitation were developed and coupled with the diffusion e quation30 or just as a minimization of
the free energy f unctional31, recent development includes coupling with the Navier–Stokes e quation32.
Due to the complexity of the mineral precipitation process within the porous medium, there is a great inter-
est in improving the existing models. Unlike previous DBS studies (which mostly focused on the dissolution
process), in this paper, we explore the possibility of using the DBS framework with volume of solid (VOS) that
implements a sharp transition from liquid to solid for studying mineral precipitation at the micro-continuum
scale. Our choice of DBS is due to its flexibility in dynamically capturing appearing and disappearing phases. To
model the interface more accurately, we use adaptive mesh refinement method which was added within the newly
developed solver to locally refine the mesh near the liquid–solid interface. In addition, a criterion for propaga-
tion of a sharp interface was introduced to limit the diffusion effect of the native DBS scheme, which may lead to
inaccurate representation. Moreover, since precipitation of crystals typically shows different face-specific growth
Scientific Reports | (2021) 11:3495 | https://doi.org/10.1038/s41598-021-82807-y 2
Vol:.(1234567890)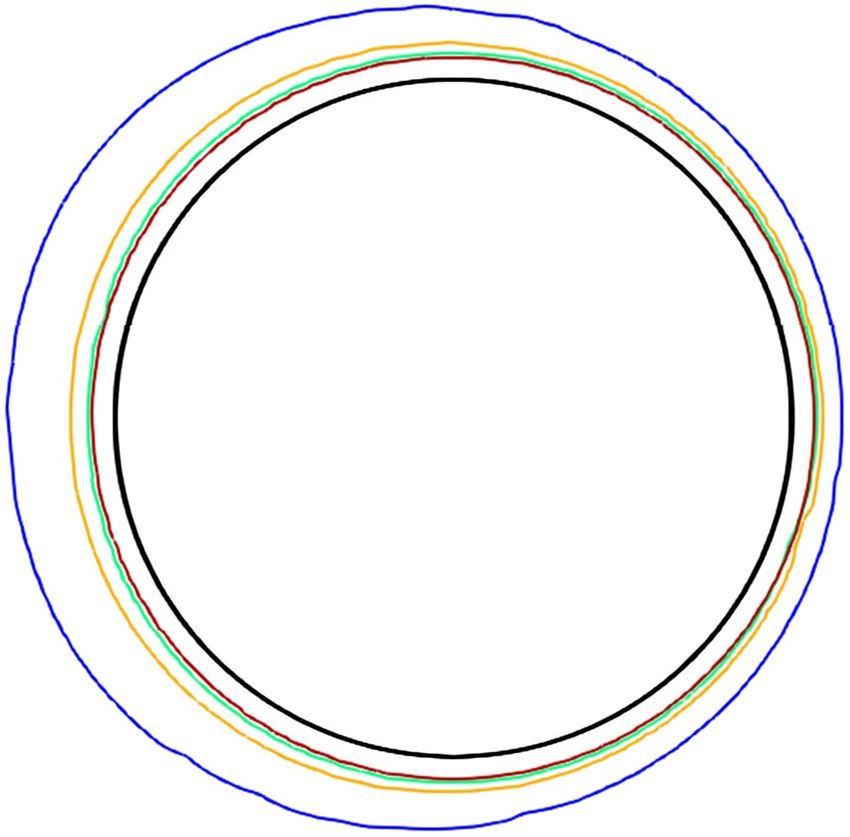
www.nature.com/scientificreports/
rates33, an extra directional growth method was developed to improve the capability of the solver on modeling
the realistic crystal growth. Due to the importance of the mineral barite (BaSO4) in the scale formation34, we
applied this solver to model several cases of barite crystal growth precipitation.
This manuscript starts with the mathematical details of the multiphase micro-continuum model and the
sub-grid models for reactions and interface. Further, we present the adapted mesh approach for more robust
capture of interface propagation. After that, the developed solver is validated against both analytical solution and
an established ALE solver—dissolFoam35 that is referred in the rest of the manuscript as the ALE solver. Then,
the effect of geometrical constraint, flow condition, reaction rate and ion diffusion on barite precipitation are
presented followed by modeling of a single crystal growth. Finally, the directional growth of a single barite crystal
with different facets, with variate growth rates, was simulated to show the potential of this solver in modeling a
wide array of crystallization problems.
Method
In this section, we introduce the underlying mathematical model for the pore-scale flow and species transport
through a porous medium. To represent both solid and liquid phases in the simulations we used the volume of
solid (VOS) method (similar to volume of fluid method) to include effects of solid phase on the fluid flow. The
simulation domain is discretized into computational cells of a control volume, Vc , which contain two scalar fields
εs and εf . The scalar fields represent the volume fractions of both solid (εs) and liquid phases (εf) within the cell.
The following correlation holds for each computational cell,
εf + εs = 1. (1)
Therefore, the cell that is fully occupied by liquid results in εf = 1 and εs = 0. The opposite holds for the cell
fully occupied by solid phase. Such a method represents the liquid–solid interface through a diffuse interface
model (interface exists in region where 0 < εf , εs < 1), which does not explicitly capture a sharp interface.
Instead, the interface could exist within one or multiple layers of cells depending on the implementation.
In this study, we follow the fictitious domain method for modeling the flow within a diffuse interface
layer24,25,36,37 that is represented analogously to a porous region. The flow of the dilute solution is governed by
one form of the Navier–Stokes/Brinkman equation,
−
∂ u
−
− − −
ρf + u ·∇ u = −∇ p +µf ∇ 2 u +Sp , (2)
∂t
− − −
where u is the superficial velocity for each computational cell, u= V1c Vf udV , p is the intrinsic phase averaged
−
pressure, p = V1c Vf pdV , µf is the dynamic viscosity of solution. The non-slip boundary condition on liq-
uid–solid interface Ŵ for the solid phase in introduced via a penalization term, Sp, which vanishes in the liquid
phase and forces velocity toward zero in the solid phase. Different form of this penalization term could be used
according to the applications. Specifically, in this study, we follow the well-known Kozeny-Carman r elation36 to
estimate the local permeability in a computational cell that is represented by the precipitate,
2
1 − εf −
Sp = − u, (3)
Kεf3
where K is the combined permeability constant. If K → ∞, this penalty term vanishes within the pure liquid
region and the governing equation reduces to the standard incompressible Navier–Stokes equation. If K → 0,
the governing equation enforces a non-slip boundary condition at interface and freeze the motion of solid
phase. However, if a porous region exists, a moderate K value can be chosen to mimic the Brinkman equation
for porous m edium25. In this study, due to the relatively thin porous (or interface) region and slow growth rate of
solid phase, we chose a small K value (~ 10–20) to help implementing a non-slip boundary condition at interface.
During the precipitation process, the solid phase evolves along with the precipitation happening at the liq-
uid–solid interface. By assuming only one type of mineral is precipitating, the solid volume fraction in a local
cell can be found through,
∂εs ρs
= −Ms Ṙ, (4)
∂t
where Ṙ is the volume-based reaction rate ( mmol
3 s ) and Ms is the molar mass for solid phase. Naturally, the continu-
ity equation for the fluid phase reads
∂εf ρf −
+ ∇ · ρf u = Ms Ṙ. (5)
∂t
The transport of chemical species is governed by the diffusion–advection equation with source terms for
including the chemical reactions,
∂εf C i −
(6)
+ ∇ · u Ci = ∇ · Deff ∇Ci − Ṙ,
∂t
2
where Deff is the effective diffusion coefficient in form of Deff = εf2 D and D is the bulk diffusion coefficient ( ms ).
The precipitation of a mineral within eligible computational cell is controlled by the correlation obtained from
Scientific Reports | (2021) 11:3495 | https://doi.org/10.1038/s41598-021-82807-y 3
Vol.:(0123456789)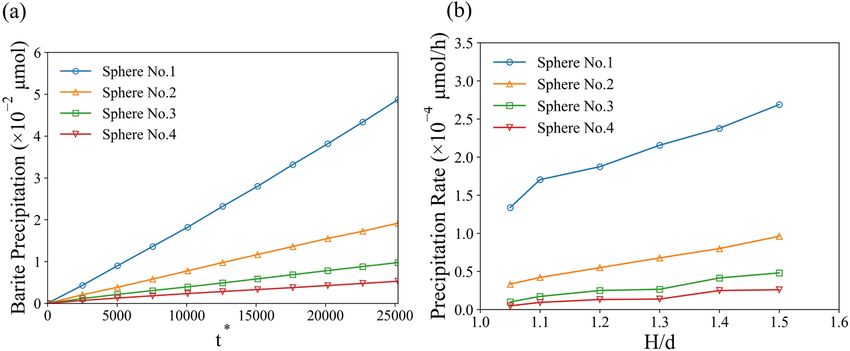
www.nature.com/scientificreports/
Figure 2. Local computational cell refinement is based on the volume fraction of solid phase.
previous experiments in closed system reactors38. In the current model we assume a precipitation of a sparingly-
soluble 1:1 salt—barite ( BaSO4), where one ion of B a2+ consumed corresponds to one anion of S O42− also con-
sumed. Thus, using the principle of electroneutrality we can assume that the averaged local concentration of
both ions in a simulation cell is the same at the pore-scale and we can consider a transport of only one species.
Of course, this assumption doesn’t hold if the transport is considered in nano-porous material or within the
interfacial region if there is a large surface charge. However, we consider this case to be out of the scope of the
current model. Although more complex expressions can be derived (e.g., Refs.39,40), for this initial work we use
the surface-controlled dissolution and precipitation rates per unit area fitted in the form of an empirical rate law:
ṙ = k(� − 1)n , (7)
aBa2+ a
SO2−
where k ( mmol
2 s)is a fitted rate constant from experiments, the dimensionless = Kbarite is the saturation
4
state of the liquid with respect to barite, ai represents the activity of corresponding aqueous ion, Kbarite is the
equilibrium constant for barite in liquid, n is the power for the reaction (n = 1 for linear growth, n = 2 for spiral
growth). Note, our current model introduces the precipitation as a reaction source term to simplify the com-
plexity of the model. However, for high saturation index solution, the nucleation process could potentially play
a very important role in the precipitation due to either heterogeneous or homogenous nucleation, which should
be considered in the future studies. In this study, we are focusing more on moderate saturation index solution,
hence the simplified uniform precipitation was applied.
However, unlike the ALE method, no embedded boundaries (Fig. 1c) were used to represent the liquid–solid
interface in the fictitious domain method. In this study, an immersed boundary method (Fig. 1d) was used to
represent the interface and calculate the volume-based reaction rate in the computational cell, i.e.,
1
Ṙ = ṙdA ≈ av ṙ, (8)
Vc Als
2
where av ( mm3
) is the area density in the eligible computation cell that is undergoing precipitation. By mapping
surface area to volume-based density, this approximation is similar to the assumption of sharp transition from
liquid phase to solid phase by Soulaine et al.24. Sharp transition assumption restricts the propagation of the solid
phase until the current cell is fully filled with a precipitate. Therefore, the area density relates the gradient of
porosity with the surface area in certain control volume av = �∇εf �. This approach ensures no interface exists
in pure solid/liquid regions. However, a diffusive interface may emerge due to the nature of the DBS model,
which can spread across several layers of computational cells. To limit this effect and ensure the sharpness of the
interface, a criterion of the solid volume fraction, εs,c , was imposed to limit the distance of the diffuse interface to
one layer of computational cell. In another words, a computational cell was only enabled for solid growth when
a nearby cell with solid volume fraction higher than the criterion (i.e., εs,c ) exists (see “Model validation” section
for details). For results comparison we used nondimensional time, t ∗ = t/τ , which was scaled to the diffusion
time defined as τ = d 2 /D with d as a sphere diameter.
One limitation of this combined fictitious domain method and diffuse interface model is that the interface
is typically presented through a gradient of the volume fraction, which relates to the local mesh size near the
interface. It is computationally expensive to reduce the mesh size in the whole computational domain in which
the solid phase only appears in some regions. To address this problem and capture the interface more accurately,
we employed an adaptive mesh m ethod41 to refine the mesh automatically near the tracked interface (see Fig. 2).
This method splits the computational cell when the volume fraction of solid bypass certain threshold, εs,r , and
merges them when all nearby cells are occupied by the solid phase. In this study, the volume fraction of solid,
εs > 0.01, was used to automatically refined the mesh near solid–fluid interface.
Recently, a study showed that the dissolution of minerals such as gypsum ( CaSO4·2H2O) could be affected
by the additional hindrance on the ion diffusion from the interaction between neighboring ion c louds42. In the
current study, we also introduced an activity correction to ion diffusion to investigate its impact on the barite
precipitation process
dlnγ
D(c) = D0 1 + , (9)
dlnC
Scientific Reports | (2021) 11:3495 | https://doi.org/10.1038/s41598-021-82807-y 4
Vol:.(1234567890)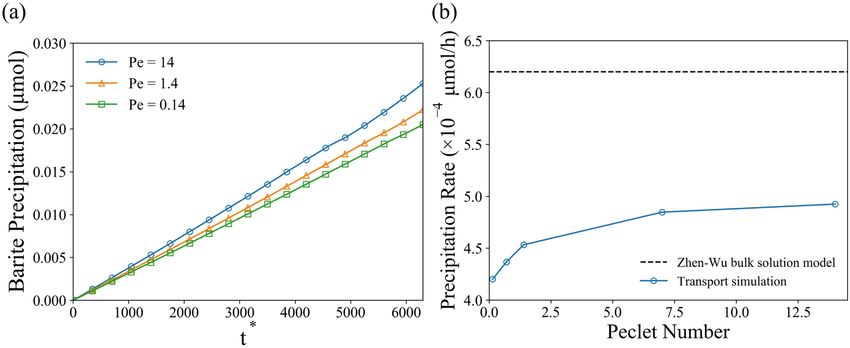
www.nature.com/scientificreports/
where γ is the ion activity coefficient, D0 is the bulk diffusion coefficient and C is the ion concentration. Follow-
ing the extended Debye-Hückel t heory43, the activity coefficient can be linked to the barium concentration by
a correlation,
A CCsat
lny± = − , (10)
1 + B CCsat
where Csat is the saturation concentration, A and B are coefficients related to the parameters in the extended
Debye-Hückel theory.
Modeling growth of a single crystal is another challenging problem due to crystal face dependent reaction
rates. In most past studies of mineral precipitation, the rate constant was maintained as isotropic across the whole
simulation domain since the main goal was to model a volume averaged precipitate that does not resolve a shape
of a single crystal17,24,27. In this study, we explore modeling a single crystal growth by applying the anisotropy
of reaction rate as a function of crystallographic orientation. Different values of the reaction constant ki were
assigned to the local cell by calculating its max similarity function between surface norm, − →n s , and prescript
directional growth norms, n dir,−
→
−
→ns ·− →n dir
cos(θ) = −→ −
→ . (11)
| n s || n dir |
The surface norm was obtained by calculating the normalized directional gradient of the solid phase VOS,
−
→n s = ∇εs/|∇εs |. In another word, for each different −
→n dir , its norm-based reaction constant ki was used for
calculating precipitation if its cos(θ) is the max among all −
→
n dir for certain surface. The goal of this model is to
reproduce the anisotropy growth process observed in experiments while maintain the general shape of the crystal.
All above mathematical formulations were discretized using finite volume approach. The time step was con-
trolled by setting Courant–Friedrichs–Lewy number smaller than 0.5. The solver accuracy was setting to 1e−8,
which was small enough to ensure convergence. A mesh sensitivity study was performed to ensure the precipita-
tion process was independent of the chosen mesh size by carefully changing the mesh size and comparing results
deviation for all simulation cases. We implemented the model within the solver mpFoam using an open source
CFD package OpenFOAM44. The temporal discretization was handled using Crank-Nicolson method, while
the spatial discretization was handled using the default OpenFOAM method (Gauss linear). The details of the
numerical method can be found in the User Guide of OpenFOAM. To perform the simulations, we utilized the
CADES cluster at Oak Ridge National Laboratory and Lawrence Berkley National Lab’s NERSC supercomputer.
Model validation
To show that the current solver is capable of simulating the fluid flow, species transport and precipitation pro-
cesses, two separate validation cases were conducted. The first case was performed to validate the effectiveness
of capturing moving interface and accuracy of sub-grid phase change model. This simulation was set up similar
to the 1D non-linear diffusion validation problem for SPH model developed by T artakovsky17. The solid phase
was immersed in a supersaturated solution (C(x, t = 0) = C0 ) and precipitation occurred only at the front
surface of the solid phase. The total simulation domain had a length of L = 32δ (δ is the unit length) and the
solid phase occupied region from 0 to δ . A prescribed concentration C(L, t) = C0 was imposed as a bound-
ary condition for x = L
and the precipitation reaction at front surface follows a first order kinetic correlation,
D∇C · n = kl Ci − Ceq , where kl is local reaction rate constant and Ceq is the equilibrium solution concentration
at solid–liquid interface. By assuming slow growth processes, no fluid flow, an approximate analytical form can
be obtained from diffusion equation as follow,
2
2D C0 − Ceq t
D D
S(t) = +L − + L − S0 − . (12)
kl kl ρm
The other input parameters for simulation and analytical solution are kl = 0.001 ms , D = 1 m2 /s , CCeq0 = 8,
kg
ρm = 16 m 3 . As mentioned in “Method” section solid interface propagates only when a cell has solid volume
fraction higher than εs,c . To investigate the effect of this chosen criterion εs,c on the solid interface propagation,
we picked εs,c = 0.5, 0.75, 0.9, and 0.99, and compared results with the analytical solution. Figure 3 shows the
comparison of the simulation results from mpFoam and the analytical solution according to Eq. (9). As the
results show, when εs,c was reduced from 0.99 to 0.5, the front position S gradually deviated from the analytical
solution. This deviation means the interface in the model became diffusive and didn’t satisfy the sharp interface
analytical solution. In turn, the front of the solid phase accelerated and resulted in a porous solid, in which spe-
cies transport is still possible. This scenario remains useful if modeled precipitate has, for example, nanoporous
structure. In such cases an appropriate transport in porous region should be implemented. In contrast, if εs,c was
maintained at a value closed to 1 (εs,c = 0.99 case in Fig. 3), the current sub-grid phase change model can accu-
rately calculate the amount of species precipitate and propagate the location of interface accordingly. Hence, in
this study, as we were mainly focusing on the mineral formation of the barite crystal, a higher value of εs,c (0.99)
was used.
Additionally, to take into account the fluid flow and convective transport of the species in solution, we per-
formed a benchmark simulation of precipitation on a sphere. The dynamics of the solid precipitate interface was
compared to the established ALE solver35,42. Figure 4 shows the setup of the simulation. A solid sphere of 100 µm
Scientific Reports | (2021) 11:3495 | https://doi.org/10.1038/s41598-021-82807-y 5
Vol.:(0123456789)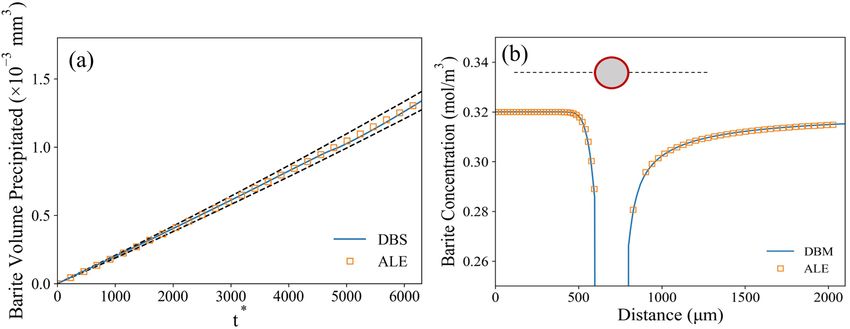
www.nature.com/scientificreports/
Figure 3. Position of liquid–solid interface as a function of nondimensional time obtained from mpFoam
simulation with different εs,c and analytical solution.
Figure 4. Schematics of validation case setup for both mpFoam and ALE solver.
radius was placed in a computational domain of dimension 2.1 mm × 1.5 mm × 1.5 mm. The sphere was located
at −700 µm away from the left-side inlet and at the center of y–z plane. At the inlet, the solution flows at a speed
of u 0 = 100 µm
s and has a concentration of reactant that corresponds to C0 = 0.32 m3 . We consider concentration
mol
of barium and sulfate ions to be equal in the simulation cell, as we explained in previous section. The saturation
concentration for barium sulfate at room temperature is Cs = 0.0105 mol m3
. The precipitation reaction follows Eq. (7)
and the reaction constant is taken from the barite precipitation
2
study by Zhen-Wu et al. as k = 1.479 × 10²–9 mmol2 s
38
. The viscosity of the solution is µf = 0.89 × 10⁻⁶ ms and diffusion coefficient for ions is D = 1.4 × 10⁻⁹ ms . The
right-side outlet was set to open to a large reservoir (outlet boundary condition), while other boundaries were
set as symmetry. In turn, barite precipitated on the surface of the sphere followed by continuous growth process.
Figure 5 compares the results from the benchmarking simulations conducted in both mpFoam and ALE
solver. The mpFoam simulation results show good agreement with the ALE solver for both the total volume of
precipitated barite (Fig. 5a) as well as the barium sulfate concentration distribution within the domain (Fig. 5b).
Note, about 1% deviation still exist due to nature difference of interface treatment between DBS and ALE, but
this has a minor impact on the overall results. The snapshots of liquid–solid interface from both solvers at dif-
ferent times are plotted in Figure S1 (see the Supporting Information). Compared to methods like ALE, the DBS
model can handle the coalescence/separation of solid phase rather naturally. An extra case of two grains merge
together due to precipitation was shown in the Figure S2 (see the Supporting Information).
The validation cases described in this section allow us to assume that the mpFoam solver can capture the
interface propagation, fluid flow and chemical reaction accurately. We validate our model against analytical
solution and other numerical method, however, further experimental verifications for different application may
still be valuable considering the application scenario.
Results and discussion
In this section we discuss the application of the solver to study the precipitation process of minerals (particularly,
barite) at pore-scale. We investigated the impact of geometrical constrains and porosity on the precipitation and
reactant transport at pore-scale. Then, the effects of various flow conditions, reaction rate and diffusion coefficient
correction were explored to demonstrate the capability of the solver. The time in each cases was nondimensional-
ized by τ = d 2 /D with d as characteristic length, e.g., the sphere diameter in most cases of this study.
Effect of geometrical constrain and porosity. To investigate the effects of porosity and geometrical
constraints on the precipitation a 3D geometry that includes several spherical particles was constructed similar
Scientific Reports | (2021) 11:3495 | https://doi.org/10.1038/s41598-021-82807-y 6
Vol:.(1234567890)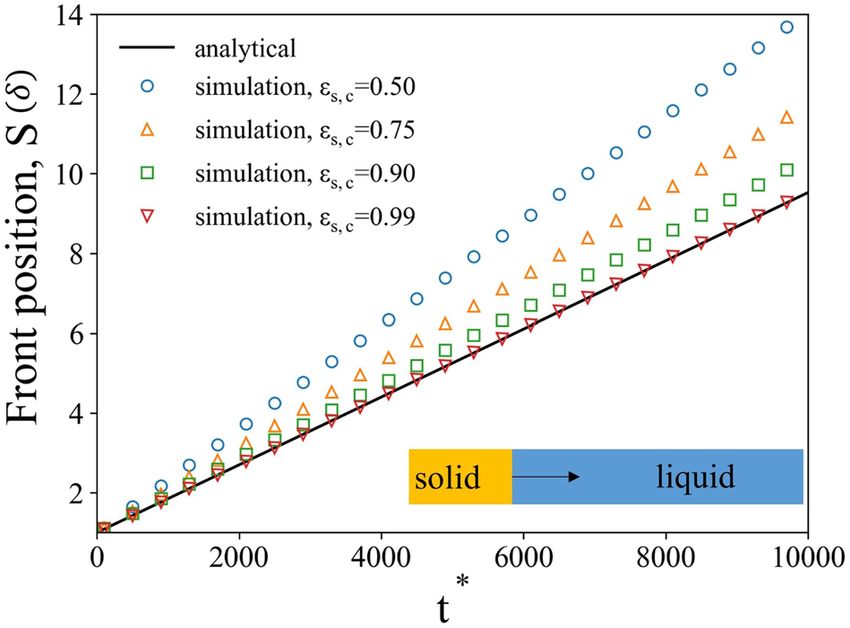
www.nature.com/scientificreports/
Figure 5. (a) Volume of precipitated barite as a function of nondimensional time obtained from mpFoam
simulation and ALE solver (dash lines are 5% error line). (b) Reactive species concentration along the center line
of the sphere from mpFoam and ALE solver.
Figure 6. Schematic representation of a simulation setup for of reactive flow through porous medium.
to the previous studies by Soulaine et al.24. The schematic representation of the simulation system is shown in
Fig. 6. The height (H) and width (W) of the simulation domain were varied to adjust the porosity of the repre-
sentative elementary volumes. The radius of spherical particles is R = 100 µm and the length of the simulation
domain (L) is set as L = 3 mm. Four spherical particles were arranged along the centerline of the simulation
domain in the x-direction along the flow direction. The distance between two particle centers was 200 µm. The
supersaturated
−
solution of barium sulfate flowed into the simulation domain from the left side inlet at a constant
speed of u 0 = 5 µm
s . The saturation index, SI = log(�), of reactive solution at the inlet is 3 (any higher an SI has
resulted in homogenous nucleation in experiments45). The right side boundary was set as an outlet boundary
condition. The other four sides of the simulation domain were set as symmetric boundary conditions to mimic a
large porous medium in both y and z-directions. All other parameters regarding the barite precipitation are the
same as the ones used in the validation case.
To investigate the effect of geometrical constraints on the precipitation process, we gradually change both
the ratios H/d and W/d simultaneously from 1.05 to 1.5 and keep the other inputs unchanged. Such constrains
demonstrate the permeability/porosity changing (reduction of H/d ) in porous materials that−results in reduced
u d
transport of species. To demonstrate the results in terms of Pe number we introduce Pepore = 0 Dpore , where dpore
is the hydraulic diameter of the pore. The total precipitated solid mass was obtained by integrating solid mass
in each cell through the whole computational domain. It was observed that the total precipitated solid mass
decreases as the simulation domain became narrower (see Fig. 7). The total amount of precipitated solid mass
in the H/d = 1.1 (W/d = 1.1) case was only about 55% of the solid mass in the H/d = 1.5 case. Another observa-
tion from the simulation results is that the precipitation follows a linear growth in all cases even though the
geometrical constraint was imposed by shrinking the size of simulation domain.
This difference in total amount of precipitate is likely limited by transport of species from the upstream flow.
As the size of the simulation domain shrinks, the transport pathway from the inlet decreases as well. This effect
correlates with the reactive species concentration distribution as shown in Fig. 8. The concentration gradually
decreases downstream from the inlet due to the consumption of reactive species. For H/d = 1.5, the gradient of
concentration is lower compared to the H/d = 1.1 case. Such observation demonstrates the permeability/porosity
Scientific Reports | (2021) 11:3495 | https://doi.org/10.1038/s41598-021-82807-y 7
Vol.:(0123456789)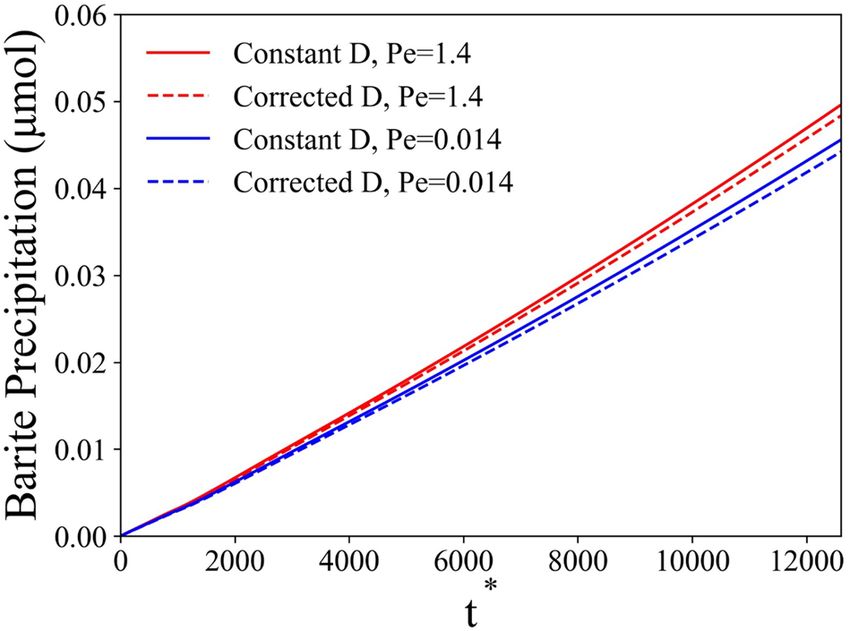
www.nature.com/scientificreports/

                                            Figure 7.  Mass of precipitated solid phase in whole domain as a function of nondimensional time for different
                                            geometrical constrains H/d and Pe.

                                            Figure 8.  Normalized concentration distribution (C/C0, central x–z plane) for different geometrical constraints
                                            case at 100 h simulation time (t ∗ = 12,600).

                                            Figure 9.  (a) Barium sulfate precipitation on each particle as a function of nondimensional time (No. 1–4 left
                                            to right). (b) Precipitation rate on each particle as a function of H/d.

                                            changing (reduction of H/d) in porous materials that results in reduced transport of species, which in turn leads
                                            to the slower precipitation in the whole domain.
                                                Figure 9a shows the total amount of precipitation on each particle as a function of time. Such result was
                                            expected as the Fig. 8 shows that in the vicinity of the front surface of the first spherical particle the reactant
                                            concentration was much higher compared to the particles downstream. Therefore, the precipitation on the surface
                                            of particles downstream is much slower. Additionally, the simulation shows that the precipitate downstream is
                                            more uniformly distributed compared to the first particle. Figure 10 shows the snapshots of solid/liquid interface
                                            at 200 h (t ∗ = 25,200) for different particles. The depletion of the reactant downstream leads to lower reaction rates
                                            due to the surface exposure to lower concentrations. As a result, the precipitate layer on the left side is significantly
                                            thicker than on the right side for the first particle near the entrance. The precipitation rate on each particle as a

          Scientific Reports |   (2021) 11:3495 |                 https://doi.org/10.1038/s41598-021-82807-y                                                       8

Vol:.(1234567890)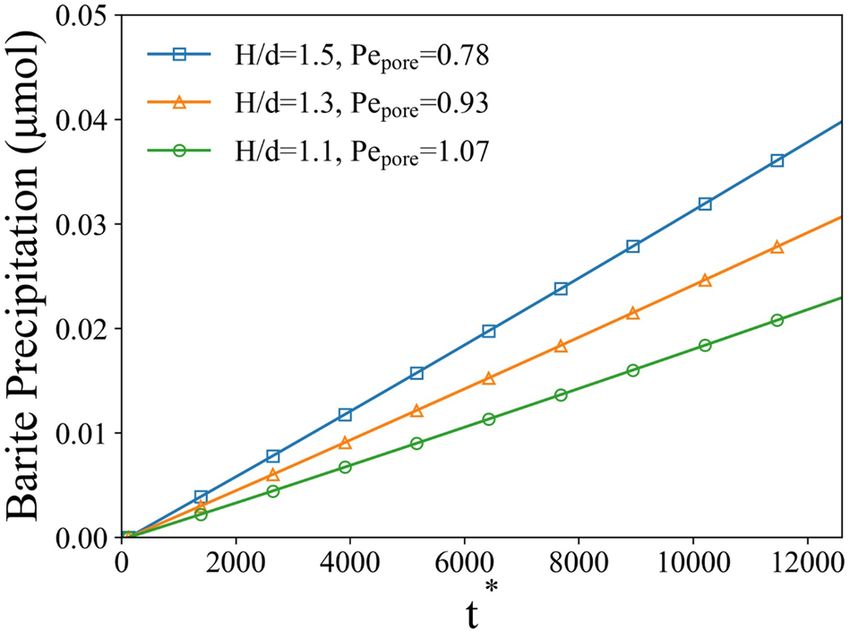
www.nature.com/scientificreports/

                                  Figure 10.  Contour lines of precipitated solid phase (blue: sphere 1, orange: sphere 2, green: sphere 3, red:
                                  sphere 4) on spherical particles at 200 h (t ∗ = 25,200). Black line represents the initial shape of the sphere.

                                  Figure 11.  (a) Precipitated solid phase mass as a function of nondimensional time for different Péclet number.
                                  (b) Precipitation rate on particle as a function of Péclet number.

                                  function H/d is presented in Fig. 9b. As H/d increases (porosity increases), the precipitation rate for all particles
                                  increases as well. However, the precipitation on the first particle dominates compared to the particles behind
                                  it. Due to limitation of scope of this study, we did not explore more complex and realistic pore geometries that
                                  include randomized channels and tortuosity. This is a possible topic for the future studies.

                                  Reaction and transport rates. To demonstrate the capability of the mpFoam solver we chose to simulate
                                  the precipitation on a sphere under different flow and chemical reaction conditions. The simulation setup was
                                  identical to the validation case, i.e., a 100 µm radius sphere was submerged in a bulk solution with reactive
                                  flow (SI−= 3). To quantify the impacts of flow condition, reaction rate and diffusive transport, the Péclet number
                                  ( Pe = uD0 d ) and the second (diffusive) Damköhler number (Da = DC        ṙ0 d
                                                                                                                  0
                                                                                                                    ) were adjusted for the precipitation pro-
                                  cess. The ṙ0 is a reaction rate for Eq. (7) at saturation state calculate at C = C0.
                                      To study the effect of the Péclet number, all other parameters were kept the same as the validation case, while
                                  the inlet flow velocity was adjusted. Figure 11a shows the precipitated amount of barite on the sphere surface
                                  for Pe = 14, 1.4 and 0.14. The precipitated barite on the sphere surface linearly increases with the Pe number.
                                  Figure 11b shows the precipitation rate for different Pe number. As the Pe number steadily increases, the con-
                                  vective transport became more and more important supplying the species for reaction near the sphere surface.
                                  Hence, the precipitation of barite was accelerated compared to low Pe number case. However, the increase of

Scientific Reports |   (2021) 11:3495 |                 https://doi.org/10.1038/s41598-021-82807-y                                                          9

                                                                                                                                                      Vol.:(0123456789)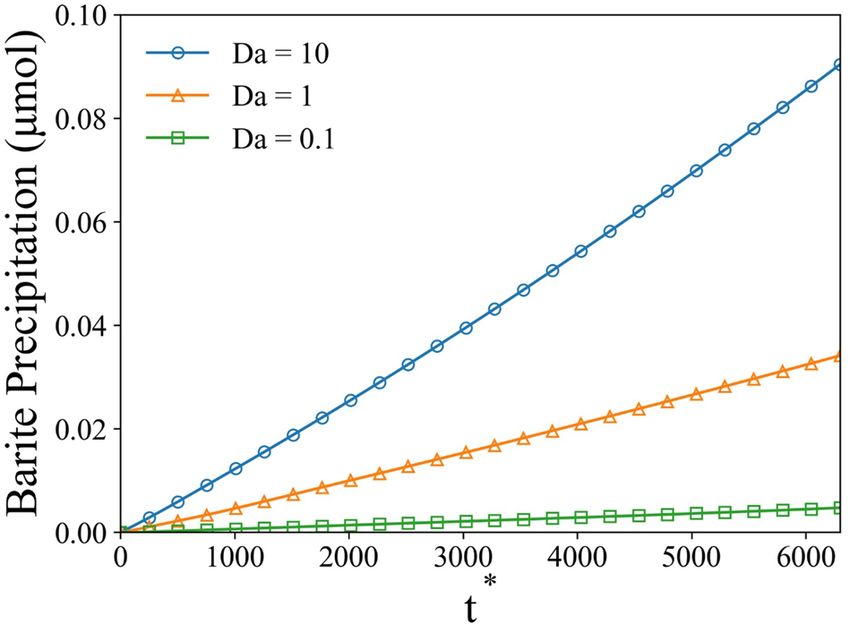
www.nature.com/scientificreports/
Figure 12. Precipitated solid phase mass as a function of nondimensional time for different Damköhler
number at Pe = 1.4.
Figure 13. Regime diagram according to Péclet and Damköhler numbers.
the flow velocity also requires longer computational time as the time step decreases proportionally due to the
Courant–Friedrichs–Lewy number limit, which may cause instability issue if too large. Another observation from
the Fig. 11b is that the precipitation rate obtained from simulations were always lower than the rate predicted
by the open solution model from experiments (dash line). Such a difference was likely due to fact that the spe-
cies concentration near the reactive surface was lower than the bulk solution due to a mixture of transport and
reaction limitations (depending on the flow condition), which was also observed by Molins et al.46 at pore-scale
previously while modeling dissolution of calcite. Here we show the same effect during precipitation of a mineral
who kinetics are much slower than that of calcite. That there is still a strong influence transport on the kinet-
ics suggests that a “kinetics-limited” regime may be difficult to achieve for minerals of geochemical interest in
porous media.
The second Damköhler number was changed by adjusting the reaction rate for the precipitation. The flow
speed was kept at 10 µm/s to constrain the convection effect. As the Da number increased, the total amount of
precipitated barite increased as well (see Fig. 12). Importantly, the growth of precipitated mass was not directly
proportional to the Da number. For instance, as the Da number increased by tenfold from 1 to 10, the total
amount of precipitated mass increased by ~ 3.5 times. Such observation is likely due to the limitation of species
transport, which in turn reduces the local concentration and suppresses the precipitation process.
Figure 13 shows the diagram of precipitation regimes on a sphere in respect to Péclet and Damköhler num-
bers. It was observed that, for Da < 1, the precipitation on the sphere was more uniformly distributed due to the
abundant transport of species and limited reaction. As the reaction rate and Da number increase, the precipitation
was more limited by the diffusion, which resulted in the asymmetry distribution of solid phase. Such observa-
hase24,27. At higher flow velocities ( Pe > 10), the solid
tion is similar to previous studies on dissolution of solid p
phase was formed in an ellipsoid shape as the left side of the sphere had more precipitation compared to right
side of the sphere due to heterogeneous distribution of concentration from advection (see Fig. 8). At lower flow
velocities ( Pe < 10), the advection of species could not outweigh the reaction on solid surface, which resulted
in an elongated shape of solid phase facing the flow direction. This was likely due to combination of limited
advection and diffusion compared to reaction, which was observed by Soulaine et al.24 in dissolution process.
Scientific Reports | (2021) 11:3495 | https://doi.org/10.1038/s41598-021-82807-y 10
Vol:.(1234567890)www.nature.com/scientificreports/
Figure 14. Precipitated solid phase mass as a function of nondimensional time with/without activity correction.
Figure 15. Normalized diffusion coefficient (D/D0) contour lines around a precipitating particle (insert:
Normalized diffusion coefficient along the center line of the particle).
One thing that is different from the dissolution process in precipitation is that, for extremely high Da number,
dendrite formation would be observed47. However, such a scenario is significantly more complex and requires
very detailed studies in the future.
Activity correction to the molecular diffusion. In this section, we study the effect of activity correc-
tion to the molecular diffusion on the precipitation process. The theory for activity correction was introduced in
“Method” section. Similar to Dutka et al.42, the coefficient A was obtained from the low-concentration limit of
the activity coefficient, while the coefficient B was a fitting parameter from the P
HREEQC48 data for barium sul-
fate. In our study, the coefficient A is 0.02984 and the coefficient B is 0.0096 from fitting PHREEQC data. Using
the above activity correction to the diffusion coefficient, we modeled precipitation on the spherical particle (u0
= 10 µm/s). Figure 14 shows the comparison between simulations with a constant diffusion coefficient and
activity corrected diffusion coefficient. As the results have shown, the activity correction only has a moderate
effect on the total amount of precipitated solid mass in case of barite precipitation. Comparing to the constant
diffusion coefficient case, the precipitated solid mass is about 3% lower at 100 h. Further reduce the velocity (u0 =
0.1 µm/s, blue lines in Fig. 14) does not greatly affect the results either. In general, the diffusion coefficient with
activity correction decreased by ~ 7% compared to the diffusion coefficient in bulk. This reflects that the precipi-
tation process is significantly reaction limited. Figure 15 shows the normalized diffusion coefficient ( D/D0) con-
tour lines around the spherical particle. The increase in diffusion coefficient towards the surface is caused by the
consumption of reactive species during heterogeneous precipitation. In general, the activity correction of the dif-
fusion coefficient was not significant enough to affect the precipitation process significantly in the current setup.
Implications for mineral crystal growth modeling. The goal of this part of the study is to demonstrate
the capability of the developed solver on maintaining the shape of the crystal during growth while its surfaces
Scientific Reports | (2021) 11:3495 | https://doi.org/10.1038/s41598-021-82807-y 11
Vol.:(0123456789)www.nature.com/scientificreports/
Figure 16. (a) Geometry of a barite crystal from experiment. (b) Schematics of reaction rate constants assigned
to the surfaces of the crystal with different surface norm. (c) Contour lines of crystal surface at 3 h and 6 h on
the XY plate. (d) Contour lines of crystal surface at 3 h and 6 h on the YZ plate.
have different growth rate, which was not studied using DBS approach in the past. The values of k were fit-
ted following the linear kinetic equation, D∇C · n = ki Ci − Ceq , from barite crystal growth experiments33.
Figure 16a shows the shape and surface directional norms obtained from experimental o bservation33. Three
different crystallographic orientations ((100), (001), (210)) were considered for this simulation and their surface
propagation rates by direction were [100] 30 ± 10 nm/h, [001] 60 ± 10 nm/h, [210] 90 ± 30 nm/h, respectively.
The values of reaction rate constants obtained from surface propagation rates were k100 = 1.442 × 10⁻⁶ m/s, k001
= 2.884 × 10⁻⁶ m/s, k210 = 4.325 × 10⁻⁶ m/s. Figure 16b illustrates different reaction rate constants assigned to
the different surfaces basing on their surface norms by the solver (red for (210),
−
blue for (100)). The transport of
species was controlled by diffusion from bulk, which follows Eq. (6) with u = 0.
The shape of the growing crystal was plotted as contours for the XY and ZY plates, which were marked out
in Fig. 16a. Figure 16c shows the solid–liquid interface contours at 3 h and 6 h on the XY plate. As the results
show, the (210) surface has a faster growth rate than the (100) surface and the tip sharpness pointing to the (010)
was preserved quiet well. Figure 16d shows similar contours for the ZY plate. The rates of surface propagation
rates obtained from simulation were [100] 31 nm/h, [001] 63 nm/h, [210] 93 nm/h, which means that the model
maintains the propagation of the surface well using surface reaction rate constant as a parameter. Overall, the
mpFoam solver can capture the directional growth while maintain the general shape of the crystal. However, it
has resulted in rounding at the edges of some corners of the crystal (Fig. 16d). The DBS model shows that it is
capable of maintains the shape of the crystal during growth, while including different growth rate for surfaces
from experiments. Future work will be directed towards investigating the crystal edge evolution. This may reveal
the average lifetime of fast-growing facets and kinetics of crystal morphology evolution in general.
Summary
In this study, we developed a multiphase micro-continuum solver (mpFoam) based on the Darcy–Brink-
man–Stokes equation. The solver was implemented using an open-source software package—OpenFOAM. We
demonstrated solver’s capability to capture the propagation of the solid interface enhancing this capability by
an adaptive mesh refinement. This solver was validated against analytical solution and currently existing ALE
solver. The evolution of solid phase interface shows a good agreement with both the analytical solution and ALE
solver. This validation demonstrates that the developed solver is capable of simulating the precipitation process
of mineral at pore scale. Also, we have shown that if the sharp interface criterion εs,c was too low, the interface
could be diffusive (occupies several layers of cells) and deviate from the analytical solution.
We used the solver to investigate the precipitation process of barite mineral on solid sphere surfaces under
different conditions. First, the effect of geometrical constrain (reduced porosity) was studied on spheres arranged
as an array with a cubic symmetry. The results have shown that, as the simulation domain shrinks (lower poros-
ity), the total precipitation of barium sulfate decreases. Second, the interplay between the transport and reac-
tion rate were studied in a case of precipitation on a single spherical particle by varying dimensionless Pe and
Da numbers. The results show that the increase in convective over diffusive transport (increasing Pe) enhances
precipitation, however, not significantly. Contrastingly, the increase in reaction rate over the diffusive transport
(increasing Da) resulted in significant acceleration of precipitate growth. We conclude that the flow conditions
are not important in such regimes and the defining processes are happening in the interfacial layer where the
diffusive flux is balanced with the reactive flux. In addition, we implemented an activity correction for the diffu-
sion coefficient based on extended Debye-Hückel theory. The comparison of precipitation rates suggested that
only moderate reduction of precipitation (~ 3%) was observed. However, under longer time-scales, such effects
are critical to include. Lastly, the directional growth of different crystal planes was implemented using aniso-
tropic growth rates. Growth of a single barite crystal was simulated to test this capability of our solver. Resulting
evolution of crystal facets reproduced our previous SEM observations maintaining the shape of the crystal. This
Scientific Reports | (2021) 11:3495 | https://doi.org/10.1038/s41598-021-82807-y 12
Vol:.(1234567890)www.nature.com/scientificreports/
demonstration shows the potential for future studies and development of more robust macroscopic precipitation
models that take into account microscopic/atomistic phenomena.
The versatility of such a DBS model coupled with adaptive mesh method opens a way for broader applications
where the motion of the interface is driven by a surface reaction or a phase transformation. However, to make the
model more realistic and suitable for studying a broader range of reactant concentrations, other features such as
nucleation need to be introduced. It is also expected that future studies including more realistic pore geometries
may improve our understanding of the precipitation process at pore- and meso-scales.
Received: 6 November 2020; Accepted: 21 January 2021
References
1. Crabtree, M., Eslinger, D., Fletcher, P., Miller, M. & Johnson, A. Fighting scale: Removal and prevention. Oilf. Rev. 11, 30–45 (1999).
2. Wigg, H. & Fletcher, M. Establishing the true cost of downhole scale control. in International Conference on Solving Oilfield Scaling,
Aberdeen, Scotland (1995).
3. Stack, A. G. Precipitation in pores: A geochemical frontier. Rev. Miner. Geochem. 80, 165–190 (2015).
4. Brantley, S. L. Kinetics of Mineral Dissolution. In Kinetics of Water-Rock Interaction 151–210 (Springer New York, 2008). https://
doi.org/10.1007/978-0-387-73563-4_5
5. Steefel, C. I., Beckingham, L. E. & Landrot, G. Micro-continuum approaches for modeling pore-scale geochemical processes. Rev.
Miner. Geochem. 80, 217–246 (2015).
6. Ladd, A. J. Numerical simulations of particulate suspensions via a discretized Boltzmann equation. Part 1. Theoretical foundation.
J. Fluid Mech. 271, 285–309 (1994).
7. Kang, Q., Lichtner, P. C. & Zhang, D. Lattice Boltzmann pore-scale model for multicomponent reactive transport in porous media.
J. Geophys. Res. Solid Earth 111, 203 (2006).
8. Kang, Q., Lichtner, P. C. & Zhang, D. An improved lattice Boltzmann model for multicomponent reactive transport in porous
media at the pore scale. Water Resour. Res. 43, S14 (2007).
9. Kang, Q., Lichtner, P. C. & Janecky, D. R. Lattice boltzmann method for reacting flows in porous media. Adv. Appl. Math. Mech.
2, 545–563 (2010).
10. Chen, L., Kang, Q., Carey, B. & Tao, W. Q. Pore-scale study of diffusion-reaction processes involving dissolution and precipitation
using the lattice Boltzmann method. Int. J. Heat Mass Transf. 75, 483–496 (2014).
11. Szymczak, P. & Ladd, A. J. C. Wormhole formation in dissolving fractures. J. Geophys. Res. Solid Earth 114, B6203 (2009).
12. Szymczak, P. & Ladd, A. J. C. Microscopic simulations of fracture dissolution. Geophys. Res. Lett. 31, L23606 (2004).
13. Zhang, J. Lattice Boltzmann method for microfluidics: Models and applications. Microfluid. Nanofluidics 10, 1–28 (2011).
14. Zhao, B. et al. Comprehensive comparison of pore-scale models for multiphase flow in porous media. Proc. Natl. Acad. Sci. USA.
116, 13799–13806 (2019).
15. Lucy, L. B. A numerical approach to the testing of the fission hypothesis. Astron. J. 82, 1013–1024 (1977).
16. Gingold, R. A. & Monaghan, J. J. Smoothed particle hydrodynamics: Theory and application to non-spherical stars. Mon. Not. R.
Astron. Soc. 181, 375–389 (1977).
17. Tartakovsky, A. M., Meakin, P., Scheibe, T. D. & Eichler West, R. M. Simulations of reactive transport and precipitation with
smoothed particle hydrodynamics. J. Comput. Phys. 222, 654–672 (2007).
18. Tartakovsky, A. M., Meakin, P., Scheibe, T. D. & Wood, B. D. A smoothed particle hydrodynamics model for reactive transport
and mineral precipitation in porous and fractured porous media. Water Resour. Res. 42, 5 (2007).
19. Patankar, S. V. Numerical Heat Transfer and Fluid Flow. (1980).
20. Hirt, C. W. & Nichols, B. D. Volume of fluid (VOF) method for the dynamics of free boundaries. J. Comput. Phys. 39, 201–225
(1981).
21. Osher, S., Fedkiw, R. & Piechor, K. Level set methods and dynamic implicit surfaces. Appl. Mech. Rev. 57, B15 (2004).
22. Donea, J., Giuliani, S. & Halleux, J. P. An arbitrary lagrangian-eulerian finite element method for transient dynamic fluid-structure
interactions. Comput. Methods Appl. Mech. Eng. 33, 689–723 (1982).
23. Jones, T. A. & Detwiler, R. L. Mineral precipitation in fractures: Using the level-set method to quantify the role of mineral hetero-
geneity on transport properties. Water Resour. Res. 55, 4186–4206 (2019).
24. Soulaine, C., Roman, S., Kovscek, A. & Tchelepi, H. A. Mineral dissolution and wormholing from a pore-scale perspective. J. Fluid
Mech. 827, 457–483 (2017).
25. Khadra, K., Angot, P., Parneix, S. & Caltagirone, J.-P. Fictitious domain approach for numerical modelling of Navier–Stokes equa-
tions. Int. J. Numer. Methods Fluids 34, 651–684 (2000).
26. Soulaine, C., Roman, S., Kovscek, A. & Tchelepi, H. A. Pore-scale modelling of multiphase reactive flow: Application to mineral
dissolution with production of C O2. J. Fluid Mech. 855, 616–645 (2018).
27. Molins, S. et al. Simulation of mineral dissolution at the pore scale with evolving fluid-solid interfaces: Review of approaches and
benchmark problem set. Comput. Geosci. https://doi.org/10.1007/s10596-019-09903-x (2020).
28. Meakin, P. & Tartakovsky, A. M. Modeling and simulation of pore-scale multiphase fluid flow and reactive transport in fractured
and porous media. Rev. Geophys. 47, RG3002 (2009).
29. Xu, Z. & Meakin, P. Phase-field modeling of two-dimensional solute precipitation/dissolution: Solid fingers and diffusion-limited
precipitation. J. Chem. Phys. 134, 44137 (2011).
30. Xu, Z. & Meakin, P. Phase-field modeling of solute precipitation and dissolution. J. Chem. Phys. 129, 14705 (2008).
31. Wendler, F., Okamoto, A. & Blum, P. Phase-field modeling of epitaxial growth of polycrystalline quartz veins in hydrothermal
experiments. Geofluids 16, 211–230 (2016).
32. Bringedal, C., von Wolff, L. & Pop, I. S. Phase field modeling of precipitation and dissolution processes in porous media: Upscaling
and numerical experiments. Multiscale Model. Simul. 18, 1076–1112 (2020).
33. Godinho, J. R. A. & Stack, A. G. Growth kinetics and morphology of barite crystals derived from face-specific growth rates. Cryst.
Growth Des. 15, 2064–2071 (2015).
34. Frenier, W. W. & Ziauddin, M. Formation, removal, and inhibition of inorganic scale in the oilfield environment (Society of Petroleum
Engineers, Richardson, 2008).
35. Starchenko, V., Marra, C. J. & Ladd, A. J. C. Three-dimensional simulations of fracture dissolution. J. Geophys. Res. Solid Earth
121, 6421–6444 (2016).
36. Voller, V. R. & Prakash, C. A fixed grid numerical modelling methodology for convection-diffusion mushy region phase-change
problems. Int. J. Heat Mass Transf. 30, 1709–1719 (1987).
37. Luo, H., Quintard, M., Debenest, G. & Laouafa, F. Properties of a diffuse interface model based on a porous medium theory for
solid-liquid dissolution problems. Comput. Geosci. 16, 913–932 (2012).
Scientific Reports | (2021) 11:3495 | https://doi.org/10.1038/s41598-021-82807-y 13
Vol.:(0123456789)You can also read