Vulnerability of growing cities to solid waste-related environmental hazards: The case of Mthatha, South Africa - SciELO SA
←
→
Page content transcription
If your browser does not render page correctly, please read the page content below
Jàmbá - Journal of Disaster Risk Studies
ISSN: (Online) 2072-845X, (Print) 1996-1421
Page 1 of 10 Original Research
Vulnerability of growing cities to solid waste-related
environmental hazards: The case of Mthatha,
South Africa
Authors: The rising prevalence of the failure of fast-growing cities’ waste authorities to account for solid
Vuyayo Tsheleza1
waste service function and provide effective solid waste systems poses serious environmental
Simbarashe Ndhleve2
Hlekani M. Kabiti2 hazards and health risks. Household solid waste mismanagement in Mthatha, a fast-growing
Christopher M. Musampa1 city in South Africa with a rapid population increase, is emerging as a major environmental
Motebang D.V. Nakin2 hazard. An effective solid waste audit system could reduce the extent of this problem. This
study aimed at categorising and quantifying household solid waste generation and determining
Affiliations:
1
Department of Biological the drivers of waste generation and mismanagement that have the potential to increase risk
and Environmental Science, and/or vulnerability to household solid waste-related environmental hazards. Stratified
Walter Sisulu University, random sampling was used to select 248 sample households and to categorise them according
Mthatha, South Africa
to upgraded high-density informal residential settlements (64), high-density formal residential
settlements (62), middle-density residential settlements (61) and low-density residential
2
Risk and Vulnerability
Science Centre, Walter settlements (61). The results revealed that the waste generation rate increased one moves from
Sisulu University, Mthatha, informal settlements (1.84 bags of waste per household per week) to low-density, low socio-
South Africa economic statuses (2.26 bags), middle-density settlements (2.39 bags) and low-density
residential settlements (2.84 bags). Food waste was the most commonly generated type of
Corresponding author:
Simbarashe Ndhleve, waste for more than 50% of the respondents. Approximately 89% of the most common types of
sndhleve@wsu.ac.za waste reported across all settlements had the potential to be recycled, reused or composted.
Only four factors emerged as significant determinants (p < 0.05) of the volume of solid waste
Dates:
Received: 28 Feb. 2018
generated per household per week: household socio-economic status, household size,
Accepted: 01 Oct. 2018 knowledge of waste management and household participation in waste separation. Results on
Published: 29 Apr. 2019 drivers of household solid waste generation and variations across residential settlements
could be utilised when designing growing cities’ waste management plans, with the objective
How to cite this article:
Tsheleza, V., Ndhleve, S.,
of reducing the volume of solid waste sent to landfill sites, illegal dumping and open burning
Kabiti, H.M., Musampa, C.M. of waste, thus reducing the associated negative impacts that mismanaged waste poses to the
& Nakin, M.D.V., 2019, environment. Enforcing waste separation at the household level could promote reuse and
‘Vulnerability of growing recycling, which in turn would reduce waste volumes.
cities to solid waste-related
environmental hazards: Keywords: household waste generation; socio-economic drivers; residential density; refuse
The case of Mthatha, South
removal; waste types.
Africa’, Jàmbá: Journal of
Disaster Risk Studies 11(1),
a632. https://doi.org/
10.4102/jamba.v11i1.632 Introduction
Copyright: Solid waste mismanagement is a growing environmental hazard equally affecting fast-growing
© 2019. The Authors. cities from both developing and developed countries (Gutberlet 2018). Human activities generate
Licensee: AOSIS. This work waste and how these wastes are handled, stored, collected and disposed of could pose risks to the
is licensed under the
Creative Commons
environment and to public health (Mohammed & Eyasu 2017). Hoornweg, Bhada-Tata and
Attribution License. Kennedy (2013) indicate that globally, the waste generation rate has risen tenfold since the last
century and is likely to double by 2025. Solid waste generation in Southern Africa has also
escalated as a result of the burgeoning population, rapid urbanisation rates, economic growth and
general improvement in living standards (Fuggle & Rabbie 1994; Muzenda 2014). The amount of
urban waste produced globally is growing faster than the rate of urbanisation (Hoornweg &
Bhada-Tata 2012). Kawai and Tasaki (2016) noted that municipal solid waste generation per capita
ranged from 0.09 kg per day to 5.50 kg per capita per day and the median was 0.94 kg per day. In
sub-Saharan Africa, South Africa has the third highest municipal waste generation per capita of
Read online: 2 kg per person per day after the Seychelles and Comoros, with 2.98 kg and 2.23 kg per capita per
Scan this QR day, respectively (Kawai & Tasaki 2016). There is a general consensus in the literature that
code with your
smart phone or
smartphone or household solid waste generation is directly linked to an area’s socio-economic indicators.
mobile device Growing cities and cities enjoying positive socio-economic indicators should pay attention to
to read online.
household solid waste generation and management as a way of reducing waste-related
http://www.jamba.org.za Open Access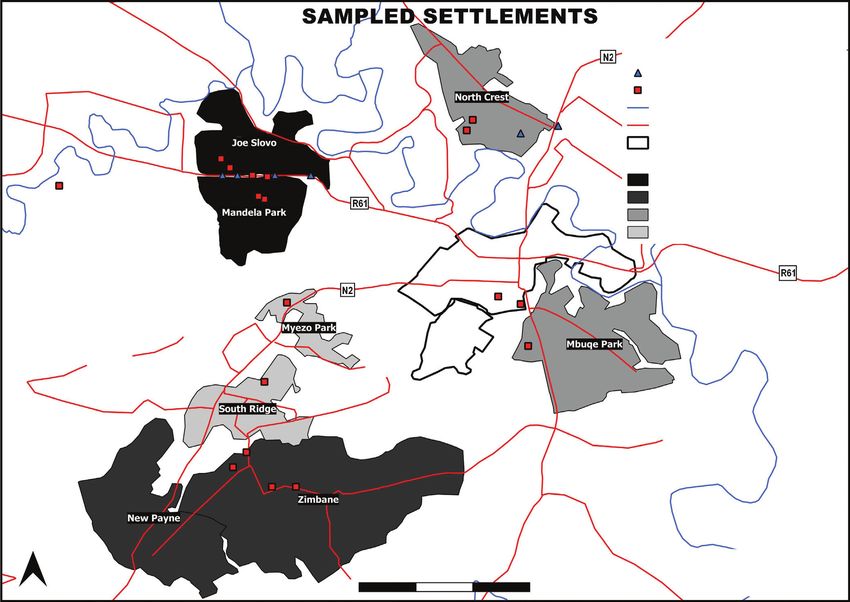
Page 2 of 10   Original Research

environmental hazards. South Africa is already experiencing         challenges requires appropriate schemes (reduce, reuse,
high waste generation per capita; the reported improvement          recycle – the three Rs) and proper disposal to protect the
in its population’s socio-economic indicators and rapid             environment (Ansah 2014). Thanh et al. (2010) emphasised
urbanisation are likely going to exacerbate the vulnerability       that reliable data on household waste generation is the
of many cities to waste management problems. Municipalities         initial step for the successful implementation of an integrated
should therefore prepare their systems for increased solid          waste management planning system in any city. To achieve
waste volumes as a way of reducing their vulnerability to           a sustainable solid waste management system, a waste
waste-related environmental hazards.                                database for a city is required.

It is becoming increasingly expensive for city authorities          Households are at the centre of solid waste generation in any
across the globe to manage solid waste in ways that are             city’s residential areas. Thus, households’ socio-economic
environmentally friendly and protective to human health             factors play a significant role both as risk factors and as key
(Gutberlet 2018). A lack of proper waste management systems         factors in the prediction of vulnerability to solid waste-
results in rampant littering as tons of waste end up                related environmental hazards and solid waste generation,
haphazardly disposed of, posing risks to human health and           and waste management behaviour and practices, respectively
the environment (Igbinomwanhia 2011; Okot-Okumu 2012).              (Miller & Spoolman 2012; Van Beukering et al. 1999).
According to Mohammed and Eyasu (2017), waste is dumped             Households of a similar socio-economic status are likely
on land in an uncontrolled manner, and in most cities openly        to have similar waste generation and management
burning waste, illegal dumping and sending large volumes            characteristics, as reflected by the quantity and composition
of waste to landfill sites are common practices. Waste is           of waste that a household generates (Pandey, Surjan and
dumped in the streets and in drains, thus contributing to           Kapshe 2018). Research into the effects of both household
flooding, the breeding of insect and rodent vectors, the            demographics and socio-economic factors and their
spread of diseases and the uncontrolled release of methane          important link with household waste management behaviour
by anaerobic decomposition of waste. Solid waste that has           is the key to understanding the vulnerability of any city to
been improperly disposed of is a major source of greenhouse         solid waste mismanagement and environmental hazards.
gases that exacerbate global warming (Yadav 2018) and is            Identifying socio-economic and household demographic
generated faster than any other environmental pollutants            characteristics that influence waste generation and disposal
(Hoornweg et al. 2013; Thanh, Matsui and Fujiwara 2010). As         patterns is important for waste management planning
waste generation rates across the globe continue to show an         purposes. This study aimed to categorise and quantify
increasing trend, waste management authorities, especially          household solid waste generation and determine the drivers
in most countries’ fast-growing cities, are bound to fail to        of waste generation and mismanagement that have
account for solid waste service function and to provide             the potential to increase risk and/or vulnerability to the
effective solid waste systems.                                      environmental hazards related to household solid waste
                                                                    across communities in Mthatha, as an example of a fast-
There is a concern that the mismanagement of household              growing city in Southern Africa. In this study, the drivers of
solid waste may be a significant risk factor for environmental      waste generation could equally be referred to as risk factors,
degradation. The inefficiency of most growing cities’ waste         as mismanaged waste poses an environmental hazard and
management systems can be partly attributed to insufficient         results in unhealthy living conditions.
information on waste production, handling and sorting
in developing countries, which is difficult to obtain, given        In addition to the wide array of international agreements that
the lack of records and often-informal nature of waste              promote environmental management and sustainable waste
management and disposal (Aslani & Taghipour 2018).                  management systems, South Africa has its own regulations
Quantitative estimation of household waste is needed to             and policies. The aim is to facilitate sound waste management
estimate the potential and as a basis for a municipal waste         practices that take into consideration the protection of public
management plan. Databases on waste characteristics and             health and the reduction of vulnerability of the environment
generated quantities, including information on drivers,             to hazards, by ensuring the sustainable collection, proper
provide credible information for waste managers and                 treatment and safe disposal of waste. The South African
planners. Gawaikar and Deshpande (2006), Thanh et al. (2010)        National Environmental Management Waste Act (No. 59 of 2008)
and Senzige et al. (2014) highlighted the fact that information     inculcates that sustainable development requires the
about waste characteristics and generated quantities allows         generation of waste to be avoided, or where it cannot be
for the accurate estimation of resource requirements for            avoided, that it be reduced, reused, recycled or recovered,
collection, transportation, processing and disposal of waste        and only as a last resort, be treated and safely disposed of.
generated in a particular area. Senzige et al. (2014) further       The act also highlights the potential for the utilisation of
stressed that proper information on the composition of waste        waste as a resource for creating economic opportunities.
would also enlighten waste management authorities on                Furthermore, the White Paper for Integrated Pollution and
potential environmental hazards and existing opportunities          Waste Management for South Africa (Notice 227 of 2000)
for recycling, composting and energy generation, thus               incorporated waste generation, recovery, transportation,
reducing the amount of waste that the authorities they have to      treatment and disposal in one plan to facilitate holistic and
dispose of in landfill sites. Keeping pace with waste generation    integrated management systems for pollution prevention

                                          http://www.jamba.org.za   Open Access
Page 3 of 10 Original Research
and the minimisation of waste at point sources, in order to peri-urban settlements. The city presents growth trends
monitor pollution of the environment. typical of many cities in sub-Saharan African countries with
some sections organised in a regular manner, having their
At a local level, Mthatha city waste management practices are roots in the colonial era, and unregulated areas with informal
governed by the Environmental Conservation Act (73 of 1998), planning that characterises exponential population growth
which prohibits littering and provides for the authority in following independence (Lupala 2002). Urban transformations
control of public spaces to ensure the public areas are free of following independence are usually not adequately supported
litter through the provision and discarding of litter bags within by infrastructure development and this is common among
a reasonable time. The act is buttressed by the Municipal most fast-growing cities in South Africa, which negatively
Structures Act (17 of 1998), which stipulates that the responsibility impacts service delivery. Subsequently, for most cities the
for waste management is overseen by the local municipalities. quality and distribution of public services and infrastructure
Every municipality in South Africa is required in terms of the like solid waste management facilities, as well as the
Municipal Systems Act to prepare its own Integrated implementation of domestic solid waste programmes and
Development Plan (IDP). One of the elements within the IDP appropriate solutions to management problems, are complex
should be an Integrated Waste Management Plan, which, in and vary spatially within the same city. Thus, for every city,
terms of the National Waste Management Strategy, must effective service delivery requires careful understanding
implement the hierarchical management of waste, with of the city’s development process, spatial distribution of
emphasis on waste avoidance, minimisation and responsible commercial and residential areas (formal and informal
disposal. The Municipal Systems Act also includes recycling as settlements) and the area’s population dynamics, as well as
one of the activities to be promoted by municipalities when the state of and demand for infrastructure.
setting tariffs for waste management services. In Mthatha,
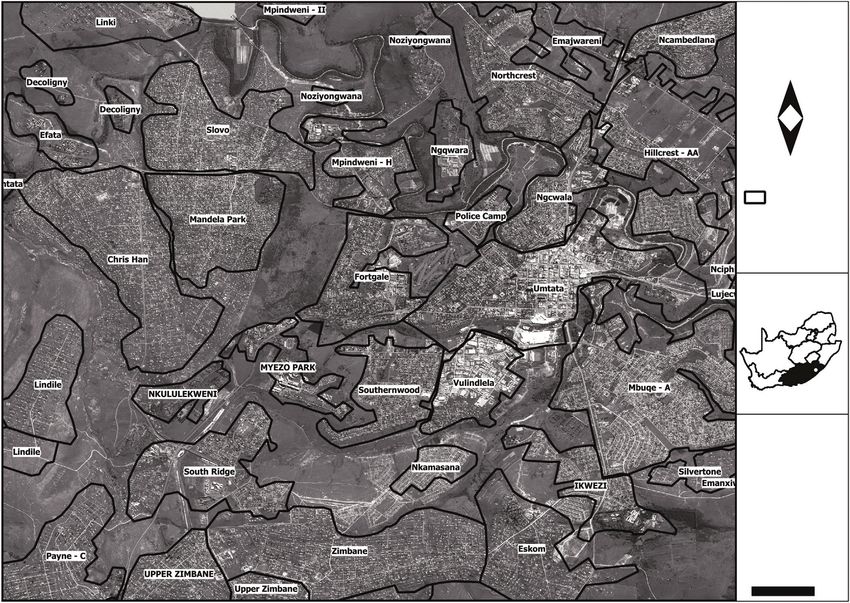
waste collection and transportation services are provided by Figure 1 shows a map of Mthatha, the residential settlements
the municipality. The waste is transported to designated and the road network.
dumping sites (DEDEA 2009). However, the municipality does
not provide any waste recycling services but rather leaves that About 137 589 people live in Mthatha (StatsSA 2012). The
role to private companies and individuals. According to town caters for the needs of over 1.5 million people who live
Buso, Nakin and Abraham (2014), there exists a disconnect within a 230-km radius of the Transkei region (OR Tambo
across solid waste management parameters such as distribution, District Municipality ([ORTDM] 2013). Mthatha’s spatial
size and type of household waste collection bins, juxtaposed development trends, especially the development of both the
with the waste generation capacity and population density in informal and formal settlements, and the spatial growth of
Mthatha. Although it is the responsibility of the local its peri-urban settlements, reflect most of Southern Africa’s
municipality to provide waste management services, a number fast-growing cities. The city in its entirety has 3 low-density
of challenges and shortfalls are notable, particularly within residential areas, 7 middle-density residential areas, 9 high-
rural, formal residential and informal residential settlements density–low-income residential settlements and 11 high-
(Satterthwaite, Sverdlik & Brown 2018). The segregated density–low-income informal settlements.
provision of waste management services was also noted in a
study carried out by Sibanda, Obange and Awuor (2017).
About two-thirds of its citizens live in poverty, with 52%
Consequently, illegal waste dumping and burning is a prevalent
being formally unemployed (Harrison 2008). The educational
practice in Mthatha (Buso et al. 2014; DEDEA 2009). The
level of residents is an important determinant of both
provision of services is skewed towards the high-income
household waste generation and management. According to
settlements, while the urban poor are often left with the burden
the Community Survey (2016), 62.7% of the population in
of solid waste management, which exposes them to unhealthy
Mthatha has completed Grade 9 or higher. This proportion is
living conditions (Kubanza & Simatele 2016).
higher than the regional percentage of 58% and a little less
than the provincial proportion of 64.6%. The town is generally
Study area made up of professionals, non-professionals, semi-skilled
Mthatha is a city in South Africa that presents a perfect workers, unskilled workers, business people and the
example of a rapidly urbanising city in sub-Saharan Africa. unemployed (Chireshe et al. 2010). The notably higher
Mthatha is the third largest town in the Eastern Cape province proportion of the educated population in Mthatha is an
of South Africa and is the only town within a 230-km radius important resource for waste management.
of the Transkei region, serving as an economic and social hub
to eight functionally lower-ranked towns in the region Table 1 shows that municipal solid waste collection services
and the surrounding rural settlements (ORTDM IDP 2013). in Mthatha favours low- and middle-density residential
From the city centre, Mthatha exhibits layers of both settlements while neglecting upgraded informal settlements
commercial and residential settlement patterns that consist of and high-density formal residential settlements. High-
varying house forms, densities, spaces and differentiated density formal and informal residential settlements tend to
spatial qualities. The general structure of Mthatha is practise personal removal of waste including open dumping
dominated by high-density settlements located on both the and/or burning of waste (Poswa 2001; Sikrweqe 2013; Stats
eastern and western sides of the city centre, as well as a SA 2012). The principal reasons for neglecting these areas
number of low- and middle-density settlements and spacious are non-payment of municipal rates and lack of
http://www.jamba.org.za Open AccessPage 4 of 10 Original Research
MTHATHA
SETTLEMENTS
N
Legend
Se
lements
SOUTH AFRICA, EASTERN
CAPE PROVINCE,
MTHATHA
0 1 km
km, kilometre.
FIGURE 1: Map showing residential settlements and road network in Mthatha.
TABLE 1: Description of waste management practices in the investigated communities.
Residential settlement status Location name Area (km2) Number of households Population density (p/km2) Weekly refuse removal (%) Own refuse
removal (%)
Informal settlements Joe Slovo 4.69 3583 2621.00 0.9 99.1
Mandela Park 3.32 3347 3448.00 2.2 97.8
High-density Zimbane 1.24 336 269.00 0.0 100.0
New Payne 8.13 2659 1260.00 0.7 99.3
Middle-density Mbuqe Park 3.48 1709 489.02 100.0 0.0
North Crest 2.11 2138 1011.10 100.0 0.0
Low-density Myezo Park 1.30 109 83.84 100.0 0.0
South Ridge 1.93 348 180.42 100.0 0.0
Source: Statistics South Africa (Stats SA), 2012, Census 2011, viewed 02 April 2015, from https://www.statssa.gov.za/publications/P03014/P030142011.pdf.
infrastructure, with the latter being the main reason in high-density formal and informal settlements. South Africa’s
informal settlements. Recent reports from the Community Department of Environmental Affairs (DEA) (2012) reported
Survey (2016) show that only 15.5% of households are that every year in South Africa approximately 59 million
receiving refuse disposal services from a local authority and tons of waste ends up in the environment and only 10% is
71.0% of the households practise personal removal of waste. recycled, posing an environmental hazard. Discriminatory
Sikrweqe (2013) also noted as a common practice among waste collection practices by waste authorities that favour
some residential settlements could result in an increase in
most municipalities that high-density formal and informal
the number of illegal dumpsites and household burning of
settlements do not receive refuse removal. Municipal
waste, thus harming the environment.
authorities’ failure to provide waste collection services to
some households is a huge driver of households’
mismanagement of waste. While promoting mismanagement Methodology
of waste at a household level, the practice results in an A multistage sampling procedure was used in this study.
increase in illegal dumping sites, which are common in Eight residential areas in Mthatha were categorised according
http://www.jamba.org.za Open AccessPage 5 of 10 Original Research
Legend
Skip bins
Illegal dump sites
Rivers
Roads
Central business district and commercial area
Sample selements
Upgraded high-density informal selements
High-density formal selements
Medium-density selements
Low-density selements
N
0 1 2 3 km
km, kilometre.
FIGURE 2: Map showing the investigated communities in Mthatha.
to density, and stratified random sampling was applied. All waste generation. The socio-economic variables of interest in
the residential settlements in Mthatha were categorised into this study were age, gender, household size, employment
four classes: high-density upgraded informal settlements, status, education level and income level.
high-density formal settlements, middle-density residential
settlements and low-density residential settlements. In this Figure 2 illustrates the investigated residential settlements
study, household density was adopted as a proxy for in Mthatha, grouped into four different formal settlement
household socio-economic status. The study focused on the patterns, the fourth being informal settlements. It also shows
different residential settlements based on density because the road network, as well as legal and illegal dumping sites
households from these categories differ significantly in terms spotted by researchers during data collection (the latter
of socio-economic status, waste generation, management represented by red squares).
and municipal provision of services (Senzige et al. 2014).
Furthermore, high-density residential settlements were
Low-density residential settlements are inhabited by high
categorised into upgraded informal settlements and formal
socio-economic status households and these have the
settlements; this was deemed necessary because these
lowest population density. Subsequent to this group are
two types of settlements resemble different development
medium-density residential settlements, whose inhabitants
processes, which has a strong bearing on municipal delivery
are usually households belonging to the middle socio-
of waste management services, infrastructure development
and level of organisation. Household waste generation economic status category. Both low-density and medium-
and management and the provision of municipal services to density residential settlements receive weekly refuse removal
these residential areas differ significantly. Two residential from the municipality. The third category is high-density
settlements were then randomly selected from the four residential settlements. In this study, the high-density
categories. Approximately 30 households were randomly residential settlements were further divided into two
selected from each location. A house-to-house survey was categories: formal high-density residential settlements and
done systematically using a structured questionnaire to upgraded informal high-density residential settlements.
gather data on household socio-economic variables and These two harbour the highest population density and their
http://www.jamba.org.za Open AccessPage 6 of 10 Original Research
inhabitants have the lowest socio-economic status, relative to show consistency with the national norm (Stats SA 2012).
low- and medium-density residential settlements. However, Female-headed households are dominant across most
unlike high-density formal settlements, informal settlements communities in South Africa. Using gender of head of
are unregulated and generally excluded from public-sector household as a proxy indicator for household involvement in
resources. Even where the city government chooses to waste management, Mattos, MacKinnon and Boorse (2012)
provide door-to-door waste collection services to these found that there is a relatively higher participation in
settlements, it is impractical because of infrastructural waste management among female-headed households than
challenges, and where possible it is reportedly very irregular male-headed households. The domination of female-headed
and unreliable. It is interesting to note that most upgraded households in Mthatha may undoubtedly and positively
informal settlements lack the infrastructural capacity for contribute to waste management at large. The four
waste management. Thus, cities require a different waste communities are therefore expected to generate less waste
management strategy that addresses the demands of and manage it in a sustainable manner.
upgraded informal settlements differently. Therefore,
analyses of this nature that seek to note differences in waste Mean household size for the four residential areas ranged
management practices between high-density formal from four to six members per household. Households from
residential settlements and high-density upgraded informal formal high-density residential settlements and middle-
settlements will likely produce results that are suitable for density residential settlements had the highest household
scaling up and replication. In many cities it is common for sizes as compared to their counterparts in upgraded informal
30% – 60% of the urban population to live in informal and low-density settlements. Household heads aged 46
settlements (Campos & Zapata 2014). Informal settlements years and above dominated middle-density and low-density
represent a universal phenomenon that many countries residential settlements. The dominant age group in high-
suffer from, and it is one of the major phenomena density and informal settlements was 31–45 years of age (see
accompanying the accelerated urbanisation process Table 2). As expected, respondent households from low-
worldwide (Khalifa & Khalid 2014). density and middle-density residential settlements were
more educated; 87% and 72% respondents had attained
Data was entered in Microsoft Excel and subsequently tertiary certificates, respectively. Respondents with
transferred to SPSS (version 17) (Chicago, IL, United States) secondary education dominated in informal and formal
for statistical analysis. Proportion, mean and standard high-density residential settlements. According to
deviation (SD) were calculated for all households’ socio- Etengeneng (2012), households with higher levels of
demographic information. Data on household solid waste
generation (household waste characterisation and TABLE 2: Household demographics for selected communities – Socio-economic
demographics.
quantification) was split into four groups (upgraded high-
Household Upgraded Formal Middle- Low-
density informal settlements, low-income, middle-income demographic high-density high-density density density
variables informal residential residential residential
and high-income households). Following this, a multiple settlements settlements settlements settlements
logistic regression analysis was performed to determine the (%) (%) (%) (%)
(N = 64) (N = 62) (N = 61) (N = 61)
drivers of household solid waste generation. Lastly, multiple Gender of head of households
comparison analyses were employed to detect any statistically Male 36.00 40.00 38.00 31.00
significant difference in terms of number of bags of solid Female 64.00 60.00 62.00 69.00
waste generated per household per week between the four Age
socio-economic statuses. 15–30 years 27.00 35.00 21.00 13.00
31–45 years 48.00 40.00 33.00 25.00
Results and discussions
46 and above 25.00 24.00 46.00 62.00
Household size
Household demographics Mean 4.42 6.25 5.13 4.49
SD 2.31 2.56 1.78 1.10
Table 2 shows the summarised socio-economic demographic Educational level
characteristics of the sampled households categorised into No formal education 13.00 8.00 2.00 2.00
informal settlements, low-income, middle-income and high- Primary 22.00 19.00 3.00 0.00
income households. Household socio-economic demographic Secondary 39.00 39.00 23.00 15.00
characteristics are important in waste management as they Tertiary 27.00 34.00 72.00 84.00
Employment status
influence the type and quantity of waste generation and its
Employed 47.00 37.00 48.00 54.00
overall management in any setting (Etengeneng 2012; Parfitt,
Unemployed 27.00 29.00 15.00 5.00
Flowerdew & Doktor 1994; Van Beukering et al. 1999).
Self-employed 16.00 24.00 15.00 33.00
Pensioner 8.00 2.00 18.00 8.00
Table 2 shows that female-headed households were more Student 3.00 8.00 5.00 0.00
common than male-headed households (all above 60%) in Income level
all four categories, with low-density residential settlement Below R2500.00 47.00 50.00 25.00 2.00
households showing the maximum percentage of 69%. R2500.00 – R10 000.00 41.00 19.00 23.00 2.00
These results are comparable to Sikrweqe (2013) and Above R10 000.00 12.00 31.00 52.00 96.00
http://www.jamba.org.za Open AccessPage 7 of 10 Original Research
education tend to have a more positive attitude towards This presents a possible recycling opportunity and strong
waste management. Conversely, households with a lower case for promoting markets for waste recycling. However,
level of education tend to be ignorant or unaware of there was no evidence of separation at source; household
the impact of generating huge volumes of waste and its waste with the potential of being recycled was mixed with
effects on the environment (Parfitt et al. 1994). Informal other waste types in one bag, taken by a collection truck and
settlements (27%) and middle-density settlements (48%) sent to a sanitary landfill site. Waste separation at source has
had the highest percentage of unemployed respondents. the potential to improve household solid waste recycling and
The level of unemployment definitely implies that there thus increase municipal solid waste management efficiency
is a possibility of labour that can benefit solid waste (Mian et al. 2017). To improve recycling and reduce waste
recycling activities. Waste recycling can help to reduce waste transported to landfill sites, Mian et al. (2017) recommend
volumes directed to landfill sites and increase the lifespan of that recycling and separate collection of waste be included as
a landfill (Adogu et al. 2015). Thus, the observed variations part of municipal responsibilities. Source separation of
across the four residential settlements in terms of socio- households’ solid waste improves the proportion of waste
economic indicators are expected to have a significant recycling.
impact on household solid waste management practices,
thus impacting the city’s vulnerability to environmental With regard to food waste, the results are similar to the
hazards.
study conducted by Ojeda-Benitez, De Vega and Ramí
(2003), Asare, Andrews and Asare (2015) and Qu et al.
Waste characterisation and quantification (2009), who found that food waste is the highest contributor
Household solid waste includes many different waste types to solid waste as compared to all other domestic wastes.
and a number of household products that can pose a risk to Food waste falls under organic waste. The studied
the environment and human health. Thus, the necessity of an communities could benefit through composting, thus
assessment of household solid waste composition concerning reducing waste volumes transported to landfill sites.
the presence of waste types that could pose risk to the According to Ojeda-Benitez et al. (2003), a high volume of
environment cannot be overemphasised. Furthermore, the organic waste presents an opportunity for recycling through
characterisation and quantification of waste can contribute organic waste composting. High volumes of food waste
to proper decision-making for the solid waste strategy and other organic waste can negatively impact the
(three Rs) of a city as knowledge on these key ingredients environment. Untreated and unmanaged food waste creates
determines the required investment for the city (Chung 2015; odour and hygiene concerns and causes adverse
Gawaikar & Deshpande 2006). environmental impacts (Khoo, Lim & Tan 2010). Thus, the
high composition of organic waste in the generated
Generated waste types household waste presents a significant waste hazard if the
The household waste composition data presented in Table 3 waste is not properly managed or sent to landfill sites.
shows the proportion of different types of waste found Biodegradation of household solid waste produces acidic
among the investigated households. Households’ solid waste and alkaline organic pollutants and other pathogens with
per week was dominated by food waste. Food waste (55%) the ultimate production of leachate with heavy metal,
was the most common type of waste reported across all which causes serious surface and ground water
the sampled households. Respondents from informal contamination (Khoo et al. 2010). Different waste types
settlements (14.1%) reported papers and plastics as the present varying environmental impacts if not managed
highest contributors to their waste. Nineteen per cent of the well or when sent to landfill sites; the same waste types
households in informal settlements reported that disposable present an important economic opportunity if suitable
nappies were the highest contributor to solid waste. treatment or conversion options are undertaken. Thus, a
significant reduction of environmental impacts can be
A bigger proportion of waste types collected in all four realised by implementing recycling and reuse processes.
settlement categories has a potential to be recycled. Glass was recorded as the lowest contributor to solid waste,
with only 3%. This is comparable to a study by Qu et al.
TABLE 3: The most common types of waste according to socio-economic status – (2009), in which glass accounted for the least generated
Characteristics of generated waste.
Waste Upgraded High-density Middle- Low-density All waste type. In addition to these findings, illegal open
types informal residential density residential households dumping of solid waste is the most common practice for the
residential settlements settlements settlements (%)
settlements (%) (%) (%) disposal of waste in upgraded informal settlements (see
(%)
Figure 2).
Food waste 46.9 38.7 65.6 70.5 55.2
Plastic 14.1 12.9 9.8 3.3 10.1
Papers 14.1 12.9 11.5 4.9 10.9 Generated waste quantities
Tins and 6.3 25.8 4.9 1.6 9.7 Understanding the waste volume generated at the household
metals
Glass 0.0 3.2 1.6 8.2 3.2 level is important for efficient waste management practices,
Disposable 18.8 6.5 6.6 11.5 10.9 especially with regard to collection. Household solid waste
nappies generation is a core indicator of environmental pressure, and
http://www.jamba.org.za Open AccessPage 8 of 10 Original Research
this is usually measured in weight or volume (Kawai & waste generated per household per week across the four
Tasaki 2016). Following the volume-based waste accounting socio-economic statuses as determined by one-way analysis
system, the recommended number of municipal-sized bin of variance (ANOVA) (F = 7.349, p = 0.000). Furthermore, a
bags per household per week is three bags. Table 4 presents Tukey post hoc test revealed that the number of waste bags
the reported average number of bags generated per generated per household per week was significantly lower
household per week in line with the volume-based waste for households from high-density formal residential
accounting system. The reported maximum number of bags settlements (p = 0.026) and high-density upgraded informal
generated per household per week was six for all socio- settlements (p = 0.000) when compared to households from
economic status in Mthatha. low-density residential settlements. There was no statistically
significant difference between volumes of solid waste
The reported average number of bags per household per generated per household per week between residents of (1)
week showed a slight increase upon moving from high- middle-density and high-density residential settlements and
density informal settlements (1.84 bags) to low-density (2) low-density and middle-density residential settlements.
residential settlements (2.84 bags). This means that in this The identified differences in volumes of waste per household
study, households from low-density residential settlements per week between high-density settlements and low-density
generated higher volumes of waste than their counterparts. residential settlement have important implications for
Similarly, Moftah et al. (2016) reported that in Tripoli City, effective waste management.
Libya, the majority of households in low-density residential
settlements generated high volumes of solid waste. Low- Similar findings regarding an increase in waste generation
density residential settlements are usually inhabited by from high-density residential settlement to low-density
households of a higher socio-economic status. Thus, a residential settlement households were reported by Ojeda-
conclusion can be made that waste volumes increase from Benitez et al. (2003) and Asase (2011). Affluence results
low to high socio-economic status households. Therefore, in high levels of consumption and the waste of resources
municipal solid waste management strategies and systems (Miller & Spoolman 2012). At a household level, the increased
should take note of households’ socio-economic status and standards of living result in increased consumption and this
important residential settlement boundaries. increases the amount of waste generated (Van Beukering et
al. 1999). Miezah et al. (2015) and Moftah et al. (2016) found
Comparison of different residential settlements that middle-class communities generated less waste than
The mean average number of bags of solid waste generated low-class communities.
per household per week showed a positive correlation with a
slight increase as we move up the four socio-economic Drivers of waste generation
statuses shown in Table 5. Thus, socio-economic status has an Relative to households in upgraded informal settlements,
influence on waste generation. There was a statistically Table 6 shows that households in low-density residential
significant difference between the average number of bags of settlements had a significantly higher chance of generating
more bags of waste. The household size positively affected
TABLE 4: Number of municipal-sized bags generated per household per week in the number of bags generated per household. However,
Mthatha, South Africa (N = 248). households with a higher number of males (B = 0.211, CI =
Socio-economic status N Maximum Mean
0.082 ± 0.340, p ≤ 0.001) had a higher chance of generating
Upgraded high-density informal settlements 64 6 1.84 ± 1.21
more bags of waste than those with a higher number of
High-density settlements 62 6 2.26 ± 1.08
females (B = 0.138, CI = 0.046 ± 0.230, p ≤ 0.004). Knowledge
Middle-density residential settlements 61 6 2.39 ± 1.21
Low-density residential settlements 61 6 2.84 ± 1.32 of waste management and waste separation practises
N, number. decreased the number of bags generated (B = -0.434, CI =
-0.756 ± 0.112, p ≤ 0.008 and B = -0.313, CI = -0.633 ± 0.007,
TABLE 5: Summary of statistics comparing the quantity of solid waste generated p ≤ 0.055, respectively).
per household per residential settlement in Mthatha, South Africa (N = 248).
Average quantity of waste generated per Difference† Std. error p
household per week (bags/week) Wealthier individuals are likely to throw away more plastic,
Middle-density residential settlements–low- 0.1676 0.2160 0.865 metallic, glass and hazardous waste than poor individuals
density residential settlements
(Chandra & Devi 2009). Affluence, associated with people in
Middle-density residential settlements– 0.5497 0.2144 0.053**
upgraded high-density informal settlements high-income areas, causes an increase in the consumption of
Low-density residential settlements–middle- 0.4426 0.2169 0.176 goods and services and this results in increased proportions
density residential settlements
of disposable materials, especially packaging materials
High-density residential settlements–upgraded 0.3821 0.2135 0.281
high-density informal settlements (Medina 2010; Van Beukering et al. 1999).
Low-density residential settlements–high- 0.6103 0.2160 0.026*
density formal settlements
A significant positive relationship between household size
Low-density residential settlements–upgraded 0.9923 0.2144 0.000*
high-density informal settlements and waste generation is not peculiar. High household size
*, Statistical significance at the 10% confidence level. implies a higher level of waste generation (Agbesola 2013;
**, Statistical significance at the 5% confidence level. Ansah 2014). Further inferential analyses show that
†, Difference between quantity of solid waste generated per household per residential
settlement. households with more males generate more waste than
http://www.jamba.org.za Open AccessPage 9 of 10 Original Research
TABLE 6: Multiple regression analysis of drivers of household waste generation posed by the mismanagement of waste. This study outlined
in Mthatha, South Africa (N = 248).
Household demographic variables B 95% CI p
household solid waste generation rate per week, waste types
Constant 2.386 1.076 ± 3.696 0.000 and household socio-economic drivers of waste generation per
Gender of head of household† -1.112 -0.418 ± 0.193 0.469 week. Different residential settlements, categorised by density,
Socio-economic status generate varying volumes of solid waste. Household
Informal settlements - - - demographic factors such as income, household size, education
High-density settlements -0.090 -0.532 ± 0.351 0.687 and gender composition play a key role in the determination of
Middle-density settlements 0.234 -0.228 ± 0.697 0.319 the amount and types of solid waste generated per household
Low-density settlements 0.661 0.134 ± 1.188 0.014**
per week. The results of drivers of household solid waste
Age -0.074 -0.278 ± 0.130 0.477
generation and variations across residential settlements could
Household size
Male 0.211 0.082 ± 0.340 0.001*
be utilised when designing growing cities’ waste management
Female 0.138 0.046 ± 0.230 0.004* plans with the objective of enhancing efficiency and reducing
Educational level -0.015 -0.215 ± 0.185 0.881 solid waste going to landfill sites. City waste management
Employment status‡ 0.188 -0.040 ± 0.215 0.170 policies should take cognisance of the residential settlement-
Income level 0.091 -0.147 ± 0.329 0.453 related waste variations in addressing associated challenges.
Knowledge on waste management§ -0.434 -0.756 ± 0.112 0.008* Enforcing waste separation at the household level could
Practising waste separation¶ -0.313 -0.633 ± 0.007 0.045**
promote reuse and recycling, which in turn would reduce
CI, confidence interval; B, Beta coefficient.
waste sent to landfill sites and reduce the negative
*, Statistical significance at the 1% confidence level.
**, Statistical significance at the 5% confidence level. environmental impacts posed by solid waste.
†, male – 1; female – 2.
‡, unemployed – 1; employed – 2.
§, no – 0; yes – 1. Acknowledgements
¶, no – 0; yes – 1.
This study was supported by the Walter Sisulu University’s
Risk and Vulnerability Science Centre, Department of Science
female-dominated households. Males and females have
and Technology and National Research Fund. The authors
different attitudes and perceptions towards public health
would like to express their gratitude to everyone who
and household cleanliness. Women are usually responsible
supported the work or contributed to in making this study a
for the salvaging of waste (Lutui 2001). Information on
demographic distribution, especially household size and success.
household gender distribution, is crucial when planning the
waste management activities of any city. Competing interests
The authors declare that they have no financial or personal
A knowledge of waste management decreases waste generation
relationships that may have inappropriately influenced them
at the household level. An awareness refers to the ability of the
in writing this article.
household’s inhabitants to correctly manage the generated
waste at the household level and to convert it to a valuable
resource (Ojeda-Benitez et al. 2003). These households tend to Authors’ contributions
have a more positive attitude and practice towards waste V.T. is a master’s student who conducted the research. S.N.
management because of their increased knowledge of waste and H.M.K. were mainly responsible for the development
issues (Etengeneng 2012). An awareness of waste management and writing of the article. C.M.M. and M.D.V.N. were mainly
is key to alleviating waste management challenges in many responsible for research supervision and technical input in
cities. Thus, environmental education that promotes waste the writing of the article.
separation, reuse, recycling and waste reduction should be
prioritised.
References
Households practising waste separation understand the Adogu, P.O.U., Uwakwe, K.A., Egenti, N.B., Okwuoha, A.P. & Nkwocha, I.B., 2015,
‘Assessment of waste management practices among residents of Owerri Municipal
importance of minimising waste. Source separation Imo State Nigeria’, Journal of Environmental Protection 6(5), 446. https://doi.
enhances the recycling of valuable materials, protecting org/10.4236/jep.2015.65043
recyclables from contamination and promoting usability. Agbesola, Y., 2013, ‘Sustainability of municipal solid waste management in Nigeria: A
case study of Lagos’, Master’s thesis, viewed 12 November 2016, from https://
This reduces the number of waste bags generated at the pdfs.semanticscholar.org/c0aa/8c20133eced1c847cc60cb08db547433d5b4.pdf
household level (Fiehn & Ball 2005). Source separation Ansah, B., 2014, ‘Characterization of municipal solid waste in three selected
communities in the Tarkwa township of Tarkwa Nsuaem Municipality in Ghana’,
relieves pressure on scarce raw materials and reduces Doctoral dissertation, Department of Theoretical & Applied Biology, Kwame
environmental problems (Fiehn & Ball 2005; Kamara 2009). Nkrumah University of Science and Technology, Ashanti, Ghana.
Asare, W., Andrews, A. & Asare, R., 2015, ‘Households solid waste generation and
disposal in some selected communities in Ejisu–Juaben Municipality, Ghana’,
Conclusion Journal of Scientific Research & Reports 6(5), 371–382. https://doi.org/10.9734/
JSRR/2015/15361
An inadequate account of waste types, volumes and drivers of Asase, M.A.D., 2011, ‘Solid waste separation at source: A case study of the Kumasi
Metropolitan Area’, Doctoral dissertation, Kwame Nkrumah University of Science
household solid waste generation are some of the challenges and Technology, Ashanti, Ghana.
faced by growing cities in their pursuit to improve waste Aslani, H. & Taghipour, H., 2018, ‘Seasonal characterization and quantification of
municipal solid waste: Energy content and statistical analysis’, Journal of Advanced
management systems and reduce the environmental impacts Environmental Health Research 6(1), 34–43.
http://www.jamba.org.za Open AccessPage 10 of 10 Original Research
Buso, S., Nakin, M.D.V. & Abraham, A., 2014, ‘Assessing the physical planning and Medina, M., 2010, ‘Brazil: The world’s largest and most dynamic scavenger movement’,
management of waste in the O.R. Tambo District Municipality: Implications for BioCycle 51(10), 32–33.
management’, WIT Transactions on Ecology and the Environment 180, 125–136.
https://doi.org/10.2495/WM140111 Mian, M.M., Zeng, X., Nasry, A.A.N.B. & Al-Hamadani, S.M., 2017, ‘Municipal solid
waste management in China: A comparative analysis’, Journal of Material Cycles
Chandra, Y.I. & Devi, N., 2009, ‘Studies on municipal solid waste management in and Waste Management 19(3), 1127–1135. https://doi.org/10.1007/s10163-016-
Mysore city: A case study’, Report and Opinion 1(3), 15–21. 0509-9
Chireshe, R., Jadezweni, J.M., Cekiso, M. & Maphosa, C., 2010, ‘Poverty: Narratives Miezah, K., Obiri-Danso, K., Kádár, Z., Fei-Baffoe, B. & Mensah, M.Y., 2015, ‘Municipal
and experiences of street children in Mthatha, Eastern Cape, South Africa’, Journal solid waste characterization and quantification as a measure towards effective
of Psychology in Africa 20(2), 199–202. https://doi.org/10.1080/14330237.2010. waste management in Ghana’, Waste Management 46, 15–27. https://doi.
10820364 org/10.1016/j.wasman.2015.09.009
DEA – Republic of South Africa (RSA), 2012, RSA DEA – Republic of South Africa, Miller, G.T. & Spoolman, S., 2011, Living in the environment: Principles, connections,
Department of Environmental Affairs, 2012, National Waste Information Baseline and solutions, 17th International edition, Brooks/Cole, Pacific Gove, CA.
Report – Draft 6, viewed November 2012, from http://www.sawic.org/?menu=302
Moftah, W.A., Marković, D., Moftah, O.A. & Nesseef, L., 2016, ‘Characterization of
Department of Economic Development and Environmental Affairs (DEDEA), 2009, household solid waste and management in Tripoli City – Libya’, Open Journal of
General and hazardous waste management plans, Situational Analysis Report, Ecology 6(07), 435. https://doi.org/10.4236/oje.2016.67041
viewed 18 February 2017, from https://projects.gibb.co.za/Portals/3/projects/
200911%20Eastern%20Cape%20Environmental/Waste%20Situation% Mohammed, A. & Elias, E., 2017, ‘Domestic solid waste management and its
20Analysis%20-%20Work%20in%20progress%20draft.pdf environmental impacts in Addis Ababa city’, Journal of Environment and Waste
Management 4(1), 194–203.
Etengeneng, D., 2012, ‘Municipal solid waste management in Grahamstown, Republic
of South Africa’, Master’s thesis, Rhodes University, Grahamstown, South Africa. Ojeda-Benitez, S., De Vega, C.A. & Ramı́, M.E., 2003, ‘Characterization and
quantification of household solid wastes in a Mexican city’, Resources,
Fiehn, H., Ball, J. & Novella, P., 2005, Integrated waste management, Background Conservation and Recycling 39(3), 211–222. https://doi.org/10.1016/S0921-
research paper produced for the South African Environment Outlook Report, 3449(03)00028-4
Department of Environmental Affairs and Tourism, Pretoria.
Okot-Okumu, J., 2012, Solid waste management in African cities – East Africa, INTECH
Fuggle, R.F. & Rabie, M.A. (ed.), 1994, Environmental management in South Africa, Open Access Publisher, viewed 24 January 2017, from https://www.intechopen.
Juta & Co Ltd., Cape Town. com/books/waste-management-an-integrated-vision/solid-waste-management-
Gawaikar, V. & Deshpande, V.P., 2006, ‘Source specific quantification and in-african-cities-east-africa
characterization of municipal solid waste, a review’, Journal of the Institution of OR Tambo District Municipality (ORTDM), 2013, OR Tambo District Municipality
Engineers, India: Environmental Engineering Division 86, viewed 09 August 2015, integrated development plan, 2013/2014 Review, Mthatha, viewed 07 May
from http://www.seas.columbia.edu/earth/wtert/sofos/Gawaikar_Source%20 2015, from https://www.ecsecc.org/information-centre/item/ortambo-district-
Specific%20Quantification%20and%20Characterization%20of%20MSW.pdf municipality-integrated-development-plan-idp-20082009-2012-to-20122013
Gutberlet, J., 2018, ‘Waste in the city: Challenges and opportunities for urban Pandey, R.U., Surjan, A. & Kapshe, M., 2018, ‘Exploring linkages between
agglomerations, urban agglomeration Mustafa Ergen’, IntechOpen, viewed 09 sustainable consumption and prevailing green practices in reuse and recycling
August 2015, from https://www.intechopen.com/books/urban-agglomeration/
waste-in-the-city-challenges-and-opportunities-for-urban-agglomerations of household waste: Case of Bhopal city in India’, Journal of Cleaner Production
173, 49–59.
Harrison, K., 2008, Can Mthatha turn the corner?, 18, SA Delivery, viewed 09 August
2015, from http://sadelivery.co.za/files/back_issues/delivery/Edition18/mthatha% Parfitt, J., Flowerdew, R. & Doktor, P., 1994, Socio-economic variables in household
202302.pdf waste modelling: Two case studies, Centre for Social and Economic Research on
the Global Environment, viewed 02 September 2017, from http://www.uea-ac.
Hoornweg, D. & Bhada-Tata, P., 2012, What a waste: A global review of solid waste uk\cserge\pub\wp\wm\wm_1994_02.pdf
management, Urban development series knowledge papers, viewed 09 July 2015,
from https://openknowledge.worldbank.org/handle/10986/17388 Poswa, T.T., 2001, ‘A comparison of attitudes towards and practices of waste
management in three different socio-economic residential areas of Umtata’,
Hoornweg, D., Bhada-Tata, P. & Kennedy, C., 2013, ‘Environment: Waste production Master’s thesis, Durban University of Technology, Durban, South Africa.
must peak this century’, Nature 502(7473), viewed 05 March 2015, from https://
www.iswa.org/fileadmin/galleries/News/NATURE_Comment_waste.pdf Qu, X.Y., Li, Z.S., Xie, X.Y., Sui, Y.M., Yang, L. & Chen, Y., 2009, ‘Survey of composition
and generation rate of household wastes in Beijing, China’, Waste Management
Igbinomwanhia, D.I., 2011, Status of waste management, INTECH Open Access 29(10), 2618–2624.
Publisher, viewed 03 May 2015, from http://www.intechopen.com/books/
integrated-waste-management-volume-ii/status-of-waste-management Satterthwaite, D., Sverdlik, A. & Brown, D., 2018, ‘Revealing and responding to
multiple health risks in informal settlements in sub-Saharan African cities’, Journal
Kamara, A.J., 2009, ‘Household participation in domestic waste disposal and recycling in of Urban Health 96(1), 11–19. https://doi.org/10.1007/s11524-018-0264-4
the Tshwane Metropolitan area: An environmental education perspective’, Doctoral
dissertation, viewed 09 August 2016, from http://uir.unisa.ac.za/handle/10500/1460 Senzige, J.P., Makinde, D.O., Njau, K.N. & Nkansah-Gyeke, Y., 2014, ‘Factors
influencing solid waste generation and composition in urban areas of
Kawai, K. & Tasaki, T., 2016, ‘Revisiting estimates of municipal solid waste generation Tanzania: The case of Dar-es-Salaam’, American Journal of Environmental
per capita and their reliability’, Journal of Material Cycles and Waste Management Protocol 3(4), 172–178.
18(1), 1–13.
Sibanda, L.K., Obange, N. & Awuor, F.O., 2017, ‘Challenges of solid waste management
Khoo, H.H., Lim, T.Z. & Tan, R.B., 2010, ‘Food waste conversion options in Singapore: in Kisumu, Kenya’, Urban Forum 28(4), 387–402. https://doi.org/10.1007/s12132-
Environmental impacts based on an LCA perspective’, Science of the Total 017-9316-1
Environment 408(6), 1367–1373.
Sikrweqe, N.P., 2013, ‘Integrated development planning as a poverty reduction
Kubanza, N.S. & Simatele, D., 2016, ‘Social and environmental injustices in solid waste strategy in the King Sabata Dalindyebo Municipality, Eastern Cape province’,
management in sub-Saharan Africa: A study of Kinshasa, the Democratic Republic Doctoral dissertation, viewed 01 July 2015 from http://uir.unisa.ac.za/bitstream/
of Congo’, International Journal of Justice and Sustainability: Local Environment handle/10500/11910/dissertation_sikrweqe_np.pdf?sequence=1&isAllowed=y
21(7), 866–882.
Statistics South Africa (Stats SA), 2012, Census 2011, viewed 02 April 2015, from
Lupala, J.M., 2002, ‘Urban types in rapidly urbanising cities’, Doctoral dissertation, https://www.statssa.gov.za/publications/P03014/P030142011.pdf
viewed 12 April 2015, from http://www.diva-portal.org/smash/get/diva2:9224/
FULLTEXT01.pdf Thanh, N.P., Matsui, Y. & Fujiwara, T., 2010, ‘Household solid waste generation and
characteristic in a Mekong Delta city, Vietnam’, Journal of Environmental
Lutui, V., 2001, Waste management practices, perceptions and attitudes in Tonga, viewed Management 91(11), 2307–2321.
15 June 2016, from http://gcpcenvis.nic.in/Thesis/Waste%20management%20
practices%20perceptions%20and%20attitudes%20in%20Tonga%20(1).pdf Van Beukering, P., Sehker, M., Gerlagh, R. & Kumar, V., 1999, Analysing urban solid
waste in developing countries: A perspective on Bangalore, India, Collaborative
Mattos, T.V., MacKinnon, M.A. & Boorse, D.F., 2012, The intersection of gender, Research in the Economics of Environment and Development, viewed 07 May
education, and health: A community-level survey of education and health 2015, from http://pubs.iied.org/8113IIED/
outcomes for women in Southeastern Togo, Gordon College, MA, viewed 12 April
2015, from http://www.hiidunia.com/wp-content/uploads/downloads/2012/06/ Yadav, S., 2018, ‘Environmental pollution effects on living beings’, International
TMattosPublicHealthResearchDB-1.pdf Journal of Scientific Research in Science and Technology 4(7), 143–150.
http://www.jamba.org.za Open AccessYou can also read