Ecophysiology with barley eceriferum (cer) mutants: the effects of humidity and wax crystal structure on yield and vegetative parameters
←
→
Page content transcription
If your browser does not render page correctly, please read the page content below
Annals of Botany 126: 301–313, 2020
doi: 10.1093/aob/mcaa086, available online at www.academic.oup.com/aob

Ecophysiology with barley eceriferum (cer) mutants: the effects of humidity and
          wax crystal structure on yield and vegetative parameters
                                                     Penny von Wettstein-Knowles*

          Department of Biology, University of Copenhagen, Ole Maaloees Vej 5, DK-2200 Copenhagen N, Denmark
                                     *For correspondence. E-mail knowles@bio.ku.dk

                                                                                                                                                   Downloaded from https://academic.oup.com/aob/article/126/2/301/5828402 by guest on 02 October 2020
            Received: 7 February 2020    Returned for revision: 30 March 2020 Editorial decision: 23 April 2020 Accepted: 26 April 2020
                                                         Electronically published: 3 May 2020

              • Background and Aims In addition to preventing water loss, plant cuticles must also regulate nutrient loss via
              leaching. The eceriferum mutants in Hordeum vulgare (barley) potentially influence these functions by altering
              epicuticular wax structure and composition.
              • Methods Cultivar ‘Bonus’ and five of its cer mutants were grown under optimal conditions for vegetative
              growth and maturation, and nine traits were measured. Nutrient and water amounts going through the soil and the
              amount of simulated rain as deionized water, affecting phyllosphere humidity, delivered during either the vegeta-
              tive or maturation phase, were varied. Cer leaf genes and three wilty (wlt) mutations were characterized for reac-
              tion to toluidine blue and the rate of non-stomatal water loss.
              • Key Results Vegetative phase rain on ‘Bonus’ significantly decreased kernel weight and numbers by 15–30 %,
              while in cer.j59 and .c36 decreases of up to 42 % occurred. Maturation phase findings corroborated those from
              the vegetative phase. Significant pleiotropic effects were identified: cer.j59 decreased culm and spike length and
              1000-kernel weight, .c36 decreased kernel number and weight, .i16 decreased spike length and .e8 increased culm
              height. Excepting Cer.zv and .ym mutations, none of the other 27 Cer leaf genes or wlt mutations played significant
              roles, if any, in preventing water loss. Cer.zv and .ym mutants lost non-stomatal water 13.5 times faster than those
              of Cer.j, .yi, .ys and .zp and 18.3 times faster than those of four cultivars and the mutants tested here.
              • Conclusions Using yield to measure the net effect of phyllosphere humidity and wax crystal structure revealed that
              the former is far more important than the latter. The amenable experimental setup described here can be used to delve
              deeper. Significant pleiotropic effects were identified for mutations in four Cer genes, of which one is known to par-
              ticipate in wax biosynthesis. Twenty-seven Cer leaf genes and three wlt mutations have little if any effect on water loss.

              Key words: Eceriferum (Cer) genes, ecophysiology, epicuticular wax structure, Hordeum vulgare (barley),
              phyllosphere humidity, kernel yield, plant cuticle, hydrophilic domains, nutrient leaching, water loss.

                        INTRODUCTION                                        Lundqvist, 1988) that can be used to investigate the relation-
                                                                            ship between epicuticular waxes and leaching. Twenty-five
The predominant driving force for studying Gramineae cu-                    of the Cer genes affected only leaf blades, 27 only the upper-
ticles has been their role in water loss. Less attention has                most internodes and leaf sheaths plus spikes and 23 only
been paid to water sorption or transport of metabolites                     spikes, while four affected all organs. Recently, mutations
across this hydrophobic barrier. Water is retained on smooth                of two of the latter, Cer.zv and .ym, have been localized to
cuticle surfaces (Neinhuis and Barthlott, 1997), potentially                the same gene, a GDSL-motif esterase/acyltransferase/lipase
contributing to leaching of nutrients from within the leaf.                 (Li et al., 2017) indispensable for synthesis of the cuticle’s
One attribute contributing to roughness of cuticle surfaces is              structural component, the cutin polymer, which, together
the presence of epicuticular wax crystals. Wild-type barley                 with its embedded waxes, is required for water retention.
leaves are densely covered with small lobed, crystalline wax                Thus, 28 of the Cer genes affect leaf blades and are referred
plates consisting predominantly of primary alcohols (C26),                  to hereafter as barley Cer leaf genes.
while the uppermost internodes and leaf sheaths and spikes                     Four additional barley Cer genes have been cloned. The Cer-
bear a dense array of very long thin, β-diketone crystal-                   cqu gene cluster encodes polyketide diketone synthase [DKS,
line tubes, predominantly C31 14,16-dione (von Wettstein-                   a β-ketoacyl-CoA-synthase (KCS) type III], a lipase/carboxyl
Knowles, 2016). Crystal reduction modifies refraction of                    transferase and a P450 hydroxylase, which are key players
light from cuticle surfaces so that they no longer appear dull              in the DKS pathway, synthesizing the β-diketone aliphatics
green but bright green, while the uppermost internodes, leaf                (Hen-Avivi et al., 2016; Schneider et al., 2016; von Wettstein-
sheaths and spikes are no longer blue but a bright green.                   Knowles, 2017). Cer-zh encodes a type I KCS that elongates
Such phenotypic changes from glaucous to non-glaucous led                   the C16–C20 acyl chains required for synthesis of the primary
initially to the identification of 79 Eceriferum (Cer) genes                alcohols (Li et al., 2018).
with a total of 1560 mutations in barley (Lundqvist and

                                    © The Author(s) 2020. Published by Oxford University Press on behalf of the Annals of Botany Company.
This is an Open Access article distributed under the terms of the Creative Commons Attribution License (http://creativecommons.org/licenses/
         by/4.0/), which permits unrestricted reuse, distribution, and reproduction in any medium, provided the original work is properly cited.
302                        von Wettstein-Knowles — Ecophysiology with barley eceriferum (cer) mutants

   Contact angles are a method for quantitating the roughness         epicuticular wax also plays a role (Kerstiens, 2006; Zeisler-
of cuticle surfaces (Holloway, 1969; Nienhuis and Barthlott,          Diehl et al., 2018). In Arabidopsis leaves epicuticular wax was
1997). The cer.j59 mutation, for example, reduces the contact         twice as effective as intracuticular wax in preventing water loss
angle from ~140 to 116° (17 %) on leaf blades (Zabka et al.,          (Buschhaus and Jetter, 2012). These considerations reveal that
2008) so that water drops no longer run off the surface. Other        questions remain about the molecular mechanism(s) in herb-
mutations resulting in the absence of the long thin tubes on          aceous species contributing to the described glaucosity/yield
wheat leaf sheaths and barley lemmas reduced contact angles by        correlations.
14 and 20 %, respectively (Netting and von Wettstein-Knowles,            To date no studies have been carried out on the potential ef-
1973; King and von Wettstein-Knowles, 2000). An increase in           fects of wax crystal structure on yield when moisture is in ex-
moisture provides not only an atmosphere suitable for insect          cess, e.g. in rainy environments. This is of interest given the
colonization and microorganism germination (Shepherd and              early deduction that the amount of metabolites leaching from
Griffiths, 2006), but also in-ear sprouting of kernels (King and      plants was related to hydrophobicity of the cuticle surface based

                                                                                                                                           Downloaded from https://academic.oup.com/aob/article/126/2/301/5828402 by guest on 02 October 2020
von Wettstein-Knowles, 2000) and leaching of metabolites,             on evidence from comparisons during development of a plant
both organic and inorganic, through the cuticular layer of the        and between plants (Tukey, 1970). Here, ‘Bonus’ barley and its
apoplast into the phyllosphere (Tukey, 1970). Among poten-            mutants cer.j59, .c36, .u69, .i16 and .e8 are exploited because
tial roles for epicuticular waxes that have been probed with the      of their known effects on wax structure to explore the contri-
cer mutants are the relationships of its structure, amount and/       bution of the apoplast’s outermost layer to leaching, and the
or composition with (1) powdery mildew and brown rust infec-          effect of humidity on this. The effects of delivering deionized
tion (Yang and Ellingboe, 1972; Rubiales et al., 2001; Zabka          water as simulated rain and in pertinent amounts through the
et al., 2008; Hansjakob et al., 2011; Li et al., 2018), (2) attach-   soil during the vegetative and maturation phases on nine traits
ment of herbivorous insects and their predators (Eigenbrode,          are investigated. Using yield parameters to measure leaching,
2004; Rostás et al., 2008; Northfield et al., 2012), (3) reflect-     results reveal that while this phenomenon can be modified by
ance of electromagnetic radiation (Baker, 1974; Johnson et al.,       epicuticular wax structure, phyllosphere humidity is more im-
1983; Febrero et al., 1998; Shepherd and Griffiths, 2006) and         portant. Pleiotropic effects of cer.j59, .c36, .i16 and .e8 are
(4) yield (Gustafsson, 1963; Gustafsson et al., 1975; Baenziger       identified and characterized, and the composition of the waxes
et al., 1983; Johnson et al., 1983; Febrero and Araus, 1994;          on cer.i16 and .e8 spikes determined. The barley leaf Cer gene
Febrero et al., 1998; Merah et al., 2000; Monneveux et al.,           collection as well as three wilty (wlt) mutants, whose name sug-
2004; Simmonds et al., 2008).                                         gests a defect in water retention, were characterized with re-
   In some environments glaucous genotypes with their rough           spect to non-stomatal water loss rate and toluidine blue staining.
leaf surfaces yield better than non-glaucous ones with smooth
surfaces. Among these are several barley cer leaf mutants
grown in dry environments (Baenziger et al., 1983; Febrero                           MATERIALS AND METHODS
et al., 1998). While this difference was lost when cer.j59 was
grown under optimal conditions (Gustafsson, 1963), both cer.
                                                                      Simulated rain experiments
j59 and gl4 yielded less when grown under irrigated field con-
ditions. By comparison, mutants affecting the uppermost leaf          Plant material and growth conditions. Seeds of Hordeum
sheaths and exposed internodes plus spikes exhibit a wide             vulgare ‘Bonus’ and the eceriferum mutants induced in this cul-
range of yield phenotypes. Thus, compared with their mother           tivar, cer.c36, .e8, .i16, .j59 and .u69, were planted and grown
varieties, cer.c36 yielded 10–18 % less under favourable con-         in a mixture of sterilized sand and gravel in the Stockholm
ditions (Gustafsson et al., 1975), while another barley mutant,       phytotron (von Wettstein, 1967) under optimum conditions
gs2 (an allele of the Cer.b gene), grown under various field con-     for vegetative growth and seed maturation (Dormling et al.,
ditions had the same yield (McProud, 1971; Baenziger et al.,          1966, 1969). That is, they were under constant light for 60 d
1983). The decreased yield in dry environments was initially at-      at 15/10 °C (16/8 h) during the vegetative phase, before being
tributed to intracuticular waxes as water vapour would quickly        shifted to 23/18 °C (16/8 h) for the maturation phase. Fourteen
diffuse through epicuticular wax crystals. Subsequently evi-          10.5-cm pots were present on each moveable truck. Besides
dence was presented that the higher yields of glaucous lines          the standard phytotron methods of watering using deionized
were primarily attributable to decreased transpiration accom-         water and giving nutrients either every other day (1N) or every
panied by a temperature reduction of photosynthesizing tissues        day (2N), two other methods were employed. Parameters are
and leaf senescence (Richards et al., 1986). More recent studies      specified in Tables 1 and 2 or given below. (1) Simulated rain,
have exploited the sensitive carbon isotope discrimination            hereafter referred to as rain, illustrated in Fig. 1A: water was
assay, the results of which are often closely correlated with         dispersed in varying amounts as detailed below for 4 h above
yield (Farquhar et al., 1989; Febrero et al., 1998; Merah et al.,     the plants in cycles (Table 1) as a fine spray from a nozzle fol-
2000; Monneveux et al., 2004; Richards et al., 2010). Water           lowed by a pause. The sides of the rain trucks from just above
molecules are believed to diffuse across cuticles primarily via       soil level were enclosed in plastic. (2) Drip, illustrated in
the lipophilic pathway, i.e. the amorphous phase of cuticular         Fig. 1B: an amount of water equivalent to that given as rain the
waxes (Riederer and Schreiber, 2001). But the contribution of         previous day was dripped at pot level during the same 4 h from
intracuticular versus epicuticular waxes to transpiration is still    large storage tanks at a higher elevation. Water from the storage
a matter of debate. In deciduous leaves results imply that only       tank entered a pipe encircling the four central pots and was dis-
intracuticular waxes are important, whereas for fruit cuticles        tributed from there individually through red tubing (Fig. 1A) to
von Wettstein-Knowles — Ecophysiology with barley eceriferum (cer) mutants 303
Table 1. Experimental parameters
Experiment Start of drip End of drip Total duration of Temperature Rain cycleb Drip and Nutrientsd First spike
number and rain (day) and rain (day) drip or rain (d) shifta (day) Rain/pause (s) rain waterc (amount) maturee (day)
(amount)
1 14 90 76 48 6/60 10 W 1N 75–83
2 14 87 73 59 1.8/85 2.5 W 1N 72–77
3 14 87 73 60 6/60 10 W 2N 77–85
4 45 87 42 59 12/55 10 W 1N or 2N 84–88
a
Seeds were planted on day 1 and grown under constant 22 000 lux at 15/10 °C (16/8 h) until shifting to 23/18 °C (16/8 h) for seed maturation. The standard
phytotron method (Dormling et al., 1966) for delivering water by spraying at pot level (twice daily) and full-strength Hoagland nutrients (twice weekly) was used
except in the time intervals when rain and drip are specified.
Downloaded from https://academic.oup.com/aob/article/126/2/301/5828402 by guest on 02 October 2020
b
From 0830 to 1230 h.
c
10W and 2.5W correspond to 50 and 12.5 mm d−1, respectively, which are ~10 and 2.5 times the maximum amount of rain observed in Svaløf, Sweden, in the
1959–68 growing seasons. Number of litres of water passing through the rain and drip pots is given in Supplementary Data Table S1.
d
Half-strength Hoagland (Went, 1957) was delivered every other day (1N) or every day (2N); for the standard phytotron method it was delivered at 0800 h and
for drip and at 1500 h for rain.
e
Additional details are given in Table 2. The average number of days to heading of the first spike ranged from 40 to 47.
Table 2. Days to maturity of first spike on ‘Bonus’, cer.c36, .j59,.u42, .i16 and .e8 resulting from different wateringa and nutrientb re-
gimes (mean of 14 plants ± s.e.)
Water during vegetative phase Water during maturation phase
Experiment 1 Experiment 2 Experiment 3 Experiment 4
10W, 1N 2.5W, 1N 10W, 2N 10W, 1N 10W, 2N
‘Bonus’ St pc 76.7 ± 0.7 76.1 ± 0.3 82.6 ± 0.5 ‘Bonus’ Drip 84.1 ± 0.3 83.6 ± 0.4
Drip 81.3 ± 1.0 72.4 ± 0.5 77.0 ± 0.6 Rain 85.1 ± 0.4
Rain 78.7 ± 0.7 74.6 ± 0.4 80.0 ± 0.8 cer.u69 Drip 85.0 ± 0.5 84.3 ± 0.3
cer.c36 St p 75.6 ± 0.5 76.0 ± 0.3 84.5 ± 0.4 Rain 87.4 ± 0.5
Drip 78.6 ± 0.7 73.6 ± 0.3 78.1 ± 0.6 cer.c36 Drip 84.9 ± 0.5 85.4 ± 0.3
Rain 80.3 ± 1.0 74.2 ± 0.2 82.2 ± 0.7 Rain 88.0 ± 0.4
cer.j59 St p 77.3 ± 0.3 74.9 ± 0.2 82.4 ± 0.4 cer.i16 Drip 85.4 ± 0.3 84.9 ± 0.4
Drip 79.4 ± 1.0 76.7 ± 0.3 80.4 ± 0.5 Rain 87.2 ± 0.5
Rain 83.1 ± 0.6 76.4 ± 0.2 83.9 ± 0.4 cer.e8 Drip 84.7 ± 0.5 84.5 ± 0.4
Rain 86.4 ± 0.3
a
10W and 2.5W, 19.7 and 4.9 L water d−1, respectively.
b
1N, nutrients every other day; 2N, nutrients every day.
c
Standard phytotron watering method.
each pot. Drip truck sides were not enclosed. All water passing 60 d. In all experiments at least one spike per plant had headed
through the soil of each pot on both rain and drip trucks was by day 47. The number of ripe spikes in the present experiments
collected (for example, see rubber tubing beneath pots on rain ranged from 13.8 to 20.4 under standard phytotron watering
trucks in Fig. 1A) and measured. Figure 2 illustrates the tem- conditions (Table 3), demonstrating that heading continues into
perature and relative humidity on both a rain and a drip truck maturation phase after starting in vegetative phase.
of ‘Bonus’ measured in the truck centre every half-hour for Giving nutrients every day (2N) during the vegetative phase
two successive days during the maturation phase. While the led to a marked delay of ~5–9 d to maturity for all three geno-
thermoperiod of the drip truck was ~22/17–18 °C within the types when using the standard phytotron watering method, but
optimum range 25/20 °C to 20/15 °C, that on the rain truck not with the rain or drip methods (Table 2). Nutrient amounts
was somewhat lower, 20/17–18 °C. By comparison, the relative likewise did not affect the day of maturity of the first spike
humidity rose as high as 98 % on the rain truck, falling back to (84–85) for all five genotypes (Table 2) when the drip method
~80–84 % after 7 h. was used for delivering water during the maturation phase.
At the time of the thermoperiodic shift, ‘Bonus’ had seven
or eight heading spikes, meaning that heading begins during Amount of water. Maximum rainfall in a growing season of
the vegetative phase (Dormling et al., 1966, 1969). In the 5 months (April–August) from 1959 to 1969 at Svalöf, Sweden,
first experiment the thermoperiodic shift took place earlier, at was 407 mm (Swedish Meteorological and Hydrological
48 d (Table 1). As this proved incompatible with many other Institute, Year Book 50 Part 2.1, Table 3). No excessive rainfall
phytotron experiments the shift thereafter took place at 59 or occurred during this time interval, in contrast to recent years. The304 von Wettstein-Knowles — Ecophysiology with barley eceriferum (cer) mutants
103
A
98
Relative humidity (%)
93
88
83
78
73
Downloaded from https://academic.oup.com/aob/article/126/2/301/5828402 by guest on 02 October 2020
24
Temperature (°C)
22
20
18
B 16
14
00.00
00.20
04.00
06.00
08.00
10.00
12.00
14.00
16.00
18.00
20.00
22.00
00.00
Time (h)
Fig. 2. Relative humidity and temperature on two successive days in ‘Bonus’
trucks watered with 19.7 L water d−1 (10W) via rain and drip methods.
Downward and upward arrows indicate the start and end of water supply, re-
spectively. Solid black lines, rain day 1; dashed black lines, rain day 2; solid
grey lines, drip day 1; dashed grey lines, drip day 2.
trucks, demonstrated that a 1W experiment was not technically
feasible, leading to its abortion in the late maturation phase. In
both the 1W and 10W experiments, when the amount collected
from drip trucks was compared with that collected on rain trucks,
the former was less than expected: 57 and 85 %, respectively.
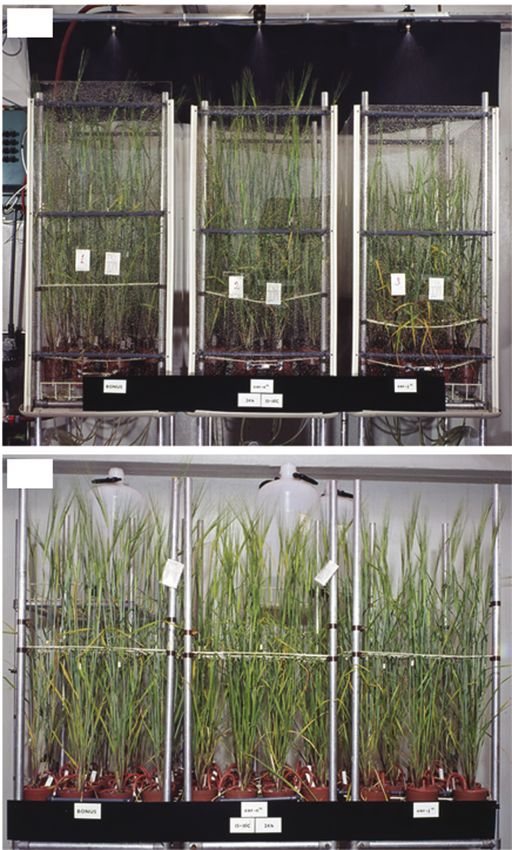
Fig. 1. Trucks of ‘Bonus’ (left), cer.c36 (centre) and cer.j59 (right) 57-d-old
plants growing in the Stockholm phytotron under constant light and 15/10 °C Given that the surface area of the 14 pots on a truck was 30.8 %
(16/8 h) with nutrients every other day (1N) and 19.7 L water d−1 (10W) via (A) of the rainfall area, one expects to collect 0.61 L d−1 per truck.
rain and (B) drip methods. From the data one can calculate that considerably more was
collected: in the 1W rain experiment an average of 1.39 L, in
equivalent amount of rain given in 76 d is 5.35 mm d−1, for ex- the 2.5W experiment 2.67 L and in the two 10W experiments
ample. As the circular area encompassing a 50 × 50 cm truck 10.32 L. This implies that foliage was channelling rain into pots,
is 3935 cm2, 1.97 L d−1 is required, or, if the rain period is 4 h, partly explaining the collection of more water from a rain truck
0.49 L h−1. Delivering ~2.5 and 10 times as much water (2.5W than the analogous drip truck.
and 10W, respectively) requires 4.9 and 19.7 L d−1. To confirm Wax phenotypes. Rain drops do not readily run off barley leaf
that the planned relative water amounts were delivered every day, blade eceriferum mutants. Half an hour after raining on wild-
all the water running through the 14 pots on each rain truck was type ‘Bonus’ only the divider bars retain some drops (Fig. 3A),
collected and measured (Supplementary Data Table S1). whereas leaf blades of cer.j59 are still covered with drops
The average (± s.e.) total number of litres collected for the 11 (Fig. 3B). This phenomenon (Neinhuis and Barthlott, 1997) is
10W rain trucks was 762 ± 15 and for the three 2.5W rain trucks it caused by the many small lobed wax plates present on wild
was 191 ± 3, which gives the expected ratio of 4:1. In another ex- type (Fig. 3C) but absent on cer.j59, which has infrequent small
periment with water reduced to 1W for 73 d, the average (± s.e.) wax mounds and thin plates closely appressed to the surface
total number of litres collected was 102 ± 6 compared with 76 (Fig. 3D). While the uppermost leaf sheaths and exposed inter-
predicted from the 2.5W and 10W results (Supplementary Data nodes plus spikes of ‘Bonus’ and cer.j59 are covered with long
Table S1). Variability and high standard error, however, com- thin tubes, giving these organs a blue-grey colour, and geno-
bined with the difficulty in trying to maintain a uniform delivery types that lack them, such as cer.c36 (von Wettstein-Knowles,
to all 14 pots with only 0.49 L h−1 (cycle: 1 s rain followed by 1972), are bright green (Fig. 1B, panel sides versus centre), the
a 90-s pause) based solely on storage tank pressure to the drip vertical nature of these organs results in water drop shedding.von Wettstein-Knowles — Ecophysiology with barley eceriferum (cer) mutants 305
A B
C D E
Downloaded from https://academic.oup.com/aob/article/126/2/301/5828402 by guest on 02 October 2020
F
Fig. 3. Leaf blades of wild-type ‘Bonus’ (A) do not retain water drops after rain, as do those of cer.j59 (B). This results from the presence of many lobed plates
on ‘Bonus’ (C) versus a few small mounds and closely appressed plates on cer.j59 (D). Water sheds from vertical leaf sheaths, internodes and lemmas regardless
of the presence of the long thin tubes characterizing ‘Bonus’. Tightly appressed to these surfaces are thin plates, which are visible on lemmas of cer.i16, which has
fewer and shorter tubes (E). TB stain of leaf blades (F, left and centre) and sheaths (F, right): horizontal (top) ‘Bonus’; (centre) cer.j59; (bottom) cer.c36, vertical,
cer.zv268. Scale bar = 1 µm.
In addition to ‘Bonus’ and cer.c36, three additional mutants β-diketones in cer.i16 spike waxes has been published (von
having different spike wax coats were included in the matur- Wettstein-Knowles, 1971).
ation phase experiment: (1) cer.u69, which has highly lobed,
large plates in addition to long thin tubes (von Wettstein- Electron microscopy. The procedure for preparing leaf and
Knowles, 1972; Schneider et al., 2016) on the uppermost leaf lemma epidermal surfaces pre-shadowed with gold–palla-
sheaths and exposed internodes plus spikes; (2) cer.i16, with a dium at an angle of 45° followed by deposition of 100–200 Å
~36 % reduction in the β-diketones in the total wax, resulting carbon while rotating at 75° under vacuum for examination in
in shorter tubes peculiar to spikes (Fig. 3E); and (3) cer.e8, a Siemens Elmiskop 1A has been described (Netting and von
with a ~16 % reduction in β-diketones forming the long thin Wettstein-Knowles, 1973).
tubes only on spikes (von Wettstein-Knowles, 1972, 1976). The
latter articles detail the methods used to grow ‘Bonus’, cer.i16 Traits measured. For all 14 plants on each truck the following
and .e8, plus the details of the methods used to determine the eight traits were measured: culm length of first tiller; spike length
composition of the acyl aliphatics in spike waxes. Given that with awns on first tiller; number of ripe spikes at harvest; number
both mutants are phenotypically glossy, major reductions in the of kernels on ripe spikes at harvest; air-dry weight of kernels on
total amount of waxes must accompany the 16 and 36 % reduc- ripe spikes; days to heading of first spike; days to maturity of first
tion in DKS aliphatics (von Wettstein-Knowles 1976). A thin- spike; and straw dry weight. Additionally, 1000-kernel weight on
layer chromatographic picture illustrating the reduction of the ripe spikes was calculated and will be referred to as a trait here.306 von Wettstein-Knowles — Ecophysiology with barley eceriferum (cer) mutants
The mean, standard deviation and standard error for each trait Center, belonging to the uppermost internode plus leaf sheath
were calculated. For each experimental condition, t-tests were and spike cer group, did not stain with TB (Supplementary
carried out to determine significance levels of mutant values Data Fig. S1) as expected, in contrast to results reported by
versus those of the pertinent wild type, ‘Bonus’. Li et al. (2017), working with the Bowman-derivative, near-
isogenic line BW143.
Crude protein and dye-binding capacity. The percentage of An early study of 14 cer leaf barley mutants looked for a pos-
crude protein in the seeds was determined by measuring the sible influence of wax structure on non-stomatal water loss at 6 h
N2 content of the seeds using the Kjeldahl technique and multi- (Larsson and Svenningsson, 1986). No effect was found. In the
plying by 6.25 to convert N2 to protein. The dye-binding cap- present study of all barley leaf Cer genes plus three wlt mutants,
acity (DBC) for basic amino acids in the crude protein extracts the rate of non-stomatal water loss was followed until ~10 % of
using Acilane Orange G was assayed as described (Munck the starting fresh weight remained (Fig. 4; Supplementary Data
et al., 1970; Knoblauch et al., 1977). The amino acid compos- Fig. S2). Stomatal water loss was assumed to be unchanged since
ition of seeds from ‘Bonus’, cer.c36 and .j59 was determined as
Downloaded from https://academic.oup.com/aob/article/126/2/301/5828402 by guest on 02 October 2020
in a screen of epidermal images from the cer leaf and wlt mu-
described previously (Munck et al., 1971). Pearson’s analysis tants none was identified with a modified structure or frequency
was carried out to determine the strength of the correlation be- of stomates (Bonnell, 2012). No differences were discerned in
tween percentage protein content and DBC. the phenotypes exhibited by the leaves of the investigated geno-
types during water loss. Three groups were disclosed. Group 1,
comprising cer.zv and .ym mutants, lost water very quickly, as
Water loss experiments. Seeds of cer.xa838, .ya180, .yg1014, illustrated by cer.ym753 (Fig. 4A), confirming published results
.yl187, .yl188, .ym130, .ym753, yo647, .yp949, .yq1246, (Li et al., 2013, 2015). Group 2, consisting of cer.j, .yi, .ys and
.yu158, .zk85, .zq214, .zv268, .zv342, .zy118 and .zz615, plus .zp mutants, lost water faster than the other cer leaf mutants and
wlt2, wlt15 and wlt16, were obtained from the Nordic Genetic their respective wild-types in group 3 (Fig. 4B), but nowhere near
Resource Center, Alnarp, Sweden (www.nordgen.org). Seeds as rapidly as group 1 mutants. The three tested wlt mutants be-
of all other mutants and cultivars were sourced in-house. They longed to group 3, as did cer.zk85 and .yg1014, appearing to lack
were planted and grown in a non-environmentally controlled wax on all organs (Supplementary Data Figs S1 and S2). If the
greenhouse at Lund University until the appropriate leaves rate of loss were linear, groups 1, 2 and 3 would lose 22.9, 1.7
were fully expanded. and 1.25 %, respectively, of starting water per hour based on data
Three centimetres of ~5-cm central segments of leaf blades
and sheaths were immersed in 0.05 % (wt/vol) toluidine blue A 100
(TB) for 3 h and then washed under water to remove non-bound
H2O loss (% starting fresh wt)
dye (Richardson et al., 2007) before scanning. To ascertain 80
non-stomatal water loss, ~10-cm-long central segments of fully
Kristine
expanded leaves were placed across pre-weighed polystyrene
60 Carlsberg II
weighing boats and weighed every hour for the first 4 h and
then at 9 or 10, 24, 48, 72, 96 and 120 h. Thereafter most leaves cer.xa838
were vacuum-freeze-dried overnight to obtain dry weights. 40
cer.yg1014
cer.zk85
20
cer.ym753
RESULTS
0
Barley Cer genes: water loss and rain B 100
H2O loss (% starting fresh wt)
Both cutin and intracuticular waxes contribute to the barley
cuticle’s water retention (Li et al., 2013; Richardson et al., 80
2007). To ascertain whether these apoplastic components wlt15
underlying the epicuticular waxes are markedly affected in 60 Foma
barley cer leaf mutants, leaf blade and sheath segments were Bonus
immersed in TB. Tissue from ‘Bonus’, cer.c36 and .j59 was 40 cer.ys680
not stained (Fig. 3F), indicating that the examined tissues of cer.yi254
these two mutants were not defective with respect to water loss. 20 cer.j59
By comparison, leaves from cer.zv268 and .ym130 mutants,
as illustrated in Fig. 3F and Supplementary Data Fig. S1, re- cer.zp313
0
spectively, stained strongly as reported (Li et al., 2013, 2015). 0 20 40 60 80 100 120
Analogous results (not shown) were obtained for cer.zv342 and Time (h)
.ym753. When leaves of representative mutants of the other 24
Cer genes with only a modified leaf cer phenotype (Lundqvist Fig. 4. Based on the rate of non-stomatal water loss, four barley cultivars and
and Lundqvist, 1988) were exposed to TB, however, they re- the cer mutants can be divided into three groups. In (A), cer.ym753 (group 1,
black line) loses its water within 4 h while the two cultivars and three other cer
mained unstained, as did cer.zk85 and .yg1014, appearing to mutants (group 3, grey lines) take 72–96 h. In (B) the two cultivars plus wlt15
lack wax on all organs (Supplementary Data Fig. S1). Likewise, (group 3, grey lines) take 72–96 h to lose the same amount of water as the four
two cer.yl mutants obtained from the Nordic Genetic Resource cer mutants in group 2 (black lines) do in 24–48 h. n ≥ 6.von Wettstein-Knowles — Ecophysiology with barley eceriferum (cer) mutants 307
in Fig. 4. According to which time point is used, the apparently Figure 1A combined with the data in Fig. 5A, D, reveals that
small difference between groups 2 and 3 is significant (P < 0.01 cer.j59 was significantly shorter than ‘Bonus’ in all nine en-
or P < 0.001). vironments. While the length of culms contributed to this, the
spikes were dramatically shorter. The culm lengths of cer.c36
were always less than those of ‘Bonus’, but only in six of nine
environments was the difference significant. Unexpectedly, cer.
Identification of additional phenotypic traits associated with cer.
c36 spikes were always longer than those of ‘Bonus’, being
c36 and .j59 mutations
significantly so in seven of nine environments. No consistent
Before investigating whether the watering regimes affected differences between the mutants’ straw dry weights and spike
vegetative growth and yield, phenotypes of cer.c36 and .j59 numbers (Fig. 5B, C) occurred. The lack of concordance im-
were characterized using different watering methods and nu- plies that these changes cannot be ascribed to either the cer.
trient amounts and time of the shift to maturation conditions. j59 or the .c36 mutation. Both the number of kernels and their
Downloaded from https://academic.oup.com/aob/article/126/2/301/5828402 by guest on 02 October 2020
Observed trait phenotypes under nine environmental regimes weight (Fig. 5C, F, G) from cer.c36 plants were always signifi-
are presented in Fig. 5 and Supplementary Data Tables S2– cantly less than those from ‘Bonus’. By comparison, no sig-
S4. Supplementary Data Table S2 contains results from the nificant concordant differences between cer.j59 and ‘Bonus’
standard phytotron watering method and Supplementary Data were noted for these traits (Fig. 5C, F). Despite this, when the
Table S3 those from the rain method. Anticipating that nutrients 1000-kernel weights were calculated for cer.j59 they were al-
could prove limiting on rain trucks because of the increased ways significantly less than those for the pertinent ‘Bonus’ con-
volume of water running through pots compared with standard trol [‘Bonus’, 49.1 ± 1.03 (s.e.); cer-j59, 44.1 ± 1.12; P < 0.01]
phytotron watered trucks, drip trucks were included in each ex- (Fig. 5G; Supplementary Data Tables S3 and S4). The drip
periment, the results of which are presented in Supplementary watering regime led to an increase in spike number of all three
Data Table S4. The tables include significance levels of the dif- genotypes that likely contributed to an increased number of
ferences between each mutant and the wild-type ‘Bonus’. heavier kernels (Fig. 5C, E, F).
A Culm length (mm) B Straw dry weight (g) C Kernel number
1000
18 400
750 300
12
200
50
16
100
250 0 0
10W,1N2.5W,1N 10W,2N 10W,1N2.5W,1N10W,2N 10W,1N2.5W,1N10W,2N 10W,1N 2.5W,1N 10W,2N 10W,1N 2.5W,1N 10W,2N 10W,1N 2.5W,1N 10W,2N 10W,1N 2.5W,1N 10W,2N 10W,1N 2.5W,1N 10W,2N 10W,1N 2.5W,1N 10W,2N
SP Rain Drip SP Rain Drip SP Rain Drip
D Spike length (mm) E Spike number F Kernel weight (g)
250 30 24
18
200 20
12
150 10
6
100 0 0
10W,1N 2.5W,1N 10W,2N 10W,1N 2.5W,1N 10W,2N 10W,1N 2.5W,1N 10W,2N 10W,1N 2.5W,1N 10W,2N 10W,1N 2.5W,1N 10W,2N 10W,1N 2.5W,1N 10W,2N 10W,1N 2.5W,1N 10W,2N 10W,1N 2.5W,1N 10W,2N 10W,1N 2.5W,1N 10W,2N
SP Rain Drip SP Rain Drip SP Rain Drip
G 1000-kernel weight (g)
Bonus 60
cer.c36 50
.j59 40
30
20
10W,1N 2.5W,1N 10W,2N 10W,1N 2.5W,1N 10W,2N 10W,1N 2.5W,1N 10W,2N
SP Rain Drip
Fig. 5. Effects of nine different environments during the vegetative phase on seven phenotypic traits (A–G) of ‘Bonus’, cer.c36 and .j59. Variation in the environ-
ments was achieved using three watering regimes [standard phytotron (SP), rain and drip] with two amounts of water (10W and 2.5W, 19.7 and 4.9 L water d−1,
respectively) plus nutrients every other day (1N) or every day (2N). Average of 14 plants ± s.e.308 von Wettstein-Knowles — Ecophysiology with barley eceriferum (cer) mutants
Based on the above observations, alteration of the wax coats phase experiments (1–3) cer.c36 kernel numbers and weights
on cer.j59 and .c36 mutants was accompanied by other pheno- were significantly less than those of ‘Bonus’ kernels (Fig. 6C,
typic changes independent of the thermoperiod shift time, F; Supplementary Data Table S6) under the three environmental
amount and type of watering regime and amount of nutrients: conditions tested. Rain and drip watering only during matur-
cer.j59 plants were characterized by shorter culms and spikes ation consistently resulted in several other mutation-specific
plus lesser 1000-kernel weights, while cer.c36 plants had fewer changes, namely, for cer.e8 plants significantly longer culms
and smaller kernels. but not spikes, and for cer.i16 plants significantly shorter spikes
but not culms compared with those on ‘Bonus’ plants (Fig. 6A,
D). No additional phenotypic changes were observed for cer.
u69 mutants.
Phenotypes of ‘Bonus’ traits versus those of cer.c36, .u69, .i16
and .e8
Downloaded from https://academic.oup.com/aob/article/126/2/301/5828402 by guest on 02 October 2020
To extend the above observations from experiments 1–3 with Consequences of differential vegetative phase watering for
differential watering throughout the vegetative phase, an add-
‘Bonus’, cer.j59 and .c36 phenotypes
itional experiment (experiment 4) was carried out in which
10W was delivered only during the maturation phase (Table 1). A comparison of rain versus drip watering outcomes in the
This amounted to 77 % more water per day than in experiments vegetative phase in ‘Bonus’, cer.j59 and .c36 can be obtained
1–3, where the same amount was distributed over 73–76 d by comparing the pertinent columns in Fig. 5 and values in
(Supplementary Data Table S1). Beyond ‘Bonus’ and cer. Supplementary Data Tables S3 and S4. Three traits, namely
c36, three additional mutants having structurally different wax kernel weight and number plus 1000-kernel weight, all de-
coats on their spikes were included: cer.u69, .i16 and .e8 (von creased (Fig. 7), whereas culm and spike length plus straw dry
Wettstein-Knowles, 1972, 1976). Compositional analyses of weight and spike number were either unaffected or showed
the KCS-derived aliphatics in cer.i16 and .e8 spike waxes re- random effects (Supplementary Data Fig. S3). Specifically
vealed that the only significant change compared with ‘Bonus’ the yield traits (kernel weights and numbers) were consist-
was a marked reduction in cer.e8 of the C31 alkane, which was ently less in the rain by as much as 42 %. Only in two of
compensated for by increases in the C23, C25 and C27 alkanes 18 comparisons with kernel number and weights (both with
(Supplementary Data Table S5). cer.j59) were differences insignificant, implying that wax
Figure 6 presents the results of delivering 10W to drip and structure changes indeed affected yield in the present experi-
rain trucks only during the maturation phase. As in the vegetative mental conditions. The decreases in 1000-kernel weights were
A Cum length (mm) B Straw dry weight (g) C Kernel number
880 9 300
840 7.5 250
800 6 200
760 4.5 150
720 3 100
Bonus cer.u69 cer.c36 cer.i16 cer.e8 Bonus cer.u69 cer.c36 cer.i16 cer.e8 Bonus cer.u69 cer.c36 cer.i16 cer.e8
D Spike length (mm) E Spike number F Kernel weight (g)
20 12
220
210 15 8
200 10 4
190 5 0
Bonus cer.u69 cer.c36 cer.i16 cer.e8 Bonus cer.u69 cer.c36 cer.i16 cer.e8 Bonus cer.u69 cer.c36 cer.i16 cer.e8
G 1000-kernel weight (g)
50
Drip, 1N
40
Drip, 2N
30
Rain, 1N
20
0
Bonus cer.u69 cer.c36 cer.i16 cer.e8
Fig. 6. Effects of three different environments during the maturation phase on seven phenotypic traits (A–G) of ‘Bonus’, cer.u69, .c36, .i16 and .e8. Variation in
the environments was achieved using two watering regimes (rain and drip) with 10W (19.7 L water d−1) plus nutrients every other day (1N) or every day (2N).
Average of 14 plants ± s.e.von Wettstein-Knowles — Ecophysiology with barley eceriferum (cer) mutants 309
Kernel number Kernel weight 1000-kernel weight
0
Rain/drip control (%)
–15
2.5W,
1N
Bonus
cer.c36
–30
cer.j59
Downloaded from https://academic.oup.com/aob/article/126/2/301/5828402 by guest on 02 October 2020
10W, 10W,
1N 2N
–45
Fig. 7. Rain throughout the vegetative phase alters yield phenotypes. Leftmost bar in each group is ‘Bonus’ with crystals on all organs, centre is cer.c36 lacking
crystals on uppermost internodes and leaf sheaths plus lemmas, and rightmost is cer.j59 lacking crystals on leaf blades. For each panel from left to right the first
group of three bars had 19.7 L water d−1 and nutrients every other day (10W, 1N), the second had 4.9 L water d−1 and nutrients every other day (2.5W, 1N) and the
third had 19.7 L water d−1 and nutrients every day (10W, 2N). *P < 0.05, **P < 0.01, ***P < 0.001.
Kernel number Kernel weight 1000-kernel weight Consequences of differential maturation phase watering for
15 ‘Bonus’, cer.c36, .u69, .i16 and .e8 phenotypes
7.5 Results of rain versus drip watering during the mat-
uration phase were significant decreases from 7.5–9.3
Rain/drip control (%)
0 to 5.7–7.9 g in kernel weight and from 44.3–45.1 to
33.1–37.9 g in 1000-kernel weight in all five genotypes
–7.5 Bonus (Fig. 8; Supplementary Data Table S6). Interestingly, al-
cer.u69 though rain stimulated kernel number in ‘Bonus’ and cer.
–15 u69 plants, rain suppressed kernel number in the other
cer.c36
three mutants (Fig. 8). The extent and direction of the
–22.5 cer.i16
changes resulting from rain during the maturation phase
cer-e8 on the three ‘Bonus’ and cer.u69 yield phenotypes were
–30 analogous and contrasted with the other three mutants,
Fig. 8. Rain in the maturation phase alters phenotype. From left to right in each characterized by decreases in all three yield phenotypes
panel are shown ‘Bonus’ with crystals on all organs, cer.u69 with modified (Fig. 8). Also for the other four traits (culm length, spike
crystals on uppermost internodes and leaf sheaths plus lemmas, .c36 lacking length, straw dry weight and number of ripe spikes) cer.
crystals on uppermost internodes and leaf sheaths plus lemmas plus .i16 and .e8 u69 exhibited changes concordant with ‘Bonus’, although
with reductions of crystals on lemmas. All plants received 19.7 L water d−1 and
nutrients every other day (10W, 1N). **P < 0.01, ***P < 0.001.
of different magnitudes (Supplementary Data Fig. S4).
Supplementary Data Fig. S4 also reveals that straw dry
weight for all four mutants was significantly less with rain
during the maturation phase. Combined, these results imply
that the wax coat structure on the uppermost leaf sheaths
never greater than 14 %. For all three yield traits the effect and internodes plus spikes influences yield.
was least in the 2.5W experiments (Fig. 7, middle group of Doubling the nutrients (2N) with drip watering during the
bars in each panel). These results demonstrate that neither the maturation phase resulted in increases in straw dry weight,
densely lobed plates characteristic of wild-type barley leaves spike number, kernel number and kernel weight (Fig. 6).
from which rain readily sheds (Fig. 3A) nor the few mounds That all increases were significant except for cer.c36 kernel
of wax with closely appressed thin plates which retain water number and weight indicates that this is another pleiotropic
drops on cer.j59 leaves (Fig. 3B) are effective raincoats. That effect of this mutation. By comparison, giving 2N with all
raincoat structures are important, however, is implied by the three watering regimes during the vegetative phase resulted
differences in the extent of the decrease resulting from rain. in consistent, significant straw dry weight and culm length
Given vegetative phase watering, whether or not the dense increases (Fig. 5).
coating of long, thin tubes on the uppermost leaf sheaths and ‘Bonus’ and cer.c36 were included in both the vegetative and
exposed internodes plus spikes of ‘Bonus’ barley protect the maturation phase experiments. Supplementary Data Table S7
plant better than an almost smooth layer of wax does on these compares the results for four traits (culm length, kernel weight,
organs, as characteristic for cer.36, is indeterminable from kernel number and 1000-kernel weight) with drip and rain
these results. watering in the two phases (1N with rain and drip watering in310 von Wettstein-Knowles — Ecophysiology with barley eceriferum (cer) mutants
Table S7A; 2N with drip watering in Table S7B). With one ex- earlier study with Hoagland nutrients given once a week com-
ception all comparisons in Supplementary Data Table S7B re- bined with half the normal amount of water by the standard
veal significant differences, in which the result in the vegetative phytotron method versus twice a week with the normal amount
phase is greater than that in the maturation phase. Comparisons of water. With one exception the former resulted in lower per-
in Supplementary Data Table S7A reveal that culm length, centages of crude protein, and even though the overlap between
kernel weight and kernel number were less with the vegetative the two groups was considerable (Dormling et al., 1969) a
than the maturation phase watering regime, while 1000-kernel similar relationship between nutrition and crude protein per-
weights were significantly greater. Thus, average 1000-kernel centage was deduced here.
weight was 40.5 ± 1.6 g (s.e.) for those with the maturation
phase versus an average of 51.3 ± 1.6 g for those with the vege-
tative phase watering regime. DISCUSSION
Plant cuticles must inhibit not only water loss but also nutrient
Downloaded from https://academic.oup.com/aob/article/126/2/301/5828402 by guest on 02 October 2020
loss. Both these functions have been probed here. (1) The con-
Crude protein content and DBC of ‘Bonus’, cer.c36 and tributions of wax structure and humidity were revealed under
.j59 kernels simulated rain in varying amounts. Highly significant reduc-
tions in kernel yield resulted from the increase in humidity
To test whether watering method and nutrient amount af- regardless of the genotype and its wax structures. The latter,
fected protein content and/or the percentage of basic amino however, conceivably contributes given the different extents of
acids in kernels, crude protein was determined as well as the the decreases. (2) Major defects in the cuticle structure of 28
DBC. Kernels from two plants of each of three genotypes sub- Cer leaf genes and three wlt mutants were screened for using
jected to three different watering regimes and two different nu- TB staining, and the rate of non-stomatal water loss was deter-
trient amounts in experiments 1 and 3 were analysed. Despite mined. None of the genotypes, except cer.zv and .ym, played
the small sample size, suggestive differences were revealed. significant roles. (3) Measuring other phenotypic traits of five
Crude protein from the three genotypes having indistinguish- Cer genes in a range of environmental conditions uncovered
able amino acid compositions varied from 11.1 to 13.8 % new effects as well as confirming known pleiotropic effects.
while DBC ranged from 57.1 to 70.9 µmoles Acilane Orange
G bound to 60 mg crude protein (Supplementary Data Table
S8). In phytotron experiments determining optimum conditions
for maturation of ‘Bonus’ barley that are most similar to those Rain, humidity, wax structure and yield
employed here, a protein content ranging from 13.1 to 15.0 % To investigate whether morphological changes in epicuticular
was negatively correlated to DBC from 62.4 to 64.2 (Dormling wax influence kernel yield in the presence of excess moisture,
et al., 1969). An analogous negative correlation was found for rain was distributed as a fine spray throughout the vegetative
all data herein, with R2 = 0.834. Results cannot be subdivided stage for 4 h every day. This increased the relative humidity
according to watering method or genotype, but can be on the from ~83 to 98 %, which then decreased over the next 8 h to
basis of nutrient amount, as shown in Fig. 9, which is based on 83 %. During this time the temperature was also 2 °C lower
the data in Supplementary Data Table S8. With 1N a lower range on rain trucks. When 2.5W was given, kernel weight compared
of crude protein percentage was correlated with a higher range with the drip control decreased for ‘Bonus’, cer.j59 and .c36 (by
of DBC, while with 2N the opposite occurred, the former’s 16, 9 and 15 %, respectively). Likewise, kernel numbers were
slope being less (−0.237) than the latter’s (−0.359). In all com- reduced. Yield differences under the specified rain parameters
parisons 2N DBC was less than the analogous 1N value, while thus occurred irrespective of whether leaves were decorated
with one exception the crude protein percentage was higher with a dense coat of lobed plates and uppermost leaf sheaths,
(Supplementary Data Table S8). The present results extend the exposed internodes and spikes with long thin tubes or by thin,
flat plates closely appressed to either cuticle surface. This sug-
gests that epicuticular wax structure has little effect on kernel
75
yield under these conditions. Increasing the rain amount 4-fold
DBC (μmoles Acilane Orange/
Nutrients every other day (1N)
(10W), however, resulted in highly significant, additional de-
60 mg crude protein)
70 Nutrients every day (2N) creases in kernel weights of 33 % for cer.j59 and 27 % for cer.
c36, but only an additional 13 % for ‘Bonus’. Significantly
fewer kernels were present on all three genotypes after the
65
greater amount of rain. While in some comparisons of kernel
number and weight increasing the nutrient amount reduced the
60 yield decrease resulting from greater rain amounts, in no case
was it prevented. These results imply that if plants are exposed
to enough rain the wax structure can influence kernel yield.
55
Decreased yields resulting from 10W rain in the vegetative
11 12 13 14
versus maturation phase are not directly comparable because:
Crude protein (%) (1) almost twice as much rain was delivered per day in mat-
Fig. 9. Correlation between crude protein content and DBC of kernels of uration than vegetative phase experiments, and (2) leaves and
‘Bonus’, cer.j59 and .c36 from the different watering regimes of experiments 1 spikes contribute differently to kernel filling. Given the similar
and 3 depends on the nutrition level. wax load and dominating wax structure of tubes on cer.u69 andvon Wettstein-Knowles — Ecophysiology with barley eceriferum (cer) mutants 311
‘Bonus’ (von Wettstein-Knowles, 1972), the analogous effect of stomates. Thus, non-stomatal water loss was ascertained to re-
rain on kernel number and weight is unsurprising. The similar veal whether wax structure participates in this phenomenon. The
greater kernel weight reductions after exposure to rain for cer. results revealed that cer.ys, .yi, .j and .zp lose water at a signifi-
c36, .i16 and .e8 versus ‘Bonus’ and cer.u69 plants cannot be cantly slightly faster rate than the four cultivars and other mu-
correlated with the striking structural modifications of their tants. For example, they lost 80 % of their starting water in 48 h,
wax coats. The results obtained for the maturation phase, how- a period during which the cultivars and other mutants lost 60 %.
ever, are in accord with those from the vegetative phase experi- The cer.zv and .ym mutants lose essentially all their water in
ments. Namely, given enough rain kernel yield is lower in the 3.5 h. Given that water loss is linear, the cer.zv and .ym mutants
specified mutants than in the wild type, implying a minor role lose water 13.5 times faster than cer.ys, .yi, .j and .zp and 18.3
for epicuticular wax in leaching. times faster than the four cultivars and other mutants. These data
Metabolite leaching through leaf cuticles was conclusively lead to the conclusion that, with the exception of cer.zv and .ym,
demonstrated many years ago using radioisotopes (Long et al., none of the other barley leaf Cer genes or the three wlt mutants
Downloaded from https://academic.oup.com/aob/article/126/2/301/5828402 by guest on 02 October 2020
1956). Carbohydrate was the major leachate component (Tukey, play very significant roles, if any, in preventing water loss.
1970). The leaching agent was water in the form of dew, mist,
fog or rain, a light drizzle being more effective than a down-
pour. Moreover, if leaching continued for several days, me-
Associated pleiotropic effects of the studied cer mutants
tabolite translocation from other plant parts was required for
their replacement. The marked humidity effect on transport of The present results extend previous findings and reveal new
ionic compounds through deduced polar pores to the cuticle’s phenotypic modifications caused by mutations in the Cer.i, .e, .j
inner side has been demonstrated. Sugars, amino acids and and .c genes. None was associated with cer.u69. This indicates
ions are presumed to diffuse through the same pores to reach that the Cer.u-encoded hydroxylase (Schneider et al., 2016)
the cuticle surface (Schreiber, 2005). More recently the word may well be limited to hydroxyl insertion into the β-diketone
‘pore’, implying a more or less permanent passage through the carbon chain, the final biosynthetic step in the DKS pathway.
cuticle, has been replaced with the phrase ‘dynamic aqueous The reduction in DKS-derived aliphatics resulting in fewer of
continuum’, reflecting a cuticular network connecting random the long thin tubes in the cer.e8 spike waxes was accompanied
hydrophilic domains that are highly dependent upon hydration by a significant reduction in the C31 alkanes as well as a signifi-
level (Fernández et al., 2017). The present results with very high cant increase in culm length compared with that of ‘Bonus’.
humidity resulting from raining strongly support the idea that By comparison, the reduction in DKS-derived aliphatics char-
this mechanism for transport of water and electrolytes across cu- acterizing cer.i16 resulting in fewer and shorter wax tubes was
ticle surfaces for alpine conifers and tree-line species (Fernández accompanied by a significant decrease in spike length, but not
et al., 2017) also applies to the herbaceous species barley. by a compositional change in the aliphatic lipids versus those of
Leaching has been extensively exploited in recent years to ‘Bonus’. The surprising diversity in phenotypes that are affected
characterize microbial phyllosphere inhabitants (Leveau and by a single cer mutation is hardly surprising given that the wax
Lindow, 2001; Vorholt, 2012) and has led to a model of sugar components not only have to be synthesized but also have to be
diffusion across the cuticular layer of the apoplast (van der Wal transported to the surface, with both processes requiring high
and Leveau, 2011). In the present experiments, insufficient levels of regulation and coordination. For example, expression
translocation of substrates, water soluble carbohydrates and studies of OsABCG9 imply that its product transports not only
nitrogen mobilized from proteins via the phloem (Schnyder, epidermal wax aliphatics but also other lipid-like molecules in
1993; Gebbing and Schnyder, 1999) under intense rain resulted different types of cells (Nguyen et al., 2018).
in significant decreases in kernel weight. The final destination A consonant pleiotropic effect of cer.j59 in all experiments re-
of substrates among major components of barley kernels, ~78– ported here, beyond its marked effect on wax composition and
85 % carbohydrate, 8–11 % protein and 2–3 % lipids (Briggs, load (Giese, 1976), is a height reduction of ~10 % for both culms
1981), however, was apparently unchanged since the kernels’ and spikes, analogous to 8 % in the field (Baenziger et al., 1983).
protein percentage and its amino acid composition were un- Likewise, with respect to 1000-kernel weights, previous field re-
affected by rain in the wild type, cer.j59 and .c36. sults (Baenziger et al., 1983) and those reported here were 9–14 %
less for cer.j mutants than their mother cultivars. While field
kernel weights of cer.j59 were reduced (Baenziger et al., 1983), in
the present and earlier phytotron experiments those of the mutants
Water deficit and barley leaf Cer genes
were elevated by 3–4 % (Gustafsson, 1963). Thus, according to
Water deficit has been the driving factor for studying the re- which trait is used to compare yield, essentially no effect or a re-
lationship between glaucousness and agronomic performance in duction of ≥9 % can be attributed to cer.j non-glaucosity.
the Gramineae. To ascertain whether barley leaf cer mutants had Previous field and phytotron experiments with cer.c3 and
altered cuticle structure and as a result were more susceptible to .c36 resulted in kernel yields 6–18 % less than those of ‘Bonus’
water loss than their mother cultivars, TB staining was carried (Gustafsson, 1963; Gustafsson et al., 1975), which is similar to
out. Except for cer.zv and .ym mutants determining a GDSL- the 15 % less for cer.c36 obtained here using standard phytotron
motif esterase/acyltransferase/lipase gene (Li et al., 2017), none watering conditions with various nutrient amounts. An isoline of
of the other 29 tested cer mutants and three wlt mutants were barley cultivar ‘Troubadour’, having only a trace of a bloom on
stained by TB. Although accounting for only a small percentage the uppermost leaf sheaths and spikes (Febrero and Araus, 1994),
of water loss, the predominant epidermal pavement cells have however, did less well, with a yield ~73 % of that of the glau-
the same type of wax crystals in analogous amounts to the cous mother cultivar in 2 years in the field at Barcelona University312 von Wettstein-Knowles — Ecophysiology with barley eceriferum (cer) mutants
(Febrero et al., 1998). Combining all rain and drip experiments re- rain in the maturation phase on growth traits. Table S1: litres
ported here reveals that cer.c36 kernels weighed 11–35 % less than of water running through pots subjected to the drip and rain
those of ‘Bonus’. A second concordant pleiotropic effect of cer.c36 watering regimes. Table S2: vegetative and yield traits resulting
in the present and original phytotron experiments is a reduction in from the standard phytotron watering regime in the vegetative
kernel number ranging from 11 to 37 %. Although cognate ranges phase. Table S3: vegetative and yield traits resulting from the
in kernel number and weight reduction were found they were un- rain watering regime in the vegetative phase. Table S4: vegeta-
correlated, so that 1000-kernel weight was inconsistently affected. tive and yield traits resulting from the drip watering regime in
An interesting question for the future is how mutation of Cer.C the vegetative phase. Table S5: composition of five wax classes
encoding the polyketide synthase DKS (Hen Avivi et al., 2016; from spikes of ‘Bonus’ and its mutants cer.i16 and .e8. Table
Schneider et al., 2016) results in these pleiotropic effects. S6: vegetative and yield traits resulting from the drip and rain
regimes in the maturation phase. Table S7: comparison of vege-
tative and maturation phase data for four ‘Bonus’ and cer.c36
Downloaded from https://academic.oup.com/aob/article/126/2/301/5828402 by guest on 02 October 2020
phenotypic traits. Table S8: crude protein and dye-binding cap-
Conclusions
acity of kernels from ‘Bonus’, cer.c36 and cer.j59 plants grown
Plant cuticles must protect not only against water loss but under different regimes of 10W and nutrients throughout the
also nutrient loss via leaching. Here both functions were in- entire vegetative phase of growth.
vestigated in barley. Mutants of 28 Cer leaf genes and three
wlt mutants were screened for rate of non-stomatal water loss
and reaction to the TB stain. With the exception of Cer.zv and FUNDING
.ym mutations, none of those studied in the Cer genes or wlt This work was supported by the Danish Natural Science and
mutants significantly affect water retention. Epicuticular wax Swedish Research Councils, the Carlsberg Foundation and
structure determines how long water drops persist on the cu- grant GM-10819 from the National Institutes of Health, US
ticular apoplast surface in contact with the phyllosphere. For Public Service.
a long time humidity in the phyllosphere has been known to
influence nutrient leaching. Recently this has been envisaged
to occur via a cuticular network of hydrophilic domains rather ACKNOWLEDGEMENTS
than pores (Fernandez et al., 2017). Does epicuticular wax
structure play a role in this process? To answer this question I am indebted to the Stockholm phytotron personnel for their as-
the barley cultivar ‘Bonus’ and cer mutants were grown under sistance in making these experiments possible, and to the Nordic
three to 12 different environments in a phytotron and sub- Genetic Resource Center, Alnarp, Sweden (www.nordgen.org)
jected to simulated rain, effecting a humidity increase, during for specified seeds. Lars Munck is thanked for making crude
the vegetative or maturation growth phases. A highly signifi- protein and DBC measurements and Mats Hansson for growing
cant extent of leaching was deduced from the decreases in plants for the water loss experiments.
kernel yield, implying significant nutrient loss regardless of
wax structure. Given the different extents of the decreases,
however, wax structure conceivably contributes. The experi- LITERATURE CITED
mental setup employed will be useful for investigating the Baenziger PS, Wesenber DM, Sicher RC. 1983. The effects of genes control-
mechanism of leaching in herbaceous species. ling barley leaf and sheath waxes on agronomic performance in irrigated
Measuring other phenotypic traits uncovered new effects and and dryland environments. Crop Science 23: 116–120.
Baker EA. 1974. The influence of environment on leaf wax development in
confirmed and extended to a wider range of environments pre- Brassica oleracea var. gemmifera. New Phytologist 73: 955–966.
viously noted pleiotropic effects. Interesting questions for the Bonnell VC. 2012. Investigating the control of stomatal development and func-
future are the bases for the pleiotropic effects of the Cer.i, .e, .j tion in T. aestivum and H. vulgare. PhD thesis, University of Bristol, UK.
and .c mutations. For example, how does a mutation in Cer.c, Briggs DE. 1981. The biochemistry of malting grain. Malting and Brewing
encoding the polyketide synthase DKS essential for synthesis Science 1: 57–109.
Buschhaus C, Jetter R. 2012. Composition and physiological function of the
of the β-diketone aliphatics (Hen-Avivi et al., 2016; Schneider wax layers coating Arabidopsis leaves: β-amyrin negatively affects the
et al., 2016), also result in decreased kernel size and number? intracuticular water barrier. Plant Physiology 160: 1120–1129.
Why does mutation of Cer.j have such a marked effect on wax Dormling I, Gustafsson Å, Jung HR, von Wettstein D. 1966. Phytotron cul-
composition and load (Giese, 1976) while simultaneously re- tivation of Svalöfs ‘Bonus’ barley and its mutant Svalöfs Mari. Hereditas
56: 221–237.
ducing plant height and 1000-kernel weight? Where in me- Dormling I, Gustafsson Å, von Wettstein D. 1969. Phytotron cultivation
tabolism do the genes function that both influence the DKS of ‘Bonus’ barley: the control of maturation and quality. Hereditas 63:
pathway and determine either shorter spikes in Cer-e mutants 415–428.
or longer culms in Cer-i mutants? Eigenbrode SD. 2004. The effects of plant epicuticular waxy blooms on at-
tachment and effectiveness of predatory insects. Arthropod Structure &
Development 33: 91–102.
Farquhar GD, Ehleringer JR, Hubick KT. 1989. Carbon isotope discrimin-
SUPPLEMENTARY DATA ation and photosynthesis. Annual Review of Plant Physiology and Plant
Molecular Biology 40: 503–553.
Supplementary data are available online at https://academic. Febrero A, Araus JL. 1994. Epicuticular wax load of near-isogenic barley
oup.com/aob and consist of the following. Figure S1: results lines differing in glaucousness. Scanning Microscopy 8: 735–748.
Febrero A, Fernández S, Molin-Cano J, Araus JL. 1998. Yield, carbon
of toluidine blue staining. Figure S2: water loss of barley cul- isotope discrimination, canopy reflectance and cuticular conductance of
tivars and mutants. Figure S3: effect of simulated rain in the barley isolines of differing glaucousness. Journal of Experimental Botany
vegetative phase on growth traits. Figure S4: effect of simulated 49: 1575–1581.You can also read