Techniques, Tools, Platforms and Algorithms in Close Range Photogrammetry in Building 3D Model and 2D Representation of Objects and Complex ...
←
→
Page content transcription
If your browser does not render page correctly, please read the page content below
42

 Techniques, Tools, Platforms and Algorithms in Close Range
Photogrammetry in Building 3D Model and 2D Representation of
 Objects and Complex Architectures

 Massimiliano Pepe1 and Domenica Costantino2

 1Dicatech, Politecnico di Bari, via E. Orabona 4, Bari, Italy, massimiliano.pepe@poliba.it
 2Dicatech, Politecnico di Bari, via E. Orabona 4, Bari, Italy, domenica.costantino@poliba.it

 Corresponding author: Massimiliano Pepe, massimiliano.pepe@poliba.it

 Abstract. The aim of this paper is to identify a suitable pipeline in order to build
 high-resolution 3D models and 2D orthophotos of objects and architectural structures
 of particular historical and cultural importance by means of the photogrammetric
 method. An accurate reconstruction of architectural elements can be exploited both
 for a detailed analysis of the artefacts, and also to determine the original position of
 detached architectural fragments. Structure from Motion (SfM) and Multi View Stereo
 (MVS) approaches have already been successfully applied in many applications to
 build 3D models. Moreover, the obtained reconstruction can be exploited in order to
 build orthographic projections of the object from different directions: the orthophotos
 generated in this way ensure a very high geometric resolution (even sub-millimetre)
 and accuracy. Orthophotos are particularly useful for the digital documentation and
 analysis of archaeological and architectural objects. To such aim, the direction to be
 used for the computation of the orthophoto, which in certain cases might be non-
 trivial, should be carefully determined. This work describes a simple procedure for
 the definition of such projection direction, while also enabling the express the object
 position according to certain specific requirements. In addition, the use of low-cost
 smartphone and action cameras was investigated to carry out photogrammetric
 surveys. Finally, this paper shows the results obtained with an imagery acquisition
 tool to be mounted on the top of a drone, developed ad hoc in order to properly
 acquire images for instance of the base of high bridges that cannot be achieved
 through a terrestrial survey. The developed tools and the overall proposed method
 is validated on three case studies, two related to terrestrial surveys, whereas the
 latter consider an example of UAV (Unmanned Aerial Vehicle) photogrammetry with
 the developed imagery acquisition device.

 Keywords: SfM; Photogrammetry; MVS; CRP; orthophoto; CAD; UAV.
 DOI: https://doi.org/10.14733/cadaps.2021.42-65

 Computer-Aided Design & Applications, 18(1), 2021, 42-65
 © 2021 CAD Solutions, LLC, http://www.cad-journal.net
43

1 INTRODUCTION
Thanks to the recent technological developments, an increasing number of techniques and
instruments can be used for Cultural Heritage (CH) digital documentation and for sharing the
obtained representation. The documentation methods currently available can often to lead to
excellent results in terms of precision, speed, completeness and realism of the documented artefacts
[1].
 Recently, the combination of Close Range Photogrammetry and UAV (Unmanned Aerial Vehicle)
platforms has become widely popular, leading to the introduction of the term “UAV photogrammetry”
to identify such working condition [2].
 The ease of application of SfM/MVS (Structure from Motion/Multi View Stereo) based 3D
reconstructions, and to the automatism in the UAV flight planning and image acquisitions, this
approach was applied in an increasingly number of contexts, ranging from architecture, architectural
heritage, archaeology, geomorphology, to urban planning [3, 4, 5]. Since nowadays several drones
are available on the market, the UAV platform selection can be done taking into account of the
specific needs of the considered application, and of the different characteristics of the drones, such
as control system, flight rules, the airspace classification, wing types, the take-off/landing direction,
types of take-off/landing, aircraft engine, the fuel system, weight, maximum range of flight, flight
altitude, aircraft functions [6].
 The steps of the SfM-based photogrammetry processing pipeline can be summarized as follows:
image pre-processing, key point extraction and match, computation of an initial solution for the
exterior camera orientation parameters and 3D positions of tie points, bundle adjustment, dense
point cloud generation and mesh building [7, 8], where the main steps of such procedure are typically
performed by using the SfM and MVS approaches [9, 10, 11]. This processing pipeline has become
popular mainly because of its ability to evaluate the camera's external orientation without any prior
knowledge of the camera position and 3D points.
 In the photogrammetric pipeline, sometime it is very difficult or impossible to build a correct
3D model from a set of pictures (shiny or transparent objects, moving objects, flat objects, etc.)
This issue has led to the development appropriate sensors, techniques and algorithms capable of
reconstructing 3D models [12, 13].
 Once a 3D point cloud is computed, several other products can be produced, such as
orthophotos. To be more specific, an orthophoto can be obtained as an orthogonal projection of
points on a plane, consequently, different orthophotos can be obtained from the same 3D point cloud
depending on the considered plane. The definition of the plane to be used for the orthophoto
generation is rather intuitive, depending on the complexity of the object. For instance, in the case
of a building, orthophotos can be generated in order to produce orthogonal views of its facades [14,
15]. Differently, the selection of a suitable plane for computing a proper orthophoto is a not so easy
task when considering complex surfaces and objects. In order to ease such task, this work proposes
a simple procedure based on a Lisp script that allows quickly and intuitively determining the
parameters of the desired orthogonal projection in non-trivial cases.
 Such procedure was tested on several case studies, along with an investigation of the 3D
reconstruction performance obtained with low-cost cameras, such as those in smartphones and
action cameras, with respect to that obtained with professional digital single-lens reflex cameras.
Finally, an ad hoc imagery device was developed in order to acquire close views of certain parts of
high structures, such as bridges, for photogrammetric purposes.
 The paper is organized as follows. In the first part, the paper briefly summarizes the
photogrammetric pipeline to be used to obtain 3D models and orthophotos. Then, a fast procedure
developed in order to quickly determine planes to be considered for orthophoto generations is
presented in the second part of the paper. Such procedure is tested on several case studies to check
its effectiveness: the first case study deals with the 3D reconstruction of a small object using a
standard smartphone camera. In the second case study, the survey and modelling of an architectural

 Computer-Aided Design & Applications, 18(1), 2021, 42-65
 © 2021 CAD Solutions, LLC, http://www.cad-journal.net
44

element was realized using a compact camera. An extensible pole was also used in order to ensure
a sufficiently detailed reconstruction of the upper part of the structure. In the last cast study, UAV
photogrammetry was used for the survey of a roman masonry bridge. Since the base of the bridge
was not accessible, a special device was realized to enable the UAV photo acquisitions of such part
of the bridge from the bottom (in zenith direction). Finally, some conclusions are drawn at the end
of the paper.

2 PHOTOGRAMMETRIC PIPELINE

2.1 SfM Approach
The SfM pipeline allows the reconstruction of 3D object starting from a set of images acquired from
different observation points by means of the following two steps [16, 17]: Correspondence search
and Reconstruction stage. Furthermore, the first task can be divided in three sub-steps: Feature
Extraction, Feature Matching and Geometric Verification. The Feature Extraction task, using suitable
algorithm, such as the Scale-Invariant Feature Transform (SIFT) feature detector [18], allows to
identify and describe local features and points of interest of the image in images (key-points). The
Feature Matching searches for feature correspondences by finding the most similar feature task and
identifies the parts of the images that are overlapping [19]. This Geometric Verification validates the
potentially overlapping image pairs using a robust estimation technique, such as RANSAC (RANdom
SAmple Consensus) [20].
 As regards the Reconstruction stage, this stage can in turn be divided in four steps:
Initialization, Image registration, Triangulation, Bundle Adjustment (BA). In the Initialization step,
the system begins with a carefully selected two-view reconstruction and, in order to obtain a good
reconstruction, it is desirable to start from an area containing a large number of the identified
features. Subsequently, using feature correspondences, a new image is added to the reconstruction
and, consequently, the corresponding camera position and orientation are calculated (Image
registration step). This aim can be achieving by solving the Perspective-n-Point (PnP) problem [21,
22]. To define the 3D coordinates of the new points that can be added to the reconstruction and
thus obtaining a denser point cloud, the Triangulation process is used. Lastly, Bundle Adjustment
(BA) is used to improve the parameter values obtained in the initial SfM solution, e.g. improve the
estimates of the camera poses. Extensive reviews on Bundle Adjustment and on the procedure to
follow in order to achieve highly efficient reconstructions are given in several works [23, 24, 25, 26].
 Brown (1971) [27] established a camera model widely used in photogrammetry: such model
implements the collinearity condition to establish a mathematically rigorous relationship between
image and object. It uses 10 additional parameters (Aps) related to internal camera orientation
(Δxp, Δyp, Δc), uncertainty about the shape of the pixel (skew factor Sx), non-orthogonality of the
reference system (shearfactor Λ), radial symmetric distortion of the lenses (k1, k2, k3) and
tangential distortion of the lenses (p1, p2). The development of the so-called camera “self-
calibration” allowed obtaining high 3D precision models also with low-cost (non-professionals)
cameras. Two different approaches are typically used in the photogrammetric workflow: camera
Self-calibration and Pre-calibration.
 In the “self-calibration” approach, the internal parameters, external orientation and object
coordinates of the points are unknowns. In this approach, the “Additional Parameters” (APs) are
used to take into consideration of the systematic errors due to the acquisition process of the frames.
Self-calibration with BA can be described by the extended collinearity model [20]:

 − + ∆ −
 ( − + ∆ ) = ( − ) (1)
 − −

where

 Computer-Aided Design & Applications, 18(1), 2021, 42-65
 © 2021 CAD Solutions, LLC, http://www.cad-journal.net
45

 , , Object point coordinates;
 , , Perspective centre;
 , Principal point offsets;
∆ , ∆ Image coordinates perturbation;
 Rotation matrix;
 , Image space coordinates;
 Focal length (or principal distance);
 Scale factor for the image radius.

The additional parameters ∆ , ∆ can be calculated by following equations:
 ∆
 ∆ = −∆ 0 + ̅ + ̅ + ̅ + ( 1 2 + 2 4 + 3 6 ) ̅ + 1 ( 2 + 2 ̅ 2 ) + 2 2
 ̅̅̅

 (2)
 ∆
 ∆ = −∆ 0 + ̅ + ̅ + ̅ + ( 1 2 + 2 4 + 3 6 ) ̅ + 2 1 ̅̅̅ + 2 ( 2 + 2 ̅ 2 )

Where:
 ̅ = − 0 ; ̅ = − 0 and 2 = ̅ 2 + ̅ 2 while 1 , 2 , 3 are radial distortion coefficients, 1 , 2 are
decentring (tangential) distortion coefficients, the shape factor (uncertainty about the shape of
the pixel) and A shear factor, i.e. the factor that takes into account of the non-orthogonality of the
reference system.
 The BA solution includes estimates of the external orientation parameters of each image and
the object coordinates of the points, which are obtained by collimating a certain number of
homologous points in all the images.
Instead, pre-calibration requires the introduction in the BA optimization of the internal camera
parameter values as priors, which are pre-computed with a suitable camera calibration procedure.
 An example of camera calibration software is Agisoft Lens that supports the estimation of the
full camera calibration matrix, including non-linear distortion coefficients on the basis of Brown’s
model. Camera calibration procedure is typically obtained by properly processing a set of photos of
a calibration pattern (chessboard) taken from different point of views. The typical outcomes of the
calibration procedure are the estimated camera parameter values and their uncertainties, expressed
as Standard Deviation values (SD).

2.2 Multi-View-Stereo Algorithms
Multi-View-Stereo algorithms, e.g., Clustering Views for MVS-CMVS and Patch-based MVS-PMVS
[28] allow increasing the point cloud density previously generated during the SfM process. In this
way, it is possible to produce accurate, coloured and point clouds much denser than the SfM-derived
sparse ones.
 MVS algorithms exist in several form: volumetric representations [26], PMVS implementation
of Furukawa [29] and Multi-View Stereo for Community Photo Collections approach by Goesele [30],
which reconstructs a depth map for every view.

2.3 Acquisition Technique in Close Range Photogrammetry Environment
The SfM-MVS approach allows the reconstruction of 3D structures starting from a set of images
acquired from different observation points.
 Typical characteristics of the camera network employed for automated close-range camera self-
calibration are: acquisition of many images recorded with fixed zoom/focus settings, diversity in
camera roll angles and views arranged in a strongly convergent configuration [20]. Indeed, the use

 Computer-Aided Design & Applications, 18(1), 2021, 42-65
 © 2021 CAD Solutions, LLC, http://www.cad-journal.net
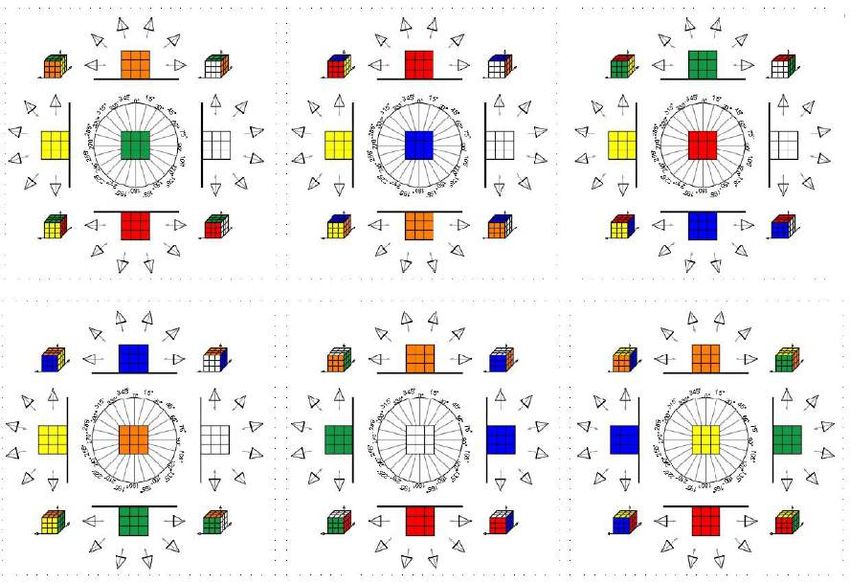
46

of a suitable image acquisition technique plays a fundamental role for the success of the SfM-MVS
procedure.
 For example, figure 1 shows a possible camera configuration for the reconstruction of the
famous “Rubik's cube”.

Figure 1: Examples of the appropriate capturing scenarios of the 3D object by SfM photogrammetric
technique.

2.4 Surface Triangulation or Mesh Generation
Once a coloured dense point cloud is built, the construction of a polygonal surface (triangular or
tetrahedral meshes) properly fitting such cloud is considered next. Using an appropriate triangulation
process, a given set of points is converted into a coherent polygonal model. Such triangulation can
be performed in two or three dimensions, in accordance with the geometry of the input data. A
widespread two-dimensional interpolation method is the Delaunay Triangulation (DT).
 Starting from the intuition of Dirichlet for the decomposition of a domain into several adjacent
(and non-overlapping) convex polygons, the Delaunay method allows defining three-way points such
that the circle surrounding each triangle does not contain other elements of the original point set
[31]. A 3D Delaunay triangulation is also called a Delaunay tetrahedralization. A tetrahedral mesh
is a discrete representation of a 3D continuous space, both in its topology and geometry [32]. In
general, the conversion from point clouds into a polygonal surface is based on four steps [33]:
 • pre-processing: the erroneous data are eliminated;
 • determination of the global topology of the object's surface: the relations of the several parts
 of the feature are established;

 Computer-Aided Design & Applications, 18(1), 2021, 42-65
 © 2021 CAD Solutions, LLC, http://www.cad-journal.net
47

 • generation of the polygonal surface: triangular (or tetrahedral) meshes are created satisfying
 specific quality requirements;
 • post-processing: editing and refining of the 3D model.

2.5 Orthophoto Generation
Orthographic projection (or orthogonal projection) is a means of representing three-dimensional
objects in two dimensions. Therefore, in several applications one or more orthophotos of an object
can be considered to properly describe it, where each orthophoto is associated to a properly selected
plane. Depending on the quality of the orthophotos, a further editing in raster graphics editor
software may be required.

2.6 Agisoft Metashape Pipeline and Possible Settings
Agisoft Metashape was used for 3D data processing in all the case studies investigated in this
manuscript. In this software, the 3D model reconstruction and orthophoto can be obtained by
following steps.
 • (SfM) Image alignment. Homologous key-points are detected and matched on overlapping
 images, leading to an estimate of the external camera parameters. Before performing image
 alignment, the object of interest shall be separated from background ones using masks:
 such step allows to both reduce the computational effort, and to reduce the risk of matching
 errors, due to the changes in the surrounding environment in the images acquired by quite
 different points of view. Several accuracy options can be selected at this step: selecting
 “High” accuracy, Agisoft Metashape uses the full resolution photo, “Medium” setting causes
 image downscaling by factor of 4 (2 times by each side), at “Low accuracy” source files are
 downscaled by factor of 16, and “Lowest” value means further downscaling by 4 times more.
 Furthermore, “Key point limit” (upper limit of feature points on every image to be taken into
 account during current processing stage) and “Tie point limit” (upper limit of matching points
 for every image) can also be properly set.
 • (MVS) Building dense cloud. By the use of dense image matching algorithm, the software
 generates a dense point cloud, whose final cardinality depends on the chosen settings: “Ultra
 high” setting implies the processing of full size images, whereas with “High”, “Medium”,
 “Low” and “Lowest” images are downscaled before the dense matching procedure by a factor
 50%, 25%, 12.5% and 6.75%, respectively.
 • Building mesh. In this step, textured triangulated meshes are obtained from dense point
 clouds. If interpolation mode is Disabled, the software leads to more detailed reconstruction
 results since only areas corresponding to dense point cloud points are reconstructed. Manual
 hole filling is usually required in a post-processing step. With Enabled interpolation mode
 Agisoft Metashape interpolates point positions within a neighbourhood of each point, defined
 by a properly set distance. As a result, some holes are automatically removed.
 • Building orthomosaic. In this step, the whole object surface is textured in the orthographic
 projection. In addition, Agisoft Metashape enables to perform orthomosaic seam-line editing
 for better visual results.

3 METHOD
To build textured 3D models, the first step is to evaluate if the object (or structure) under
investigation can be realized by terrestrial or aerial survey.
 This aspect is related to dimensions of the object (or structure) especially in height. In this
latter case, the use of a special pole may be useful to reach suitable heights for the survey.
Instead, in the case the survey cannot be realized by traditional platform, special device must be
realized in order to acquire information. For example, in order to perform a survey of structures
located in critical environment (places not accessible by land or with imminent dangers for the
operator or due to natural obstacles) the UAV platform may be modified in order to acquire

 Computer-Aided Design & Applications, 18(1), 2021, 42-65
 © 2021 CAD Solutions, LLC, http://www.cad-journal.net
48

information to 360° of the scene. For achieve this aim, it is necessary to design of a special device
that mounted on the top of UAV allows to observe a scene a 360; this involve in the use a further
special camera (light. wide field of view) that requires an evaluation of the level of accuracy. This
latter task may be obtained by the use of 3D test-field.
 Therefore, once acquired the images by the use of suitable low-cost sensor and platform, using
SfM/MVS approaches is possible to build 3D point cloud. Depending on the accuracy achieved in the
specific case study, self-calibration or pre-calibration mode is used.
 Subsequently, once obtained a textured 3D model as previously described, in several
applications it is necessary to consider a representation of such objects obtained by means of one
or more orthophotos. To such aim, a proper direction should be properly determined in order to
obtain each desired orthographic projection of the reconstructed object. To ease the computation of
such direction, a rigorous approach was developed in this paper, exploiting a CAD (Computer-Aided
Design) software, as described in the following. This environment allows to easily identifying
geometric conditions (e.g. parallelisms, orthogonality) in relation to the shape of the object and the
plane you want to have as reference.
 First, the specific plane along which the orthophoto shall be computed is identified by setting
some GCPs (Ground Control Points) on the images in Agisoft Metashape. Then, GCPs and the 3D
point cloud (preferably the sparse point cloud because it is easier to manage), which are typically
expressed in a UCS (User Coordinate System) i.e. the mobile Cartesian coordinate system that
defines the work plane, are imported in CAD environment.
 The import of the GCPs within the CAD environment were obtained through the development of
appropriate algorithms developed in Lisp (List Processor) language, which is a programming
language developed by McCarthy [34] and used in Computer-Aided Design (CAD) systems [35].
The use of GCPs arranged along the desired axes allows obtaining a proper rotation and translation
of the 3D object. From an analytical point of view, the rotation in the space of each point P with
coordinates (x,y,z) in a generic coordinate system, in a desired coordinate system (X,Y,Z) can be
obtained using the cosines of the angles between the coordinate axes [36]:

 cos ( ) cos ( ) cos ( )
 ( ) = (cos ( ) cos ( ) cos ( )) ( ) (3)
 cos ( ) cos ( ) cos ( )

In the synthetic formula, the previous formula can also be written as:

 = (4)

The rotation matrix R consists of 9 linearly independent parameters generated by 3 variables in a
non-linear way. Each row and each column of the rotation matrix must have unitary value, and each
row and each column are orthonormal to each other, as they form an orthonormal basis.
Subsequently, only the GCPs are exported according to the new reference system and imported into
the SfM software in order to build the orthophoto and, of consequence, to obtain CAD representation
of a façade (or a particular) of the object (or structure) too.
 In our experimentation, we used Agisoft Metashape commercial software but the same approach
can also be applied to other commercial and non-commercial 3D photogrammetric software. The
aspect to take into account is the possibility of the software to import and export GCPs according to
a specific formatting of the file.
 In summary, the developed pipeline that allows obtaining 2D representation (orthophoto) from
3D model is shown below (Figure 2):

 Computer-Aided Design & Applications, 18(1), 2021, 42-65
 © 2021 CAD Solutions, LLC, http://www.cad-journal.net
49

 3D photogrammetric
 survey

 Terrestrial Aerial

 Choice of a suitable sensor
 (or multi-sensors) and a
 suitable platform

 Image
 acquisition

 Building 3D point cloud by the use of
 SfM and MVS algorithms

 Building mesh
 (3D textured model)

 Identification of the GCPs
 2D plan identification
 (in Agisoft Metashape environment)

 Export GCPs and sparse point cloud

 Import data in CAD software

 Realization of the reference system
 Building Lisp file
 and export of GCPs

 Import of GCPs
 (in Agisoft Metashape environment)

 Vector representation Building othophoto

 Figure 2: Pipeline to obtain 3D model and 2D orthophoto-Vector representation.

The method described was applied to three case studies. The first one concerns the modelling of a
mortar of modest dimensions and surveyed with terrestrial photogrammetry. The second case study
concerns the construction of a 3D model of an ionic capital inside an archaeological area and
surveyed with terrestrial photogrammetry and with the aid of a pole (to survey the upper part of the

 Computer-Aided Design & Applications, 18(1), 2021, 42-65
 © 2021 CAD Solutions, LLC, http://www.cad-journal.net
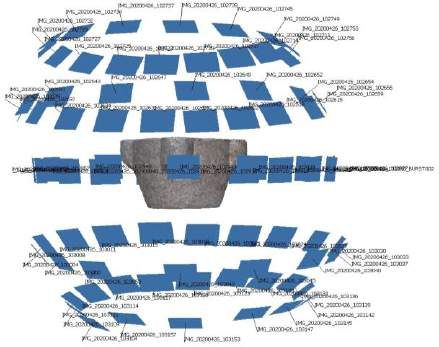
50

structure). The third case study concerns the modelling of a historical masonry bridge surveyed by
photogrammetric method, in its entirety, exclusively with UAV platform.

4 CASE STUDIES

4.1 Case Study 1: 3D and 2D Representation of a Stone Mortar

4.1.1 3D survey and modelling
This case study investigates the reconstruction and representation of a stone mortar. Mortars were
used since ancient times to prepare ingredients or substances by crushing and grinding them into a
fine paste or powder in the kitchen, medicine and pharmacy. The mortar used in this case study is
a hand-carved marble stone from Italy, probably dated back to the late 19th century, whose sizes
are: 18 cm diameter across the handles/lugs, by 16 cm the high and 3cm the thick.
 The photogrammetric surveys of this object were carried out using Huawei P20 lite smartphone
that is a low-cost device able to acquire images with a resolution of 16MP with a f/2.2 lens. The pixel
dimension of Huawei P20 lite smartphone is of 1.1μm and the focal length is 3.81mm. 156 images
were taken at a distance of about 30 cm and using the same focus in order to obtain a GSD (Ground
Sample Distance) of about 0.1mm.
 Four sessions of survey were performed because for 4 times the object was rotated in order to
properly acquire all its details. In each session, the photos were taken with a convergent
arrangement, as suggested for SfM surveys of isolated objects. As background, a black panel was
used in order to ease the mask definition process. Indeed, in this way, the high contrast between
the object and the background, allowed an effective use of the border recognition tool (that it is
implemented in the software with the name "intelligent scissors"), allowing the draw of the polygon
of the area of interest on the image in a quick and accurate way. In addition, the survey was
performed in an open environment with uniform lighting condition on the object.
 In the alignment step, all the images were correctly positioned in the space and a sparse cloud
of 320,872 points was generated. The dense cloud was generated using the setting “high”, which
lead to the computation of 3,192,236 points. A representation of the position of the cameras on the
point cloud that schematically shows the acquisition pattern is shown in Figure 3a. In building mesh,
using “moderate” parameter as “Depth filtering” and enabling the interpolation, 6,313,344 facets
were created. Table 1 shows the error evaluated on 4 calibration bars.

 Scale bar Dimension Error
 (m) (m)
 1-2 0.20 0.0005
 3-4 0.20 0.0002
 5-6 0.20 0.0001
 7-8 0.20 0.0004

 Table 1: Accuracy of the photogrammetric block of the images.

The total error, i.e. root mean square error for X, Y, Z coordinates for all the cameras can be
calculated by following formula:

 ( , − ) + ( , − ) + ( , − )
 = √∑ (5)

 =

 Computer-Aided Design & Applications, 18(1), 2021, 42-65
 © 2021 CAD Solutions, LLC, http://www.cad-journal.net
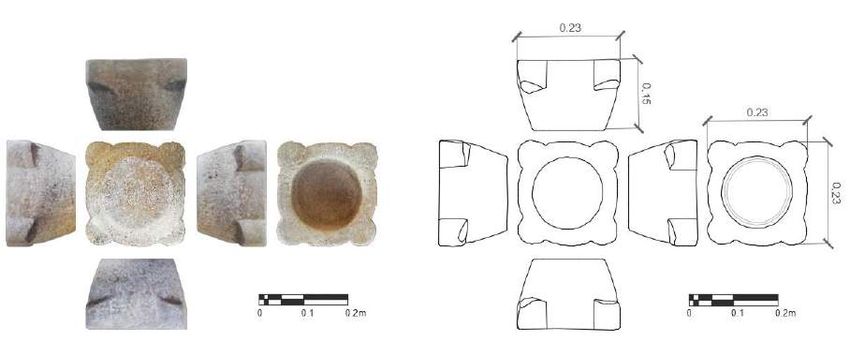
51

Where is the input value for x coordinate, the input value for y and the input value for z
coordinate for the i–th camera position, while ( , , , , , ) corresponds to its estimated position.
 Using the setting highest, the total error achieved was 0.0002m. Varying the level of accuracy
available within the software, it was possible to build the following Table 2. In this way, it is possible
to identify the quality of the alignment according the diverse resolution of the photo. In addition, an
analysis of the processing times was carried out in order to analyse the different settings (available
within the software).

 Level of accuracy Aligned images Total error Cover of the Time processing
 (m) object (s)
 Highest 156/156 0.0002 Full 7926
 High 156/156 0.0002 Full 7067
 Medium 154/156 0.0003 Full 1551
 Low 154/156 0.0003 Full 340
 Lowest 59/156 - Partial 97

 Table 2. Evaluation of the accuracy varying the alignment setting.

The final 3D model with mesh can be visualized according three type of representation: solid (figure
3.b) and coloured mesh (figure 3.c) views

 (a)

 (a) (c)
Figure 3: 3D models: View of point cloud and cameras poses (a); 3D model in solid view (b; 3D
model with texture (c).

The same object was also detected with a Nikon D5000 digital Single-Lens Reflex (dSLR) camera
with a AF S DX NIKKOR 35mm f/1.8G lens. 149 images were acquired and, subsequently, processed
in Agisoft Metashape software. In this test, the total error achieved was 0.00002m. This means that
the use of dSLR cameras and quality lenses allows high accuracy to be achieved.

4.1.2 2D representation
The produced 3D model is typically positioned and orientated according to a generic reference
system. In other words, the base of the object is not parallel to the horizontal axis. In order to
achieve this aim, the pipeline indicated in figure 1 was carried out. Indeed, 6 GCPs were created in

 Computer-Aided Design & Applications, 18(1), 2021, 42-65
 © 2021 CAD Solutions, LLC, http://www.cad-journal.net
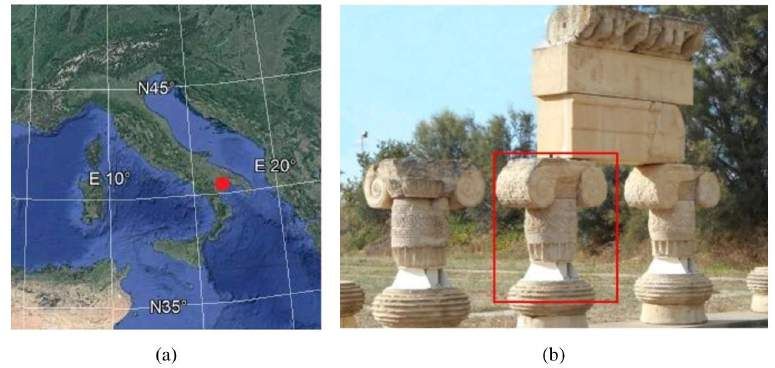
52

SfM software and, subsequently, exported in *.csv format. Similarly, the sparse point cloud in .dxf
format was exported. It was chosen the sparse point cloud because the management of a small
point cloud was easier. Then, the point cloud and the GCPs were imported in CAD environment. Once
established the new reference system, the new coordinates of the GCPs were exported and used in
Agisoft Metashape software. In this way, it was possible building the orthophoto (2D) of the single
façades of the object. Indeed, using the mesh as surface and the option “Mosaic” as “Blending
mode”, the orthophoto with a resolution of 0.2mm was generated using the tool Building
orthomosaic. To improve the quality of the orthophotos, an editing in Photoshop CS5 was carried
out. Indeed, this software has a complete toolbox for retouching and colour correction, and it allows
importing and managing individual orthorectified images in separate layers. A 2D representation of
the surveyed stone mortar is shown in the figure 4.

 Figure 4: 2D representation of the object under investigation.

4.2 Case study 2: survey and modelling of the Ionic capitals located in the
 archaeological area of Metapontum, Italy

4.2.1 3D survey of a capital in Metapontum area
The second case study concerns the capitals and the related colonnades in the archaeological area
located in Metapontum, in the south Italy (figure 4.a).
 This area includes the urban sanctuary, part of the agora, the handicraft district for the
production of ceramics, the great north-south road axis (plateia) on which the entire urban system
is imposed and the temples. This latter structure represents the most important testimonies for the
knowledge of the contributions of the Greek oriental world to the architecture of the Greek west in
the late archaism and in the early classical age. Among the four main temples of the sacred area,
the largest two have been attributed to Hera and Apollo; the sacellum is considered consecrated to
Athena while the fourth temple is considered to belong to Artemis or, according to another
hypothesis, to Aphrodite [37].
 The capitals and the related colonnades of this latter temple were taken into consideration in
the present study, in relation to their state of conservation and the particular shapes of the
structures. In particular, the centre capital of East side was surveyed.
 As shown in figure 5, at the base of the columns, there are metallic (artificial) structures that
have allowed to bring back the original structure to their exact position. In this way, verticality was
given to the colonnade and a horizontal position to the capitals and to the structure resting on them.

 Computer-Aided Design & Applications, 18(1), 2021, 42-65
 © 2021 CAD Solutions, LLC, http://www.cad-journal.net
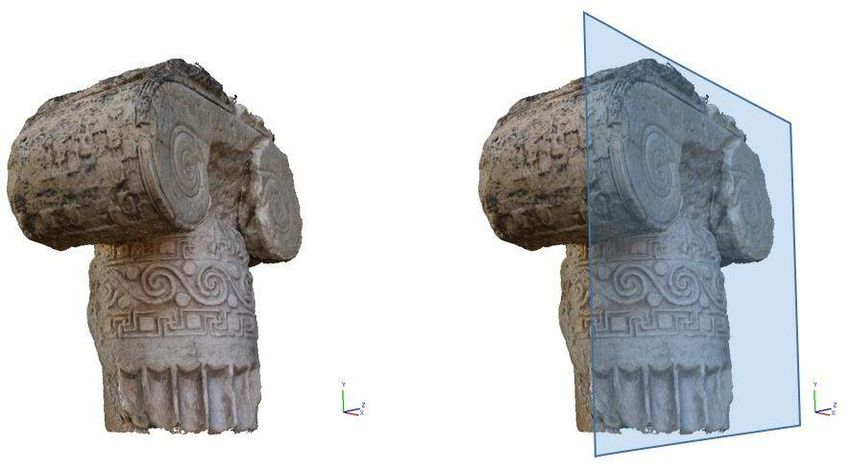
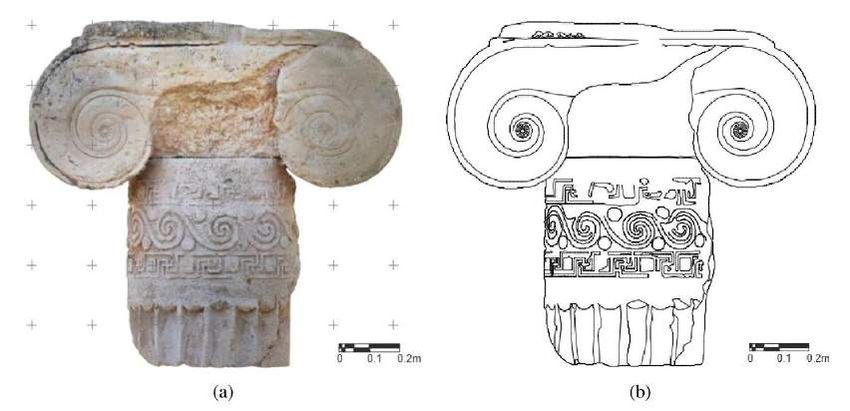
53

In other words, a physical roto-translation of the structure was made with respect to the position in
which they were located.

Figure 5: Study area: Identification of the Metapontum site (Italy) on Google Earth map -
approximated geographic coordinates, latitude: 40.383570°N, longitude: 16.824375° E (a);
panoramic photo of the structure and identification of the capital under investigation (b).

The survey of the capital was realized using ultra-compact camera Canon PowerShot SX730 HS. The
Canon PowerShot SX730 HS features a 20.3 megapixel 1/2.3-inch CMOS sensor, and a 40x optical
zoom which is equivalent to 24-960mm in 35mm terms. In particular, the survey of the lower part
was performed with this camera according to the CRP approach. Since the upper part is not
detectable through a traditional photogrammetric survey, it was necessary to use a pole extensible
for maximum length of 4 meters. The pole is composed by an extensible rod and a device positioned
at the end of the pole where the camera is fixed. A total amount of 217 images were acquired and
the processing was carried out in Agisoft Metashape software. In this way, a textured 3D model of
the Ionic capital was realized. The output parameters of the elaboration in Agisoft Metashape
software, can be summarized in the following Table 3.

 Features Values
 Tie points (#) 420,312
 Dense clouds (#) 6,147,741
 Faces (#) 11,622,989
 Total error evaluated on 3 scale bar (m) 0.0006

 Table 3: Output parameters of the project.

4.2.2 2D representation: orthophoto and vector (traditional approach)
Considering the complexity of the structures taken into consideration, ten GCPs (easily recognizable)
on the structure were used. In order to carry out the roto-translation, a specific plane was chosen.
In this way, it was possible to build an orthophoto with a spatial resolution of 0.2mm (Figure 6).
 Figure 7 shows a 2D representation of the Ionic capital where on the left image, it is shown the
detailed orthophoto (figure 7.a) while on the right image, it is reported a vector representation of
the external façade of the temple (figure 7.b).

 Computer-Aided Design & Applications, 18(1), 2021, 42-65
 © 2021 CAD Solutions, LLC, http://www.cad-journal.net
54

 Figure 6: Textured 3D model and definition of the plane on the capital.

This latter representation was obtained through the aid of “edge detection” algorithm, which is the
process of locating brightness discontinuities between pixels in a digital image. In particular, Sobel
operator was used for obtaining a vector representation. Sobel is a discrete differential operator that
utilizes two 3x3 kernels: one estimates the gradient in the x direction while the other one estimates
the gradient in the y direction.
 If we define as the source image, the computations are as follows [38]:
 −1 −2 −1 −1 −2 −1
 = [ 0 0 0 ]∗ = [ 0 0 0 ]∗ [6]
 +1 +2 +1 +1 +2 +1
where * denotes the 2-dimensional convolution operation.
 At each point in the image, the resulting gradient approximations can be combined to give the
gradient magnitude:

 = √ + [7]

Since these procedures calculate a local gradient, a threshold value was defined in order to
discriminate noise and small variations from those to be considered in the vector representation. In
this way, using Matlab software and suitable algorithms, a new image was generated.
 This image was used as background in AutoCAD software (developed and marketed by Autodesk
Company); in this way, the quality of the vector representation was checked and corrected, where
needed (Figure 7.b).

4.3 Case Study 3: UAV Photogrammetry in Building 3D Model of a Masonry Bridge

4.3.1 Zenith UAV photogrammetry by the use of an ad-hoc device and action-camera
UAV photogrammetry provides a fast, precise, and cost-effective tool for surveying structures,
quarries, cultural heritage sites, etc. In this way, it is possible to overcome the limits of the terrestrial
survey. A frame camera is usually positioned under the UAV and, by the use of a gimbal, it allows

 Computer-Aided Design & Applications, 18(1), 2021, 42-65
 © 2021 CAD Solutions, LLC, http://www.cad-journal.net
55

to obtain nadir and panoramic images. In addition, the gimbal allows the stabilization of an object
on one or more axes too. For example, in a configuration without gimbal the camera is fixed with
the body of the drone and, consequently, it follows all its movements and oscillations, causing the
degradation of the acquired image quality. Instead, a 3-axis gimbal can be used to stabilize the
camera on all three axes and prevent roll, pitch and heading movements from being transferred to
the camera.

Figure 7: 2D representation of the external façade of a capital belonging to temple: Orthophoto (a);
vector representation (b).

The camera tilting angle typically ranges from 0° to 90°, i.e. from nadir orientation to the horizontal
one. Hence, it is impossible to observe objects positioned at a height greater than that of the UAV.
Such working condition holds during the survey of several structures, such as domes, bridges, etc.
Certain areas of such structures are usually not terrestrially accessible, hence aerial solutions such
as platforms integrated with UAVs have recently been developed, e.g. Parrot Anafi drone. However,
despite Anafi represents a viable way for visual inspections, recent tests have shown that it is not
an appropriate solution for photogrammetric purposes [39]. For this reason, one of the aims of this
paper is the development of a low-cost system able to acquire images of a structure from below,
with zenith-oriented photos. In this way, it is possible to acquire information on high structures that,
with traditional methods, would not have been possible or very expensive.
 To realize photo from UAV in zenith direction, it was necessary to build a suitable low-cost
system able to achieve this aim. The first objective concerned the choice of a suitable camera. Since
such sensor has to be mounted on the UAV for photogrammetric purposes, it has to meet the
following requirements:
 • Lightness: due to the additional weight represented by the sensor, the UAV motors must be
 able in three critical situations:
 • lift the UAV without problems;
 • stay in the hovering position without perturbations;
 • stay in the air as long as possible. Indeed, the greater the weight of the sensor, the
 greater the effort of the motors and, consequently, the greater the battery
 consumption. This leads to a decrease in flight autonomy. So, the lighter the sensor,
 the lower the impact on the engines;

 Computer-Aided Design & Applications, 18(1), 2021, 42-65
 © 2021 CAD Solutions, LLC, http://www.cad-journal.net
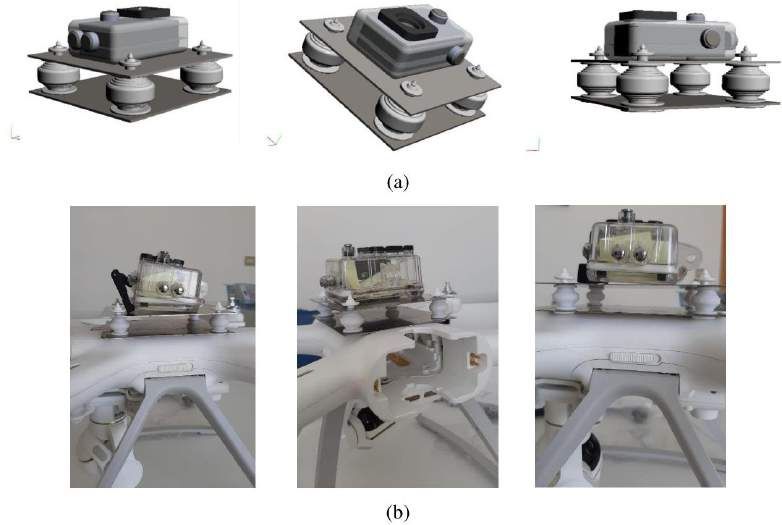
56

 • remote controllable (being manageable from the ground): the possibility of being able to
 observe in real-time the scene object of the survey allows optimizing the execution times,
 e.g. to better frame the objective, to verify the correct exposure of the photo;
 • sharp images even in critical conditions: since the images are captured from aerial platform,
 their quality can be affected by drone movements. The stability of the sensor can be obtained
 by means of electronic devices.
To achieve this aim, a special hardware provided with the action-cam was positioned on a plate in a
stable and secure way. In turn, this plate was fixed on another plate through 4 shock mounts
arranged symmetrically and at the edges of the plate. These shock mounts allow damping of
vibrations induced by the UAV platform. In this way, the images generated by the sensors are
sharper because they are less affected by sudden movements of the camera. The design of the
system architecture (see figure 8a) was realized in Solidworks, a parametric three-dimensional
drawing and design software, produced and marketed by Dassault Systèmes. The realization of the
architecture is shown in the figure 8b.

 Figure 8: Architecture of the system: design (a) and realization (b).

The camera used for the several experimentations is the GoPro Hero3 Silver due its lightness. GoPro
Hero3 Silver has a sensor to acquire images at a maximum resolution of 11Mp (format 3840x2880
pixels). This camera is able, even in backlighting, to reproduce colours faithfully: this means that
this device allows excellent automatic exposure. The most important feature of this camera is the
very wide-angle sensor (170-degree) that produces very important distortion on the image. Since
that the action-camera sensors produce high distortions in the image, this involves an image
construction that differs from the ideal model of central perspective (pinhole camera model) and, of
consequence, reduce the quality of the accuracy. To reduce the impact of the distortions in
photogrammetric approach, more tests were carried out in order to identify the best procedure that
minimize the errors in the matching and alignment phases. Indeed, four scenarios that taking into
account, or not, of the pre-calibration and/or the pre-correction of the lenses were realized. In
particular, building a 3D test field, several test varying the features of the images were carried out.

 Computer-Aided Design & Applications, 18(1), 2021, 42-65
 © 2021 CAD Solutions, LLC, http://www.cad-journal.net
57

 In this way, it is possible to evaluate the Level of Accuracy (LoA) on 3D test field in the different
scenarios. The analysis on achievable accuracy were performed using SFM/MVS approach.
Nowadays, this approach is widespread in order to build 3D models and requires a block of images
with a high degree of overlap that capture the complete 3D structure of the scene viewed from
several positions [40].
 The 3D test field was composed by 20 circular coded targets positioned at different heights from
the ground and distant from each other of 20cm.
 The level of accuracy achievable by this sensor was evaluated building four scenarios:
 • Self-calibration;
 • Self-calibration with radial distortion correction: before performing the alignment step, the
 images was corrected by radial distortion. This latter task was realized using a special tool
 developed in Adobe Photoshop software. Indeed, Adobe Photoshop software contains a
 large database of the filters for lens correction, including the "GoPro Silver" action-cam
 model. Since Photoshop allows batch operations, automatically and quickly, all the images
 were corrected, consequently reducing the barrel distortions on the images.
 • Pre-calibration: in this scenario, the first task was to calculate the internal parameter. The
 software used for the camera calibration is Agisoft Lens. In this environment, it was possible
 to calculate coordinate of the principal point and radial lens distortions in the Brown's model.
 Of consequence, it was possible to plot the curves representing the radial and tangential
 distortion (Figure 9). As expected, the radial distortion curve goes upward to indicate that
 the lens has a barrel distortion type, and it sensibly increases its trend with respect to the
 radius, due to the wide-angle lens of this camera.

 (a) (b)

 Figure 9: Plot of radial distortion (a) and decentring distortion (b).

 • Pre-calibration with radial distortion correction: in this latter case, beyond use the
 calibration parameters, the radial distortions were corrected in the images.
 The results of the several scenarios are shown in the following Table 4.

 DATASET Total Error Total Error Matching Alignment
 (m) (pixel) time time
 1 Self-calibration 0.0009 2.796 11m 11s 3m 14s
 2 Self-calibration with lens 0.0008 2.613 13m 14s 1m 53s
 correction
 3 Pre-calibrated 0.0009 2.583 13m 21s 1m 32s
 4 Pre-calibrated with lens correction 0.0007 1.163 12m 13s 1m 29s

 Table 4: Time and accuracy achievable in the different scenarios.

 Computer-Aided Design & Applications, 18(1), 2021, 42-65
 © 2021 CAD Solutions, LLC, http://www.cad-journal.net
58

As show in the table 4, the images corrected by radial distortions and using the calibration values
obtained through the procedure described in the scenario n.4 showed a higher level of accuracy than
the other scenarios and, at the same time, tight alignment times.
 The survey of the 3D-test field was repeated using the Pentax K-5 that is a 16.3-megapixel
digital single-lens reflex camera equipped with SMC Pentax-DA 35mm F2.4 AL lens. In particular, 39
images were captured. The post-processing of the images within SfM/MVS software allowed to obtain
a total error of 0.3mm. Therefore, considering the high accuracy achievable with this sensor, the
point cloud generated in this way, can be considered, as reference in order to compare the point
clouds obtained with the different scenarios.
 The comparison between the different point clouds was carried out using CloudCompare
software [41], which is a 3D point cloud processing (open source) software but it can also handle
triangular meshes and calibrated images. Before performing the comparison, a “cleaning” operation
to identify and exclude outlier points that can negatively influence the results, was performed.
 A common way to visualize the difference between the point clouds is based on the use
histogram, where on the horizontal axis is reported the distance while on verticals axis is reported
the number of values in a specific class. In addition, on the discrete diagram can be built and
visualized the Gauss distribution (Figure 10).

Figure 10: Histograms of the C2C between point cloud obtained by DSLR sensor (reference) and
the several scenarios (compared) a) C2C between DSLR sensor and point cloud using “Self-
calibration” dataset; a) C2C between DSLR sensor and point cloud using “Self-calibration with lens
correction”; c) C2C between DSLR sensor and point cloud using “Pre-calibrated” interior parameters;
d) C2C between DSLR sensor and point cloud using “Pre-calibrated with lens correction”.

 Computer-Aided Design & Applications, 18(1), 2021, 42-65
 © 2021 CAD Solutions, LLC, http://www.cad-journal.net
59

From the figure 10, it is possible to note as the best result was obtained in the case d), i.e. using
the dataset “Pre-calibrated with radial correction”.

4.3.2 Survey and 3D modelling of Annibale's bridge
The masonry bridge used for UAV photogrammetry test is located in southern Italy (approximate
geographic coordinates: 40.643978, 15.483073), in the Platano river, in a narrow and not easily
accessible canyon. It is also known as Annibale's bridge, probably to attest to the memory of the
passage of the condottiere to which its construction is traced. The bridge is kept in fairly good
condition, while showing signs of interventions performed over time. The bridge has a pronounced
donkey-back profile with two arches, of which the larger one is much larger with a light of 12.65 and
another smaller one of about 4.60 m. The total length of the bridge is about 30 m with a width of
3.40. Both the inner nucleus and some vestments (probably the work of successive restorations)
are in opus caementicium while the shoulders and the piles (which seem ancient) have opus
quadratum vestments. The survey was carried out using Xiaomi Mi Drone 4K, a multi-copter rotary
wing type that allows achieving a max flight speed of 18 m/s with a max climbing speed of 6 m/s
and lowering speed of 1.5 m/s. The drone is supplied of a digital camera able to acquire images with
a resolution of 8.2Mpixel where the pixel size is 4.54 μm. The mission planning was divided in two
parts: nadir-oblique and zenith direction (Figure 10). Indeed, the upper part of the bridge was
planning in the way that the camera supplied with the UAS (Unmanned Aerial System) observes the
bridge by nadir and oblique views. The flight planning was designed using Mission Planner software.
7 Flight Lines (FLs) along the longitudinal direction of the bridge was created. In order to cover entire
structure according the basic principles of the survey technique based on the SfM approach, it was
necessary varying the tilt angle, as shown in the Figure 11.a. In addition, the flight planning was
realized using suitable values of (longitudinal) over-lap and (transversal) side-lap of the images
[39].
 To survey the upper part of the bridge, i.e. the intrados of the masonry bridge, zenithally photos
were carried out, as shown in the figure 11.b. Therefore, a FL was planned and acquired in manual
mode varying the flight heights in order to obtain (approximately) the same GSD.

 (a)

 Computer-Aided Design & Applications, 18(1), 2021, 42-65
 © 2021 CAD Solutions, LLC, http://www.cad-journal.net
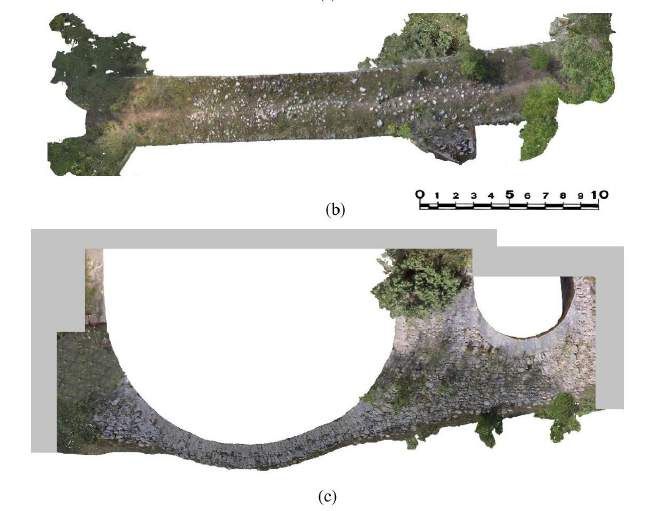
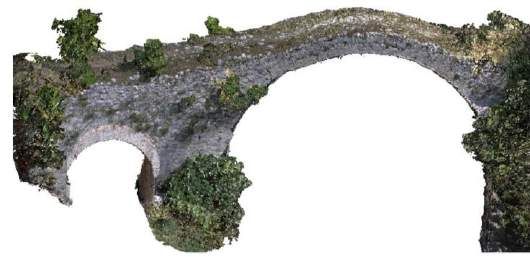
60

 (b)

Figure 11: Sketch of flight planning on the central section of the bridge (realized in CAD
environment): flight planning to take nadir and oblique photos (a); flight planning to take zenithally
photos (b).

In particular, three session of aerial survey were performed which two to realize the upper part of
the bridge (nadir and oblique) and one to realize the photos in zenith direction. The photogrammetric
flight allowed obtaining 345 images from the camera supplied with the drone and 175 with the action
camera for a total amount of 520 images.
 The images were imported in Agisoft Metashape software and processed in two datasets: one
generated by action-camera sensor and another by the camera supplied with the drone.
 While the dataset with the images acquired by the camera supplied with the drone was
processed in self-calibration mode, the dataset of the images acquired by action-cam sensor was
processed in pre-calibrated mode with radial correction of the single image. In this way, all the
images were correctly aligned in each dataset. According the photogrammetric pipeline was built the
dense point cloud in both datasets.
 Subsequently, in a new dataset, the point clouds were aligned by common points to both
datasets. Once obtained a unique point cloud of the area under investigation, it was possible to build
the textured mesh consisting of 2,362,420 faces.
 The evaluation of the accuracy was carried out using suitable GCPs positioned on the top of the
bridge and some natural points. The GCPs were measured by Total Station and, then, calculated by
apposite tool developed in Matlab in order to transform the polar coordinates in a local Cartesian
reference system.
 Finally, it was possible to scale the model and, at the same time, obtaining a measure of errors
in building 3D models. The total error achieved was about 10 mm.
 The representation of the 3D model of the Roman masonry bridge obtained by photogrammetric
method is reported in Figure 12.
By choosing appropriate GCPs on the structure, defined the planes on which to create the projection
and using the developed procedure it was possible to build the orthophoto of the plan (from the top
view) and the two lateral façades of the masonry bridge.
 The GSD of the orthophotos (plan and façade of the bridge) was 0.5 mm.
 The orthophotos realized in this way were arranged, subsequently, according to an architectural
layout, where the plan is placed in the middle and the two extremes of the façades of the masonry
bridge, as shown in the Figure 13.

 Computer-Aided Design & Applications, 18(1), 2021, 42-65
 © 2021 CAD Solutions, LLC, http://www.cad-journal.net
61

 Figure 12: 3D model of the Roman masonry bridge.

Figure 13: Layout of the 2D orthophoto of the bridge: façade (a), plan from the top view (b) and
other façade of the bridge (c).

 Computer-Aided Design & Applications, 18(1), 2021, 42-65
 © 2021 CAD Solutions, LLC, http://www.cad-journal.net
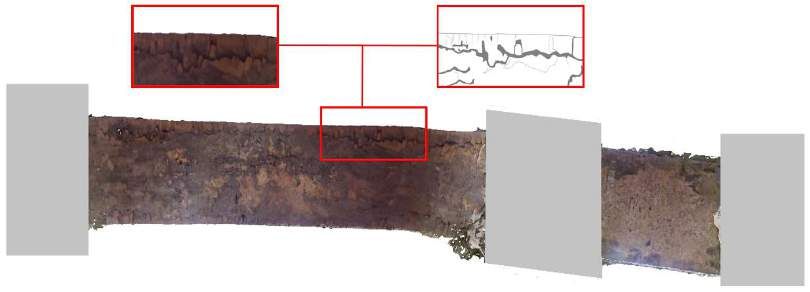
62

In addition, it was possible to obtain the orthophoto from the bottom to the top and, of consequence
to identify the discontinuity lines of the masonry of the intrados, as shown in the figure 14.

Figure 14: 2D orthophoto (plan) of the intrados of the bridge with the detail of the area where
cracks are visible.

5 CONCLUSIONS
The combined use of a low-cost sensor, a suitable method, an adequate survey technique and SfM-
MVS software allowed to obtain precise and detailed textured 3D models in automatic and easy way
in all the considered case studies, despite image acquisition was done with non-professional devices
such as smartphone, action camera and compact camera.
 Thanks to the developed scripts, the generation of orthophotos of each façade of the considered
objects and structures was quick and easy. Given the importance of a similar automatic procedure
in cultural heritage documentation, such development corresponds de facto to an optimization of the
overall digital documentation process in this kind of applications. Furthermore, such kind of approach
eases the analysis and study of structures, objects and site of particular historical, architectural and
archaeological value, by means of the easy generation of high-resolution orthophotos and 3D
models. In addition, the faithful reconstruction of the objects and the determination of their exact
spatial position allows further archaeological and architectural studies to be carried out on the nature
of the object. For example, the three-dimensional reconstruction of a part of a column belonging to
an old temple could make it possible to identify its shape and, consequently, identify the position of
the piece detected with respect to the entire column. In the graphic reconstruction of architectural
object and, consequently, in a two-dimensional representation, it was possible emphasize the key
elements of the architecture of the surveyed structures, as shown, for example, in the Ionic capital
case study.
 Furthermore, this work examined the use of cameras mounted both below and above a drone:
this kind of approach allowed to acquire images also in the Zenith direction for UAV photogrammetry
purposes. Indeed, the developed low-cost imagery acquisition system mounted on the top of a UAV
allowed acquiring visual information about the bottom part of high structures in a simple and intuitive
way. The sensor chosen for such photogrammetric purpose was an action-camera, due its lightness
and adequate image quality. Nevertheless, it is worth to notice that photogrammetric reconstruction
to be computed with wide-angle lens cameras, such as action-cameras, required an adequate image
pre-processing. Indeed, since the image formation process does not follow a central projective
model, a pre-correction of the initial distortion can be applied, followed by a camera calibration
procedure. In this way, it is possible to achieve, thanks to maturity, simplicity and accuracy of the
software based on SfM-MVS algorithms, greater accuracy than when processing such datasets by
directly applying the self-calibration method, without any prior correction of the lens distortion.

 Computer-Aided Design & Applications, 18(1), 2021, 42-65
 © 2021 CAD Solutions, LLC, http://www.cad-journal.net
63

Massimiliano Pepe, http://orcid.org/0000-0003-2508-5066
Domenica Costantino, http://orcid.org/0000-0002-1909-9261

Funding: This research was conducted with funds from the DICATECh of the Polytechnic of Bari
(Italy).

Acknowledgments: We want to thanks the reviewers for their careful reading of the manuscript
and their constructive remarks. This research was carried out in the project: PON “Ricerca e
Innovazione” 2014-2020 A. I.2 “Mobilità dei Ricercatori” D.M. n. 407-27/02/2018 AIM “Attraction
and International Mobility” (AIM1895471 – Line 1)

REFERENCES
[1] De Luca, L.: La fotomodellazione architettonica. Rilievo, modellazione, rappresentazione di
 edifici a partire da fotografie. Dario Flaccovio Editore, Palermo, 2011.
[2] Murtiyoso, A..; Grussenmeyer, P.; Börlin, N.; Vandermeerschen, J.; Freville, T: Open source
 and independent methods for bundle adjustment assessment in close-range UAV
 photogrammetry, Drones, 2(1), 2018, 3. https://doi.org/10.3390/drones2010003
[3] Luhmann, T.; Robson, S.; Kyle, S.; Boehm, J.: Close-range photogrammetry and 3D imaging,
 Walter de Gruyter, 2007.
[4] Smith, M. J.; Pain, C. F.: Applications of remote sensing in geomorphology, Progress in Physical
 Geography, 33(4), 2009, 568-582. https://doi.org/10.1177/0309133309346648
[5] Caldera-Cordero, J. M.; Polo, M. E.: Analysis of free image-based modelling systems applied
 to support topographic measurements, Survey Review, 2018, 1-10.
 https://doi.org/10.1080/00396265.2018.1451271.
[6] Korchenko, A. G.; Illyash, O. S.: The generalized classification of unmanned air vehicles.
 In 2013 IEEE 2nd International Conference Actual Problems of Unmanned Air Vehicles
 Developments Proceedings (APUAVD), 2013 October, 28-34.
 https://doi.org/10.1109/APUAVD.2013.6705275
[7] Pepe, M.; Costantino, D.; Restuccia Garofalo, A.: An Efficient Pipeline to Obtain 3D Model for
 HBIM and Structural Analysis Purposes from 3D Point Clouds, Applied Sciences, 10(4), 2020,
 1235. https://doi.org/10.3390/app10041235
[8] Apollonio, F. I.; Ballabeni, M.; Gaiani, M.: Color enhanced pipelines for reality-based 3D
 modeling of on-site medium sized archeological artifacts, Virtual Archaeology Review, 5(10),
 2014, 59-76. https://doi.org/10.4995/var.2014.4218
[9] Ullman, S.: The interpretation of structure from motion, Proceedings of the Royal Society of
 London, Series B. Biological Sciences, 203(1153), 1979, 405-426.
 https://doi.org/10.1098/rspb.1979.0006
[10] Snavely, N.; Seitz, S. M.; Szeliski, R.: Photo tourism: exploring photo collections in 3D, ACM
 Transactions on Graphics, 25(3), 2006, 835-846. https://doi.org/10.1145/1141911.1141964
[11] Jaud, M.; Passot, S.; Allemand, P.; Le Dantec, N.; Grandjean, P.; Delacourt, C.: Suggestions
 to Limit Geometric Distortions in the Reconstruction of Linear Coastal Landforms by SfM
 Photogrammetry with PhotoScan® and MicMac® for UAV Surveys with Restricted GCPs
 Pattern, Drones, 3(1), 2019, 2. https://doi.org/10.3390/drones3010002
[12] Alt, N.; Rives, P.; Steinbach, E.: Reconstruction of transparent objects in unstructured scenes
 with a depth camera, In 2013 IEEE International Conference on Image Processing, 2013, 4131-
 4135. https://doi.org/10.1109/ICIP.2013.6738851
[13] Ihrke, I.; Kutulakos, K. N.; Lensch, H. P.; Magnor, M.; Heidrich, W.: Transparent and specular
 object reconstruction, In Computer Graphics Forum, 29(8), 2010, 2400-2426.
 https://doi.org/10.1111/j.1467-8659.2010.01753.x

 Computer-Aided Design & Applications, 18(1), 2021, 42-65
 © 2021 CAD Solutions, LLC, http://www.cad-journal.net
You can also read