Antioxidant Effects of Elderberry Anthocyanins in Human Colon Carcinoma Cells: A Study on Structure-Activity Relationships
←
→
Page content transcription
If your browser does not render page correctly, please read the page content below
RESEARCH ARTICLE
 www.mnf-journal.com

Antioxidant Effects of Elderberry Anthocyanins in Human
Colon Carcinoma Cells: A Study on Structure–Activity
Relationships
Gudrun Pahlke, Katarina Ahlberg, Anne Oertel, Theresa Janson-Schaffer,
Stephanie Grabher, Hans-Peter Mock, Andrea Matros, and Doris Marko*

 Scope: Glycosylation is a way to increase structure-stability of anthocyanins, 1. Introduction
 yet compromises their bioactivity. The study investigates the antioxidant Anthocyanins are plant pigments present
 activity of purified cyanidin (Cy)-based anthocyanins and respective in high amounts particularly in inten-
 degradation products in Caco-2 clone C2BBe1 aiming to identify sively colored berries. They gain great
 interest regarding potential protective
 structure–activity relationships.
 effects against several chronic and de-
 Results and Methods: Cyanidin 3-O-glucoside (Cy-3-glc) and cyanidin generative diseases such as cancer,[1]
 3-O-sambubioside (Cy-3-sam) proved to be most potent regarding antioxidant cardiovascular disease,[2,3] diabetes,[4]
 properties and protection against hydrogen peroxide (H2 O2 )-induced reactive and diseases associated with oxidative
 oxygen species (ROS)-levels measured with the dichloro-fluorescein (DCF) stress.[5] Anthocyanins can scavenge re-
 active oxygen species (ROS) due to their
 assay. Cyanidin 3-O-sambubioside-5-O-glucoside (Cy-3-sam-5-glc) and
 hydrogen (electron) donation ability.[6,7]
 cyanidin 3-O-rutinoside (Cy-3-rut) were less efficient and not protective, Another effective approach to protect
 reflecting potential differences in uptake and/or degradation. Following cells from oxidative stress is the induc-
 ranking in antioxidant efficiency is suggested: (concentrations ≤10 × 10−6 M) tion of antioxidant defense systems such
 Cy-3-glc ≥ Cy-3-sam > Cy-3-sam-5-glc ≈ Cy-3-rut ≈ Cy; (concentrations ≥50 × as the redox-sensitive nuclear factor ery-
 10−6 M) Cy-3-glc ≈ Cy-3-sam ≥ Cy > Cy-3-sam-5-glc ≈ Cy-3-rut. Cy and throid 2-related factor 2 (Nrf2)-pathway.
 Many antioxidative enzymes, amongst
 protocatechuic acid (PCA) reduced ROS-levels as potent as the mono- and
 them catalase (CAT), superoxide dis-
 di-glycoside, whereas phloroglucinol aldehyde (PGA) displayed pro-oxidant mutase (SOD), glutathione peroxidase
 properties. None of the degradation products protected from oxidative stress. (GPx), heme oxygenase-1 (HO-1), and
 Gene transcription analysis of catalase (CAT), superoxide-dismutase (SOD), glutamate-cysteine ligase ( GCL) are tar-
 glutathione-peroxidase (GPx), heme-oxygenase-1 (HO-1), and gets of the Nrf2 transcription factor.[8–11]
 A low absorption rate of anthocyanins
 glutamate-cysteine-ligase ( GCL) suggest no activation of nuclear factor
 was reported even though major effects
 erythroid 2-related factor 2 (Nrf2). can be observed with nanomolar serum-
 Conclusion: More complex residues and numbers of sugar moieties appear to concentrations.[12] For instance in an in-
 be counterproductive for antioxidant activity. Other mechanisms than tervention study with healthy male vol-
 Nrf2-activation should be considered for protective effects. unteers we found a reduction of oxida-
 tive DNA damage and an increase in glu-
 tathione (GSH) status already after a daily

 The ORCID identification number(s) for the author(s) of this article Dr. G. Pahlke, K. Ahlberg, T. Janson-Schaffer, S. Grabher, Prof. D. Marko
 can be found under https://doi.org/10.1002/mnfr.202100229 Department of Food Chemistry and Toxicology
[+] Present address: University of Vienna
 University of Art and Design, Neuwerk 7, Halle (Saale)
 Waehringerstr. 38, Vienna A-1090, Austria
D-06108, Germany
 E-mail: doris.marko@univie.ac.at
[++] Present address: School of Agriculture, Food and Wine, University of
 Dr. A. Oertel[+] , Dr. H.-P. Mock, Dr. A. Matros[++]
Adelaide, Waite Campus, Urrbrae, SA 5064, Australia Department of Physiology and Cell Biology
© 2021 The Authors. Molecular Nutrition & Food Research published by Leibniz Institute of Plant Genetics and Crop Plant Research
Wiley-VCH GmbH. This is an open access article under the terms of the (IPK-Gatersleben)
Creative Commons Attribution-NonCommercial License, which permits Corrensstr. 3, Gatersleben D-06466, Germany
use, distribution and reproduction in any medium, provided the original
work is properly cited and is not used for commercial purposes.
DOI: 10.1002/mnfr.202100229

Mol. Nutr. Food Res. 2021, 2100229 2100229 (1 of 13) © 2021 The Authors. Molecular Nutrition & Food Research published by Wiley-VCH GmbH
www.advancedsciencenews.com www.mnf-journal.com

intake of 700 mL of red multi-fruit juice (total anthocyanin con- 2. Results and Discussion
tent 197.9 mg L−1 Cy-3-glc equivalents) over a 4-week period.[13]
A recent in vivo study revealed DNA-protective and modu- 2.1. Phytochemical Characterization of Elderberry Raw Juice
lating effects of Nrf2-signaling by consumption of consumer-
relevant amounts of anthocyanin-rich beverages including a The total anthocyanin content of freshly squeezed elderberry
red-fruit beverage comprising 332.0 ± 48.8 mg L−1 of total juice has been determined to be 1.19 µg µL−1 . Based on 100 mL
anthocyanins.[9] In a human pilot study with healthy individ- elderberry juice a degreased extract was prepared to reach 100 mg
uals and ileostomy probands transcription of Nrf2-dependent total anthocyanins for subsequent purifications. After lipid re-
genes in peripheral blood mononuclear cells was affected af- moval and filtration, the raw juice sample was analyzed by LC-
ter consumption of an anthocyanin-rich bilberry (Vaccinium UV/MS (Figure 2). The UV chromatogram at 280 nm showed a
myrtillius L.) pomace extract only in healthy subjects, sug- number of chromatographic peaks, likely related to polyphenols
gesting a role of colonic processes for bioactivity.[10] The re- naturally present in the elderberry juice (Figure 2A, top). In con-
sults were supported by Nrf2-activating properties of the in- trast, only two major chromatographic peaks were observed at
testinal anthocyanin degradation product phloroglucinol alde- 515 nm, the wavelength specific for anthocyanins (Figure 2A, bot-
hyde (PGA),[10] indicating that digestive processes regulated tom). The sum of mass spectra across these two chromatographic
by the intestinal microbiota are crucial for bioactivity of peaks revealed m/z 743.20 as the main molecular ion present in
anthocyanins. peak 1 and m/z 581.15 in peak 2 (Figure 2B). Based on MS/MS
 Generally, glycosylation can substantially influence the chemi- fragmentation pattern (Figure S2, Supporting Information) and
cal reactivity of anthocyanidins[14] and enhance the stability of the comparison with literature data the related compounds were ten-
otherwise unstable aglycones. Glycosylation can also enhance the tatively annotated as Cy-3-sam-5-glc (further named anthocyanin
hypsochromic effect and bluing of the color,[15] thus being attrac- 1) and Cy-3-sam (further named anthocyanin 2). The additional
tive for the development of natural blue food colorants. On the molecular ions detected in the chromatographic peaks 1 and 2
other hand, bioavailability is negatively affected by glycosylation. were tentatively annotated as cyanidin 3,5-O-di-glucoside (m/z
Regarding the impact of glycosylation site, number and type of 611.16) and Cy-3-glc (m/z 449.10), and likely present co-eluting
sugar on the antioxidant activity of anthocyanins the literature is anthocyanins. The molecular ion with m/z 338.33 detected in the
quite heterogeneous.[14] sum mass spectrum of peak 1, did not produce molecular frag-
 Within the scope of the European project AnthoPLUS (http: ment ions during MS/MS analysis and no extracted ion chro-
//www.anthoplus.com/), anthocyanins of different complexity in matogram could be generated for this molecular mass. We thus
their side chain decoration and sugar moieties were produced concluded it representing a molecular ion produced by in-source
and assessed for their quality and properties as potential col- decay during LC-UV/MS analysis.
orants and food additives. Furthermore, as a novel concept, we
have developed test kits for research from different fruit juice
sources, comprising varying fractions of purified anthocyanins, 2.2. Phytochemical Characterization of Elderberry Anthocyanin
which we called AnthoKits. In the present study, for the first time, Fractions and AnthoKit Preparation
an AnthoKit from elderberry (Sambucus nigra) juice was pro-
duced and tested. The kit comprised cyanidin 3-O-sambubioside We aimed to distinguish biomedical effects of individual antho-
(Cy-3-sam), cyanidin 3-O-sambubioside-5-glucoside (Cy-3-sam- cyanins from those of anthocyanin combinations (AnthoKit mix).
5-glc) (Figure 1), and a mixture of both anthocyanin fractions Thus, fractions of individual anthocyanins have been isolated and
based on their natural composition in the elderberry juice. To en- an elderberry AnthoKit was prepared thereof as described in ma-
large the list of Cy-based anthocyanins for systematic structure– terials and methods (concept schematically presented in Figure
activity analysis, cyanidin 3-O-glucoside (Cy-3-glc) and cyanidin S3, Supporting Information).
3-O-rutinoside (Cy-3-rut) were added to the study. Phytochemical compositions of the isolated fractions were
 Our aim was to elucidate the structure–activity relationship of analyzed by LC-UV/MS (Figure 3) and compound annotations
Cy-based anthocyanins with respect to their antioxidant poten- based on MS/MS fragmentation pattern (Figure S4, Supporting
tial and protective effects against H2 O2 -induced oxidative stress Information). The fraction anthocyanin 1 showed one prominent
in human colon carcinoma cells. Furthermore, the question was chromatographic peak at a retention time of 3.30 min, which has
addressed whether the antioxidant potency of anthocyanins is been proven to be enriched for Cy-3-sam-5-glc (m/z 743.20) with
founded in the anthocyanin itself and/or in degradation prod- minor co-elution of cyanidin 3,5-O-di-glucoside (m/z 611.16) as
ucts, such as cyanidin (Cy), protocatechuic acid (PCA), and the presented in Figure 3A,D. Similarly, one major peak was en-
intestinal degradation product PGA (Figure 1). Kropat et al. ob- riched in fraction anthocyanin 2 eluting at a retention time of
served an impact of PGA on the Nrf2-pathway,[10] therefore we 3.82 min and corresponding to Cy-3-sam (m/z 581.15) with co-
hypothesized that this redox-sensitive pathway might play a role elution of Cy-3-glc (m/z 449.10); see Figure 3B,E. Both fractions
in the protection against H2 O2 -induced ROS production by Cy- contained minor remaining amounts of other polyphenols as ob-
based anthocyanins. served from the UV-chromatograms at 280 nm.

Mol. Nutr. Food Res. 2021, 2100229 2100229 (2 of 13) © 2021 The Authors. Molecular Nutrition & Food Research published by Wiley-VCH GmbH
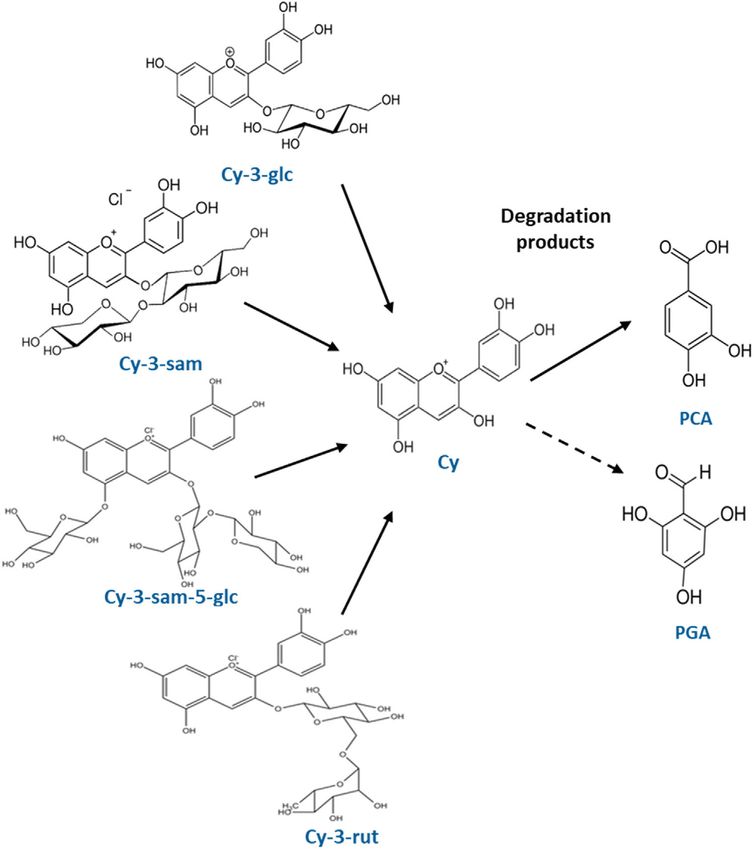
www.advancedsciencenews.com www.mnf-journal.com

Figure 1. Structures of elderberry anthocyanins, and respective degradation products Cy: cyanidin, Cy-3-glc: cyanidin 3-O-glucoside, Cy-3-sam: cyanidin
3-O-sambubioside, Cy-3-sam-5-glc: cyanidin 3-O-sambubioside-5-glucoside, Cy-3-rut: cyanidin 3-O-rutinoside, PCA: protocatechuic acid, PGA: phloroglu-
cinol aldehyde.

 By means of plate photometric assays anthocyanin and anthocyanin 2. All samples were dried under liquid nitrogen
sugar amounts were determined (Table 1). The sugars (glucose, and the weight was measured. We calculated a multiplication
fructose, and sucrose) were nearly completely removed by the factor for the utilization in the biomedical assays according to
chromatographic separations. Glucose could not be detected the anthocyanin concentration estimated by plate photometric
in fractions anthocyanin 1, anthocyanin 2, and polyphenols. The assay. All fractions were covered with argon and stored at −20 °C
content of fructose was markedly reduced to levels ≤0.1 mM. until their use.
Sucrose was not detected in raw juice fraction and was found with The main anthocyanins reported for elderberry are Cy-3-glc,
low amounts (≤0.2 mM) in fractions anthocyanin 1, anthocyanin Cy-3-sam, Cy-3-sam-5-glc, and cyanidin 3,5-O-di-glucoside; with
2, and polyphenols, likely released from anthocyanins and other 65.7%, 32.4%, 1.1%, and 0.8% in this order.[16,17] Thus, we re-
polyphenols due to mild acidic hydrolysis during purification sume our tentative identifications as plausible, although dif-
procedures. The final fractions (anthocyanin 1, anthocyanin 2, ferent proportions have been observed in our samples (Fig-
and polyphenols) contain 10.36 mg, 43.05 mg, and 14.78 mg of ure 2). Under our chromatographic conditions we have ob-
anthocyanins, respectively. served co-elution of the main Cy-3-sam (anthocyanin 2) with
 To obtain an AnthoKit mix we combined the individual puri- Cy-3-glc and of Cy-3-sam-5-glc (anthocyanin 1) with cyani-
fied anthocyanin fractions based on their natural composition in din 3,5-O-di-glucoside, which is consistent with other re-
the elderberry juice (Figure S3, Supporting Information), namely ports on elderberry anthocyanins[18,19] (Figure S4, Supporting
12% w/w of fraction anthocyanin 1 and 88% w/w of fraction Information).

Mol. Nutr. Food Res. 2021, 2100229 2100229 (3 of 13) © 2021 The Authors. Molecular Nutrition & Food Research published by Wiley-VCH GmbH
www.advancedsciencenews.com www.mnf-journal.com

Figure 2. LC-UV/MS analysis of elderberry raw juice. A) UV-chromatograms at 280 nm (top) and 515 nm (bottom) from 2 to 12 min. B) Sum of mass spec-
tra from retention time 3.2–3.4 min (top, anthocyanin 1) and 3.8–3.9 min (bottom, anthocyanin 2). Tentative annotation based on MS/MS fragmentation
pattern (Figure S2, Supporting Information) and comparison with literature data.

 The main molecular ions detected in the polyphenols fraction dropping to about 40% at 100 × 10-6 M,[28] concurring with the
in our study (Figures S5 and S6, Supporting Information) have IC50 of 85 × 10-6 M of another working group.[26] In conclusion,
not been described in the literature[20,21] and thus could not be our results regarding cytotoxicity of Cy-based anthocyanins and
annotated in our study. respective degradation products are reliable based on literature.

2.3. Impact on Cell Viability 2.4. Antioxidant Effects: Comparison of Anthocyanins and
 Degradation Products
In order to rule out cytotoxic effects of the test compounds on
C2BBe1 colon cells, causing potential artefacts in the interpreta- Effects of Cy-based anthocyanins and potential degradation
tion of data, the sulforhodamine B (SRB) assay was performed. products on cellular ROS levels of C2BBe1 cells were investi-
H2 O2 was used as a positive control, a substance known to have gated with the DCF assay. Cells were incubated with solvent
potent cytotoxic effects in C2BBe1 cells. and the respective test compounds in the presence of catalase
 Neither the different Cy-based anthocyanins nor the respec- for 1 h (measurement every 15 min). ROS levels significantly
tive degradation products Cy, PCA and PGA (up to 200 × 10-6 M) lower than the levels of solvent-treated cells were considered as
caused statistically significant changes in C2BBe1 cell growth antioxidant effect. Since the data of time point t60 showed the
after 24 h incubation compared to the solvent control ( Table most significant differences from solvent control, this time point
S1, Supporting Information). H2 O2 potently reduced viability of was chosen for data presentation (Figure 4).
C2BBe1 cells to about 39 ± 13%. Forester et al. reported a growth Cy-3-glc as well as its degradation products Cy and PCA po-
inhibitory effect for PGA with an IC50 of 76.7 × 10⁻⁶ M after 72 h tently reduced ROS production in C2BBe1 cells. (Figure 4). Cy-3-
and a reduction of cell viability already at 100 × 10-6 M yet incu- glc and PCA were equipotent, while Cy appeared to be less potent,
bated in the absence of catalase.[22,23] The tendency of a minor as significantly reduced ROS levels were observed only starting
proliferative effect of Cy in C2BBe1 at 200 × 10-6 M fits with the at a concentration of 1 × 10⁻⁶ M compared to 0.1 × 10⁻⁶ M for Cy-
heterogeneous literature. Renis et al.[7] described a growth inhi- 3-glc. At concentrations ≥50 × 10-6 M Cy-3-glc, Cy, and PCA were
bition of around 20% for 200 × 10-6 M Cy (24 h), whereas at 100 equipotent, reducing ROS levels at 200 × 10-6 M to 11 ± 4%, 18 ±
× 10-6 M, with a longer incubation time (68 h), no toxicity could 6%, and 14 ± 3% respectively compared to the solvent control
be detected.[24] For HT-29 colon carcinoma cells, the range spans (p < 0.001). Other anthocyanin degradation products have been
from 57 × 10-6 M IC50 to no inhibition up to 300 × 10-6 M which shown to decrease ROS production as well, such as the grape
may be attributed to the use of catalase in the latter case.[25–27] phenolic compounds gallic acid (1 and 10 × 10-6 M) and syringic
HCT-116 cells on the other hand displayed a considerable growth acid (10 × 10-6 M)[29] that were measured in Caco-2 cells with
inhibition of 82% when incubated with 200 × 10-6 M Cy, a value the DCF assay. To our knowledge no data are available so far for

Mol. Nutr. Food Res. 2021, 2100229 2100229 (4 of 13) © 2021 The Authors. Molecular Nutrition & Food Research published by Wiley-VCH GmbH
www.advancedsciencenews.com www.mnf-journal.com

Figure 3. LC-UV/MS analysis of isolated anthocyanin fractions. A) to C) UV-chromatograms at 280 nm (top) and 515 nm (bottom) from 2 to 12 min; and
D) to F) sum of mass spectra of respective main chromatographic peak for fractions anthocyanin 1 (top, 3.2–3.4 min), anthocyanin 2 (middle, 3.8-3.9
min) and polyphenols (bottom, 2.5–7.5 min). Tentative annotation based on MS/MS fragmentation pattern (Figure S4, Supporting Information) and
comparison with literature data.

PCA in Caco-2 cells. Yet, DCF assays using different cell lines C2BBe1 cells, except for PGA. Despite being a main degradation
showed also antioxidant properties of PCA. Guttenplan et al.[30] product PGA did not lower basal ROS levels in C2BBe1 cells.
reported that incubation with 4 × 10⁻⁶ M PCA of the human oral Instead, an increase in ROS with a peak at 25 × 10-6 M at all mea-
cell line MSK-Leuk 1 leads to a 10% reduction of fluorescence sured time points (Figure 4, t60 T/C: 155.7 ± 29.6%, p < 0.001)
after 90 min. This effect appears to be relatively weak compared was detected, suggesting a potential pro-oxidant effect. Kropat
to the 56% fluorescence reduction caused by 5 × 10⁻⁶ M PCA in et al.[10] reported PGA to activate the main regulator of antioxi-
C2BBe1 cells. However, it shows that PCA has the capability to dant defense, Nrf2, in HT-29 colon tumor cells. As a degradation
lower intracellular ROS in different cell lines. product of the gut microbiota[31,32] PGA indeed might have
 The results clearly show no significant difference between pro-oxidant effects in the gut, tickling the Nrf2-mediated defense
the antioxidant effect of Cy-3-glc and its degradation products in system. However, it must be pointed out that the concentration

Mol. Nutr. Food Res. 2021, 2100229 2100229 (5 of 13) © 2021 The Authors. Molecular Nutrition & Food Research published by Wiley-VCH GmbH
www.advancedsciencenews.com www.mnf-journal.com

Table 1. Anthocyanin and sugar concentration before and after chromatographic separation of elderberry juice.

Fraction Anthocyanin concentration Sugar concentration [mM]

 Anthocyanin Volume Total anthocyanin Glucose Fructose Sucrose
 concentration [µg µL−1 ] [mL] amount [mg]

Raw juice 1.19 84 99.96 5.962 4.872 n.d.
Anthocyanin 1 2.59 4 10.36 n.d. 0.035 0.131
Anthocyanin 2 2.05 21 43.05 n.d. 0.108 0.209
Polyphenols 1.64 9 14.78 n.d. 0.035 0.113

n.d. – not detected.

 displayed significant antioxidant effects already at 0.01 × 10⁻⁶ M
 (p < 0.01) and reduced basal ROS levels to 79 ± 6% up to a
 maximum of 8 ± 11% at 200 × 10−6 M (p < 0.001) (Figure S7B,
 Supporting Information). Cy-3-rut was significantly effective
 starting at 1 × 10⁻⁶ M (p < 0.01) reducing fluorescence to 71 ±
 13% and up to a maximum of 26 ± 10% at 200 × 10−6 M (p
 < 0.001) (Figure S7D, Supporting Information). The degrada-
 tion product Cy (p < 0.001) reduced ROS levels significantly
 to 75 ± 11% starting with 1 × 10⁻⁶ M and to 18 ± 6% at 200
 × 10−6 M (Figure S7E, Supporting Information). The positive
 control, H2 O2 , potently increased ROS production in C2BBe1
 cells up to about 4-fold in comparison to the solvent control
 (Figure S7, Supporting Information). Cy-3-glc and Cy-3-sam
 seem rather similar and the most potent in their antioxidant
 properties in C2BBe1 cells after 1 h of incubation. Based on
 the graphical plot (Figure 5A) Cy-3-glc decreases ROS levels
Figure 4. ROS levels in C2BBe1 cells after 1 h incubation with Cy-3-glc, significantly better than Cy-3-sam-5-glc, Cy-3-rut, and Cy at the
and its respective degradation products Cy, PCA, and PGA. Data are pre- concentration of 1 and 10 × 10−6 M, whereas Cy-3-sam appears
sented as the mean ± SD of test over control T/C in (%) from at least
five biological replicates. Statistically significant differences to the DMSO
 less potent yet with no statistical significance. Cy-3-glc and also
solvent control were calculated with one-way ANOVA and Bonferroni post Cy-3-sam at concentrations ≥50 × 10−6 M reach significant
hoc test with ** p ≤ 0.01, *** p ≤ 0.001. differences to Cy-3-sam-5-glc and Cy-3-rut whereas statistical
 significance is lost to Cy. Thus, at higher concentrations both
of PGA appears to be critical as the pro-oxidant effect turns up glycosides act equipotent in reducing ROS. With increasing
only in a narrow range of low PGA concentrations. concentration Cy-3-sam-5-glc slowly reaches the same and even
 higher fluorescence than Cy with statistical significance at 100
 × 10−6 M, suggesting less potency compared to Cy. The most
2.5. Antioxidant Effects: Comparison of Different Cy-Based potent fluorescence-reducing effect is observed with Cy-3-sam at
Anthocyanins 200 × 10−6 M with 8 ± 11% (p < 0.001) compared to the solvent
 control. In contrast, the aglycon Cy possesses lower antioxidant
Whether type and size of the sugar moiety of the flavylium struc- potency than Cy-3-glc at low concentrations (≤10 × 10−6 M),
ture impact the antioxidant properties of Cy-based anthocyanins potentially due to its low stability. At higher concentrations (≥50
was addressed by comparing their ability to diminish the fluores- × 10−6 M) the antioxidant activity of Cy is found to be improving
cence signal in the DCF assay. compared to the di-glycoside and rutinoside.
 All tested anthocyanins lead to significant lower ROS levels in Based on these results we suggest following ranking in antiox-
C2BBe1 cells after 1 h incubation as observed in DMSO-treated idant efficiency of Cy-based anthocyanins with different sugar
cells. Since data of time point t60 showed the most significant moieties: at low concentrations (1–10 × 10−6 M) Cy-3-glc ≥ Cy-
differences from solvent control, this time point was chosen for 3-sam > Cy-3-sam-5-glc ≈ Cy-3-rut ≈ Cy, at high concentrations
comparison between the different anthocyanins (Figure 5A) with (≥50 × 10−6 M) Cy-3-glc ≈ Cy-3-sam ≥ Cy > Cy-3-sam-5-glc ≈ Cy-
respect to antioxidant efficiency. The aglycone Cy was included 3-rut. As the most potent antioxidant effect in C2BBe1 colon cells
for comparison as well. is observed for Cy-3-glc and Cy-3-sam, more bulky residues and
 As calculated with the relative fluorescence data and ANOVA numbers of sugar moieties appear to be counterproductive for
(Bonferroni), Cy-3-glc and Cy-3-sam-5-glc significantly (p antioxidant effects in colon tumor cells. Of note, at low concen-
< 0.001) reduced cellular ROS production to 69 ± 17% and 71 ± trations (1, 10 × 10−6 M) Cy-3-glc showed the most potent antiox-
19% respectively, starting at a concentration of 0.1 × 10⁻⁶ M idant effect, whereas at concentrations ≥50 × 10−6 M Cy-3-sam is
to a maximum of 11 ± 4% and 31 ± 13%, respectively at 200 equipotent suggesting potential differences in the uptake and/or
× 10−6 M (Figure S7A,C, Supporting Information). Cy-3-sam stability of the compounds.

Mol. Nutr. Food Res. 2021, 2100229 2100229 (6 of 13) © 2021 The Authors. Molecular Nutrition & Food Research published by Wiley-VCH GmbH
www.advancedsciencenews.com www.mnf-journal.com

 prising both fractions. To compare the effects of the different
 fractions, the AnthoKit mix was used as Cy-3-sam equivalent
 in the DCF assay. Cy-3-sam equivalent (µM) represents the
 concentration of Cy-3-sam calculated based on its portion (88%
 w/w) present in the AnthoKit mix.
 Already the lowest concentration of 0.1 × 10⁻⁶ M AnthoKit
 mix showed a significant decrease of about 38 ± 19% (Figure 5B
 and Figure S7F, Supporting Information). At the highest con-
 centration (200 × 10−6 M) the cellular ROS level was decreased to
 0 ± 6% after 1 h incubation. Thus, increasing concentrations of
 AnthoKit mix up to 200 × 10−6 M Cy-3-sam equivalents appeared
 to yield lower cellular ROS levels as observed for the single frac-
 tions. For example, a concentration of 10 × 10−6 M AnthoKit mix
 decreased the cellular ROS content to 37 ± 10% after 1 h com-
 pared to solvent control. Cy-3-sam induced a reduction of ROS to
 about 47 ± 17 % at the same concentration and time point, Cy-3-
 sam-5-glc to 64 ± 14%. Thus, the mix of the two fractions appears
 to be more potent regarding antioxidative effects than the single
 fractions. However, statistical analysis (one-way ANOVA and
 Bonferroni) reveals no difference in potency between Cy-3-sam
 and the AnthoKit mix. Cy-3-sam-5-glc clearly reduced ROS levels
 less effectively than the AnthoKit mix at concentrations ≥1 ×
 10−6 M and at ≥50 × 10−6 M also than Cy-3-sam. In summary,
 the AnthoKit mix is more potent than Cy-3-sam-5-glc and
 equipotent to Cy-3-sam. Thus, the presence of a less efficient
 anthocyanin in the mixture did not affect the overall effect of the
 more potent Cy-3-sam, presumably as the percentage is rather
 low.

 2.7. Protective Effects Against H2 O2 -Induced Stress

 A modified version of the DCF assay was used to assess whether
 and to which extent a 24 h pre-incubation with anthocyanins
 and respective degradation products can modify the cells’ re-
Figure 5. A) Effect of Cy-3-glc, Cy-3-sam, Cy-3-sam-5-glc, Cy-3-rut, and Cy, sponse to oxidative stress induced by H2 O2 . We hypothesized
on cellular ROS levels of C2BBe1 cells after 1 h of incubation. Data are nor- that potentially strengthening cellular mechanisms such as the
malized to solvent control and presented as T/C (%) from at least five inde- Nrf2/Keap1-pathway are involved to protect from H2 O2 -stress.
pendent experiments. Significant differences between the test substances The effect was detected with the DCF assay as a reduction in flu-
within the same concentration were calculated with one-way ANOVA (Bon-
 orescence and thus in ROS levels.
ferroni) ( = 0.05) and are noted with a) Cy-3-glc, b) Cy-3-sam, c) Cy-3-sam-
5-glc, d) Cy-3-rut, and e) Cy. B) Effect of the AnthoKit mix on ROS levels of Pre-incubation with Cy-3-sam-5-glc, the AnthoKit mix, Cy-3-
C2BBe1 cells after 1 h incubation measured with the DCF assay in compar- rut, and the degradation products Cy, PCA and PGA up to 200 ×
ison to the effect of the single fractions Cy-3-sam and Cy-3-sam-5-glc. The 10−6 M did not reduce the fluorescence generated by H2 O2 over
AnthoKit fraction was used as Cy-3-sam equivalents. Data are presented a time period of 1 h with statistical significance (data not shown),
as mean ± SD normalized to solvent control (T/C) for time point t60 from suggesting no protective effect against H2 O2 -induced ROS pro-
at least five independent experiments. Raw data outliers were eliminated
 duction by these compounds. In contrast, for Cy-3-glc a signifi-
with Nalimov test. Statistical analysis with raw data showed significant
differences to solvent control calculated with ANOVA (Figure S7F, Sup- cant difference to stressed control cells was evident at the high-
porting Information). Significant differences between the test substances est concentration of 200 × 10−6 M (t60 : %, p < 0.001) based on
( = 0.05) are noted with a) Cy-3-sam, b) Cy-3-sam-5-glc, c) AnthoKit mix one-way ANOVA and Bonferroni post hoc test (Figure 6A). The
and was analyzed with one-way ANOVA and Bonferroni post hoc test for fluorescence signal was reduced to 61 ± 11% in comparison to
every concentration level. stressed control cells.
 Similar activity can be assumed for Cy-3-sam. However due
 to significantly different variance homogeneity (as calculated
2.6. Antioxidant Effects: Comparison of Single Anthocyanins and with the Brown–Forsythe test) a non-parametric Kruskal–Wallis
Mixture of Anthocyanins ANOVA was performed, which shows significant differences in
 median values (t60 : p < 0.001) at 200 × 10−6 M, with the ranking
Two highly purified fractions (Cy-3-sam and Cy-3-sam-5-glc) shown in the inserted table of Figure 6B. Cy-3-glc and Cy-3-sam
from the elderberry AnthoKit were tested regarding antioxidant both showed an apparent trend to a dose dependent reduction in
properties as well as the reconstituted mix (AnthoKit mix) com- fluorescence and thus in H2 O2 -induced ROS, yet with statistical

Mol. Nutr. Food Res. 2021, 2100229 2100229 (7 of 13) © 2021 The Authors. Molecular Nutrition & Food Research published by Wiley-VCH GmbH
www.advancedsciencenews.com www.mnf-journal.com

 Figure 7. Effect of Cy, Cy-3-glc, Cy-3-sam and Cy-3-sam-5-glc on H2 O2 -
 induced ROS-levels in C2BBe1 cells after pre-incubated for 24 h. Data plot-
 ted as mean ± SD of test over control (T/C) in %. Cells were stressed for 1 h
 with 1 mM H2 O2 while fluorescence intensity is quantified with a Cytation3
 plate reader. Mean and SD of fluorescence change from t0 was calculated
 in at least triplicates from at least five independent experiments and was
 normalized to DMSO solvent control (T/C in %). DMSO = acidified 0.8%
 DMSO with 1 mM H2 O2 in colorless medium. Non-normalized data out-
 liers were eliminated with Nalimov. Data is plotted at ti = 60 min. ANOVA
 and post hoc Bonferroni (or xx : Kruskal Wallis ANOVA) was performed
 for every concentration level with normalized data. Significantly different
 change of fluorescence between the substances ( = 0.05) noted with a)
 Cy, b) Cy-3-glc, c) Cy-3-sam, d) Cy-3-sam-5-glc. Significant differences to
 DMSO solvent was calculated with ANOVA (Bonferroni) ( = 0.05: *; 0.01:
 **, 0.001: ***) and Student’s t-test ( = 0.001: ###) for each substance
 separately.

 significance only at the highest concentration of 200 × 10−6 M
 (T/C at t60 of Cy-3-glc: 61 ± 11%; Cy-3-sam: 62 ± 17%).
 Since the aglycon Cy is reported to have low stability in
 cell culture media while the glycosides remain stable with a
 degradation of 57% (Cy-3-glc) compared with 96% for Cy after
 4 h incubation[33,34] this may, together with a potential uptake
Figure 6. Effect of A) Cy-3-glc and B) Cy-3-sam on H2 O2 -induced ROS
 via glucose transporters,[35] be an explanation for the lacking
production in C2BBe1 cells. Cells were pre-incubated with anthocyanins
for 24 h and subsequently incubated for 1 h with 1 mM H2 O2 while fluo- protective effect of Cy and the notable effect of the glycosides.
rescence intensity was quantified with a Cytation3 plate reader. The mean One-way ANOVA and Bonferroni post hoc test for comparison
of fluorescence change from t0 was calculated in at least triplicates from between anthocyanins and the aglycon at each separate concen-
at least five independent experiments and is presented as mean ± SD nor- tration with normalized data show that Cy-3-sam lowered the flu-
malized to DMSO solvent control (T/C in %). DMSO = acidified 0.8% orescence intensity induced by H2 O2 significantly better than Cy,
DMSO with 1mM H2 O2 in colorless medium. Non-normalized data (flu- first at 1 × 10⁻⁶ M (p < 0.05) and at 200 × 10−6 M (p < 0.001) (Fig-
orescence change) outliers were eliminated with Nalimov. Statistical anal-
ysis with non-normalized data is used 1) for (A) and 2) for (B). 1) Signif-
 ure 7). Cy-3-glc lowered the fluorescence significantly better than
icant differences to DMSO solvent control were calculated with one-way Cy at 100 × 10−6 M (p < 0.05) and 200 × 10−6 M (p < 0.001). The
ANOVA (Bonferroni) ( = 0.05: *) and Student’s t-test ( = 0.001: ###). two mono-glucosides, Cy-3-glc and Cy-3-sam, seem rather similar
Kolmogorov–Smirnov test for normal distribution and Brown–Forsythe in their protective effect against H2 O2 -induced ROS. Notably, the
test for variance homogeneity was performed. 2) Significant differences AnthoKit mix in Cy-3-sam equivalent concentrations displayed
to solvent control as calculated with Kruskal–Wallis ANOVA ( = 0.05: *) no protective effect. This might point to a potential weaker pro-
and Mann–Whitney U test ( = 0.001: ###). Variance homogeneity was
 tective activity due to combinatory effects.
calculated with the Brown–Forsythe test and found significant different,
hence non-parametric tests for significance were chosen. Inserted table Our results regarding the protective effect of Cy contradict
presents mean ranking of Kruskal–Wallis ANOVA for Cy-3-sam. the results of Cvorovic et al.,[24] who found a dose-dependent
 inhibition of fluorescence increase while incubating Cy with

Mol. Nutr. Food Res. 2021, 2100229 2100229 (8 of 13) © 2021 The Authors. Molecular Nutrition & Food Research published by Wiley-VCH GmbH
www.advancedsciencenews.com www.mnf-journal.com

Caco-2 cells and stressing with the hydroxyl radical-generator study. On the level of chemical structure the addition of a third
2,2′-azo-bis(2-amidinopropane. It should be noted that both del- sugar moiety may reduce the antioxidant impact, as shown for
phinidin and Cy were even inducing the formation of free cyanidin 3-xylosyl-galactoside and cyanidin 3-xylosyl-glucoside-
radicals in LoVo/ADR cells, although the incubation time was galactoside[15] and here for Cy-3-sam-5-glc.
only 1 h. A slightly longer incubation (3 h) with Cy-3-glc in An uptake study with elderberry anthocyanins in aortic en-
Caco-2 cells on the other hand showed a significant protection dothelial cells reported all four anthocyanins (Cy-3-glc, Cy 3,5-
against 2,2-azobis(2-amidinopropane) dihydrochloride-induced O-di-glucoside, Cy-3-sam, and Cy-3-sam-5-glc) to be found in the
ROS-formation.[36] The results from non-tumorigenic colonic cell membrane, while only Cy-3-glc and Cy-3-sam were detected
NCM460 cells with elderberry extract however are in line with in the cytosol. Significantly more Cy-3-glc than Cy-3-sam was de-
the present results, as an inhibition of fluorescence intensity of tected in the cytosol, which the authors attribute to the more com-
13%, 20%, and 40% at 0.01, 0.1, and 1 mg mL−1 respectively was plex structure of Cy-3-sam and that it may be degraded to Cy-3-glc
apparent.[37] Although, it has to be considered that other com- in the cell.[41] A lack of protection by Cy-3-sam-5-glc may thus be
pounds with potential antioxidant activity are present in the fruit attributed to its poor cellular uptake due to the complex glycoside
extract as well. So far to our knowledge no experiments have moiety, although uptake studies in C2BBe1 cells would be needed
been performed regarding protective effects of elderberry antho- for confirmation. However, Cy-3-sam-5-glc displayed antioxidant
cyanins in C2BBe1 colon cells. properties by reducing ROS production in C2BBe1 cells after
 Despite many in vitro studies regarding the chemical an- 1 h of incubation, albeit to a weaker extent, implying more likely
tioxidant activity of the most common anthocyanins and of potential degradation products being responsible for this effect.
anthocyanin-rich extracts, the relevance in vivo is often ques- Conversely, Cy-3-rut bearing the disaccharide formed by glucose
tioned, since most test systems do not consider uptake, and rhamnose acted not protective against oxidative stress and
metabolism and bioavailability of the compounds. Nevertheless, displayed weaker antioxidant properties, thus suggesting that
cell culture experiments are of great value as model systems the structure of substituted sugar may be as well important for
to screen for effects and mechanisms in a biological system[38] bioactivity.
where it is possible both to test high concentrations in order to
screen for toxicity and to use biologically relevant concentrations
that may in vivo reach the cell of interest. The concentrations 2.8. Impact on Transcription of Protective Key Enzymes of
we used in our study span both points of interest, as Esselen Oxidative Stress
et al.[25] calculated, that based on an ileostomy-study where up to
85% of ingested blueberry extract could reach the colon,[39] 200 g To investigate a potential role of Nrf2 in the defense against
blackberries (50 mg total anthocyanins 100 g-1 FW) would sup- H2 O2 -induced ROS production, we performed transcription
ply comparable concentrations in colon cells as proven bioactive analysis of HO-1, GCL, CAT, SOD, and GPx after 2, 6, and 24 h
in their study (max. test concentration: 100 × 10−6 M Cy and Cy- of incubation with Cy-3-glc and Cy-3-sam up to 200 × 10-6 M.
3-glc). Analogue, considering 134.94 mg Cy-3-sam 100 g-1 fresh The results revealed no inducing effects by both anthocyanins
weight of elderberries,[40] a concentration of 197.4 × 10⁻⁶ M may on the transcription of tested genes at any time point (Figure S8,
be reached in the colon; both concentrations which showed a pro- Supporting Information). The results in C2BBe1 cells are not in
tective effect against ROS-production in the protective DCF assay line with data on Cy-3-glc activity in other cell lines. For instance,
with Cy-3-glc and Cy-3-sam. When calculated with the lower per- Speciale et al.[42] report the activation of the Nrf2/ARE pathway
centage of Cy-3-glc (28.3%) arriving in the stoma-bags[39] it would in endothelial cells and Sukprasansap et al.[43] show the induc-
still be 65.7 × 10⁻⁶ M, which was yet potent in lowering the in- tion of CAT, SOD, and GPx in neuronal cells, however at much
tracellular ROS-production. Considering intestinal degradation lower Cy-3-glc concentrations as used in the present study. PCA
products of Cy-based anthocyanins, only PGA might be a good was described to intensify the antioxidant capacity of cells poten-
candidate for induction of protective mechanisms against H2 O2 - tially by increasing the activity of antioxidant enzymes like CAT
induced oxidative stress as has been hypothesized by Kropat in hypertensive rats,[44] and GPx in macrophages.[45]
et al.[10] As the antioxidant properties of Cy-3-glc in vitro appeared Albeit a potential involvement of Nrf2 in the protective effects
to be not affected by this rather pro-oxidant effect of PGA, it might of Cy-3-glc and Cy-3-sam in C2BBe1 cells could not be corrob-
be speculated that PGA is not been formed under the respective orated by qRT-PCR results, considering the pro-oxidant effect
cell culture conditions. Though Kay et al.[33] detected PGA as a of the microbial degradation product PGA and the induction of
degradation product of Cy-3-glc in cell culture medium, thus let- Nrf2-regulated genes in HT-29 cells[10] a potential role of Nrf2
ting assume that the concentrations of PGA might be too low to in protection against oxidative stress is conceivable in the gut.
catch up the antioxidant effect of the anthocyanin. Nevertheless, PGA was ineffective in C2BBe1 cells with respect
 The pure chemical antioxidant activity of anthocyanidins often to protection against H2 O2 -induced stress, suggesting either
has a higher ORAC-value than their respective glycosides, which only a short time pro-oxidant effect of PGA or in case of Cy-3-glc
is attributed to the reactiveness of the aglycon,[15] while for Cy and and Cy-3-sam involvement of other protective mechanisms in
Cy-3-glc this was however the opposite case.[6] Our data regard- C2BBe1 cells than modulation of Nrf2-signaling. Furthermore, it
ing the impact on cellular ROS levels show a similar picture for cannot be excluded, that other Nrf2-responsive genes play a role
Cy and Cy-3-glc. Generally, glycosylation is considered to increase for the observed effect on the ROS production. A broad spectrum
the stability of anthocyanidins potentially leading to different ki- of genes has already been described to possess an antioxidant re-
netic behavior and delayed or no biological effects, as has been sponse element in their promoter region, thus being potentially
observed with some of the tested Cy-based anthocyanins in our responsive to Nrf2-activation. Also, the possibility of pathway

Mol. Nutr. Food Res. 2021, 2100229 2100229 (9 of 13) © 2021 The Authors. Molecular Nutrition & Food Research published by Wiley-VCH GmbH
www.advancedsciencenews.com www.mnf-journal.com

crosstalk makes the picture even more complex.[46] We prese- The hypothesized role of Nrf2 in the protection against oxida-
lected the genes of interest according to previous studies with tive stress could not be corroborated by transcription analysis of
anthocyanin-rich extracts and beverages.[9,10,47] Nevertheless, this the selected genes, suggesting potentially other alternative de-
is the first study using the respective spectrum of side-chain dec- fense mechanisms.
orated anthocyanins and we can´t exclude, the selection of genes
might not be optimal. Additionally, considering the rather high
concentration necessary for protection, an overlay with so far
 4. Experimental Section
not identified alternative defense mechanisms also can´t be Chemicals: Freshly squeezed elderberry juice was obtained from Bay-
excluded. Further, due to the quite high concentrations required ernwald Früchteverwertung KG (Hengersberg, Germany) and stored at
for protection, it may be possible that at the respective time point −80 °C until further use. Cyanidin chloride >98% was bought from
Cy-3-glc and Cy-3-sam to some extent might still be present in PlantMetaChem (Gießen, Germany). Sulforhodamine B sodium salt
 (SRB), 2´,7´-dichlorofluorescin diacetate (DCFH-DA) >98%, catalase
the cells,[41] thus enabling direct quenching of ROS at the molec- from bovine liver (3356 U mg−1 ), PGA (2,4,6-trihydroxybenzaldehyde),
ular level. Another conceivable reason might be the potential of and PCA, purity ≥97% were purchased from Sigma-Aldrich (München,
anthocyanins to potentially alter the stiffness of epithelial cells, Germany). Cy-3-glc was isolated from blackberry juice. Structure and pu-
as has been described for endothelial cells,[48] thus affecting rity (>95%) were analyzed by LC-UV/MS using methodologies described
cellular uptake. in.[51] Cy-3-rut was from inhouse stocks (IPK-Gatersleben) with a purity of
 66.3% based on Q-TOF MS analysis (Figure S1, Supporting Information).
 Anthocyanin Isolation and Preparation of Elderberry AnthoKit: Insoluble
 material was removed from 100 mL elderberry juice, with an anthocyanin
3. Concluding Remarks content of 1.19 µg µL−1 , by centrifugation for 30 min at 13000 x g. The
 supernatant was sequentially filtered through 100 and 20 µm nylon net
So far, no studies of structure-activity relationships with el- filters. Degreasing was realized by thoroughly mixing the extract with two
derberry anthocyanins in C2BBe1 cells have been conducted volumes (v/v) of n-heptane. The lower phase (degreased extract) was care-
considering the impact on cellular ROS levels. We could show fully collected after phase separation. The remaining organic solvent was
 removed under vacuum by means of a rotation evaporator and then the de-
that the basal ROS level of C2BBe1 colon cells was effectively
 greased extract was adjusted to a final concentration of 2% methanol and
lowered by all tested anthocyanins from 0.01 to 0.1 × 10⁻⁶ M 0.5% formic acid (FA). Prior to chromatography the degreased extract was
onwards yet with different efficiencies. Respective degradation sequentially filtered down to 0.2 µm through nylon net filters. This sample
products reduced cellular ROS production potently as well, ex- was named raw juice and was analyzed by LC-UV/MS and LC-MS/MS.
cept the degradation product PGA, which increased ROS levels For anthocyanin isolation the degreased extract, containing a maximum
within a certain concentration range. Cy-3-glc and Cy-3-sam of 100 mg total anthocyanins, was first loaded on a solid phase extraction
proved to be the most potent elderberry anthocyanins regarding column (RediSep RF Gold C18Aq column, 15.5 g, 20–40 µm, Teledyne Isco,
 Lincoln, NE, USA) equilibrated with 2% methanol, 0.5% FA. Compound
antioxidant properties and protection against H2 O2 -induced elution was realized by step gradients at 2%, 10%, 25%, 40%, and 98% of
stress; both also being the most abundant anthocyanins in methanol with 0.5% FA using 7.4 column volumes each, at a flow rate of
elderberry juice.[49] Cy-3-sam-5-glc and Cy-3-rut were less effi- about 20 mL min−1 utilizing a Chromabond vacuum chamber (Machery-
cient and not protective against H2 O2 -induced ROS production, Nagel, Düren, Germany). Resulting fractions were analyzed by LC-UV/MS.
reflecting potential differences in uptake and/or degrada- Fractions containing anthocyanins were then used for further anthocyanin
tion. Further studies in this regard are highly recommended. isolation; those were the two crude fractions from elution with 10% and
 25% methanol, 0.5% FA. Other fractions containing polyphenols but no
Disregarding size and type of the sugar moiety for effective anthocyanins were combined and named polyphenols fraction. The volume
uptake, the impact on membrane fluidity and/or interaction, and the content of organic solvent of these fractions were reduced under
in particular of anthocyanins with complex glycosyl moieties, vacuum by means of a rotation evaporator.
might play a role as well, as has been shown by studies of For final purification the crude isolated fractions were loaded on
Cyboran-Mikolajczyk et al.,[50] thus leading to alteration of cell a preparative HPLC column (Gemini 5 µm NX-C18 110 A, LC Col-
response. umn 250×30 mm, AXIA Packed, Phenomenex, Aschaffenburg, Germany)
 equipped with a pre-column (SecurityGuard PREP Cartridge Gemini-NX
 Respective degradation products of Cy-based anthocyanins
 C18 15×30mm) and equilibrated with water + 2% of 5% ammonium for-
(Cy, PCA, PGA) reduced basal cellular ROS levels as potent as mate in FA. Compound elution was realized by a linear gradient from 2%
the mono- and di-glycoside except for Cy at low concentrations to 30% acetonitrile within 170 min at a flow rate of 10 mL min−1 utiliz-
(1–10 × 10−6 M). This might reflect a hormesis effect of the ing a Varian ProStar chromatography instrument (Agilent Technologies,
compound or being related to its instability, particularly more Santa Clara, CA, USA) with UV monitoring at the wavelengths of 280 and
important at lower concentrations. However, even equipotent 515 nm. Resulting fractions, showing anthocyanin specific absorption at
 515 nm, were analyzed by LC-UV/MS and properly combined. Finally, two
at high concentrations, none of the tested degradation products
 anthocyanin fractions enriched in the main elderberry anthocyanins Cy-
displayed protective properties in our test model. For the first 3-sam-5-glc (further named anthocyanin 1) and Cy-3-sam (further named
time to our knowledge, we could show that the microbial degra- anthocyanin 2) were obtained. Again, other fractions containing polyphe-
dation product PGA significantly increased ROS levels yet within nols but no anthocyanins were combined and added to the polyphenols
a certain concentration range. Our results are mainly in line with fraction. The volume and the content of organic solvent of the final pure
the heterogeneous literature regarding the compounds already isolate fractions were reduced under vacuum.
tested in cell culture experiments, except the protective effect A final purification step was performed to remove remaining low
 molecular weight contaminations (e.g., salt and sugar). Each fraction
attributed to Cy in the experiments of Cvorovic et al.,[24] although (anthocyanin 1, anthocyanin 2, and polyphenols) was adjusted to a final
a direct comparison proves difficult due to different test systems, concentration of 2% methanol, 0.5% FA. In addition, 10 mL of the original
cell lines, modifications of the assays and the use of different elderberry juice were mixed with 10 mL of 2% methanol, 0.5% FA, and
stressors. then cleared by various filtration steps on nylon membranes down to

Mol. Nutr. Food Res. 2021, 2100229 2100229 (10 of 13) © 2021 The Authors. Molecular Nutrition & Food Research published by Wiley-VCH GmbH
www.advancedsciencenews.com www.mnf-journal.com

0.45 µm. Each fraction (anthocyanin 1, anthocyanin 2 and polyphenols, and mL−1 ) for 24 h in the dark. After incubation, cells were fixed by addition of
the cleared elderberry juice) was loaded on a separate solid phase extrac- trichloroacetic acid to the incubation medium and subsequently stained
tion cartridge (Chromabond C18, 70 mL, 10 g, Macherey-Nagel), which with SRB solution (0.4% w/v in 1% acetic acid). After washing with water
was conditioned with two column volumes of 2% methanol, 0.5% FA. The and 1% v/v acetic acid, the color was eluted with Tris buffer (10 mM, pH
flow through was observed to be clear and the anthocyanins bound to the 10). Absorbance was measured at 570 nm with the Cytation 3 microplate
C18 column matrix. Remaining sugars and salts were washed off with two reader (BioTek Instruments, Winooski, VT, USA). Effects on cell growth
column volumes of 2% methanol, 0.5% FA. Elution of the bound antho- were referred to the solvent control and plotted as test over control (T/C)
cyanins and polyphenols was performed with 98% methanol, 0.5% FA. in percent (%) from at least five biological replicates. H2 O2 (1 mM) was
 Aliquots were taken from all purification steps and analyzed for antho- used as positive control.
cyanin and sugar content by plate photometric assays. For preparation Dichlorofluorescein (DCF) Assay: The formation of ROS was quanti-
of the AnthoKit mix the individual purified anthocyanin fractions based on fied fluorometrically by using DCFH-DA following the method described
their natural composition in the elderberry juice; namely 12% of Cy-3-sam- by Wang and Joseph.[57] Briefly, 15000 cells well-1 were seeded in 96-well
5-glc (anthocyanin 1) and 88% of Cy-3-sam (anthocyanin 2) was mixed. All plates and allowed to attach for 24 h. Cells were incubated with DCFH-DA
resulting fractions were dried under nitrogen stream. The obtained dry for 20 min and washed two times with PBS prior incubation with solvent
powder was covered with argon and stored at −20 °C until further use. control (0.8% acidified DMSO) and respective concentrations of antho-
 Anthocyanin Quantification by Spectral Photometric Detection: Total an- cyanins or Cy, PGA, and PCA in the presence of catalase (100 units mL−1 )
thocyanin content was quantified by means of the pH differential method for 1 h. After excitation at = 485 nm DCF emits light at = 528 nm,
described by Giusti and Wrolstad.[52] In brief, the absorbance of pH = 1.0 which was detected with a Cytation 3 microplate reader (BioTek Instru-
(25 mM KCl) and pH = 4.5 (0.4 M Na-acetate) buffer-diluted samples was ments, Winooski, VT, USA). The emitted light directly reflects the ROS pro-
measured at 515 and 700 nm with a SPEKTRAMAX Pro UV-visible spec- duction in the cells. Fluorescence was detected every 15 min over a period
trophotometer (Molecular devices, Sunnyvale, CA, USA). Measurements of 1 h. Data analysis was performed according to Wang and Joseph.[57]
were done in duplicates. The differential absorbance was calculated us- Data are plotted as test over control (T/C) in percent (%) from at least five
ing the following equation: A = (A515 - A700) pH 1.0 – (A515 - A700) pH biological replicates.
4.5. The total anthocyanin content was then calculated based on reference Protective Dichlorofluorescein (pDCF) Assay: A modified version of the
curves for Cy-3-glc in the range from 0.001 to 0.050 mg mL−1 . DCF assay was used to assess the ability of anthocyanins to strengthen the
 Methods for LC-UV/MS and LC-MS/MS Analysis of Anthocyanin Frac- antioxidant defense of cells and thus protection from H2 O2 -induced ROS
tions: Anthocyanins were analyzed by LC-UV/MS as described in Oer- production. Cells were incubated with anthocyanins or respective degra-
tel et al.[53] Details for LC-UV/MS and MS/MS fragmentation analyses dation products for 24 h prior to oxidative stress induction by 1 mM H2 O2
are provided in Supporting information. LC-UV/MS data were analyzed by for up to 1 h. ROS levels were determined as described above with the
means of Bruker Compass DataAnalysis version 4.1 software. The annota- DCF assay. In case of protective effects less DCFH-DA is oxidized to fluo-
tion of compounds was based on comparison of the measured retention rescent DCF, hence showing a lower signal than solvent control containing
times and molecular ion masses with reference standards and fragmen- the stressor.[58,38] To show protective effects more clearly, the fluorescence
tation patterns as obtained from LC-MS/MS experiments (Supporting in- of H2 O2 -treated cells is set to 100% and the fluorescence of anthocyanin
formation, more details). pre-treated cells is plotted as test versus control (T/C) in percent (%) from
 Determination of Glucose, Fructose, and Sucrose: Determination of sol- at least five biological replicates.
uble sugars was performed as described in Stitt et al.[54] by sequen- Quantitative Real-time PCR (qRT-PCR): For transcription analysis of
tial enzymatic degradation of glucose, fructose, and sucrose; using one the antioxidant enzymes HO-1, GCL, CAT, GPx , and SOD in C2BBe1 cells
unit each of glucose-6-phosphate dehydrogenase (Hoffmann-La Roche, qRT-PCR was applied.
Basel, Switzerland) for baseline generation, and then hexokinase, phos- Total RNA was extracted using the RNeasy Mini Prep Kit (Qi-
phoglucoisomerase, and invertase ( -fructofuranosidase, all from Sigma- agen, Hilden, Germany) following the instructions of the manu-
Aldrich), respectively. Quantities were calculated based on reference facturer’s protocol. RNA purity and quantity were determined with
curves for authentic standards in the range from 0.1 to 1.0 mM. the NanoDrop 2000 (Thermo Fisher Scientific, Vienna, Austria).
 Cell Culture and Treatment: The clone of Caco-2, C2BBe1 (ATCC CRL- According to the manufacturer´s protocol total RNA was reverse
2102), was purchased from LGC Standards GmbH (Wesel, Germany). transcribed into complementary DNA (cDNA) using the QuantiTect
Cells were cultivated in Dulbecco´s Modified Eagle Medium (DMEM) reverse transcription Kit (Qiagen). QuantiTect primer assays (Qi-
GlutaMAX with 4.5 g L−1 glucose and sodium pyruvate (Fisher Scientific, agen): Hs_ACTB_1_SG, QT0009543; Hs_CAT_1_SG, QT00079674;
Vienna, Austria) supplemented with 10% heat-inactivated fetal calf serum Hs_GPX2_1_SG, QT00200039; Hs_SOD1_1_SG, QT01008651:
(FCS) and 1% v/v penicillin (5 000 units mL−1 )/streptomycin (5 000 µg Hs_GCLC_1_SG, QT00037310 and Hs_HMOX1_1_SG, QT00092645
mL−1 ) (P/S) at 37 °C, 5% CO2 , and 95% humidity. Cells were tested and Quantitect SybrGreen master mix (Qiagen) were used for gene-
regularly for mycoplasma contamination. specific amplification with the StepOne Plus PCR system (Applied
 Test compounds were dissolved in acidified 80% dimethyl-sulfoxide Biosystems, Life Technologies Corporation, Carlsbad, CA, USA). The
(DMSO) and added to the incubation media, resulting in a final concentra- amplification protocol consisted of an initial activation step of the Taq
tion of 0.8% (v/v) DMSO. Previously, anthocyanidins were found to gener- polymerase for 15 min at 95 °C, 40 cycles comprising denaturation: 15 s,
ate H2 O2 in cell culture medium, accelerating the chemical degradation of 94 °C; annealing: 30 s, 55 °C, and extension: 30 s, 70 °C followed by a
the compounds and possibly causing oxidative cell damage.[55] To prevent melting curve analysis. Relative gene transcript levels were calculated by
these effects, catalase (100 units mL−1 ) was added to the culture medium applying the ΔΔCt-method as amplification efficiency was comparable.
immediately before incubation with test compounds. C2BBe1 cells were Ct-values of the target genes were normalized to the Ct-values of the
used in a non-differentiated state for all experiments and cultivated for control gene -actin and then compared to the calibrator (respective
24 h prior incubation with compounds. solvent control sample). Data are presented as the mean of relative
 Cytotoxicity Assay: The sulforhodamine B assay (SRB assay) was per- transcription (RQ) ± SD of at least three biological replicates.
formed according to a modified method of Skehan et al.[56] The assay mea- Dosage Information/Dosage Regimen: C2BBe1 cells were incubated
sures the optical density (absorbance) of cellular protein stained with the with 0.1, 1, 10, 50, 100 and 200 × 10−6 M anthocyanins or Cy, PCA, and
dye sulforhodamine B, showing a high linear correlation between protein PGA for 1 h (DCF assay) and 24 h (protective DCF assay, SRB assay)
content and optical density. Briefly, 15000 cells per well were seeded in 96- in the presence of catalase (100 units mL−1 ) and 0.8% DMSO (final
well plates and allowed to attach for 24 h. Cells were incubated with solvent concentration). Effects of anthocyanins have been reported in vitro within
control (0.8% acidified DMSO) and respective concentrations of Cy-based this concentration range and timeframe.[10,59,60] For qRT-PCR experi-
anthocyanins or Cy, PCA, and PGA in the presence of catalase (100 units ments only anthocyanins and concentrations were tested that yielded

Mol. Nutr. Food Res. 2021, 2100229 2100229 (11 of 13) © 2021 The Authors. Molecular Nutrition & Food Research published by Wiley-VCH GmbH
You can also read