R-spondin signalling is essential for the maintenance and differentiation of mouse nephron progenitors - eLife
←
→
Page content transcription
If your browser does not render page correctly, please read the page content below
RESEARCH ARTICLE

                                    R-spondin signalling is essential for the
                                    maintenance and differentiation of mouse
                                    nephron progenitors
                                    Valerie PI Vidal1, Fariba Jian-Motamedi1, Samah Rekima1, Elodie P Gregoire1,
                                    Emmanuelle Szenker-Ravi2, Marc Leushacke2, Bruno Reversade2,
                                    Marie-Christine Chaboissier1, Andreas Schedl1*
                                    1
                                        Université Côte d’Azur, Inserm, CNRS, Institut de Biologie Valrose, Nice, France;
                                    2
                                        Institute of Medical Biology, A*STAR, Singapore, Singapore

                                    Abstract During kidney development, WNT/b-catenin signalling has to be tightly controlled to
                                    ensure proliferation and differentiation of nephron progenitor cells. Here, we show in mice that the
                                    signalling molecules RSPO1 and RSPO3 act in a functionally redundant manner to permit WNT/b-
                                    catenin signalling and their genetic deletion leads to a rapid decline of nephron progenitors. By
                                    contrast, tissue specific deletion in cap mesenchymal cells abolishes mesenchyme to epithelial
                                    transition (MET) that is linked to a loss of Bmp7 expression, absence of SMAD1/5 phosphorylation
                                    and a concomitant failure to activate Lef1, Fgf8 and Wnt4, thus explaining the observed phenotype
                                    on a molecular level. Surprisingly, the full knockout of LGR4/5/6, the cognate receptors of
                                    R-spondins, only mildly affects progenitor numbers, but does not interfere with MET. Taken
                                    together our data demonstrate key roles for R-spondins in permitting stem cell maintenance and
                                    differentiation and reveal Lgr-dependent and independent functions for these ligands during
                                    kidney formation.

*For correspondence:
schedl@unice.fr                     Introduction
                                    Nephron endowment is a critical factor for renal health and low number of nephrons have been asso-
Competing interests: The
                                    ciated with chronic kidney disease and hypertension (Bertram et al., 2011). In mammals, nephro-
authors declare that no
                                    genesis is restricted to the developmental period and involves a dedicated nephrogenic niche at the
competing interests exist.
                                    most cortical region of the forming kidney that fuels successive rounds of nephron production
Funding: See page 17                (McMahon, 2016; Oxburgh, 2018; O’Brien, 2019). The nephrogenic niche consists of three inde-
Received: 23 November 2019          pendent progenitor populations that will develop into collecting ducts, stroma (interstitial cells) and
Accepted: 23 April 2020             nephrons. Nephron progenitor cells (NPCs) form a condensed cap around the tips of the branching
Published: 01 May 2020              ureter. This cap mesenchyme (CM) can be further subdivided into populations that represent cells of
                                    progressive differentiation status depending on the position along their migration trajectories
Reviewing editor: Roel Nusse,
Stanford University, United
                                    around the ureteric tips. Analysis over the last decade have identified at least four different subpo-
States                              pulations: 1) CITED1+/SIX2+ that are considered as ‘ground-state’ progenitors; 2) CITED1-/SIX2+
                                    progenitors; 3) primed CITED1-/SIX2+/pSMAD+ progenitors; 4) WNT4+/LEF1+ pretubular aggre-
   Copyright Vidal et al. This
                                    gates (PTA). Once engaged, PTAs undergo a mesenchyme to epithelial transition (MET) to form epi-
article is distributed under the
                                    thelialized renal vesicles, which will further differentiate via comma- and S-shaped bodies into
terms of the Creative Commons
Attribution License, which          segmented nephrons. This traditional view of a molecular and spatial subdivision of the CM has
permits unrestricted use and        been challenged by findings that nephron progenitor cells (NPCs) are much more mobile than previ-
redistribution provided that the    ously appreciated. Indeed, NPCs have been observed to travel back and forth between caps of inde-
original author and source are      pendent tips (Combes et al., 2016) and between the pretubular aggregate and cap mesenchyme
credited.                           state (Lawlor et al., 2019).

Vidal et al. eLife 2020;9:e53895. DOI: https://doi.org/10.7554/eLife.53895                                                          1 of 20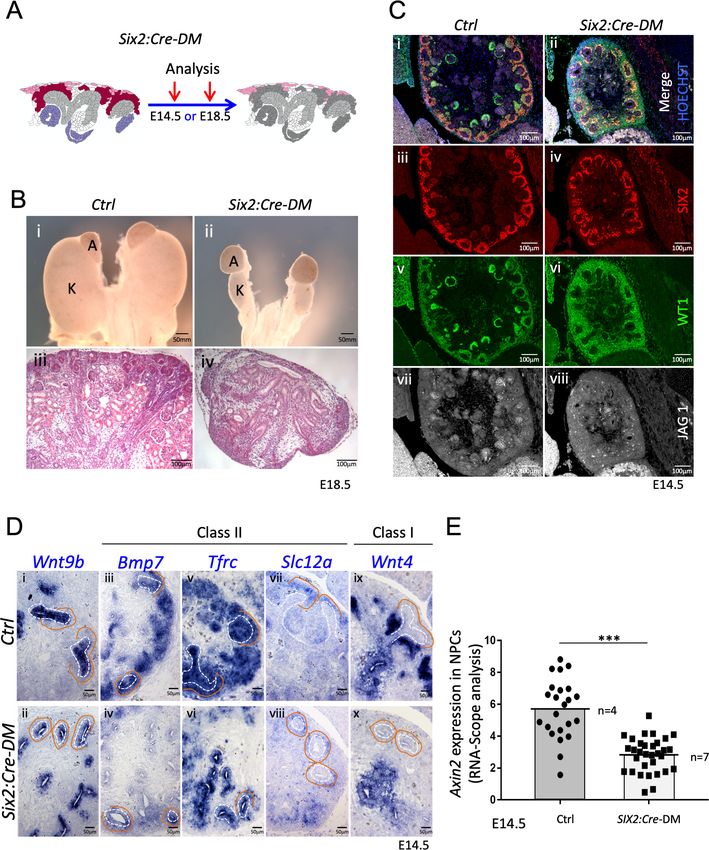
Research article                                                      Developmental Biology Stem Cells and Regenerative Medicine

                                    eLife digest Kidneys filter waste out of the bloodstream to produce urine. Each kidney contains
                                    many structures called nephrons which separate the waste from the blood. The number of nephrons
                                    in a kidney varies between people, and those with low numbers have a higher risk of chronic kidney
                                    disease. Nephrons are formed before birth from a specific group of so-called progenitor cells. Each
                                    of these cells can either divide to make others like itself, or it can specialize to make nephron cells.
                                    At the end of embryonic kidney development, all the progenitor cells become nephron cells.
                                       Cells that specialize to become part of a nephron first go through a change called a
                                    mesenchyme-to-epithelial transition. Epithelial cells move less than mesenchymal cells, and also
                                    develop a clear structure where the two ends of the cell adapt to different roles. Evidence suggests
                                    that a cell communication process called WNT/b-catenin signaling controls this transition. Yet the
                                    details of how this transition is controlled are not fully understood. One way to activate WNT/b-
                                    catenin signaling is with R-spondin proteins, which have been found in developing kidneys.
                                       Vidal et al. studied R-spondins during the embryonic development of kidneys in mice. Removing
                                    R-spondins stopped the progenitor cells from producing more of themselves and increased the
                                    number that died. The R-spondins were also needed for the progenitor cells to specialize as
                                    nephron cells through the mesenchyme-to-epithelial transition. Further results revealed that
                                    R-spondins activate WNT/b-catenin signaling in these cells, even though the proteins that usually act
                                    as R-spondin receptors (called LGR4/5/6) could be removed without affecting the results. This
                                    suggests that R-spondins interact with different receptor proteins during kidney development.
                                       These findings highlight the role of R-spondins and WNT/b-catenin signaling in kidney
                                    development. Future studies will seek the receptor proteins that R-spondins interact with in kidneys.
                                    They may also look to understand how R-spondins balance their different roles in progenitor cells
                                    and during cell specialization. These results in mice could also be extended to determine their
                                    relevance in human health and disease, including chronic kidney disease, which is responsible for
                                    more deaths than breast or prostate cancer.

                                        The transformation of nephron progenitors into epithelialized nephrons is not an entirely cell-
                                    intrinsic process, but requires inductive signals from both the ureteric tip and stromal cells
                                    (O’Brien, 2019). Of particular importance is WNT9b, a molecule released from the branching ureter
                                    that induces canonical WNT/b-catenin signalling, stimulates proliferation and thus ensures self-
                                    renewal of kidney progenitors. Accordingly, deletion of b–catenin leads to the loss of progenitor
                                    cells (Karner et al., 2011). However, canonical WNT signalling is also required for MET
                                    (Carroll et al., 2005) and transient activation of b–catenin in isolated progenitors induces epitheliali-
                                    sation (Park et al., 2007; Kuure et al., 2007; Park et al., 2012). How the balance between progeni-
                                    tor proliferation and differentiation is achieved is not well understood, but experimental evidence
                                    suggests that progenitor proliferation requires low levels of b-catenin activity, whereas genes that
                                    are involved in MET are activated in the presence of a strong canonical b-catenin signal
                                    (Ramalingam et al., 2018). In the context of nephrogenesis, a strong b-catenin response appears to
                                    rely on the activation of canonical BMP/SMAD pathway, as progenitor cells leaving the niche are
                                    positive for pSMAD and deletion of Bmp7 interferes with MET (Brown et al., 2013).
                                        WNT/b-catenin signalling is essential for many organ systems and multiple feedback mechanisms
                                    have been identified that control signalling strength at almost every level of this signal transduction
                                    pathway. WNT receptor availability at the cell membrane is controlled by RNF43 and ZNRF3, two
                                    trans-membrane E3 ubiquitin ligases that induce receptor endocytosis and thus negatively regulate
                                    WNT signalling. Their action is counteracted by R-spondins (RSPO1-4), a family of secreted mole-
                                    cules that bind to the G-protein-coupled receptors LGR4/5/6. Binding to LGRs permits R-spondins
                                    to interact with RNF43/ZNRF3 and suppress endocytosis of the WNT receptor complex, thus
                                    enhancing WNT signalling (de Lau et al., 2014).
                                        In this study, we investigated a potential role of the R-spondin/LGR axis in controlling renal stem/
                                    progenitor behaviour in vivo. We show that Rspo1 and Rspo3 are required to maintain the pool of
                                    renal progenitors throughout development by supporting their proliferative capacity and preventing
                                    their apoptosis. Moreover, strong R-spondin signal is essential to allow nephron progenitors to

Vidal et al. eLife 2020;9:e53895. DOI: https://doi.org/10.7554/eLife.53895                                                            2 of 20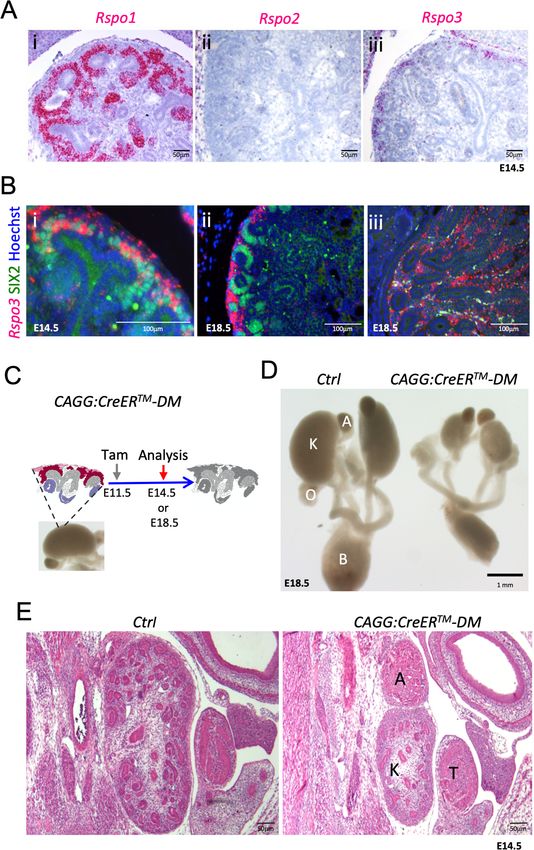
Research article                                                     Developmental Biology Stem Cells and Regenerative Medicine

                                    engage in differentiation and undergo MET. RSPO1/3 achieve these functions by their ability to acti-
                                    vate the WNT/b catenin signalling pathway, a role that is primarily mediated in an LGR-independent
                                    manner.

                                    Results
                                    R-spondins are dynamically expressed during kidney development
                                    To understand the role of R-spondins during kidney development in mice, we first mapped the
                                    expression of the four members of this gene family using qPCR and in situ hybridisation analysis.
                                    Although Rspo2 and Rspo4 were undetectable in developing kidneys (Figure 1—figure supplement
                                    1A—source data 1), Rspo1 and Rspo3 could be found as early as E10.5 within SIX2+ renal progeni-
                                    tors (Figure 1—figure supplements 1B and Motamedi et al., 2014). Interestingly, Rspo3 marked
                                    only a proportion of SIX2 positive cells, suggesting this population to be heterogeneous already at
                                    this early age (Figure 1—figure supplement 1B). At E14.5, Rspo1 was detected throughout the
                                    CM, PTA, within renal vesicles, and the proximal part of the comma- and S-shaped bodies, but
                                    decreased upon podocyte differentiation (Figure 1A and Figure 1—figure supplement 1C). By con-
                                    trast, Rspo3 expression was restricted to uncommitted SIX2+ cells (Figure 1B and Figure 1—figure
                                    supplement 1B–C), and what appeared to be low levels of expression within the cortical stroma
                                    (Figure 1—figure supplement 1C). Indeed, expression within the most cortical population of stro-
                                    mal cells persisted in animals that carry a CM-specific deletion of Rspo3 (Six2:Cre, Rspo3fl/fl) (Fig-
                                    ure 1—figure supplement 1C). Interestingly, by E18.5 Rspo3 was dramatically reduced in NPCs, but
                                    strongly expressed in the cortical stromal compartment (Figure 1Bii), indicating a shift of expression
                                    towards the stroma. Strong Rspo3 signal was also detected in stromal cells lining ducts of the renal
                                    papilla (Figure 1Biii).

                                    RSPO1 and RSPO3 are essential to maintain the pool of kidney
                                    progenitors
                                    Lack of Rspo1 is compatible with life (Chassot et al., 2008) and kidneys isolated from knockout mice
                                    showed no discernible abnormalities (data not shown). Mice carrying a constitutive deletion of
                                    Rspo3 die at E9.5 due to placental defects (Aoki et al., 2007; Kazanskaya et al., 2008). To over-
                                    come this early lethality, we employed a conditional allele for Rspo3 (Rspo3fl/fl) (Rocha et al., 2015)
                                    in combination with a range of Cre-expressing lines (Figure 1—figure supplement 2). Tamoxifen
                                    (Tam) induction at E11.5 in presence of the ubiquitously expressed CAGG:CreERTM driver
                                    (Hayashi and McMahon, 2002) efficiently abolished Rspo3 expression 3 days after induction (E14.5)
                                    (Figure 1—figure supplement 1A) and resulted in a mild reduction of progenitor cells (Figure 1—
                                    figure supplement 3B). To test whether Rspo1 and Rspo3 may act in a functionally redundant man-
                                    ner, we induced deletion at E11.5 and analysed the renal phenotype at E14.5 and E18.5 in double
                                    mutant animals (CAGG:CreERTM; Rspo1-/-, Rspo3fl/fl - from now on called DM). Depletion was effi-
                                    cient, and no compensatory up-regulation of Rspo2 or Rspo4 was detected in double mutant kid-
                                    neys (Figure 1—figure supplement 1A). Macroscopic observation at E18.5 showed severe renal
                                    hypoplasia in R-spondin DM, when compared to control littermates (Figure 1C,D). Hematoxylin and
                                    Eosin (H&E) staining of kidneys at E14.5 indicated a reduced nephrogenic zone and a near-complete
                                    absence of nephrons (Figure 1E). Molecular analysis confirmed a dramatic loss of SIX2+ progenitors
                                    and an absence of forming nephrons (Figure 2A). The remaining SIX2-positive cells appeared scat-
                                    tered, when compared to the condensed mesenchyme seen in controls. A similar loss of NPCs was
                                    observed when R-spondin deletion was induced at E10.5, E12.5 or E13.5 indicating a continuous
                                    requirement of these signalling molecules for the maintenance of the NPC pool (data not shown). To
                                    test whether the reduction of progenitors was caused by defects in proliferation or apoptosis, we
                                    next quantified BrdU incorporation and TUNEL staining (Figure 2B–C; Figure 2—source data 1;
                                    Figure 2—figure supplement 1B,C). In order to measure early events of R-spondin deletion within
                                    progenitors, we allowed the first wave of nephrons to form, TAM-induced CRE activity at E12.5 and
                                    analysed samples 2 days thereafter. Quantification of BrdU-labelled SIX2+ progenitors indicated a
                                    40% reduction of proliferation in this compartment (p=0.0003) (Figure 2B). In addition, a significant
                                    8.1 fold increase of apoptosis among the SIX2+ cells located in the CM was observed (p=0.0319)
                                    (Figure 2C).

Vidal et al. eLife 2020;9:e53895. DOI: https://doi.org/10.7554/eLife.53895                                                          3 of 20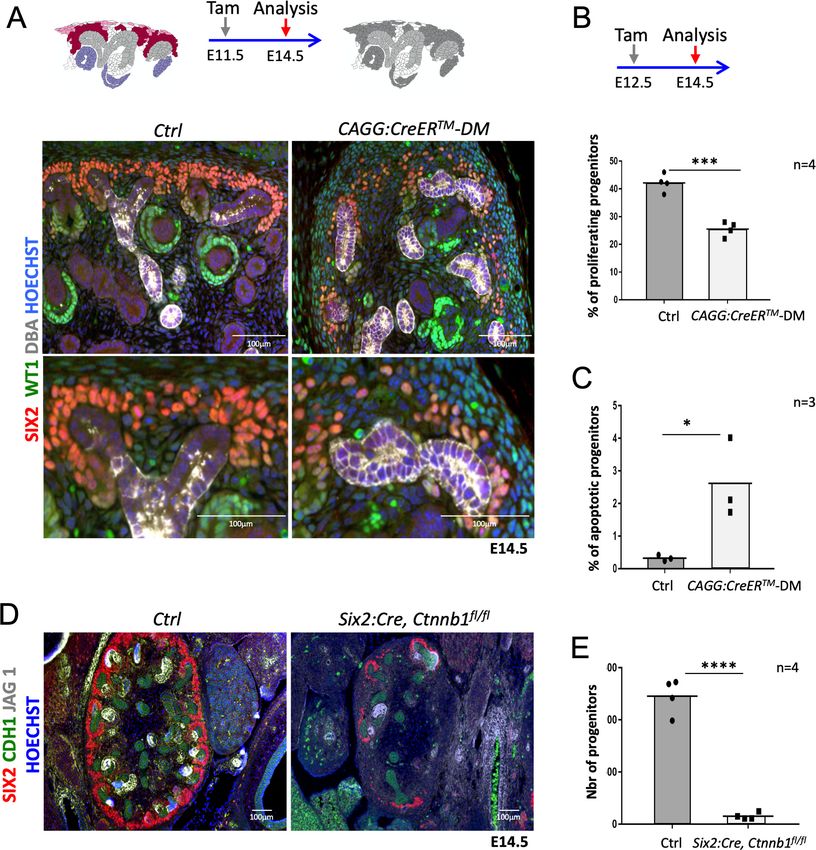
Research article                                                         Developmental Biology Stem Cells and Regenerative Medicine

                                    Figure 1. Rspo1 and Rspo3 are expressed in embryonic kidneys and are required for normal development. (A)
                                    RNA-Scope analysis demonstrates Rspo1 (i) and Rspo3 (iii) expression in the nephrogenic zone of developing
                                    (E14.5) kidneys. (B) RNA-Scope analysis followed by immunostaining for the progenitor marker SIX2 reveals a
                                    switch from strong Rspo3 expression within progenitors at E14.5 (i) to almost exclusively stromal progenitor
                                    Figure 1 continued on next page

Vidal et al. eLife 2020;9:e53895. DOI: https://doi.org/10.7554/eLife.53895                                                                   4 of 20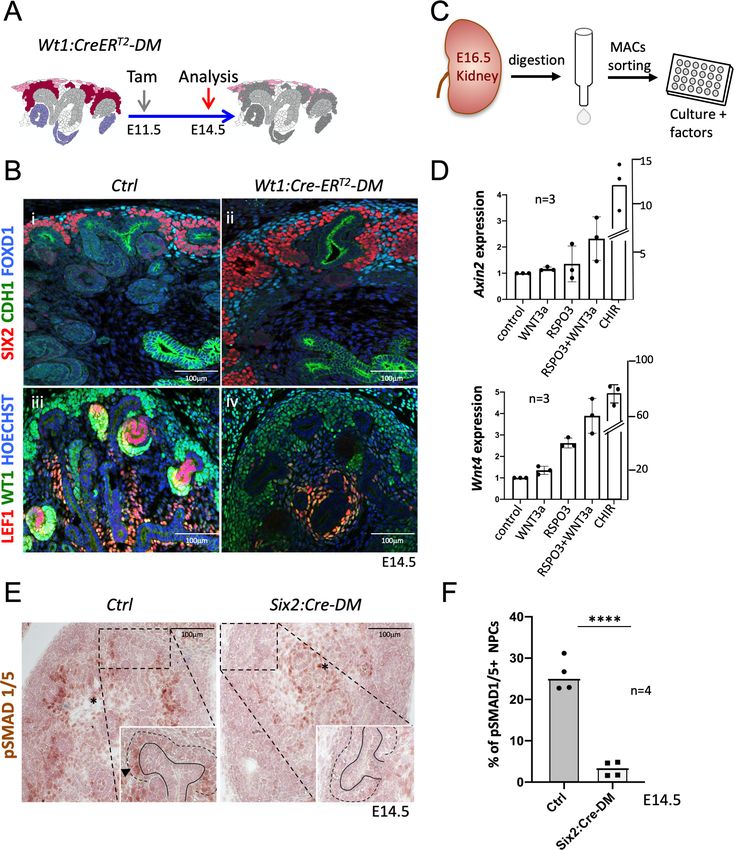
Research article                                                            Developmental Biology Stem Cells and Regenerative Medicine

                                    Figure 1 continued
                                    expression at E18.5 (ii). In addition, strong staining was found within medullary stromal cells (iii). Hoechst stains
                                    nuclei in blue (C) Schematic outline of tamoxifen induction for CAGG:CreERTM-mediated deletion leading to a
                                    complete loss of R-spondin expression in the Rspo1/Rspo3 double mutant (DM). Colour legend: Purple for
                                    Rspo1+, pink for Rspo3+, dark red for Rspo1/Rspo3+ cells. Rspo depleted cells are dark grey, light grey highlights
                                    ureteric cells. (D) Macroscopic view of the urogenital system of Control and CAGG:CreERTM-DM embryos
                                    dissected at E18.5, (E). Hematoxylin and Eosin (Hand E) staining of E14.5 sections reveals smaller kidneys virtually
                                    lacking nephrons. A: adrenal gland, B: bladder, K: kidney, O: ovary, T: testis. CAGG:CreERTM-DM stands for
                                    (CAGG:CreERTM, Rspo1-/-, Rspo3fl/fl), Ctrl: Control.
                                    The online version of this article includes the following source data and figure supplement(s) for figure 1:
                                    Figure supplement 1. R-spondin expression analysis during kidney development.
                                    Figure supplement 1—source data 1. Quantitative analysis of all R-spondin genes expression inRspo1andRspo3-
                                    mutant kidneys.
                                    Figure supplement 2. Schematic outline of the different genetic approaches used in this study.
                                    Figure supplement 3. Rspo1 and Rspo3 are functionally redundant.

                                       As R-spondins are known activators of Wnt/b-catenin signalling, we analysed the expression of
                                    Axin2, a direct downstream target and read-out of canonical b–catenin signalling. Ubiquitous dele-
                                    tion of R-spondins caused a general downregulation of Axin2 already 2 days after tamoxifen induc-
                                    tion, an observation consistent with a loss of WNT/b–catenin signalling (Figure 2—figure
                                    supplement 1D). Progenitor-specific deletion of b-catenin (Six2:Cre; Ctnnb1fl/fl) phenocopied the
                                    Rspo1/3 DM phenotype with a dramatic reduction (93%; p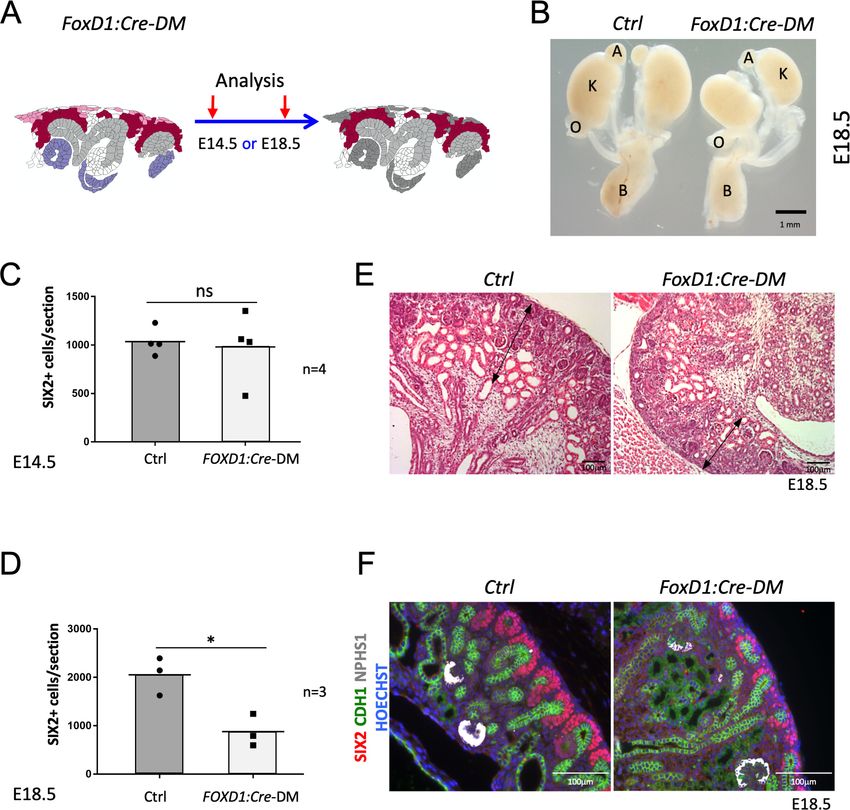
Research article                                                               Developmental Biology Stem Cells and Regenerative Medicine

Figure 2. R-spondins are required for renal progenitor maintenance. (A) Immunofluorescent analysis at E14.5 (induced at E11.5) reveals loss of SIX2+
progenitor cells and nascent nephrons (comma or S-shaped bodies) in CAGG:CreERTM-DM embryos. (WT1 = green; SIX2 = red; DBA = white;
Hoechst = blue). Colour legend for the cartoon: Purple label Rspo1+, pink Rspo3+, dark red Rspo1/Rspo3+ cells. Rspo depleted cells are dark grey,
light grey highlights ureteric cells. (B) Quantification of BrdU-labelled SIX2+ progenitors performed on four embryos (n = 4) demonstrates a significant
reduction of proliferation 2 days after Rspo3 deletion. See Figure 2—source data 1 (C) TUNEL analysis reveals a dramatic increase in apoptosis (n = 3
embryos for each genotype, two litters). (D) Progenitor specific deletion of b-catenin (Six2:Cre; Ctnnb1fl/fl) results in the loss of progenitor cells at E14.5
(SIX2 = red; CDH1 = green; JAG1 = white). (E). Quantification of SIX2+ progenitors (n = 4 embryos for each genotype isolated from two litters). See
Figure 2—source data 1. Columns are means ± SEM with p
Research article                                                          Developmental Biology Stem Cells and Regenerative Medicine

                                    b–catenin dependent genes: Class II genes that require lower levels of b–catenin signalling and are
                                    found predominantly in nephron progenitors; Class I genes such as Wnt4 that depend on strong b–
                                    catenin activation and are highly expressed in pretubular aggregates (Karner et al., 2011;
                                    Ramalingam et al., 2018). In situ hybridisation (ISH) analysis revealed that loss of R-spondins did not
                                    impact Wnt9b expression (Figure 4Di and ii), but dramatically reduced the expression of Class II
                                    (Bmp7, Tfrc, Crym1, Uncx4, Etv5 and Slc12a) target genes within progenitors (Figure 4D and Fig-
                                    ure 4—figure supplement 1C). Interestingly, Tfrc was absent from mesenchymal cells, but was
                                    maintained to be expressed in the ureteric epithelium suggesting that progenitor-specific R-spondin

                                    Figure 3. Stromal RSPO3 maintains the pool of renal progenitors at late stages of kidney development. (A)
                                    Schematic outline of the strategy used for stromal-specific deletion of Rspo3 in the absence of Rspo1. (B)
                                    Macroscopic view of urogenital systems at E18.5 reveals smaller kidneys in Foxd1:Cre-DM mutants when
                                    compared to control littermates. (C) Quantification of SIX2+ progenitors reveals no significant difference in the
                                    number of progenitors between mutant and control kidneys at E14.5 (n = 4 embryos for each genotype, one litter),
                                    see Figure 3—source data 1 (D) but a more than 50% decrease by E18.5 (n = 3 embryos for each genotype, two
                                    litters), see Figure 3—source data 1. (E) H and E staining of kidney sections at E18.5 shows a reduction of the
                                    nephrogenic zone (double arrowed black lines). (F) IF analysis using anti-CDH1 (green) anti-SIX2 (red), and anti-
                                    NPHS1 (marks podocytes in white) antibody reveals a loss of progenitors. Nuclei were counterstained with
                                    Hoechst (blue). A: adrenal gland, B: bladder, K: kidney, O: ovary. Columns are means ± SEM with p
Research article Developmental Biology Stem Cells and Regenerative Medicine Figure 4. Absence of R-spondins from progenitors causes lack of MET and downregulation of b-catenin target genes. (A) Schematic outline of the strategy used for progenitor-specific deletion of Rspo3. Six2:Cre-DM stands for (Six2:Cre, Rspo1-/-, Rspo3fl/fl). (B) Macroscopic view reveals smaller kidneys (K) in mutant E18.5 embryos. H and E staining reveals a complete absence of glomeruli (compare iii and iv). (C) Immunolabelling for SIX2 (red), WT1 (green) and JAG1 (white) revealed a mild reduction of progenitors and confirmed the lack of nephrons on the molecular level (D). In situ Figure 4 continued on next page Vidal et al. eLife 2020;9:e53895. DOI: https://doi.org/10.7554/eLife.53895 8 of 20
Research article                                                          Developmental Biology Stem Cells and Regenerative Medicine

Figure 4 continued
hybridization performed on E14.5 embryos revealed persistence of Wnt9b expression, but dramatic reduction of class I (Wnt4) and class II (Bmp7, Tfrc,
Slc12a) b-catenin target genes in the nephrogenic lineage. Dotted white lines highlight the ureter and orange lines outline the CM compartment. (E)
Quantification with RNA-Scope technology combined with Halo software analysis shows a reduction of Axin2 expression by 51% in the nephrogenic
zone of mutant kidneys compared to control (p
Research article                                                           Developmental Biology Stem Cells and Regenerative Medicine

Figure 5. R-spondins are required for MET induction. (A) Schematic outline of the strategy used for Wt1:CreERT2 induced deletion of Rspo3. Wt1:
CreERT2-DM stands for (Wt1:CreERT2, Rspo1-/-, Rspo3fl/fl). (B) i and ii) Immunolabelling revealed lack of nephrogenesis upon Wt1:CreERT2 induced
deletion of R-spondins, despite the persistence of large numbers of SIX2+ (red) nephron progenitors and FOXD1+ (blue) stroma progenitors
(CDH1 = green). iii and iv) Staining for LEF1 (red) and WT1 (green) confirmed the lack of nephrogenesis (C) Schematic representation of the
methodology followed to isolate and grow kidney progenitors in vitro. (D) Comparison of Axin2 or Wnt4 gene expression levels in nephron progenitors
treated by recombinant protein WNT3a (50 ng/ml) or RSPO3 (200 ng/ml) alone, WNT3a and RSPO3 in combination or CHIR (3mM) alone as an internal
positive control. Experiments were performed as triplicates (n = 3). Compared to control, addition of RSPO3 + WNT3A leads to a 2.3 fold and 4.6 fold
increase of Axin2 and Wnt4 expression respectively, see Figure 5—source data 1. (E). Immunohistochemical analysis for pSMAD1/5 demonstrated the
lack of nephron progenitor priming (black arrowhead). Note the persistence of pSMAD staining in medullary stroma (black asterisk). In the inset, black
lines outline the ureter and dotted lines the CM compartment. (F) Quantification of progenitors that are pSMAD1/5+ reveals a highly significant
reduction of SMAD1/5 phosphorylation in mutant compared to control kidneys at E14.5 (n = 4 embryos for each genotype, 3 and 4 litters for control
and mutant respectively), see Figure 5—source data 1.
The online version of this article includes the following source data and figure supplement(s) for figure 5:
Source data 1. Quantification ofWnt4andAxin2expression in progenitors cultured in vitro and quantification of pSMAD1/5+progenitors inSix2:Cre-
DMkidneys.
Figure supplement 1. Wt1:CreERT2 induced deletion leads to reduced Rspo3 expression.

Vidal et al. eLife 2020;9:e53895. DOI: https://doi.org/10.7554/eLife.53895                                                                    10 of 20
Research article Developmental Biology Stem Cells and Regenerative Medicine
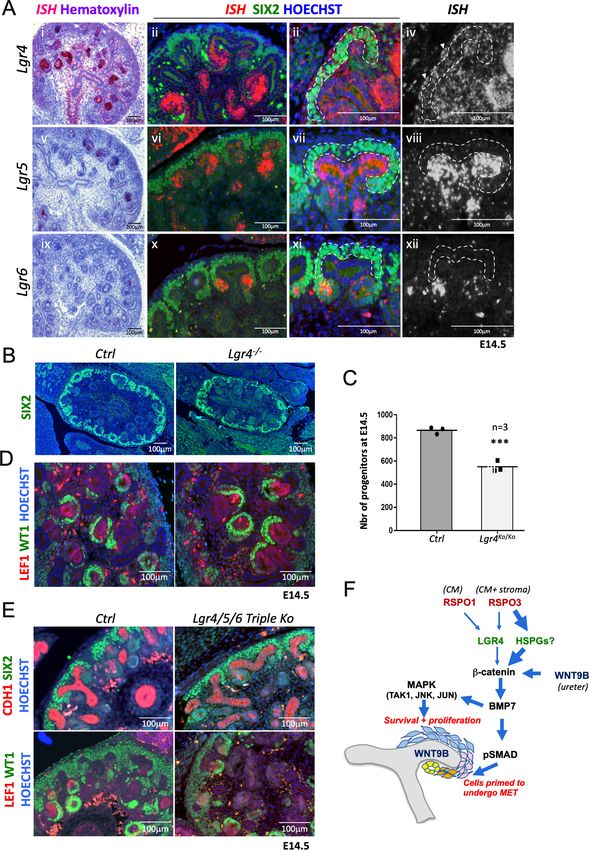
Lgr4/5 have been shown to have mild defects in kidney development (Kato et al., 2006;
Dang et al., 2014; Kinzel et al., 2014). To determine to what extent RSPO1/3 activity in kidney
development depends on the LGR receptor family we mapped their expression using RNA-Scope
analysis. Lgr4 showed the broadest expression pattern with mRNA detected in virtually all cell types
of the developing kidney (Figure 6A). Particularly, strong staining was found in the distal part of
comma shaped bodies that extended into the intermediate segment at the S-shaped body stage. In
addition, we detected strong staining in medullary stromal cells that line the developing ureter. Lgr5
mRNA was virtually absent from the CM, but could be found within ureteric tips, a proportion of
medullary stroma cells and the distal segment of S-shaped bodies, as previously reported using a
lacZ reporter strain (Barker et al., 2012). Lgr6 mRNA showed the most restricted expression pattern
and could only be detected in PTAs of forming nephrons (Figure 6A).
Based on these findings we hypothesized that LGR4 was likely to be the main receptor mediating
RSPO function in renal progenitors. To test this hypothesis, we took advantage of a mouse strain
carrying an Lgr4 null allele that was previously generated by our laboratory (Da Silva et al., 2018).
Quantification of SIX2-positive NPCs at E14.5 indicated a reduction by 37% (p=0.0006) in Lgr4-/-mu-
tants compared to control kidneys (Figure 6B,C; Figure 6—source data 1), a cell loss that was con-
siderably inferior to that observed in R-spondin mutants. Moreover, MET appeared to be unaffected
in LGR4 mutants as exemplified by the activation of LEF1 in PTAs and the presence of WT1 positive
cells in proximal proportion of forming nephrons (Figure 6D). To test whether LGR5 and/or LGR6
may compensate for the lack of LGR4, we next analyzed wholebody Lgr4/5/6 triple knockout kidneys
at E14.5, the latest developmental stage where these embryos can be collected. The absence of
LGR4/5/6 had little effect on early renal development and progenitors were able to undergo MET
and form WT1+ glomeruli (Figure 6E). We conclude that while LGR4 appears to mediate some
R-spondin activity within the nephrogenic niche, the majority of signalling occurs in an LGR-indepen-
dent manner.
Discussion
Controlled proliferation and differentiation of renal progenitors is essential for the establishment of
sufficient numbers of nephrons that ensure healthy kidney function throughout life. Our analysis has
established R-spondins as novel key regulators that ensure the maintenance of a healthy pool of
nephron progenitors throughout kidney development and permit MET during nephrogenesis
(Figure 6F).
Consistent with their partially overlapping expression pattern, R-spondins appear to act in a func-
tionally redundant manner in kidney development and single gene deletion of Rspo1 or Rspo3 had
only mild effects on progenitor numbers (Figure 1—figure supplement 3). However, whereas
Rspo1 is present in all SIX2+ cells, Rspo3 expression is restricted to a subpopulation that - based on
their location at the outermost cortex - appear to represent ‘ground-state’ progenitors. Interestingly,
by E18.5 Rspo3 expression is lost from the nephron progenitor compartment, which is likely to
reflect the progressive aging/differentiation of these cells. Indeed, age-dependent changes of neph-
ron progenitors that affect their proliferation capacity and lifespan have been described, previously
(Chen et al., 2015).
At late stages of embryogenesis, Rspo3 expression becomes almost exclusively restricted to stro-
mal progenitors, which is consistent with recent single sequencing data at E18.5 that highlighted
Rspo3 as a marker for the stromal compartment (Combes et al., 2019). Stromal expression appears
to be important for nephron progenitor maintenance, as Rspo3 deletion in this compartment
(Foxd1:Cre) resulted in progenitor loss at later stages of development. Renal progenitor cells are
thus sandwiched between stromal cells releasing RSPO3 and the WNT9b producing ureteric bud
that ensures their survival at later stages of development.
In previous studies, R-spondins, and in particular Rspo3, have been shown to enhance both
canonical and non-canonical WNT signalling (Kazanskaya et al., 2004; Scholz et al., 2016;
Ohkawara et al., 2011). Our analysis demonstrates that upon R-spondin deletion direct downstream
targets of b–catenin, such as Tafa5 (Karner et al., 2011) and Axin2 (Lustig et al., 2002) are reduced
in nephron progenitors indicating that in kidney development R-spondins activate canonical WNT
signalling. Indeed, the observed phenotypes largely mimic those seen upon loss of b catenin activ-
ity (Karner et al., 2011; Carroll et al., 2005; Park et al., 2012 and this study). These findings are
Vidal et al. eLife 2020;9:e53895. DOI: https://doi.org/10.7554/eLife.53895 11 of 20Research article Developmental Biology Stem Cells and Regenerative Medicine Figure 6. R-spondins can function in an LGR-independent manner during kidney development. (A) i-iiii) RNAScope analysis (red) revealed low levels of Lgr4 expression throughout the developing kidney with strong signal within the distal portion of the forming nephron and weak activation in the stromal cells (white arrowhead). v-viii) Lgr5 expression was found within the ureteric tip and distal segment of S-shaped bodies. ix-xii) Lgr6 expression was restricted to PTAs of newly forming nephrons. (SIX2 = green, Hoechst = blue). The Cap Mesenchyme compartment is outlined by dotted white Figure 6 continued on next page Vidal et al. eLife 2020;9:e53895. DOI: https://doi.org/10.7554/eLife.53895 12 of 20
Research article                                                            Developmental Biology Stem Cells and Regenerative Medicine

Figure 6 continued
lines. (B) Immunofluorescence analysis of Lgr4 knockout and control samples performed on E14.5 kidney sections with SIX2 antibodies reveals a
reduction of nephron progenitors. (C) Quantification of SIX2+ progenitors from (B) (for each genotype n = 3 embryos collected from two litters,) Every
black dot or square represents the total number of SIX2+ progenitors located in the CM counted in one control or mutant of an entire kidney field, see
Figure 6—source data 1. (D) Lgr4 negative progenitors undergo MET as revealed by WT1 staining (high WT1 expression is found in the proximal part
of Comma and S-shaped bodies, as well as podocytes). (E) Immunofluorescent analysis in wholebody Lgr4/5/6 mutants demonstrates persistence of
progenitors and MET despite the absence of all three cognate R-spondin receptors. (F) Model for the molecular cascade regulated by R-spondins
during nephrogenesis.
The online version of this article includes the following source data and figure supplement(s) for figure 6:
Source data 1. Source data for Figure 6C: Quantification of progenitor cells (SIX2+) in controls and Lgr4 mutants at E14.5.
Figure supplement 1. RNF43 and ZNRF3 expression pattern in developing kidneys.

                                     consistent with recent in vitro data that described Rspo1 to enhance canonical signalling upon treat-
                                     ment of a mesonephric cell line (M15) with WNT9b (Dickinson et al., 2019). However, at present we
                                     can not exclude that R-spondins may also modulate non-canonical WNT signalling, which might
                                     affect cell adhesion and migration of NPCs. Live imaging experiments in Six2-Cre:DM will be
                                     required to address this hypothesis.
                                        The substantially different phenotypes observed in CAGG:CreERTM (or Foxd1:Cre) driven dele-
                                     tion of R-spondins, which impacted progenitor survival, and Wt1:CreERT2 (or Six2:Cre) driven exci-
                                     sion that interfered with MET, may at a first glance seem surprising. However, the ubiquitously
                                     expressed CAGG:CreERTM strain completely abolished R-spondin expression in the kidney and thus
                                     effectively blocked b–catenin signalling within progenitors. Since b–catenin signalling is essential for
                                     proliferation and survival, progenitor cell numbers rapidly declined in these mutants. By contrast,
                                     Six2:Cre and Wt1:CreERT2-induced deletions did not interfere with stromal Rspo3 expression, which
                                     bestowed sufficient b-catenin signalling on progenitors to permit survival. This hypothesis is compati-
                                     ble with a model in which low and high levels of b–catenin signalling regulates Class II and Class I
                                     target genes, respectively (Ramalingam et al., 2018). However, the concept of lower b–catenin sig-
                                     nalling in uncommitted progenitors seems contradictory considering that they are exposed to higher
                                     levels of R-spondins (RSPO1+RSPO3), when compared to cells that engage in MET (only RSPO1).
                                     This dilemma can be resolved when introducing an additional ‘switch’ that permits the activation of
                                     class I targets (e.g. Wnt4/Lef1) once progenitors leave the cortical niche. Evidence from knockout
                                     studies suggests this switch to involve Bmp7-dependent activation of pSMAD signalling at the
                                     boundary between the niche and committed cells (Brown et al., 2013). Since progenitors in Six2:
                                     Cre-DM/Wt1:CreERT2-DM mice have significantly decreased levels of Bmp7 (a class II target of b-cat-
                                     enin [Park et al., 2012]), progenitor cells fail to activate pSMAD signalling, lack expression of class I
                                     targets and as a consequence do not epithelialize.
                                        We have also addressed the potential role of LGR4/5/6, the cognate receptors of R-spondins, in
                                     conveying their action. Lgr4 single mutants have been described previously to show dilated collect-
                                     ing ducts and reduced kidney size (Kato et al., 2006) that could be traced back to a reduction in
                                     renal progenitors (Dang et al., 2014). Our own analysis with an independent Lgr4 knockout allele
                                     confirms this phenotype, although duct dilation was only seen at late stages of kidney development
                                     (Da Silva et al., 2018 and data not shown). In R-spondin mutants we did not observe dilated collect-
                                     ing ducts, which might be explained by persistent expression of Rspo3 in medullary stroma using
                                     the tissue-specific deletion in stromal or nephron progenitors. Lgr5 was found to be virtually absent
                                     from uninduced progenitors, but was strongly expressed within the ureteric tip and the distal part of
                                     the developing nephron, two sites of strong b-catenin activity. To our knowledge, no renal abnor-
                                     malities have been associated with Lgr5 mutations and the previously published Lgr4/Lgr5 double
                                     mutants show a kidney phenotype comparable to the Lgr4 single mutant (Kinzel et al., 2014). Our
                                     RNAScope analysis revealed Lgr6 expression to be highly restricted to the pretubular aggregates
                                     and renal vesicle. Surprisingly, Lgr4/5/6 triple knockouts are associated with only a mild loss of renal
                                     progenitors that are capable to undergo MET, a phenotype that does not phenocopy the dramatic
                                     loss of renal progenitors and their inability to undergo MET correlated with the absence of Rspo1
                                     and Rspo3. Due to the embryonic death around E14.5, later stages could not be analysed. Taken
                                     together these data indicate that Lgr4, but not Lgr5/6, contribute to R-spondin signalling in nephron
                                     progenitor cells. However, the mild phenotype observed in single Lgr4 mutants and the triple Lgr

Vidal et al. eLife 2020;9:e53895. DOI: https://doi.org/10.7554/eLife.53895                                                                    13 of 20
Research article Developmental Biology Stem Cells and Regenerative Medicine
knockout when compared to Rspo1/3 mutants, suggests that R-spondins are likely to act primarily in
an LGR-independent manner in NPCs. A similar LGR-independent action has recently been
described for Rspo2 in limb and lung development (Szenker-Ravi et al., 2018). Interestingly, an
alternative mode of action for RSPO2 and RSPO3 has recently emerged that potentiates the WNT/
b catenin pathway through an interaction with heparan sulfate proteoglycans (HSPG)
(Lebensohn and Rohatgi, 2018). In Xenopus, RSPO3 has been shown to interact with Syndecan4 to
induce non-canonical (PCP) signalling (Ohkawara et al., 2011) and Syndecan1 has been suggested
to present WNT and R-spondins in multiple myeloma (Ren et al., 2018). Further analysis will be
needed to identify the proteins responsible for mediating LGR-independent R-spondin action in the
kidney.
The number of nephrons varies dramatically in the human population with a count of 250,000 and
2.5 million glomeruli per kidney being considered as normal. However, lower nephron numbers have
been directly linked with hypertension and a higher risk of developing renal diseases
(Bertram et al., 2011). Our study has identified R-spondins as regulators that maintain the nephro-
genic niche during development and we can speculate that changes in expression levels or protein
function in these genes may be associated with renal disorders. Interestingly, the RSPO3 locus has
been identified in two studies to be linked with renal diseases including abnormal blood urea nitro-
gen (BUN), a hallmark for glomerular filtration dysfunction (Okada et al., 2012; Osman et al.,
2018). Given these studies and our findings in mice, it will be of interest to further investigate a
potential role of R-spondin variants in the predisposition to renal disease.
Materials and methods
Mice
The experiments described in this paper were carried out in compliance with the French and interna-
tional animal welfare laws, guidelines and policies and were approved by the local ethics committee
(PEA N˚: NCE-2014–207 and PEA N˚: 2018060516474844 (V2)). Genetically modified mice used in
this study have been described previously: Rspo3flox (Rocha et al., 2015), Rspo1- (Chassot et al.,
2008), Ctnnbflox (Brault et al., 2001), Lgr4- (Da Silva et al., 2017), Lgr4/5/6–(Szenker-Ravi et al.,
2018), CAGG:CreERTM (Hayashi and McMahon, 2002), Wt1:CreERT2 (Zhou et al., 2008), Six2:Cre
(Kobayashi et al., 2008) and Foxd1:Cre (Kobayashi et al., 2014). Primers for genotyping can be
found in Table 1. For inducible Cre lines (CAGG:CreERTM and Wt1:CreERT2), Cre activation was
achieved by gavage of pregnant females with an extemporarily prepared single dose of 200 mg
tamoxifen dissolved in corn oil per kg of body weight. For proliferation assays, BrdU dissolved in
0.9% NaCl was administered to pregnant dams 2 hr before sacrificing via intraperitoneal (IP) injec-
tion at a dose of 50 mg/kg. Embryos were analyzed at various time-points and genders were not
considered.
Embryo collection
Embryos were collected from time-mated females considering the date when the vaginal plug was
observed as embryonic day 0.5 (E0.5). Embryos from E11.5 to E18.5 were fixed with 4% paraformal-
dehyde (PFA) in phosphate buffer saline (PBS) overnight at 4˚C or at room temperature, if used for
RNA-Scope analysis. The day after, embryos were washed in PBS, dehydrated through an Automatic
tissue processor (Leica TP1020) and embedded in paraffin.
In situ hybridization
Tissues were fixed overnight in 4% paraformaldehyde, progressively dehydrated and embedded in
paraffin. 7-mm-thick sections were cut then rehydrated and hybridization was performed as
described in Lescher et al., 1998 using an InsituPro VSi robot from Intavis Bioanalytical Instruments.
Digoxygenin-labelled antisense RNA probes were synthesized from plasmids obtained from different
sources: Rspo1, Rspo3, Wnt4, Wnt9b (Gift from McMahon’s laboratory), Bmp7, Etv5 and Crym (Gift
from T. Carroll’s laboratory), Uncx4 (Gift from A. Reginensi, in J. Wrana’s laboratory), Slc12a, Tfrc
and Tafa5 DNA sequences were subcloned in pCRII Topo vector. Hybridized DIG-RNA probes were
detected with alkaline phosphatase-coupled anti-digoxigenin antibody. After washing, the chromo-
genic reaction was performed with BM-purple substrate for several days at room temperature.
Vidal et al. eLife 2020;9:e53895. DOI: https://doi.org/10.7554/eLife.53895 14 of 20Research article Developmental Biology Stem Cells and Regenerative Medicine
Table 1. List of primer pairs used for qPCR or genotyping analysis in this study.
Name Forward Reverse Usage
Axin2 GCAAGTCCAAGCCCCATA CGGCTGACTCGTTCTCCT qPCR
Rspo2 GCCAGGCAAAAGACACAATACCA CAATCAGGCTTCCGCCTCTTCTTC qPCR
Rspo3 TCAAAGGGAGAGCGAGGA CAGGAGGAGGAGCTTGTTTCC qPCR
Rspo4 GCTGTTTCAGGCCAGGGACTTC TTGTGTATGCAGGGGACTCCA qPCR
Sdha TGTTCAGTTCCACCCCACA TCTCCACGACACCCTTCTG pPCR
Wnt4 ACTGGACTCCCTCCCTGTCT TGCCCTTGTCACTGCAAA qPCR
Ctnnb1 AAGGTAGAGTGATGAAAGTTGTT CACCATGTCCTCTGTCTATTC Genotyping
Cre CCCACCGTCAGGTACGTGAGATAT CGCGGTCTGGCAGGTAAAAACTAT Genotyping
Foxd1 Wt CTCCTCCGTGTCCTCGTC TCTGGTCCAAGAATCCGAAG Genotyping
Foxd1 Cre GGGAGGATTGGGAAGACAAT TCTGGTCCAAGAATCCGAAG Genotyping
Lgr4 Wt and Ko TGTGTTTTGGCTTGCTTGAC AGTCTGCTCCCCTACCACT Genotyping
Lgr4 Wt TGCAACCCTAGAAGGGAAAA CTCACAGGTGCTTGGGTGAAG Genotyping
Lgr4 Ko GCCTGCATTACCGGTCGATGCAACGA CTCACAGGTGCTTGGGTGAAG Genotyping
Lgr5 Wt ACATGCTCCTGTCCTTGCT GTAGGAGGTGAAGACGCTGA Genotyping
Lgr5 Ko CACTGCATTCTAGTTGTGG CGGTGCCCGCAGGCGAG Genotyping
Lgr6 Wt CGCTCGCCCGTCTGAGC GCGTCCAGGGTCCGCAGGG Genotyping
Lgr6 Ko CGCTCGCCCGTCTGAGC CCTGGACGTAGCCTTCGGGC Genotyping
Rspo1Ko ATCCAGGGGTCCCTCTTGATC AATATCGCGGCTCATTCGAGG Genotyping
Rspo1Wt ATCCAGGGGTCCCTCTTGATC TTGAGGCAACCGTTGACTTC Genotyping
Rspo3flox CTTCAACTTGAAGGTGCTTTACC CCAGGAATGTACAACAGGATCCTCTC Genotyping
RNAscope analysis (Advanced Cell Diagnostics; Lgr4, Lgr5, Lgr6, Rspo1, Rspo2, Rspo3, Axin2) was
performed according to the manufacturer’s instructions using the chromogenic Fast Red dye that
can be visualized using light or fluorescence microscopy. Alternatively, after in situ hybridization, sec-
tions were blocked in a PBS solution containing 3% BSA, 10% Normal Donkey Serum and 0.1%
Tween, then primary antibodies were added at concentrations reported in Supplementary file 1
and incubated overnight at 4˚C. The following day, after three washes in PBS, secondary antibodies
were diluted 1/500 in PBS and applied on sections for 1H at room temperature. After three washes
in PBS, sections were mounted in a 50% glycerol (in PBS) medium.
Immunofluorescence and histological analysis
For immunofluorescence experiments, tissues were fixed overnight in 4% paraformaldehyde, pro-
gressively dehydrated and embedded in paraffin. 5 mm thick sections were rehydrated, boiled in a
pressure cooker for 2 min with Antigen Unmasking Solution and blocked in PBS solution containing
10% normal donkey serum, 0.1% tween and 3% BSA. All antibodies were applied overnight at 4˚C at
the concentrations listed in the Supplementary file 1. Secondary antibodies were diluted 1:500 and
applied at room temperature for 1 hr. For histological analysis, 5-mm-thick sections were stained
with hematoxylin and eosin according to standard procedures.
Quantitative RT-PCR analysis
RNA was extracted from embryonic samples or cultured cells using RNeasy Mini- or Micro-kit, fol-
lowing the manufacturer’s instructions. Reverse transcription was performed using M-MLV reverse
transcriptase in combination with Random Hexamers. The cDNA synthesised was used as a template
for qPCR reaction performed using the Light Cycler SYBR Green I Master Kit. Expression levels were
normalized for Sdha. Primers are described in Table 1.
Vidal et al. eLife 2020;9:e53895. DOI: https://doi.org/10.7554/eLife.53895 15 of 20Research article Developmental Biology Stem Cells and Regenerative Medicine
Quantification of proliferating renal progenitors
A combination of anti-BrdU and anti-SIX2 antibodies was used to detect proliferating renal progeni-
tors. Quantification was performed on four embryos (n = 4) isolated either from 2 (for CAGG:
CreERTM-DM) or 3 (for Ctrl) different litters. For each embryo between 10 and 40 kidney sections
were analysed that were collected throughout the entire organ. Pictures were taken with a Zeiss
Apotome two upright microscope and every kidney field on the picture was analysed with Fiji soft-
ware. Only SIX2+ cells located in the cap mesenchyme were considered for quantification. The per-
centage of proliferating progenitors was obtained after scoring for every embryo the average of
(BrdU/SIX2) double positive nuclei divided by the total number of SIX2+ cells in the CM. Each value
was reported on the graph as a single symbol (black dot for Ctrl and black square for CAGG:
CreERTM-DM).
Quantification of apoptotic renal progenitors
Apoptotic cells were labelled with TUNEL kit (Roche) and renal progenitors identified using anti-SIX2
antibodies. Quantification was performed on three embryos (n = 3) isolated from two different lit-
ters. For each embryo, between 6 and 15 sections, going through the kidney centre (pelvic region)
were analysed. Pictures were taken for every kidney with a Zeiss Apotome two upright microscope.
In every kidney field, only SIX2+ cells located in the cap mesenchyme were considered and quanti-
fied with Fiji software. The percentage of apoptotic progenitors was obtained after scoring for every
embryo the average of (TU/SIX2) double positive nuclei divided by the total number of SIX2+ cells in
the CM. Each value was reported on the graph as a single symbol (black dot for Ctrl and black
square for CAGG:CreERTM-DM).
Quantification of renal progenitors
SIX2+ progenitors located in the cap mesenchyme were counted in three sagittal sections (20 mm
apart to each other) of kidney samples through the renal pelvis and the average number obtained
for every embryo was reported on the graph.
Quantification of Axin2 level of expression from RNAScope analysis
Three to eight sagittal sections of kidney samples were cut through the renal pelvis (20 mm apart
from each other), and subjected to in situ RNA hybridisation (RNAScope technology) using an Axin2
anti-sense probe. Sections were mounted in Vectashield antifade mounting medium with DAPI and
imaged with a Slide scanner Vectra Polaris. RNAScope signal was detected with filter 555 and nuclei
with filter 350. Images were analysed with Halo software (Indica labs) using FISH-IF module that was
based on cell segmentation and ISH signal per cell. The value obtained for every kidney section ana-
lysed is reported on the graph by either a point (for control) or a square (for mutant). Each symbol
corresponds to the total RNAScope signal detected per selected kidney field normalised to the total
number of cells present in this area.
Quantification of progenitors that are pSMAD1/5 positives
Immunostaining with anti-pSMAD1/5 antibodies was performed on 3 to 6 sagittal sections (20 mm
apart to each other) of kidney samples, and signal was revealed using the Vector Red alkaline phos-
phatase kit. For every section, progenitors located in CM that were labelled with anti-PSMAD1/5
antibodies were counted and normalised to the total number of progenitors that were in this CM.
Every average number obtained for every embryo was reported on the graph as a dot (for control)
or a square (for mutant) samples.
Statistical analyses
Data are shown as mean (± s.e.m). Analyses were performed according to the two-tailed unpaired
Student’s t-test, *pResearch article Developmental Biology Stem Cells and Regenerative Medicine
according to Brown et al. (2015). Nephron progenitors were purified by MACS sorting and resus-
pended in Apel medium supplemented with 2% PFHM II (Protein Free Hybridoma Medium II), FGF9
(200 ng/ml) and Heparin (1 mg/ml) as growth control medium. Freshly isolated cells were seeded at
200,000 cells per 24-well dish and cultured for 48 hr at 37˚C, 5% CO2. We tested the effect of
medium supplementation with RSPO3 (200 ng/ml) + WNT3a (50 ng/ml) or with Chir (3 mM) only.
After 2 days, cells were scrapped with RLT buffer (Qiagen) and RNA extracted using RNeasy Mini kit
according to the manufacturer’s instructions (Qiagen).
Acknowledgements
We thank Clara Panzolini for technical assistance and the entire staff of the iBV animal facility for
their dedication. We are grateful to Agnès Loubat (iBV Cytology platform, Nice) for valuable discus-
sions and advices with cell culture settings. We are indebted to Hitoshi Okamoto (Riken Institute,
Japan) for providing the Rspo3flox allele and Thomas J Carroll, Andrew P McMahon and Antoine
Reginensi for sharing in situ probes.
This work was supported by grants from the EC (EURenOmics Grant agreement 305608) and La
Ligue Contre le Cancer (Equipe labelisée) and the Conseil général des Alpes Maritimes for the
financing of the Intavis In situ Robot.
Additional information
Funding
Funder Grant reference number Author
European Commission 305608 Andreas Schedl
Ligue Contre le Cancer Equipe labelisee Andreas Schedl
The funders had no role in study design, data collection and interpretation, or the
decision to submit the work for publication.
Author contributions
Valerie PI Vidal, Conceptualization, Data curation, Formal analysis, Supervision, Validation, Investiga-
tion, Visualization, Methodology, Writing - original draft, Writing - review and editing; Fariba Jian-
Motamedi, Investigation, Methodology, Writing - review and editing; Samah Rekima, Data curation;
Elodie P Gregoire, Data curation, Formal analysis, Investigation, Visualization; Emmanuelle Szenker-
Ravi, Marc Leushacke, Bruno Reversade, Resources, Investigation, Writing - review and editing;
Marie-Christine Chaboissier, Conceptualization, Resources, Supervision, Project administration, Writ-
ing - review and editing; Andreas Schedl, Conceptualization, Resources, Formal analysis, Supervi-
sion, Funding acquisition, Investigation, Visualization, Writing - original draft, Project administration,
Writing - review and editing
Author ORCIDs
Valerie PI Vidal https://orcid.org/0000-0001-8385-835X
Bruno Reversade http://orcid.org/0000-0002-4070-7997
Marie-Christine Chaboissier http://orcid.org/0000-0003-0934-8217
Andreas Schedl https://orcid.org/0000-0001-9380-7396
Ethics
Animal experimentation: The experiments described in this paper were carried out in compliance
with the French and international animal welfare laws, guidelines and policies and were approved by
the local ethics committee (PEA No NCE-2014-207 and PEA No: 2018060516474844 (V2)).
Decision letter and Author response
Decision letter https://doi.org/10.7554/eLife.53895.sa1
Author response https://doi.org/10.7554/eLife.53895.sa2
Vidal et al. eLife 2020;9:e53895. DOI: https://doi.org/10.7554/eLife.53895 17 of 20Research article Developmental Biology Stem Cells and Regenerative Medicine
Additional files
Supplementary files
. Supplementary file 1. Key resources table.
. Transparent reporting form
Data availability
All data generated or analysed during this study are included in the manuscript and supporting files.
Source data files have been provided for Figures 2B, 2C, 2E, 3C, 3D, 4E, 5D, 5F 6C, and Figure 1—
figure supplement 1A.
References
Aoki M, Mieda M, Ikeda T, Hamada Y, Nakamura H, Okamoto H. 2007. R-spondin3 is required for mouse
placental development. Developmental Biology 301:218–226. DOI: https://doi.org/10.1016/j.ydbio.2006.08.
018, PMID: 16963017
Barker N, Rookmaaker MB, Kujala P, Ng A, Leushacke M, Snippert H, van de Wetering M, Tan S, Van Es JH,
Huch M, Poulsom R, Verhaar MC, Peters PJ, Clevers H. 2012. Lgr5(+ve) stem/progenitor cells contribute to
nephron formation during kidney development. Cell Reports 2:540–552. DOI: https://doi.org/10.1016/j.celrep.
2012.08.018, PMID: 22999937
Bertram JF, Douglas-Denton RN, Diouf B, Hughson MD, Hoy WE. 2011. Human nephron number: implications
for health and disease. Pediatric Nephrology 26:1529–1533. DOI: https://doi.org/10.1007/s00467-011-1843-8,
PMID: 21604189
Brault V, Moore R, Kutsch S, Ishibashi M, Rowitch DH, McMahon AP, Sommer L, Boussadia O, Kemler R. 2001.
Inactivation of the beta-catenin gene by Wnt1-Cre-mediated deletion results in dramatic brain malformation
and failure of craniofacial development. Development 128:1253–1264. PMID: 11262227
Brown AC, Muthukrishnan SD, Guay JA, Adams DC, Schafer DA, Fetting JL, Oxburgh L. 2013. Role for
compartmentalization in nephron progenitor differentiation. PNAS 110:4640–4645. DOI: https://doi.org/10.
1073/pnas.1213971110, PMID: 23487745
Brown AC, Muthukrishnan SD, Oxburgh L. 2015. A synthetic niche for nephron progenitor cells. Developmental
Cell 34:229–241. DOI: https://doi.org/10.1016/j.devcel.2015.06.021, PMID: 26190145
Carroll TJ, Park JS, Hayashi S, Majumdar A, McMahon AP. 2005. Wnt9b plays a central role in the regulation of
mesenchymal to epithelial transitions underlying organogenesis of the mammalian urogenital system.
Developmental Cell 9:283–292. DOI: https://doi.org/10.1016/j.devcel.2005.05.016, PMID: 16054034
Chassot AA, Ranc F, Gregoire EP, Roepers-Gajadien HL, Taketo MM, Camerino G, de Rooij DG, Schedl A,
Chaboissier MC. 2008. Activation of beta-catenin signaling by Rspo1 controls differentiation of the mammalian
ovary. Human Molecular Genetics 17:1264–1277. DOI: https://doi.org/10.1093/hmg/ddn016, PMID: 18250098
Chen S, Brunskill EW, Potter SS, Dexheimer PJ, Salomonis N, Aronow BJ, Hong CI, Zhang T, Kopan R. 2015.
Intrinsic Age-Dependent changes and Cell-Cell contacts regulate nephron progenitor lifespan. Developmental
Cell 35:49–62. DOI: https://doi.org/10.1016/j.devcel.2015.09.009, PMID: 26460946
Combes AN, Lefevre JG, Wilson S, Hamilton NA, Little MH. 2016. Cap mesenchyme cell swarming during kidney
development is influenced by attraction, repulsion, and adhesion to the ureteric tip. Developmental Biology
418:297–306. DOI: https://doi.org/10.1016/j.ydbio.2016.06.028, PMID: 27346698
Combes AN, Phipson B, Lawlor KT, Dorison A, Patrick R, Zappia L, Harvey RP, Oshlack A, Little MH. 2019. Single
cell analysis of the developing mouse kidney provides deeper insight into marker gene expression and ligand-
receptor crosstalk. Development 146:dev178673. DOI: https://doi.org/10.1242/dev.178673, PMID: 31118232
Da Silva F, Rocha AS, Motamedi FJ, Massa F, Basboga C, Morrison H, Wagner KD, Schedl A. 2017. Coronary
artery formation is driven by localized expression of R-spondin3. Cell Reports 20:1745–1754. DOI: https://doi.
org/10.1016/j.celrep.2017.08.004, PMID: 28834739
Da Silva F, Massa F, Motamedi FJ, Vidal V, Rocha AS, Gregoire EP, Cai CL, Wagner KD, Schedl A. 2018.
Myocardial-specific R-spondin3 drives proliferation of the coronary stems primarily through the leucine rich
repeat G protein coupled receptor LGR4. Developmental Biology 441:42–51. DOI: https://doi.org/10.1016/j.
ydbio.2018.05.024, PMID: 29859889
Dang Y, Liu B, Xu P, Zhu P, Zhai Y, Liu M, Ye X. 2014. Gpr48 deficiency induces polycystic kidney lesions and
renal fibrosis in mice by activating wnt signal pathway. PLOS ONE 9:e89835. DOI: https://doi.org/10.1371/
journal.pone.0089835, PMID: 24595031
de Lau W, Peng WC, Gros P, Clevers H. 2014. The R-spondin/Lgr5/Rnf43 module: regulator of wnt signal
strength. Genes & Development 28:305–316. DOI: https://doi.org/10.1101/gad.235473.113, PMID: 24532711
Dickinson KK, Hammond LC, Karner CM, Hastie ND, Carroll TJ, Goodyer P. 2019. Molecular determinants of
WNT9b responsiveness in nephron progenitor cells. PLOS ONE 14:e0215139. DOI: https://doi.org/10.1371/
journal.pone.0215139, PMID: 30978219
Vidal et al. eLife 2020;9:e53895. DOI: https://doi.org/10.7554/eLife.53895 18 of 20Research article Developmental Biology Stem Cells and Regenerative Medicine
Hayashi S, McMahon AP. 2002. Efficient recombination in diverse tissues by a tamoxifen-inducible form of cre: a
tool for temporally regulated gene activation/inactivation in the mouse. Developmental Biology 244:305–318.
DOI: https://doi.org/10.1006/dbio.2002.0597, PMID: 11944939
Karner CM, Das A, Ma Z, Self M, Chen C, Lum L, Oliver G, Carroll TJ. 2011. Canonical Wnt9b signaling balances
progenitor cell expansion and differentiation during kidney development. Development 138:1247–1257.
DOI: https://doi.org/10.1242/dev.057646, PMID: 21350016
Kato S, Matsubara M, Matsuo T, Mohri Y, Kazama I, Hatano R, Umezawa A, Nishimori K. 2006. Leucine-rich
repeat-containing G protein-coupled receptor-4 (LGR4, Gpr48) is essential for renal development in mice.
Nephron Experimental Nephrology 104:e63–e75. DOI: https://doi.org/10.1159/000093999, PMID: 16785743
Kazanskaya O, Glinka A, del Barco Barrantes I, Stannek P, Niehrs C, Wu W. 2004. R-Spondin2 is a secreted
activator of wnt/beta-catenin signaling and is required for Xenopus myogenesis. Developmental Cell 7:525–
534. DOI: https://doi.org/10.1016/j.devcel.2004.07.019, PMID: 15469841
Kazanskaya O, Ohkawara B, Heroult M, Wu W, Maltry N, Augustin HG, Niehrs C. 2008. The wnt signaling
regulator R-spondin 3 promotes angioblast and vascular development. Development 135:3655–3664.
DOI: https://doi.org/10.1242/dev.027284, PMID: 18842812
Kinzel B, Pikiolek M, Orsini V, Sprunger J, Isken A, Zietzling S, Desplanches M, Dubost V, Breustedt D, Valdez R,
Liu D, Theil D, Müller M, Dietrich B, Bouwmeester T, Ruffner H, Tchorz JS. 2014. Functional roles of Lgr4 and
Lgr5 in embryonic gut, kidney and skin development in mice. Developmental Biology 390:181–190.
DOI: https://doi.org/10.1016/j.ydbio.2014.03.009, PMID: 24680895
Kobayashi A, Valerius MT, Mugford JW, Carroll TJ, Self M, Oliver G, McMahon AP. 2008. Six2 defines and
regulates a multipotent self-renewing nephron progenitor population throughout mammalian kidney
development. Cell Stem Cell 3:169–181. DOI: https://doi.org/10.1016/j.stem.2008.05.020, PMID: 18682239
Kobayashi A, Mugford JW, Krautzberger AM, Naiman N, Liao J, McMahon AP. 2014. Identification of a
multipotent self-renewing stromal progenitor population during mammalian kidney organogenesis. Stem Cell
Reports 3:650–662. DOI: https://doi.org/10.1016/j.stemcr.2014.08.008, PMID: 25358792
Kuure S, Popsueva A, Jakobson M, Sainio K, Sariola H. 2007. Glycogen synthase kinase-3 inactivation and
stabilization of beta-catenin induce nephron differentiation in isolated mouse and rat kidney mesenchymes.
Journal of the American Society of Nephrology 18:1130–1139. DOI: https://doi.org/10.1681/ASN.2006111206,
PMID: 17329570
Lawlor KT, Zappia L, Lefevre J, Park JS, Hamilton NA, Oshlack A, Little MH, Combes AN. 2019. Nephron
progenitor commitment is a stochastic process influenced by cell migration. eLife 8:e41156. DOI: https://doi.
org/10.7554/eLife.41156, PMID: 30676318
Lebensohn AM, Rohatgi R. 2018. R-spondins can potentiate WNT signaling without LGRs. eLife 7:e33126.
DOI: https://doi.org/10.7554/eLife.33126, PMID: 29405118
Lescher B, Haenig B, Kispert A. 1998. sFRP-2 is a target of the Wnt-4 signaling pathway in the developing
metanephric kidney. Developmental Dynamics 213:440–451. DOI: https://doi.org/10.1002/(SICI)1097-0177
(199812)213:43.0.CO;2-6, PMID: 9853965
Lustig B, Jerchow B, Sachs M, Weiler S, Pietsch T, Karsten U, van de Wetering M, Clevers H, Schlag PM,
Birchmeier W, Behrens J. 2002. Negative feedback loop of wnt signaling through upregulation of conductin/
axin2 in colorectal and liver tumors. Molecular and Cellular Biology 22:1184–1193. DOI: https://doi.org/10.
1128/MCB.22.4.1184-1193.2002, PMID: 11809809
McMahon AP. 2016. Development of the mammalian kidney. Current Topics in Developmental Biology 117:31–
64. DOI: https://doi.org/10.1016/bs.ctdb.2015.10.010, PMID: 26969971
Motamedi FJ, Badro DA, Clarkson M, Lecca MR, Bradford ST, Buske FA, Saar K, Hübner N, Brändli AW, Schedl
A. 2014. WT1 controls antagonistic FGF and BMP-pSMAD pathways in early renal progenitors. Nature
Communications 5:4444. DOI: https://doi.org/10.1038/ncomms5444, PMID: 25031030
O’Brien LL. 2019. Nephron progenitor cell commitment: striking the right balance. Seminars in Cell &
Developmental Biology 91:94–103. DOI: https://doi.org/10.1016/j.semcdb.2018.07.017, PMID: 30030141
Ohkawara B, Glinka A, Niehrs C. 2011. Rspo3 binds syndecan 4 and induces wnt/PCP signaling via clathrin-
mediated endocytosis to promote morphogenesis. Developmental Cell 20:303–314. DOI: https://doi.org/10.
1016/j.devcel.2011.01.006, PMID: 21397842
Okada Y, Sim X, Go MJ, Wu JY, Gu D, Takeuchi F, Takahashi A, Maeda S, Tsunoda T, Chen P, Lim SC, Wong TY,
Liu J, Young TL, Aung T, Seielstad M, Teo YY, Kim YJ, Lee JY, Han BG, et al. 2012. Meta-analysis identifies
multiple loci associated with kidney function-related traits in east Asian populations. Nature Genetics 44:904–
909. DOI: https://doi.org/10.1038/ng.2352, PMID: 22797727
Osman WM, Jelinek HF, Tay GK, Khandoker AH, Khalaf K, Almahmeed W, Hassan MH, Alsafar HS. 2018. Clinical
and genetic associations of renal function and diabetic kidney disease in the United Arab Emirates: a cross-
sectional study. BMJ Open 8:e020759. DOI: https://doi.org/10.1136/bmjopen-2017-020759, PMID: 30552240
Oxburgh L. 2018. Kidney Nephron Determination. Annual Review of Cell and Developmental Biology 34:427–
450. DOI: https://doi.org/10.1146/annurev-cellbio-100616-060647
Park JS, Valerius MT, McMahon AP. 2007. Wnt/beta-catenin signaling regulates nephron induction during mouse
kidney development. Development 134:2533–2539. DOI: https://doi.org/10.1242/dev.006155, PMID: 175377
89
Park JS, Ma W, O’Brien LL, Chung E, Guo JJ, Cheng JG, Valerius MT, McMahon JA, Wong WH, McMahon AP.
2012. Six2 and wnt regulate self-renewal and commitment of nephron progenitors through shared gene
regulatory networks. Developmental Cell 23:637–651. DOI: https://doi.org/10.1016/j.devcel.2012.07.008,
PMID: 22902740
Vidal et al. eLife 2020;9:e53895. DOI: https://doi.org/10.7554/eLife.53895 19 of 20You can also read