Influence of Novel Airframe Technologies on the Feasibility of Fully-Electric Regional Aviation
←
→
Page content transcription
If your browser does not render page correctly, please read the page content below
aerospace
Article
Influence of Novel Airframe Technologies on the Feasibility of
Fully-Electric Regional Aviation
Stanislav Karpuk * and Ali Elham *

                                          Institute of Aircraft Design and Lightweight Structures, Technical University Braunschweig,
                                          38106 Braunschweig, Germany
                                          * Correspondence: s.karpuk@tu-braunschweig.de (S.K.); a.elham@tu-braunschweig.de (A.E.)

                                          Abstract: The feasibility of regional electric aviation to reduce environmental impact highly depends
                                          on technological advancements of energy storage techniques, available battery energy density, and
                                          high-power electric motor technologies. However, novel airframe technologies also strongly affect
                                          the feasibility of a regional electric aircraft. In this paper, the influence of novel technologies on
                                          the feasibility of regional electric aviation was investigated. Three game-changing technologies
                                          were applied to a novel all-electric regional aircraft: active flow control, active load alleviation,
                                          and novel materials and structure concepts. Initial conceptual design and mission analysis of the
                                          aircraft was performed using the aircraft design framework SUAVE, and the sensitivity of the most
                                          important technologies on the aircraft characteristics and performance were studied. Obtained results
                                          were compared against a reference ATR-72 aircraft. Results showed that an all-electric aircraft with
                                          airframe technologies might be designed with the maximum take-off weight increase of 50% starting
                                          from the battery pack energy density of 700 Wh/kg. The overall emission level of an all-electric
                                          aircraft with novel technologies is reduced by 81% compared to the ATR-72. On the other hand,

                                          novel technologies do not contribute to the reduction in Direct Operating Costs (DOC) starting from
                                   700 Wh/kg if compared to an all-electric aircraft without technologies. An increase in DOC ranges
Citation: Karpuk, S.; Elham, A.           from 43% to 30% depending on the battery energy density which creates a significant market obstacle
Influence of Novel Airframe               for such type of airplanes. In addition, the aircraft shows high levels of energy consumption which
Technologies on the Feasibility of        concerns its energy efficiency. Finally, the sensitivity of DOC to novel technologies and sensitivities
Fully-Electric Regional Aviation.         of aircraft characteristics to each technology were assessed.
Aerospace 2021, 8, 163. https://
doi.org/10.3390/aerospace8060163          Keywords: aircraft design; airframe technologies; aircraft sizing; all-electric aircraft; multi-disciplinary
                                          design optimization
Academic Editor: Dieter Scholz

Received: 3 May 2021
Accepted: 4 June 2021
                                          1. Introduction
Published: 10 June 2021
                                               Significant climate changes and potential environmental impact due to increased
Publisher’s Note: MDPI stays neutral
                                          transportation in the near future have motivated many industries to focus on reducing CO2
with regard to jurisdictional claims in
                                          and NOx emissions. As a major transportation method, the aviation industry also follows
published maps and institutional affil-   the trend to reduce the emission of new generations of aircraft. Improvements in airframe
iations.                                  and engine technologies increase aircraft efficiency and reduce their emission. However,
                                          a potential increase in air transportation may still lead to an increase in overall CO2 and
                                          NOx emissions. Under Flightpath 2050 [1], The European Commission has set a future
                                          challenge for the new generation of aircraft to reduce their total emission. Figure 1 shows
Copyright: © 2021 by the authors.
                                          three schematic trends: if no advancements in aircraft technologies are present, if currently
Licensee MDPI, Basel, Switzerland.
                                          feasible technology advancements are achieved, and if novel technologies are introduced.
This article is an open access article
                                          This challenge leads to developing alternative environmentally-friendly energy sources
distributed under the terms and           as one of the main solutions for environmental impact reduction. Aircraft electrification
conditions of the Creative Commons        has become one of the most popular approaches to reduce aircraft emissions. Today, many
Attribution (CC BY) license (https://     companies work in various directions to make electric flights available: improve battery
creativecommons.org/licenses/by/          energy capacity, modify and develop new propulsion systems, and introduce new aircraft
4.0/).                                    configurations more applicable for future electrification.

Aerospace 2021, 8, 163. https://doi.org/10.3390/aerospace8060163                                          https://www.mdpi.com/journal/aerospace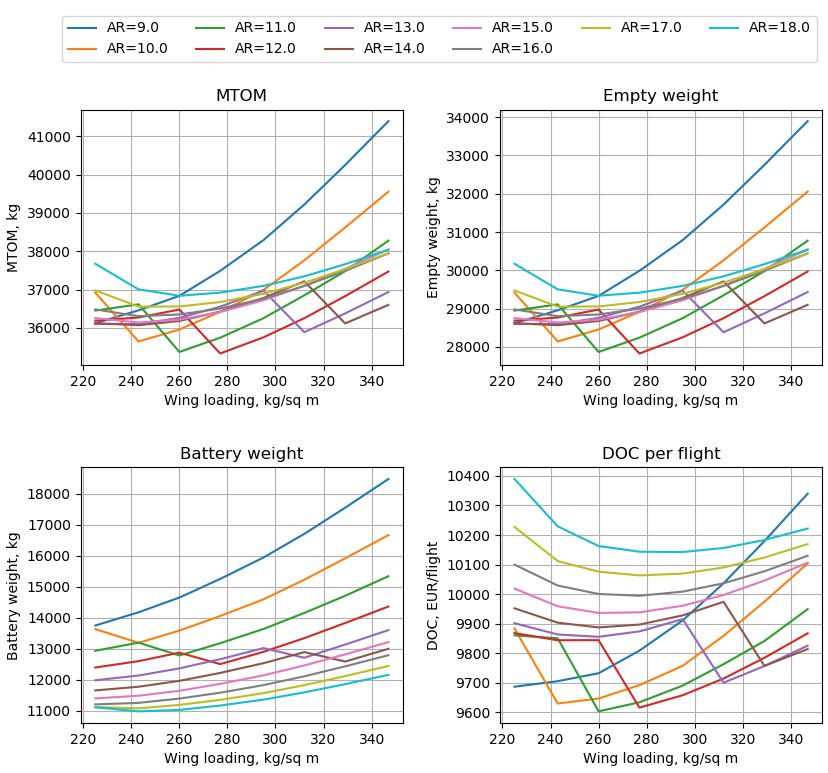
Aerospace 2021, 8, 163                                                                                                2 of 29

                         Figure 1. Forecast of CO2 emission impact due to increased transportation and emission reduction
                         goals [1].

                               At the moment, research is highly focused on hybrid- and all-electric propulsion
                         systems and aircraft configurations to reduce the environmental impact produced by
                         aircraft. Friedrich introduced a simulation technique for a single-seat hybrid-electric
                         demonstrator, designed the aircraft, and performed a scaling analysis to determine a large
                         fuel savings impact for the small- and mid-scale sector of aircraft [2]. Hamilton investigated
                         the effect of hybrid-electric aircraft from the operational perspective to reach an optimal
                         aircraft operation with battery energy density constraints [3]. A lot of work is also dedicated
                         to the introduction of distributed electric propulsion (DEP) energy networks and aircraft
                         concepts featuring DEP. Kim summarized major contributions towards the development of
                         DEP aircraft and relative technologies [4]. Finger focused on sizing methodologies, and
                         aircraft design of future general aviation aircraft that could be not only hybrid-electric
                         but also fully electric [5–7]. De Vries also developed initial sizing methodologies for
                         hybrid-electric aircraft for conceptual aircraft design but introduced effects of DEP at early
                         conceptual design stages [8,9]. Pornet also introduced a sizing methodology for hybrid-
                         electric aircraft and compared performance between the conventional reference aircraft and
                         its hybrid version [10]. Sgueglia introduced an MDO framework for hybrid-electric aircraft
                         with coupled derivatives and performed various optimization analyses to demonstrate
                         the capabilities of the framework [11]. The work of Hepperle [12] addressed the potentials
                         and limitations of all-electric aircraft specifically and introduced aircraft modifications that
                         could potentially improve the aircraft performance at given battery energy densities. The
                         ultimate goal of aircraft electrification is to achieve a fully-electric flight at adequate aircraft
                         weight characteristics to maximize the emission reduction at the aircraft level. However,
                         the availability of all-electric aircraft is limited to the General Aviation sector due to low
                         battery energy density compared to the Jet-A fuel and relatively low maximum power
                         capabilities of modern electric motors. Multiple all-electric concepts have already been
                         introduced or are being developed at the moment. From existing airplanes, Pipistrel has
                         already certified a twin-seat all-electric aircraft that has a maximum speed of 185 km/h
                         and a maximum range of 139 km [13]. Bye Aerospace is currently performing flight tests
                         on a one-seat general aviation aircraft that will be certified under the FAR Part 23 category.
                         The eFlyer has a maximum cruise speed of 250 km/h and endurance of three hours [14]. In
                         2016, Siemens tested an all-electric energy network by retrofitting the Extra 300 aerobatic
                         aircraft and set two world records [15]. The Equation Aircraft has also demonstrated an
                         all-electric twin-seat amphibious aircraft with the empennage-mounted engine that can fly
                         up to 240 km/h and up to 200 km [16] Airbus has also developed several versions of an
                         experimental all-electric E-fan aircraft to test the capabilities of an all-electric aircraft [17].
                         The E-Fan concept had multiple versions, from a technology demonstrator to a production
                         variant. MagniX has introduced an all-electric propulsion system and first retrofitted De
                         Havilland Beaver and then 208B Cessna Grand Caravan. The electrified Caravan became
                         the largest all-electric airplane until today [18]. It must be noted that the list of existing
                         all-electric aircraft companies is incomplete and more companies exist and are at different
                         design stages.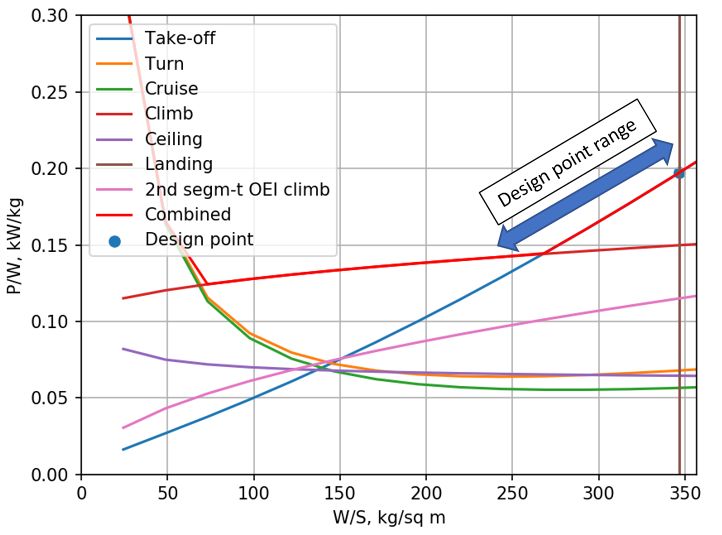
Aerospace 2021, 8, 163                                                                                            3 of 29

                               To achieve all-electric regional aviation faster, not only the energy source and propul-
                         sion system technologies must be improved, but also advanced airframe technologies
                         need to be considered. Such novel technologies may significantly increase the aircraft
                         performance characteristics and overall efficiency that will enable earlier integration of all-
                         electric commercial aircraft into the market before. Liu introduced initial estimations of the
                         impact of novel technologies for a range of aircraft from the short-range to the long-range
                         [19]. Results showed that novel airframe technologies may significantly improve aircraft
                         energy efficiency.
                               Under the Excellence Cluster Se2 A (Sustainable and Energy Efficient Aviation), three
                         energy-efficient aircraft are to be designed to cover the majority of commercial aircraft
                         operations. Figure 2 shows three sample new energy-efficient airplanes: a short-range
                         propeller aircraft that shall be applicable to the ATR-72, the medium-range aircraft having
                         similar mission requirements to the Airbus A320, and the long-range aircraft to cover
                         ranges similar to the Boeing B777.

                         Figure 2. A family of energy-efficient aircraft under the Se2 A cluster.

                              The initial cluster requirement for the short-range aircraft was to investigate the
                         feasibility and availability of an all-electric short-range aircraft if novel airframe and
                         propulsion technologies are introduced. A few novel technologies have been considered
                         for the design of future regional aircraft. Hybrid laminar flow control (HLFC), load
                         alleviation, and advanced materials and structure concepts. In addition, high-temperature
                         superconducting motors and high-energy capacity batteries have been considered for the
                         present research. An aircraft with similar top-level requirements as ATR-72 is designed
                         considering the mentioned technologies and a battery-based full electric propulsion system.
                              The present work is divided into multiple sections. Section 2 describes novel tech-
                         nologies implemented in the new short-range aircraft. Section 3 describes methodologies,
                         models, assumptions, and software used to perform novel technology assessments to de-
                         sign the aircraft. Section 4 describes the aircraft’s top-level requirements (TLRs). Section 5
                         describes the aircraft concept selection and its initial sizing. Section 6 presents multidis-
                         ciplinary design optimization studies of the SE2 A aircraft to refine the design and make
                         important design decisions. Finally, Section 7 assesses the influence of novel technologies
                         on aircraft availability and the strength of each technology impact.

                         2. Novel Airframe and Propulsion Technologies
                         2.1. Hybrid Laminar Flow Control
                              The generation and extension of laminar flow over the aircraft surface significantly
                         affect the overall aircraft drag, reducing aircraft weights, fuel burn, and operating costs.
                         Preliminary estimations of an aircraft that features extended laminar flow along the wing,
                         empennage, and fuselage demonstrated significant reduction (up to 50%) in overall drag
                         and proved the importance of laminar flow control (LFC) [20]. Figure 3 shows the effects of
                         the new wing design featuring the LFC and compares overall drag to the reference aircraft.
                              However, natural laminar flow (NLF) is limited along the shape, so to extend it even
                         more, hybrid laminar flow control (HLFC) is required: the laminar boundary layer is not
                         only extended using NLF design but also using the active suction technology. In this
                         technology, the air is sucked from the aircraft’s outer surface to delay the transition of
                         the boundary layer and enable substantially higher percent laminarization compared to
                         conventional surfaces. The skin of each aircraft component is split into two segments: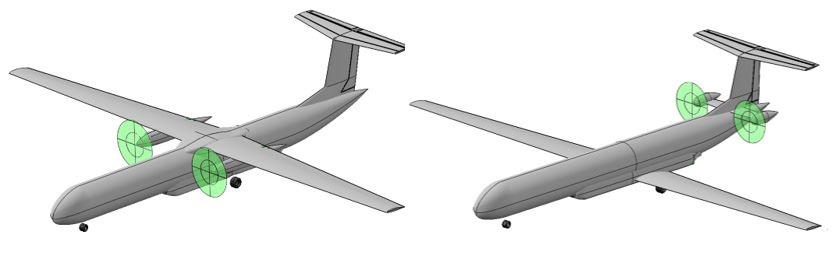
Aerospace 2021, 8, 163                                                                                         4 of 29

                         a porous sheet and an inner sheet that supports the outer sheet. The inner sheet has
                         orifices that suck the air from the boundary layer and delay transition. In each chamber,
                         an individual pressure is adjusted by the throttle orifices, so that the pressure difference
                         between the outside and the chamber delivers the locally desired amount of mass flow
                         through the surface. Figure 4 shows a schematic image of the skin layout and the HLFC
                         system for a wing section. The applied technology in this project is based on [20,21], which
                         describes numerical approaches with active laminar flow control and also describes current
                         progress in this technology.

                         Figure 3. Effect of laminar flow control on overall aircraft drag [20].

                            Figure 4. Schematic views of the active suction system [20].

                         2.2. Load Alleviation
                               Load alleviation introduces various techniques to reduce the bending moment expe-
                         rienced by the aircraft and that have a passive or active nature. Reduction of maximum
                         bending moment enables the design of lighter wings for lower limit load factors, which
                         will improve aircraft fuel efficiency.
                               Passive load alleviation solutions consider nonlinear stiffness material design [22],
                         viscoelastic damping design [23], new structural concepts [24,25], and local morphing
                         structures [22]. Nonlinear stiffness materials may improve the load distribution on the
                         wing under low load cases (0.5 g to 1.5 g) and improve performance efficiency at those load
                         cases. Finally, both aeroelastic tailoring and local morphing structures aim to extend the
                         aeroelastic design space. Morphing is considered into two scenarios: deliberate structural
                         non-linearity that affects the wing deformation and reduces effective angle-of-attack of the
                         wing section under the load and change in airfoil shape to achieve load reduction [22].
                               The wing active load alleviation uses different types of flow control over the wing to
                         achieve a more favorable wing load distribution and reduce the wing bending moment.
                         Previously, researchers have approached the design of active load alleviation systems
                         in different ways. Rossow et al. [26] investigated the feasibility of an aircraft featuring
                         load alleviation technologies; Sun et al. [27] looked at active load alleviation from the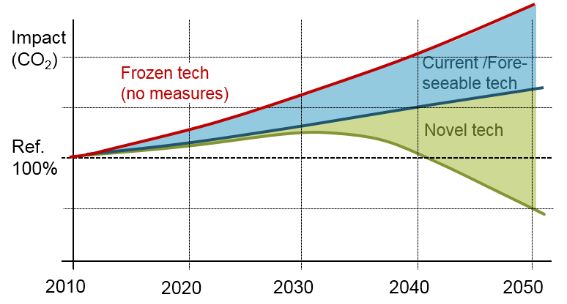
Aerospace 2021, 8, 163                                                                                            5 of 29

                         control system perspective; and Zing et al. [28] demonstrated the experimental results
                         of the high aspect-ratio wing wind-tunnel test with active load alleviation while using
                         piezoelectric control. The work of Fezans et al. focused on novel sensors and control
                         systems technologies to enable rapid and robust active load alleviation [29–32]. Finally,
                         active load alleviation could also be reached by fluidic or micro-mechanical flow actuators
                         that change the load distribution along the wing and reduce the bending moment [33].

                         2.3. New Materials and Structure Concepts
                              Novel structural concepts and materials are being developed to improve the aircraft
                         structure in terms of stiffness and weight. Bishara et al. [34] describe advanced structural
                         design with the integration of active flow control, which is directly applicable to the
                         presented research. Under the excellence cluster, the reduction in the airframe weight
                         is assumed to be reached by application of CFRP thin ply laminates. In addition, new
                         structural concepts must be applied to satisfy HLFC requirements [22].

                         2.4. High-Power Superconducting Motors
                              One of the major problems in hybrid- and all-electric commercial aircraft deals with
                         limitations of maximum available electric motor power. The motor resistance increases
                         rapidly with the increase of its power, which rapidly diminishes the engine efficiency. One
                         solution to preserve the motor efficiency and even increase it is to use superconducting
                         motors. Such motors can be synchronous, trapped flux, and fully superconducting. They
                         may also operate at low and high temperatures. To maintain required temperatures inside
                         the motor, a cryogenic cooling system is required. High-temperature superconducting
                         (HTS) motors can achieve high power-to-weight ratios with high power densities without
                         major weight losses compared to low-temperature superconducting motors. Ref. [35]
                         provides a descriptive survey of HTS motors and their future trends. For the present
                         research, a high-temperature, fully superconducting motor was considered.

                         2.5. High Energy Capacity Batteries
                               Currently, the gravimetric energy density of modern batteries generally does not
                         exceed 300 Wh/kg [36]. Such energy densities may be suitable for ultra-light or limited
                         general aviation all-electric aircraft. However, they are insufficient to enable not only
                         all-electric aircraft of the size of ATR-42 and larger, but even the hybrid-electric version of
                         such aircraft is infeasible at the moment since the energy capacities are around 50 times
                         less compared to kerosene-based fuels. On the other hand, the research of high-capacity
                         batteries makes progress. The latest laboratory research demonstrated battery energy
                         capacities of 800 Wh/kg on the cell level and 500 Wh/kg on the pack level for military
                         applications [36]. In addition, the National Academy of Sciences predicts battery pack
                         energy density to achieve 400–600 Wh/kg at Technology Readiness Level (TRL) 6 in the next
                         20 years (roughly, by 2035) and be commercially available in 30 years [37]. If the prediction
                         becomes real and the linear trend remains, then batteries may reach TRL 6 with energy
                         densities of 550–850 Wh/kg and be commercially available by 2060. To investigate potential
                         scenarios for the far future and examine battery energy impact on the aircraft feasibility, it
                         is assumed that the pack energy densities may range between 500 and 1100 Wh/kg.

                         3. Implementation of Novel Technologies in Aircraft Analysis and Design
                         3.1. Initial Aircraft Sizing
                               The conceptual design was performed using various tools. OpenVSP [38] and CATIA
                         were used for the aircraft geometric modeling, and SUAVE [39] was used for more defined
                         aircraft sizing, performance, and mission analysis. To have more capabilities from the air-
                         craft performance analysis standpoint, SUAVE was extended to have classical performance
                         analysis methods used in [40–43].
                               The aircraft sizing within SUAVE is performed iteratively. First, initial geometric
                         specifications based on TRLs and any available information are input into the SUAVE.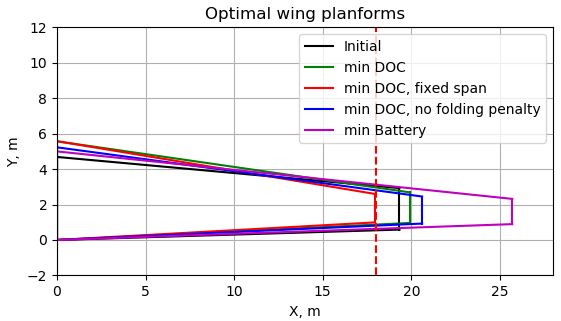
Aerospace 2021, 8, 163                                                                                        6 of 29

                         The information includes the initial wing planform, its section properties, flaps charac-
                         teristics, empennage and fuselage geometries, the definition of the propulsion system,
                         and all required components such as batteries, gearboxes, power management systems
                         (PMAD), cables, etc. Finally, initial guesses of aircraft weight are input. Then, the first
                         iteration of constraint analysis using equations provided by Gudmundsson [41] is per-
                         formed. The constraint diagram block includes rapid estimation methods for gas-turbine,
                         piston, and electric aircraft power lapse with altitude and has options to either estimate
                         required aerodynamic properties for the constraint diagram or have them as fixed in-
                         puts based on historical trends. Based on the design point selection, the wing loading
                         and power-to-weight ratio are used to run the SUAVE mission analyses to estimate the
                         aircraft performance and its required weight. Then, obtained maximum take-off mass
                         (MTOM) is compared to the initial guess and updated if the tolerance is not reached. In
                         addition, parameters such as the minimum drag coefficient (CDmin ), Oswald efficiency
                         (e), and maximum lift coefficient (CLmax ) for clean and flapped configurations are input
                         into the constraint diagram again to update all constraint curves and run the loop again.
                         When the tolerance is reached, the program moves to the aircraft performance block to
                         obtain performance plots for the given aircraft. Particular care was taken to size the wing
                         flaps to meet take-off and landing field length requirements. Methods of Torenbeek [42]
                         and Roskam [43] were implemented within SUAVE to analyze various types of leading-
                         and trailing-edge devices. The empennage sizing within SUAVE is based on the fixed tail
                         volume ratio and then updated and corrected separately based on the desired CG envelope.
                         Performance analyses within SUAVE included take-off, all engines operative (AEO), and
                         one engine inoperative (OEI) climb, cruise, descent, and landing. Figure 5 shows the sizing
                         process within SUAVE.

                         Figure 5. Initial aircraft sizing framework using SUAVE.

                         3.2. Energy Network
                             In the SUAVE analysis framework, a propeller electric energy network with HTS
                         motors was implemented. Figure 6 shows the all-electric energy network layout.
Aerospace 2021, 8, 163 7 of 29
Figure 6. Battery-electric energy network layout.
Propeller modeling was performed using the cubic spline method described by Gud-
mundsson [41]. Propeller thrust can be described with a cubic spline based on design
operating conditions. The thrust is defined by:
T = AV 3 + BV 2 + CV + D (1)
where A, B, C, D are the coefficients required to fit the curve accurately. To obtain those
coefficients, a system of four equations is established. The first equation is the equation
for the static thrust. The second equation is derived for the cruise speed and the desired
propeller efficiency. The third equation is the derivative of the curve at the cruise speed,
which is equal to zero. Finally, the last equation is derived for the desired maximum cruise
speed. The final system of equations for the thrust as a function of cruise speed becomes:
0 0 0 1 A Tstatic
V3 VC2
VC 1 B TC
C (2)
3V 2 2VC 1 C
0 −η prop Psh /VC2
C
3
VHC VH2 VH 1 D
TH
Solving Equation (2), a general thrust expression is found, which then is used to find
the propulsive efficiency of the propeller. Then, knowing efficiencies of components of
the energy network shown in Figure 6, the total power at the battery is found to be used
during the SUAVE mission analysis.
The propeller was sized using a combination of propeller diameter trends provided
by [44] and the sizing method described by Torenbeek [42] where the required propeller
RPM depends on the tip Mach number was used to estimate the maximum propeller RPM.
The assumption of the battery gravimetric energy density remains one of the most
influential assumptions for aircraft design. Since the availability of a full-electric regional
aircraft is challenging to achieve, an optimistic scenario of the energy density at TRL 6
was assumed. This way, if the aircraft is feasible, the task will be to investigate more
realistic bounds of minimum energy densities. Otherwise, the availability of the all-electric
airplane is highly unlikely. Consequently, the average optimistic pack energy density (ω B )
of 700 Wh/kg was assumed. To ensure safe battery operation, the state-of-charge of 20%
was assumed.
High-temperature, fully superconducting motors were used for the airplane since
the required power frequently reaches the order of Megawatts. All superconducting
components also have cooling systems to enable desired operating temperatures. The
cooling system power loss was estimated using the survey provided in [45] and assuming
the Carnot efficiency (e) of 30%. Table 1 summarizes all assumptions considered for the
gas turbine engine and an electric propulsion network.Aerospace 2021, 8, 163 8 of 29
Table 1. SE2 A SR energy network assumptions.
Component Parameter Value Reference
High-power electric motor Efficiency η M = 99.5% [35]
Motor cryo-cooling system Power loss Ploss = 10 kW [45]
Carnot efficiency e = 0.3 [45]
PMAD Efficiency ηPMAD = 99% [46]
Wh
Battery Energy density ω B = 700 [35]
kg
kg
Electric cables Density ρcable = 3.9 [46]
m
Efficiency ηcable = 99.5% [46]
3.3. Weights Estimation
Weights estimation analysis was performed using the FLOPS [47] method programmed
within SUAVE. To improve the accuracy of high aspect ratio wing weight estimation,
FLOPS was coupled with the physics-based wing weight estimation tool EMWET [48]. The
EMWET analysis was performed for a metal wing structure and was corrected by a factor
based on the composite wing technology level. Loads used for the EMWET weight estima-
tion were obtained within SUAVE using coupling with AVL [49] Vortex-Lattice method
software. In the case where the aircraft wing span reaches Class-C airport regulation limits,
an additional weight penalty function due to the wing folding was introduced, so the air-
craft can maneuver at the airport and maximize its flight efficiency. The estimation method
is based on [50] and accounts for the weight of the insert, the folding mechanism, and the
pin to fix the wing. The wing weight corrected by the weight of the folding mechanism is
defined by
f old non f old pin
mw = mw (1 + m̄ins mech
f old + m̄ f old + m̄ f old ) (3)
f old non f old
where m̄w is the mass of the wing with the folding mechanism, m̄w is the mass ratio
without the folding mechanism, m̄ins is the mass ratio of the folding insert, m̄mech
f old is the
pin
mass ratio of the folding mechanism inside the insert, and m̄ f old is the mass ratio of the
folding pin. The insert mass ratio was defined based on the curve-fitting of three separate
formulations available from [50]: folding at 32%, 48%, and 64% of the span
2
0.24(m̄ PWS − 0.924) − 0.007,
32% span
m̄ins
f old = 0.45(m̄ PWS − 0.916)2 − 0.02, 48% span (4)
0.84(m̄ PWS − 0.98)2 − 0.107, 64% span
where m̄ PWS is the mass ratio of the section outboard of the folding pivot point defined by
(Cy + Ct )(0.5b − y)(ty Cy + tt Ct )
m̄ PWS (y) = (5)
(Cr + Ct )(tr Cr + tt Ct )b
where C is the chord length, b is the wing span, t is the wing thickness-to-chord ratio, and y
is the spanwise location of the folding insert. Subscripts r, t, and y correspond to the wing
root, tip, and the folding insert.
Finally, folding mechanism and pin masses are defined by
m̄mech 2
f old = −3.76( m̄ PWS − 0.2) + 0.08 (6)
m̄mech 2
pin = −0.6( m̄ PWS − 0.2) + 0.02 (7)
Figure 7 shows the wing weight penalty as a function of the wing joint location along
the semi-span.Aerospace 2021, 8, 163 9 of 29
Figure 7. Wing folding penalty as a function of the wing semi-span [50].
HTS motor weight estimation was based on relations defined by Stuckl [35] and
account for both the motor and the cooling system weight. The motor power-to-weight
ratio is defined by
P
= 2.63( PMot )0.277 (8)
W
where PMot is the motor power in kW and the power-to-weight ratio P/W is defined
in kW/kg.
The cryogenic cooling system weight is defined by
mcooling = 27.5Ploss · e−1.225(log10 ( Ploss )) (9)
where Ploss is the cooling system input power loss in kW and mcooling is the cooling system
weight in kg.
Propeller weight was estimated using a relation described in [51] where the propeller
weight depends on the number of blades, the activity factor, the motor power, propeller
maximum RPM, and its material. A composite propeller with six blades was considered
for the present design.
The gearbox weight was estimated using relations provided by [52] and is defined by
0.76
Pgearbox 0.13
· RPMmotor
m gearbox = K (10)
RPM0.89
propeller
where P is the power at the gearbox, K is the gearbox technology factor equal to 26 for
future gearboxes, RPMmotor is the motor power assumed at 4800 RPM, the RPMmotor , and
the m gearbox is the gearbox mass in kg.
3.4. Novel Airframe Technologies Assumptions
At the conceptual design stage, novel technologies have been integrated into the
design process in terms of coefficients and correction factors. Laminar flow control is
estimated by modifying the flow transition location along the wing profile. The desired
goal within the SE2 A for the flow transition is set to 70% for the wing if no disturbances
such as the propeller wake or the location of other components is present. Otherwise,
specific transition assumptions are prescribed. Wing folding also affects the application
of the HLFC. The folding location has four general locations. If the wingspan is less than
36 m (Class C airport limitation), then no folding is applied, and the wing features theAerospace 2021, 8, 163 10 of 29
HLFC along the complete span. If the wingspan is longer than 36 m but not longer than
110% of the Part C requirement, then the tip folding is applied, the wing has HLFC until
the wing folding location, and the folding tips feature natural laminar flow (NLF). If the
folding location occurs at any position which splits the aileron, then the folding position is
automatically moved to the position where the flap ends and the aileron start, so the aileron
design is significantly simplified. The portion of the wing after the folding joint does not
feature HLFC and only has NLF. Finally, if the wingspan is such that the aileron can be
located at the folding portion of the wing, the folding joint is fixed to 18 m, and the flap
is limited to the outboard position of 18 m. HLFC is also applied before the folding joint.
The transition location of the NLF portion of the wing is assumed at 45% [53]. The fuselage
laminar flow shall be preserved until the wing-body fairing, which is specified based on
the wing position, which is determined by the center-of-gravity (CG) envelope and the
empennage characteristics. The active load alleviation effect is estimated by reducing the
aircraft limit load factor from the required 2.5 [54] to 2.0. For the load alleviation, it is also
assumed that regulations of CS-25 may allow lower limit loads if sufficient maturity of the
technology is reached. Advanced structure configurations and material effects are assumed
to reduce the empty weight by 19% compared to the metal structure.
4. Top-Level Requirements of the SE2 A SR Aircraft
Top-level requirements have been set to match the reference ATR-72 aircraft. Table 2
shows the summary of the SE2 A SR TLRs.
Table 2. SE2 A SR top-level requirements.
Requirement Value Units
Design range for maximum payload 926 km
Maximum payload 7500 kg
Cruise Mach number 0.42
Service ceiling 7620 m
Take-off field length 1400 m
Landing distance 1100 m
Certification CS-25 [54]
Figure 8 shows a mission profile considered for the design. The mission includes
the main flight segment, where the airplane cruises at 7300 m, and the required reserve
segment which consists of the divert segment and the 30 min hold. In addition, 5% battery
energy contingency was assumed after the reserve mission.
Figure 8. SE2 A SR mission profile.Aerospace 2021, 8, 163 11 of 29
5. Initial Aircraft Design
Concept Selection
In this work, two concepts were considered for the initial aircraft design. The first
concept was the top-wing conventional configuration with wing-mounted engines. The
battery was split between the fuselage belly and the engine pylons: one segment was
located before the landing gear, and the other one was located after the gear. The battery
distribution was based on the CG envelope to satisfy all possible passenger loading cases.
Battery modules feature a ’quick-swap mechanism, so a mechanic can switch batteries
between the flights using a mechanism similar to a high loader. The second configuration
is the low-wing configuration with aft-mounted engines. Such configuration, unlike the
first configuration, has a fully clear wing which enables laminar flow control along the
entire wingspan. Engines are mounted at the aft of the fuselage. The vertical location of
the engines approached their maximum to minimize the adverse effect from the wing at
high angles of attack. Batteries also feature the ’quick-swap mechanism. Figure 9 shows
the described configurations schematically modeled in OpenVSP.
Figure 9. OpenVSP models of two configurations for the selection.
Each configuration has its assumptions, features, and limitations. Assumptions are
based on research goals of the SE2 A research groups that focus on the research and devel-
opment of each technology separately. The first concept has a limited range of laminar flow
along the wingspan. The region which is subjected to the propeller wash is assumed to
have a fully turbulent flow. The remaining wing portion has 70% laminar flow due to the
application of the HLFC. To have a favorable CG envelope, the location of the wing was set
to 43% of the fuselage length. The second concept has limited laminar flow control before
the landing gear at the wing pressure side. The remaining pressure side and the suction
side are 70% laminar. It was also possible to shift the wing further aft to 53% of the fuselage
length so that extra 10% could be laminarized compared to the conventional configuration.
Comparison among the concepts was performed using the sizing methodology as
was described in Section 2. Due to the presence of various novel technologies and, as a
consequence, increased aircraft development, and operating costs, the concept selection
was based on the magnitude of Direct Operating Costs (DOC). DOC was calculated using
the method presented in [55] where the DOC is divided into energy, maintenance, capital,
crew costs, and fees. 2121 flight cycles per year were assumed for both aircraft. For the
battery pack, 2000 cycles were assumed. The electricity price was taken from [56] for the
year 2050 and is equal to 0.118 EUR/kWh that year. The airframe price was assumed similar
to the ATR-72 [55] and is equal to 1595 EUR/kg. The remaining parameters for all required
cost components were taken from [55]. A major concern is related to the modification of
DOC due to novel technologies. It is unknown how much the DOC will increase due to an
early stage of all technologies presented in this work. However, the complexity related to
the introduction of the porous skin, the suction system and its structure, which is subject
to maintenance complexities, NLF front portion, integration of various load alleviation
technologies, and the structure to support the wing laminarization and load alleviationAerospace 2021, 8, 163 12 of 29
will increase maintenance costs by an order of magnitude. As an optimistic assumption, a
scaling factor of 2 was used for the maintenance DOC gain. After the introduction of the
maintenance DOC gain, the total DOC formulation becomes
DOCTotal = DOCEnergy + DOCCrew + k g DOC Ma + DOCCap + DOCFees (11)
where DOCEnergy are costs of energy, DOCCrew are crew costs, DOC Ma are maintenance
costs, DOCCap are capital costs, DOCFees are costs of fees, and k g is the maintenance cost
gain factor. Finally, all costs were calculated in 2020 EUR.
Due to the presence of an all-electric propulsion system, a conventional assumption of
the best design point at the lowest power-to-weight ratio may not hold, as was previously
shown by Finger [5] where the best design points were sensitive to the energy type of
networks and could show points of minimum take-off or fuel weight at wing loadings larger
than the one with minimum power-to-weight ratio. To ensure that a good initial guess for
each concept is selected, an aspect ratio and wing loading trade study were performed
using the initial sizing procedure described in Section 3. The procedure has multiple steps.
First, the initial aircraft sizing is performed to find the design point corresponding to the
maximum possible wing loading. Assuming that the selection of an arbitrary design point
will not change the constraint diagram significantly, a set of sample wing loadings ranging
from 60% of the maximum wing loading to the maximum possible wing loading were
selected. Figure 10 shows the sweep of possible design points along the constraint diagram
boundary. The aircraft is then sized for each selected wing loading using SUAVE, and the
DOC is estimated. This approach is repeated for a selected set of aspect ratios to determine
the combination of the wing loading and aspect ratio that may give the lowest desired
aircraft characteristics important for the decision making. A sample set of weights and
DOC for a low-wing configuration as a function of the wing loading and the AR is shown
in Figure 11. Multiple trends can be observed from the Figure 11. First of all, the battery
weight generally reduces with the AR, while the operating empty weight (OEW) and
maximum take-off mass (MTOM) trends do not follow such trends. Moreover, DOC and
weights show discontinuities for some aspect ratios and particular wing loadings. Points
of the curve discontinuity correspond to the folding penalty, which is introduced starting
from a specific wing loading.
Figure 10. A sample constraint diagram and the range of possible design point or the initial sizing.
Table 3 shows the summary of the high-wing and the low-wing configurations that
have the lowest DOC. Based on the given results, the high-wing configuration has larger
weights due to more battery required to complete the mission with less laminar flow.Aerospace 2021, 8, 163 13 of 29
Consequently, the airframe with less possible drag is more favorable. Consequently, the
low-wing configuration is more efficient from the performance standpoint.
Table 3. Comparison between the high-wing and low-wing concepts.
Parameter High wing Low wing Units
MTOM (W0 ) 38,238 35,369 kg
OEW (We ) 30,738 27,869 kg
Battery weight (Wb ) 14,629 12,783 kg
AR 11.0 11.0 -
Wing span (b) 40.2 38.7 m
taper ratio (λ) 0.5 0.5 -
Wing area (Sw ) 147.0 136.0 m2
Power-to-weight
0.144 0.146 kW/kg
ratio (P/W)
DOC 10,074 9603 EUR/flight
Figure 11. Sensitivity of weights and DOC to the aircraft AR and wing loading for the low-wing configuration (pack energy
density of 700 Wh/kg).
Due to an unconventional configuration of the low-wing configuration, a concern
related to the aircraft stability and control may occur. Coe [57] has investigated the sta-
bility and control characteristics of an aircraft with aft-mounted propeller engines. Re-
sults demonstrated a reduction of longitudinal stability for this configuration due to the
propeller–pylon interaction. However, minor destabilization can be compensated by aAerospace 2021, 8, 163 14 of 29
minor increase of the horizontal tail. Lateral stability is not significantly affected by aft-
mounted propellers and may improve directional control due to the boundary layer control
introduced by the propeller slipstream. Riley [58] also provided a detailed description
of business/commuter turboprop aircraft configuration with aft engines. Although the
configuration is a twin-pusher, general information about handling qualities during the ap-
proach can be extracted. Generally, the aircraft can have acceptable handling qualities and
can be certified, but more care to achieve proper dynamic stability and desired handling
characteristics may be required.
6. SE2 A SR Design Refinement Using MDO
To refine the initial design, a set of multi-disciplinary design optimizations (MDO)
were performed. The main goal of the refinement is to reduce the aircraft DOC further.
Multiple cases were considered. The first MDO featured all prescribed assumptions. The
second MDO assumed that no folding penalty is present to estimate the influence of the
folding penalty of the aircraft. This case is used only as a comparative study to investigate
the folding mechanism effect on the optimal design. Finally, a special case of battery weight
minimization was calculated to investigate the reduction of the battery weight and increase
of DOC with respect to the aircraft optimized for the DOC. This case also directly influences
the aircraft CO2 emission.
Production of electricity also involves emission CO2 and other greenhouse gases,
since modern electricity generation is not a product of renewable energy sources. A major
portion of electricity today comes from fossil fuels, consequently, an all-electric aircraft
cannot be considered as a zero-emission one. Since the goal of the study was to design and
assess the aircraft from the environmental perspective as well as performance and costs,
proper metrics of preliminary emission rates must be introduced. Scholz describes a rapid
and useful procedure of comparing kerosene-based and battery-electric emission [59,60] to
calculate the CO2 emission including additional factors for each energy source. For aircraft
operating with kerosine-based fuels, additional chemicals other than CO2 contribute to the
emission level. In addition, the altitude at which the emission happens plays an important
role. To account for secondary effects, the equivalent CO2 emission level per flight can be
described by
mCO2,eq = ( EICO2 f km + EINOx f km CFmidpoint,NOx + CFmidpoint,AIC ) Rkm (12)
where f km is the fuel flow per km, EI is the emission index for each species, CF is the
characterization factor, and Rkm is the range in km. The EICO2 is equal to 3.16 kg CO2
per kg fuel [60]. The EINOx is found using the Boeing Method 2 [61] where the index is
computed based on existing data from the ICAO Engine Emissions Databank [62] and is
corrected with respect to the flight altitude. Characterization factors are calculated by
SGTPO3s,100 SGTPO3L,100 SGTPCH4,100
CFmidpoint,NOx = s + s + s (13)
SGTPCO2,100 O3s SGTPCO2,100 O3L SGTPCO2,100 CH4
SGTPcontrails,100 SGTPcirrus,100
CFmidpoint,AIC = s + s (14)
SGTPCO2,100 contrails SGTPCO2,100 cirrus
where SGTP is the sustained global temperature potential, summarized in Table 4 and s is
the forcing factor which depends on the altitude and is shown in Figure 12 for each species.
The formulation given in Equation (12) was used for each flight segment of the
reference ATR-72 and then added to obtain the total mission equivalent emission level.
Segments with variable altitude such as climb and descent used average values of forcing
factors s and emission index EINOx . If the value of the forcing factor was for the altitude
lower than the available data, the minimum value represented in the Figure 12 was used.Aerospace 2021, 8, 163 15 of 29
Table 4. SGTP values [60].
Species SGTPi,100 Units
CO2 3.58 × 10⁻¹⁴ K/kgCO2
O3s 7.79 × 10⁻¹² K/kgNOx
O3L −9.14 × 10⁻¹³ K/kgNOx
CH4 −3.90 × 10⁻¹² K/kgNOx
Contrails 1.37 × 10⁻¹³ K/km
Cirrus 4.12 × 10⁻¹³ K/km
Figure 12. Forcing factor as a function of altitude [60].
Battery emission, on the other hand, depends on the amount of energy used to charge
them. The emission then depends on the share of fossil fuel to non-fossil fuel sources
participating in the electricity production and the primary efficiency factor—the factor
which describes the ratio between the energy required to produce electricity and the final
output energy amount. Including all factors described above, the equivalent emission per
flight becomes
k m C
mCO2,eq = EICO2 x f f PEF bat bat (15)
ηcharge C Jet− A
where x f f is the fossil fuel share ratio equal to 0.39 according to the forecast of 2050 [63],
k PEF is the primary efficiency factor assumed equal to 2 [59], ηcharge is the battery charging
efficiency equal to 0.9 [59], and Cbat and C Jet− A are battery and Jet-A fuel energy densities,
respectively. From Equation (15), the CO2 emission is directly proportional to the battery
mass, so the optimization for the minimum battery weight corresponds to the minimum
emission case.
All problems have similar design variables and constraints, as shown in Table 5.
Due to the application of new airframe technologies, requirements for the sea-level climb,
take-off, and landing are more significant compared to cruise and OEI requirements, asAerospace 2021, 8, 163 16 of 29
shown in Figure 10. Such behavior occurs due to a substantial reduction of the cruise
drag, which strongly diminishes the required cruise power. Consequently, optimization
problem constraints can be limited to these three main performance metrics. Additional
geometric constraints of 51.8 m wingspan (similar to the wingspan of the NASA N+3
strut-braced wing concept [64]) and the wingtip of no larger than 1.4 m were introduced
to limit further increase in the wing slenderness. Table 5 describes the formulation of the
optimization problem. There, Cr and Ct are the wing root and tip chords, respectively, t/c
is the wing thickness, and ηmax is the maximum throttle during the flight. To perform the
MDO, SUAVE was coupled with MATLAB, and the Genetic algorithm was used to find
optimal solutions.
Table 5. SE2 A SR aircraft optimization problem definition.
Lower Upper Units
minimize 1. DOC
2. Wb
wrt AR 8.00 16.00
λ 0.25 0.75
Cr 3.00 7.00 m
t/c |root 12.00 18.00 %
t/c |tip 12.00 18.00 %
P/W 0.05 0.30
subject to Take-off field length (TOFL) 1400.0 m
P/W − P/W |climb 0.0
Landing field length (LFL) 1100.0 m
ηmax 1.0
b 50.0 m
Ct 1.4 m
To account for the constraints, the penalty function similar to the one defined in [65]
was used. The penalty function is defined by
γ
y
f p = µ(y − yc ) (16)
yc
where y is the design variable, yc is the design variable constraint, µ is the unit step function
equal to zero for y ≤ yc , and γ = 3. With the introduction of the penalty function, the
objective function becomes
N
f = f + ∑ fp (17)
i =1
where N is the total number of design variables. Sixty species per generation were set
to have sufficient population size without major accuracy losses. Take-off and landing
constraints were calculated using physics-based time-dependent performance formulations
presented in [41]. The climb power-to-weight ratio constraint was calculated using a similar
formulation used for the constraint analysis.
Figure 13 shows the aircraft planforms for each optimization problem and Table 6
summarizes important properties of each optimized configuration. Limiting constraints
for each optimization were similar to the constraint diagram: the solution was trying to
minimize the power-to-weight ratio which reached the constraint limit of either the climb
or the take-off. In addition, the top-of-climb throttle constraint was an additional constraint
which dominated the others.Aerospace 2021, 8, 163 17 of 29
Figure 13. Wing planforms for selected optimization problems.
Table 6. Comparison between optimized concepts.
DOC- DOC-Optimal Battery-
Initial
Parameter Optimal Design (No Optimal ATR-72 Units
Design
Design Folding) Design
W0 35,369 34,441 33,649 34,783 23,000 kg
We 27,869 26,941 26,149 27,283 13,311 kg
Wb 12,783 12,262 11,527 10,379 - kg
W f uel,mission - - - - 1913 kg
AR 11.0 10.86 12.23 16.0 12.0 -
b 38.7 39.6 41.3 51.7 27.05 m
λ 0.5 0.31 0.3 0.285 0.55 -
Cr 4.68 5.83 5.23 5.00 2.74 m
Swing 136.0 145.4 139.6 165.5 61.0 m2
t/c |root 0.18 0.18 0.18 0.17 0.18 -
t/c |tip 0.13 0.13 0.13 0.12 0.13 -
P/W 0.143 0.125 0.13 0.11 0.16 kW/kg
EUR/
DOC 9603 9479 9397 9838 6740
flight
mCO2 2045 1961 1844 1660 11,838 kg
TOFL 1338 1381 1368 1360 1367 m
LFL 1025 972 985 934 1207 m
As shown in Table 6, the optimized aircraft with all imposed assumptions reduced all
weights, slightly reduced the aspect ratio, increased the wingspan, reduced the taper ratio,
and reduced the aircraft power-to-weight ratio. Minor differences in the field performance
occurred. The DOC for the optimized aircraft reduced by 124 EUR/flight. In addition, the
difference in emission between the initial and DOC-optimized designs is equal to 84 kg
per flight which is not substantial. If the folding penalty is removed, then the wing has
more freedom to increase its span and aspect ratio due to the absence of the folding weight
penalty. The optimized aspect ratio increased by 1.23, the wingspan increased by 2.6 m
compared to the initial design. However, the power-to-weight ratio increased due to a
reduced wing planform area. All weights were further reduced compared to the aircraft
configuration with the folding mechanism. The DOC was reduced by 206 EUR/flight
compared to the initial configuration, which indicates a relatively strong effect of the
folding mechanism on the aircraft. The emission level reduced by 201 kg compared to
the initial design which is more substantial. Comparing the DOC optimal solutions with
and without the folding mechanism, it becomes evident that wing folding affects the final
design and cannot be neglected. If the battery minimization strategy is considered, then
the wing planform approaches design limits. Due to a stronger reduction of the batteryAerospace 2021, 8, 163 18 of 29
weight compared to the increase in the wing weight, minor reductions of the MTOM and
empty weights are observed. Finally, DOC increased by 235 EUR/flight compared to
the initial design or by 359 EUR/flight compared to the optimized configuration. The
battery weight reduced by 2404 kg and 1883 kg compared to the initial and DOC-optimized
aircraft, respectively. The emission level, however, reduced by 385 kg compared to the
initial configuration. In addition, the wing span of the aircraft increases to 51.7 m and the
folding portion from each side of the wing becomes 7.85 m. Such a large folding portion
may affect the operational convenience at the airport and will make the aircraft taller when
the wings are folded. That may create additional difficulties related to the aircraft storage.
If DOC and emission levels are compared against the reference aircraft, the increase
in DOC demonstrates a substantial increase compared to the reference ATR-72. The most
cost-effective aircraft version has 41% increase in DOC which is a substantial cost growth
from the market standpoint. The DOC for the battery-optimal configuration increases by
46%. On the other hand, if emission levels are compared, the most DOC-efficient version
has a reduction in equivalent CO2 emission of 83% compared to the ATR-72, and the
battery-optimal configuration has 86% emission reduction. From the comparison, the
emission level of the all-electric aircraft reduces substantially, but such reduction of the
emission comes at a significant cost increase. Moreover, DOC shows more sensitivity with
respect to the configuration compared to the emission level. To minimize costs as much as
possible, the DOC-optimal configuration was selected for future analyses.
Observing the wingspan deviations from the Part C airport requirements of 36 m,
aircraft configurations minimized for DOC did not show major increases in wingspans.
Consequently, it is possible to design an aircraft that will have no folding mechanism and
will not have a significant DOC penalty so that the wing design complexity may be reduced
substantially. An additional MDO study with a fixed wingspan constraint was performed
to investigate the sensitivity of DOC to the configuration with a fixed span of 36 m. Table 7
demonstrates a comparison between the initial design, the optimal design without the span
constraint, the optimal aircraft with a constrained span, and a reference ATR-72 to compare
optimal models to their reference.
Table 7. Comparison between optimized concepts with and without the wing span constraint.
DOC- DOC-Optimal
Initial
Parameter Optimal Design ATR-72 Units
Design
Design (Fixed Span)
W0 35,369 34,441 35,745 23,000 kg
We 27,869 26,941 28,244 13,311 kg
Wb 12,783 12,262 13,861 - kg
W f uel,mission - - - 1913 kg
AR 11.0 10.86 10.0 12.0 -
b 38.7 39.6 36.0 27.05 m
λ 0.5 0.31 0.29 0.55 -
Cr 4.68 5.83 5.57 2.74 m
Swing 136.0 145.4 129.3 61.0 m2
t/c |root 0.18 0.18 0.18 0.18 -
t/c |tip 0.13 0.13 0.12 0.13 -
P/W 0.143 0.125 0.14 0.16 kW/kg
DOC 9603 9479 9573 6740 EUR/flight
mCO2 2045 1961 2217 11,838 kg
TOFL 1338 1381 1392 1367 m
LFL 1025 972 1027 1207 m
The aircraft with a fixed span has a higher weight due to a restricted planform and, as
a consequence, more battery is required for the mission. The battery weight increased by
1600 kg compared to the optimal design without the span constraint. The power-to-weightAerospace 2021, 8, 163 19 of 29
ratio also increased to satisfy the take-off requirement. However, the wing area is reduced,
so it is less expensive to increase the motor power than increase the wing area. The DOC
increased by 94 EUR/flight, which is not a large increase. At the same time, the wing has
no folding mechanism and is easier to design and maintain. However, the emission level
increases by a relatively small margin compared to the initial DOC-optimal configuration.
At this moment, the configuration without folding is selected as the final decision.
The geometric summary of the selected aircraft is shown in Table 8. Single-slotted
Fowler flaps were used for this aircraft. The empennage was initially sized within SUAVE
using a constant tail volume fraction similar to existing aircraft in the class using data
from Raymer [40] and then refined using AVL to ensure sufficient stability and trim during
critical flight cases for the complete CG envelope obtained separately. The vertical tail was
sized based both on the one-engine inoperative (OEI) case and the lateral stability condition
of CNβ > 0.01573 [66]. The propeller was positioned vertically as far as possible to reduce
the possibility of the wing wake impinging on the propeller blades. The angle between the
wing trailing edge and the propeller’s lowest blade tip is equal to 14 deg, which should be
sufficient for the majority of operational cases. The propeller features six blades and has a
diameter of 3.56 m.
Table 8. Geometric properties of the SE2 A SR aircraft.
Parameter Wing Horizontal Tail Vertical Tail Units
AR 10.0 5.07 1.25 -
b 36.0 10.0 3.5 m
λ 0.29 0.55 0.8 -
ΛC/4 0.0 15.0 26.0 deg
Γ 4.0 0.0 0.0 deg
Cr 5.58 2.5 3.13 m
S plan f orm 129.3 17.8 9.80 m2
t/c |root 0.18 0.10 0.10 -
t/c |tip 0.12 0.10 0.10 -
Flap span ratio 0.6 - - -
Flap chord ratio 0.2 - - -
Aileron span ratio 0.25 - - -
Aileron chord ratio 0.20 - - -
Elevator span ratio - 1.0 - -
Elevator chord ratio - 0.25 - -
Rudder span ratio - 1.0 0.8 -
Rudder chord ratio - 0.25 0.25 -
VHT - 0.59 - -
VVT - - 0.024 -
The CG envelope was created using available information about the stick-fixed and
stick-free neutral points, payload clouds, and multiple baggage arrangement cases. The
CG-range is equal to 21.5% mean aerodynamic chord (MAC) starting at 12% and ending at
33.5% MAC.
Figure 14 shows the SE2 A SR payload-range diagram compared to the reference ATR-
72 [67]. In addition, the obtained payload-range diagram was validated using a Breguet
range equation for an all-electric aircraft defined by
1 L mbat
R= ηtotal Cbat (18)
g D m0
where m0 is the maximum take-off mass, g is the gravitational acceleration, and L/D is the
cruise lift-to-drag ratio.Aerospace 2021, 8, 163 20 of 29
Figure 14. Payload-range diagrams for the SE2 A SR and ATR-72.
For the range analysis, multiple options were considered. The first option is the case
when the battery mass remains constant, independent of changes in payload weight. This
way, the battery volume is fixed and equal to the one used for the maximum passenger case.
The second option is to have sufficient battery volume to replace missing passengers with
an extra battery. Such an option is more problematic to achieve due to the increased battery
size and additional growth of the already large belly fairing but is useful to analyze for the
range sensitivity analysis. The comparison shows that although the SE2 A SR satisfies the
harmonic range requirement, which matches the ATR-72, the ferry range is significantly
limited due to the battery energy density and weight limitations. The absence of the
payload extends the aircraft range to 1415 km, which is substantially smaller than the ATR-
72 with its ferry range of 3380 km. Introduction of more battery which replaces the payload
increases the ferry range until 1870 km, which is 455 km longer than the fixed battery
weight case. However, this ferry range still does not introduce major range improvements
compared to the ATR-72. Comparison between the SUAVE payload-range and Breguet
payload-range diagrams show a difference of both harmonic and ferry ranges of 100 km.
Such tendency happens due to the higher fidelity of SUAVE which includes all mission
segments and calculates incremental energy consumption and aerodynamic characteristics,
unlike the Breguet equation which considers a constant lift-to-drag ratio. On the other
hand, minor deviations are expected and are satisfactory for the selected analysis.
To summarize current design outcomes, an all-electric SE2 A SR aircraft is capable of
achieving the harmonic range similar to the reference ATR-72 and satisfies all prescribed
TLRs. Moreover, its emission level is reduced by 81% compared to the reference aircraft.
On the other hand, the ferry range of the all-electric aircraft is limited to no more than
1870 km compared to 3380 km for the ATR-72 and has a 42% increase in DOC with respect
to the reference which will create substantial market application problems for this type
of airplane.
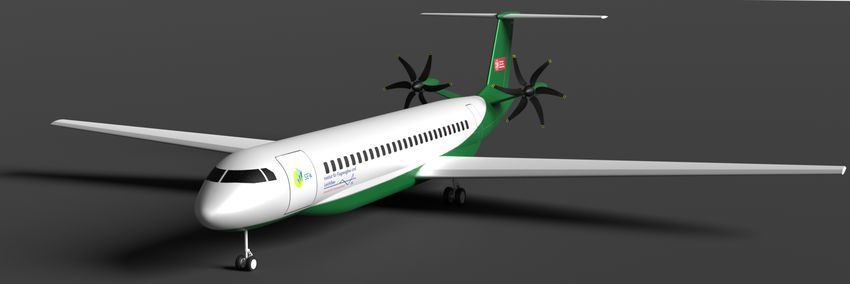
Figure 15 shows a rendered image of the optimized SE2 A SR aircraft.Aerospace 2021, 8, 163 21 of 29
Figure 15. SE2 A SR aircraft geometry.
7. Sensitivity Analysis of the Aircraft Characteristics to Technology Advancements
After performing a conceptual design of a regional all-electric aircraft and analyzing
obtained results, several questions still remain: What is the influence of novel technologies
on the aircraft configuration? How much do the deviations of novel technology assump-
tions affect the airplane configuration? What technologies affect the aircraft geometry
the most?
A sensitivity analysis of the SE2 A SR aircraft to the battery energy density with the
absence of all novel airframe technologies was performed to determine what potential
energy density could make all-electric regional aviation possible and how the aircraft
characteristics are affected. The aircraft without novel airframe technologies assumed 5%
laminar flow on the wing and empennage, 5% laminar flow for the fuselage, a limit load
factor of 2.5, and no weight reduction due to composite materials. Technologies related
to the propulsion system such as HTS motors remained since their absence immediately
leads to the aircraft’s infeasibility due to the Megawatt-level power required per motor.
Furthermore, the performance characteristics of the aircraft without novel technologies
were compared against the case if all technologies met the desired requirements. The
sizing procedure for all configurations was performed for a similar mission profile and
used similar methods to those described in Section 3 to ensure the satisfaction of all TLRs.
Similar constraints based on TLRs were also implemented. As for the initial sizing, wing
loading and aspect ratio sensitivity analyses were performed to determine a sweep of all
possible aircraft that satisfy TLRs. For all possible configurations, the ones with minimum
DOC were selected for each selected battery energy density. Finally, all characteristics
were compared against the reference ATR-72 aircraft. Figure 16 shows the effect of battery
energy density on the aircraft gross weight.
Results demonstrate that the absence of novel technologies significantly limits the
feasibility of all-electric regional aviation unless substantially higher battery cell energy
densities are reached. For instance, if the aircraft with all available airframe technologies
can reach the MTOM of 40,000 kg at the pack energy density of 600 Wh/kg, the aircraft
without airframe technologies can reach similar weights at 900 Wh/kg. In addition,
weights approach an asymptotic value at high energy densities, so the effect of airframe
technologies becomes more significant for high energy densities. For instance, if the pack
energy density reaches 1000 Wh/kg, then the aircraft MTOW with all technologies becomes
slightly less than 30,000 kg while similar weight is achieved by the aircraft without airframe
technologies only at 1500 Wh/kg.You can also read