Lifting the veil on arid-to-hyperarid Antarctic soil microbiomes: a tale of two oases
←
→
Page content transcription
If your browser does not render page correctly, please read the page content below
Zhang et al. Microbiome       (2020) 8:37
https://doi.org/10.1186/s40168-020-00809-w

 RESEARCH                                                                                                                                           Open Access

Lifting the veil on arid-to-hyperarid
Antarctic soil microbiomes: a tale of two
oases
Eden Zhang1, Loïc M. Thibaut1, Aleks Terauds2, Mark Raven3, Mark M. Tanaka1, Josie van Dorst1, Sin Yin Wong1,
Sally Crane1 and Belinda C. Ferrari1*

  Abstract
  Background: Resident soil microbiota play key roles in sustaining the core ecosystem processes of terrestrial
  Antarctica, often involving unique taxa with novel functional traits. However, the full scope of biodiversity and the
  niche-neutral processes underlying these communities remain unclear. In this study, we combine multivariate
  analyses, co-occurrence networks and fitted species abundance distributions on an extensive set of bacterial, micro-
  eukaryote and archaeal amplicon sequencing data to unravel soil microbiome patterns of nine sites across two east
  Antarctic regions, the Vestfold Hills and Windmill Islands. To our knowledge, this is the first microbial biodiversity
  report on the hyperarid Vestfold Hills soil environment.
  Results: Our findings reveal distinct regional differences in phylogenetic composition, abundance and richness
  amongst microbial taxa. Actinobacteria dominated soils in both regions, yet Bacteroidetes were more abundant in
  the Vestfold Hills compared to the Windmill Islands, which contained a high abundance of novel phyla. However,
  intra-region comparisons demonstrate greater homogeneity of soil microbial communities and measured environmental
  parameters between sites at the Vestfold Hills. Community richness is largely driven by a variable suite of parameters but
  robust associations between co-existing members highlight potential interactions and sharing of niche space by diverse
  taxa from all three microbial domains of life examined. Overall, non-neutral processes appear to structure the polar soil
  microbiomes studied here, with niche partitioning being particularly strong for bacterial communities at the Windmill
  Islands. Eukaryotic and archaeal communities reveal weaker niche-driven signatures accompanied by multimodality,
  suggesting the emergence of neutrality.
  Conclusion: We provide new information on assemblage patterns, environmental drivers and non-random occurrences
  for Antarctic soil microbiomes, particularly the Vestfold Hills, where basic diversity, ecology and life history strategies of
  resident microbiota are largely unknown. Greater understanding of these basic ecological concepts is a pivotal step
  towards effective conservation management.
  Keywords: Antarctica, Soil Microbiome, Bacteria, Eukarya, Archaea, Conservation Ecology

* Correspondence: b.ferrari@unsw.edu.au
1
 School of Biotechnology and Biomolecular Sciences, University of New
South Wales, Sydney 2052, Australia
Full list of author information is available at the end of the article

                                        © The Author(s). 2020 Open Access This article is licensed under a Creative Commons Attribution 4.0 International License,
                                        which permits use, sharing, adaptation, distribution and reproduction in any medium or format, as long as you give
                                        appropriate credit to the original author(s) and the source, provide a link to the Creative Commons licence, and indicate if
                                        changes were made. The images or other third party material in this article are included in the article's Creative Commons
                                        licence, unless indicated otherwise in a credit line to the material. If material is not included in the article's Creative Commons
                                        licence and your intended use is not permitted by statutory regulation or exceeds the permitted use, you will need to obtain
                                        permission directly from the copyright holder. To view a copy of this licence, visit http://creativecommons.org/licenses/by/4.0/.
                                        The Creative Commons Public Domain Dedication waiver (http://creativecommons.org/publicdomain/zero/1.0/) applies to the
                                        data made available in this article, unless otherwise stated in a credit line to the data.
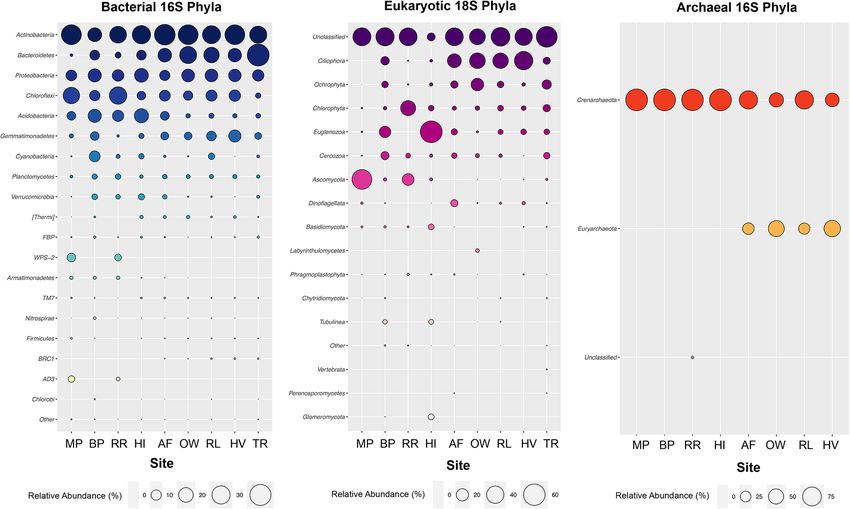
Zhang et al. Microbiome   (2020) 8:37                                                                            Page 2 of 12

Background                                                       shifts, which is an important step towards effectively
East Antarctica constitutes up to two-thirds of the con-         managing microbial biodiversity loss and conserving the
tinent and is home to some of the oldest, coldest and            key ecosystem functions offered by these assemblages
most oligotrophic soils on Earth [1]. Apart from ice-free        [23–28, 29].
patches along the coast, most of the sector is covered by          Projected twenty-first century expansion of ice-free
a thick layer of permafrost [2]. The Windmill Islands, an        habitats across eastern Antarctica means that tools for
ice-free region situated near the Australian Casey re-           rapidly assessing soil ecosystem health, such as species
search station, consists of five major peninsulas and a          abundance distributions (SADs), are gradually becoming
number of rock-strewn islands. Approximately 100 km              more important in managing microbial biodiversity loss,
to the north lie the Vestfold Hills, a large expanse of          especially in regions where survey data is scarce [2, 30].
low-lying hilly country deeply indented by sea-inlets and        In this study, we compiled bacterial 16S (n = 837),
lakes [3, 4]. These diverse edaphic habitats are a legacy        eukaryotic 18S (n = 162) and archaeal 16S (n = 144)
of age-involving varied geological and glaciological pro-        rRNA gene amplicon sequencing data from soil samples
cesses [5]. Soil microbial diversity and functional ecology      spanning nine east Antarctic sites between the Vestfold
of the hyperarid Vestfold Hills is virtually unexplored,         Hills (n = 5) and Windmill Islands (n = 4). By taking a
whilst previous studies at the Windmill Islands have dis-        multivariate, exploratory network and modelling ap-
closed a relatively high proportion of novel bacterial           proach using fitted SADs we aim to (1) elucidate the
phyla [6]. However, knowledge on archaea and micro-              previously unknown soil microbial biodiversity of the
eukaryotes is still lacking [7]. This is in stark contrast to    Vestfold Hills, (2) determine the driving processes (i.e.
other regions such as the McMurdo Dry Valleys and                niche or neutral) underlying the microbial communities
Antarctic Peninsula [6, 8, 9]. In our understanding of           of east Antarctica and (3) clarify whether they differ be-
soil microbiota across the different bioregions of terres-       tween the Vestfold Hills and Windmill Islands.
trial Antarctica, addressing these deficiencies will not
only improve our understanding of Antarctic microbial            Results
biogeography but also guide future conservation plan-            Amplicon sequencing yield and coverage
ning strategies [10].                                            We recovered a total of 60,495,244 high-quality bacterial
   Climate and soil age abiotic factors such as pH, mois-        16S rRNA gene sequences, which clustered into 36,251
ture and nutrient content exert a strong influence on Ant-       operational taxonomic units (OTUs) at 97% identity cut-
arctic species distribution and life histories [1, 7, 11–13].    off. Our micro-eukaryotic and archaeal runs yielded a
These properties may co-vary with local lithology, ped-          total of 1,299,519 18S rRNA and 13,373,072 16S rRNA
ology and aspect—leading to a myriad of edaphic niches           gene sequences after read-quality filtering, which re-
[14]. In turn, their microbial occupants are key to estab-       spectively clustered at 97% into 1511 and 589 OTUs
lishing and maintaining core ecosystem processes, occa-          (Table S1). Subsampled rarefaction curves of the pooled
sionally involving unique taxa with novel functional traits      data revealed that bacterial, micro-eukaryotic and ar-
such as unique biosurfactants and trace gas assimilation as      chaeal richness generally approached an asymptote at
a novel mode of primary production [5, 15]. It is thereby a      each site (Fig. S1).
widely accepted concept that the capacity of microbes to
access and utilise resources, as well as tolerate different      Comparative biodiversity of the east Antarctic polar soil
levels of stress, contributes significantly to the structuring   microbiome
of microbiota dwelling within these oligotrophic soils.          At 97% identity, OTUs were classified into 63 bacterial,
   However, our ability to unravel these basic ecological        27 micro-eukaryotic and three archaeal phyla. Distribu-
concepts in cold regions has been limited by the small           tions of phylum abundances for all three domains were
number and depth of studies available [16]. Moreover,            uneven, as the majority of sites were dominated by a
the majority of relevant studies have largely been fo-           handful of taxa (Fig. 1). Soil bacterial communities pre-
cused on bacteria only. Few micro-eukaryotic and                 dominantly consisted of the metabolically diverse Acti-
archaeal-specific surveys have been reported on terres-          nobacteria (30.5%) and Proteobacteria (14.6%).
trial Antarctic environments and so their ecological roles       Bacteroidetes (24.9%) and Gemmatimonadetes (8.0%)
remain elusive [17–19]. All three microbial domains are          were more prevalent at the Vestfold Hills, whereas
likely to be responsible for the sustainability and evolu-       Chloroflexi (17.8%) and Acidobacteria (13.6%) were
tion of the polar soil microbiome but contemporary dy-           present in greater relative abundances throughout the
namics will inevitably change due to the climate-driven          Windmill Islands. With the exception of Rookery Lake
emergence of new ice-free areas [2, 20–22]. As conse-            (RL = 4.2%), Browning Peninsula (BP = 10.9%) and Her-
quence, further clarification on their underlying drivers        ring Island (HI = 3.1 %), Cyanobacteria abundance was
will establish a baseline from which to gauge ecological         relatively low across all sites. At Mitchell Peninsula (MP)
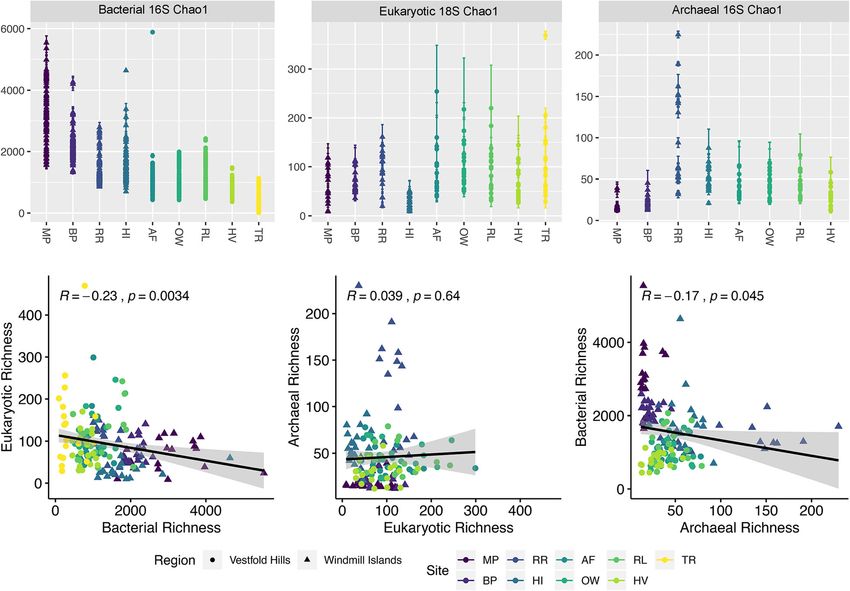
Zhang et al. Microbiome       (2020) 8:37                                                                                             Page 3 of 12

 Fig. 1 Bubble plots of relative abundance (%) per site of phyla-level composition of OTUs (97% cut-off), based on bacterial 16S (mean = 490 bp),
 eukaryotic 18S (mean = 125 bp) and archaeal 16S (mean = 470 bp) SSU rRNA sequences representing > 0.001% of all normalised OTUs sorted by
 decreasing relative abundance. Greatest phylogenetic diversity is exhibited by bacteria followed by eukarya then archaea. Across all three
 domains, distribution of phyla abundances is generally uneven as a handful of taxa tend to dominate but strong compositional differences are
 apparent between the Windmill Islands and Vestfold Hills regions

and Robinson Ridge (RR), rare candidate phyla namely                       the total relative abundance for eukaryotic soil communi-
Candidatus Eremiobacteraeota (WPS-2) and Candidatus                        ties, except at MP and RR.
Dormibacteraeota (AD3) were present in higher relative                        Archaeal diversity was predominantly distributed
abundances (> 4.6%) compared to the other sites. At                        within the Crenarchaeota phylum (84.5%), whilst mem-
lower taxonomic levels, bacterial sequences classified                     bers of Euryarchaeota (15.0%) were mainly exclusive to
into 169 classes, with members largely belonging to Fla-                   the Vestfold Hills (Fig. 1). In addition, an unusually high
vobacteria (10.9%) and Actinobacteria (9.0%), followed                     proportion (2.3%) of unclassified archaea was observed
by similar proportions (6.0%) of Thermoleophilia, Chlor-                   at RR. At lower taxonomic levels, archaeal sequences
acidobacteria, Gamma-proteobacteria and Alpha-proteo-                      belonged to six main families; Nitrososphaeraceae
bacteria (Fig. S2).                                                        (84.5%) and Halobacteriaceae (15.0%), followed by un-
   For micro-eukaryotes, 18S rRNA gene sequences fell                      classified, SAGMA-X, Cenarchaeaceae and TMEG fam-
into six supergroups consisting of unclassified (46.9%),                   ilies, collectively accounting for 0.01% of total relative
Chromalveolata (Ciliophora and Dinoflagellata = 20.6%),                    archaeal abundance.
Archaeplastida (Ochrophyta, Chlorophyta and Phragmo-
plastophyta = 17.8%), Excavata (Euglenozoa = 5.4%),                        Domain-level biotic interactions
Opisthokonta (Ascomycota, Basidiomycota, Labyrinthulo-                     Non-metric multidimensional scaling (NMDS) ordin-
mycetes, Chytridiomycota, Vertebrata, Peronosporomycetes                   ation of microbial OTU communities and corresponding
and Glomermomycota = 4.6%) and Amoebozoa (Cercozoa                         environmental metadata revealed that soils were con-
and Tublinea = 4.4%) (Fig. 1). Unclassified micro-eukarya                  served within sites and broadly by geographic region
remained dominant across all taxonomic levels, with mod-                   (Fig. S3). Apart from TR, sites at the Vestfold Hills were
erately higher relative abundance observed throughout the                  more homogenous in terms of community composition
Vestfold Hills (61.3%), compared with the Windmill Island                  and measured soil parameters. Bacterial communities
sites (38.8%), particularly at The Ridge (TR). Fungal diver-               exhibited the greatest overall species richness based on
sity contributed to a relatively small proportion (10.5%) of               Chao1 estimates (Fig. 2), particularly at the Windmill
Zhang et al. Microbiome       (2020) 8:37                                                                                               Page 4 of 12

 Fig. 2 Chao1 richness estimates and correlations between our soil bacterial, eukaryotic and archaeal communities coloured by site. Polar soil
 bacterial communities demonstrated highest overall species richness estimates, particularly throughout the Windmill Islands region. Significant (P
 < 0.05) negative correlations were detected between estimated bacterial species richness against the other two microbial domains

Islands (mean = 2270.1). In contrast, greater eukaryotic                    (clustering coefficient = 0.4) and 201 edges (average no.
richness was observed throughout the Vestfold Hills                         of neighbours = 6.9, characteristic path length = 2.4)
(mean = 132.3). Archaeal communities exhibited the                          across three connected components with a network
lowest overall species richness (mean = 50.9), with RR                      diameter of six edges (Table S2).
being an exception (mean = 106.4). Pearson’s correla-                          Notable associations within the Vestfold Hills network
tions between domain-level pooled Chao1 richness esti-                      included positive associations between Saccharibacteria
mates revealed weak but significant (α = 0.05) negative                     (TM7), a parasitic bacterium, and Actinobacteria. Also
relationships of bacterial communities against both                         noted was the lack of co-occurrent micro-eukaryotic
micro-eukaryotic (R = − 0.23, P = 0.0034) and archaeal                      species. Crenarchaeota were more strongly embedded
(R = − 0.17, P = 0.045) communities. However, no sig-                       within the Windmill Islands network suggesting different
nificant correlation was found between micro-eukaryotic                     life histories or niche preferences between the two
and archaeal richness (R = 0.039, P = 0.64).                                regions. Similarly, rare candidate bacterial phyla Candi-
  Domain-level networks displaying the co-occurrence                        datus Eremiobacteraeota (WPS-2) and Candidatus Dor-
of OTUs provided new insights on the potential sharing                      mibacteraeota (AD3) only formed strong visible
of niche spaces or interactions between co-existing taxa,                   associations in this region. The astounding taxonomic
many of which are understudied (Fig. 3). The resulting                      diversity of Actinobacteria (Fig. 1 and S2) was reflected
network for the Vestfold Hills consisted of 43 nodes                        in their ability to occupy multiple niches and form the
(clustering coefficient = 0.2) and 44 edges (average no.                    majority of connections to co-existing species, essentially
of neighbours = 2.0, characteristic path length = 3.2)                      moulding the microbial backbone of these Antarctic des-
across eight connected components with a network                            ert soils. Overall, microorganisms present within the soil
diameter of seven edges (Table S2). Whereas, the result-                    microbial networks tended to co-occur more than ex-
ing Windmill Islands network consisted of 58 nodes                          pected by chance (P < 0.001).
Zhang et al. Microbiome      (2020) 8:37   Page 5 of 12

 Fig. 3 (See legend on next page.)
Zhang et al. Microbiome          (2020) 8:37                                                                                               Page 6 of 12

    (See figure on previous page.)
    Fig. 3 Domain-level OTU co-occurrence network of significant (P < 0.001) and strongly correlated (MIC > 0.8) OTU pairs between the Windmill
    Islands and Vestfold Hills. Nodes (circles = bacteria, triangles = eukarya, diamonds = archaea) and edges represent individual OTUs and their
    correlations respectively. Node size is proportional to their degree of connectivity and edge colour is based on linearity (green/solid = positive,
    purple/dashed = negative). Our soil microbial networks are comprised of moderately connected OTUs, more so at the Windmill Islands, structured
    amongst multiple components and forming a clustered topology. All three domains of life are present within the Windmill Islands network, most
    notably Crenarchaeota being strongly embedded and Actinobacteria forming the microbial backbone within these desert soils. In contrast, eukarya
    are absent from the Vestfold Hills network, suggesting possible competition

Correlations between estimated richness and selected                           (NB) distributions (wPLN>wNB), likely attributable to
environmental predictor variables                                              these Antarctic communities being substantially more
Generalised additive models (GAMs) were fitted to test the                     heterogenous than expected (Fig. 4, Table 2). As is the
ability of a range of soil parameters to explain the variation                 norm in ecological communities, all distributions were
in Chao1 richness of bacteria, eukarya and archaea. A step-                    characterised by highly right-skewed patterns, emphasis-
wise model selection process (based on the lowest AIC)                         ing the disparity between rare and common species. Bac-
was used to identify the ‘best model’ and thereby identify                     terial communities lacked an internal mode and
the key environmental drivers. These models explained a                        demonstrated a better PLN-fit (Table 2), particularly at
moderate percentage of variation (45.0–66.8%) in richness                      the Windmill Islands (wPLN = 1.000, wNB = < 0.001). By
for all three microbial communities at the regional scale                      contrast, eukaryotic and archaeal communities demon-
(Table 1 and Fig. S4, S5,S6). For bacteria, there was a posi-                  strated multimodal distributions accompanied by rela-
tive relationship between Chao1 richness and copper (Cu),                      tively weaker PLN-fits, particularly for eukaryotic
aluminium (Al, Al2O3) and gravel content (Fig. S4). Micro-                     communities at the Vestfold Hills (wPLN = < 0.001, wNB
eukaryote richness exhibited negative relationships with dry                   = 1.000). These trends remained consistent at the local
matter fraction (DMF), soil pH, nitrite concentrations                         scale (Fig. S7, Table S4).
(NO3) and the amount of mud but displayed a positive rela-
tionship with total carbon content (TC) and conductivity                       Discussion
(Fig. S5). Archaeal richness had positive relationships with                   Akin to other arid soil environments around the globe
conductivity and total nitrogen content (TN) but displayed                     (Cowan et al. 2014), this extensive survey of the east
a negative relationship with calcium (CECCa) (Fig. S6).                        Antarctic soil microbiome reveals that whilst bacterial
Both bacteria and archaea showed a positive relationship                       diversity is rich, both micro-eukaryotic and archaeal
with phosphorous (TP, P) and sodium (CECNa) but had a                          phylogenies were comparatively low (Figs. 1 and 3).
negative relationship with titanium dioxide (TiO2). Only                       Overall, bacterial communities were dominated by the
micro-eukaryotes demonstrated a significant (P < 0.05) dif-                    metabolically and physiologically diverse Actinobacteria
ference between the two regions.                                               phylum. Their ubiquity throughout terrestrial and
                                                                               aquatic ecosystems, including extreme environments like
Niche or neutral?                                                              Antarctica, is a direct reflection of their genomic hetero-
Overall, species abundances were better approximated                           geneity and broad functional capacities [6, 31]. However,
by Poisson-lognormal (PLN) than negative binomial                              regional disparity amongst taxa between the Vestfold

Table 1 Summary of best model selection after the removal of co-variates with region as a random effect
Response                                       Bacterial Chao1                              Eukaryotic Chao1                             Archaeal Chao1
Predictor 1                                    Total phosphorous                            Dry matter fraction                          Conductivity
Predictor 2                                    Phosphorous                                  Conductivity                                 Total nitrogen
Predictor 3                                    Copper                                       pH                                           Phosphorous
Predictor 4                                    Aluminium                                    Total Carbon                                 Calcium Cation
Predictor 5                                    Sodium cation                                NO2                                          Sodium Cation
Predictor 6                                    Gravel                                       Mud                                          Mud
Predictor 7                                    TiO2                                         Region                                       TiO2
Predictor 8                                    Al2O3
Distribution                                   Negative binomial                            Gaussian                                     Gaussian
R2
                                               0.601                                        0.34                                         0.611
Deviance Explained                             64.90%                                       45%                                          66.80%
Zhang et al. Microbiome (2020) 8:37 Page 7 of 12
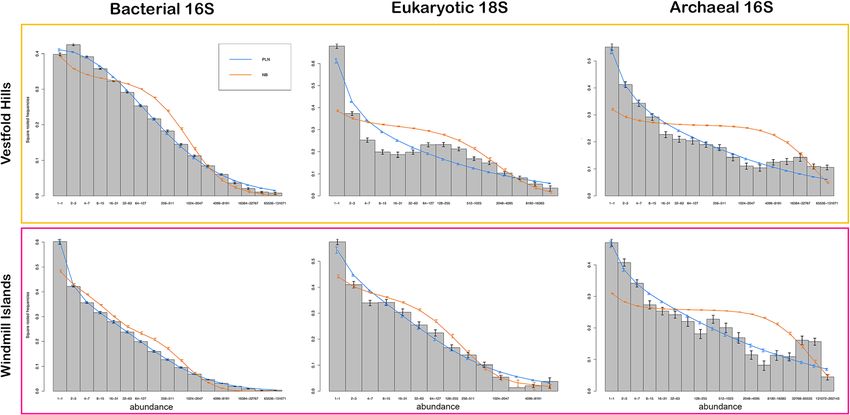
Fig. 4 Fitted species abundance distribution (SAD) curves of polar soil microbial communities between the Vestfold Hills and Windmill Islands.
The bars represent the mean proportion of species at each site in different octave classes of abundance. The blue and orange lines show the
mean of fitted values from region-by-region fits of the Poisson-lognormal (PLN) and negative binomial (NB) distributions to the data, respectively.
A PLN-fit best explains the overall structure of these communities, particularly for bacterial communities at the Windmill Islands. Eukaryotic and
archaeal communities demonstrate slightly weaker PLN-fits and multimodal distributions across both regions, suggesting the emergence
of neutrality
Hills and Windmill Islands was observed. The Vestfold archaeal communities, being mainly distributed within
Hills, a region comprising of low-lying hilly country in- the Crenarchaeota or Thaumarchaeota phylum, were
dented by lakes, contained a higher prevalence of bacter- ubiquitous across both regions. Members in this phylum,
ial members belonging to the Bacteroidetes phylum. more specifically Nitrososphaera, are known for their
This is likely due to its comparatively higher salinity ammonia oxidising capabilities [32], thereby further
levels than the Windmill Islands (Table S3), manifesting highlighting the ecological importance of the vastly
as visible salt crystal encrustations on the soil surface. In understudied polar soil archaea. Although we have only
contrast, rare bacterial candidate phyla Eremiobacter- begun to shed light on the hidden complexities of the
aeota (WPS-2) and Dormibacteraeota (AD3), previously Antarctic soil microbiome, it is an important step to-
implicated in a novel mode of primary production using wards achieving an integrated understanding of the basic
atmospheric energy sources [6], were notably lower in ecological mechanisms governing these assemblages
abundance at the Vestfold Hills. Possibly due to the rela- within such a severely limiting environment.
tively higher proportion of micro-eukaryotic taxa cap- Strong niche partitioning appear to be driving the es-
able of photosynthesis in this region, namely phylum tablishment and maintenance of contemporary micro-
Ochrophyta and Ciliophora (Fig. 1 and S2). In contrast, biomes of the arid-to-hyperarid east Antarctic soils
analysed here (Fig. 4; Table 2). This was particularly evi-
Table 2 Akaike weights (AIC) calculated from regional-scale dent for bacterial communities at the Windmill Islands,
PLN- and NB-fitted SADs (where a weighted value closer to 1 where environmental gradients, such as soil pH and
indicates stronger evidence of one model over the other)
DMF, were generally more pronounced between sites
Dataset wPLN wNB
(Fig. S3; Table S3). Whereas, soil parameters between
Bacteria Windmill Islands 1.000 < 0.001 sites at the Vestfold Hills were more similar to one an-
Vestfold Hills 1.000 < 0.001 other, with the exception of The Ridge (TR) (Fig. S3).
Eukarya Windmill Islands 0.917 0.083 These regional differences are also reflected in their
Vestfold Hills < 0.001 1.00 phylogenetic composition, abundance and richness of
Archaea Windmill Islands 1.000 < 0.001
microbial taxa (Figs. 1 and 3). Reduced niche overlap
likely promotes greater biodiversity and long-term spe-
Vestfold Hills 0.960 0.0405
cies co-existence through the efficient exploitation ofZhang et al. Microbiome (2020) 8:37 Page 8 of 12 resources under the adverse conditions [26, 33]. This response to seasonal resource availability, such as in- may attribute to our observations of high bacterial diver- creased water and nutrient bioavailability during the aus- sity whilst both eukaryotic and archaeal diversities were tral summer [26, 46]. relatively low (Figs. 1 and 3). Communities also demon- Although there is no current consensus on what drives strated mixed responses to soil environmental predictors SAD shape variation [30], a number of studies argue that such as fertility and grain-related factors as well as metal multimodality occurs quite frequently in nature, and as oxide concentrations, which is likely a reflection of varied such it is indeed a characteristic of ecological communi- life history strategies (Table 1). Most notably, regional ef- ties [39, 40, 42]. Emergent neutrality is one hypothesis fects were only significant in explaining variation in rich- put forth to explain multimodal SADs, where transient ness for micro-eukarya, suggesting that other influences self-organised patterns of functionally similar species co- such as dispersal limitation may come into play for micro- exist within an ecological niche [41, 42]. Other studies eukaryotic communities between the Vestfold Hills and claim that multimodality may arise from sampling arte- Windmill Islands [34, 35, 36]. facts [47]. We acknowledge that potential biases may be In an era of progressively rapid natural and anthropo- introduced through amplicon sequencing due to limita- genic change, communities demonstrating strong niche- tions in primer design but multimodality is rarely re- driven responses may have increased susceptibility to ported and its implications poorly understood, thus disturbance events such as large-scale colonisation, like these findings warrant further consideration [39]. those observed by Rhizocarpon lichens and invasive grass Poa annua across the Antarctic Peninsula (Chown et al. Conclusions 2012 [2];; Supp and Ernest 2015). Inevitably, this will Information on biodiversity, assemblage patterns, envir- alter contemporary ecosystem dynamics and potentially onmental drivers and non-random co-occurrences are result in the loss of novel polar taxa and associated traits extremely valuable for Antarctic soil ecosystems, par- due to the reduced functional insurance of strongly ticularly the Vestfold Hills, where the basic diversity, niche-shaped communities [20, 27, 37, 38]. For example, ecology and life history strategies of resident microbiota Candidatus Eremiobacteraeota (WPS-2) and Candidatus is limited [48, 49]. These findings provide a new under- Dormibacteraeota (AD3) who are comprised of members standing of the basic ecological concepts underlying genetically capable of atmospheric chemosynthesis, a Antarctic species abundance and distribution. Regional novel process proposed to be contributing to primary disparities between soil communities at the Vestfold production in these nutrient poor desert soils [6]. Hills and Windmill Islands further support the notion Neutral processes, however, play larger-than-expected that microbial biogeography exists. Thus, stressing the roles within the eukaryotic and archaeal soil communi- importance of conserving these unique ecologies in the ties analysed, particularly throughout the Vestfold Hills face of a warming Antarctica. Furthermore, spatial and (Fig. 4 and S5; Table 2 and S5). Weaker PLN-fits and ap- temporal shifts in the community SAD patterns docu- parent SAD multimodality suggest the emergence of mented here can potentially be used to infer responses neutrality for functionally similar groups [39–42] like to environmental disturbance, before any local extinc- Nitrososphaera (Fig. S2), a genus of chemotrophic am- tions can occur at the micro-biodiversity scale. monia oxidisers, likely involved in nitrogen cycling within these nutrient-limited Antarctic soils [43]. Inter- Methods estingly, draft genomes of Thaumarchaeota recovered Study area, soil sampling and physiochemical analysis from Robinson Ridge (RR) soils reported the presence of Sampling was performed by expeditioners via the Aus- ammonia monooxygenase [6], the first enzyme in the tralian Antarctic Program (AAP) across nine polar desert pathway for nitrification [44], further implicating the sites spanning two ice-free regions (the Vestfold Hills functional relevance of archaea in polar soils (Fig. 3). and Windmill Islands). All nine sites were within the Moreover, members forming metabolic alliances with or vicinity of Casey (66° 17′ S, 110° 45′ E) and Davis (68° competing against co-occurring bacterial taxa, such as 35′ S, 77° 58′ E) research stations in Eastern Antarctica Crenarchaeota at the Windmill Islands and micro- (Fig. 4). Five sites were chosen from the Vestfold Hills: eukarya in general at the Vestfold Hills (Fig. 3), are likely Adams Flat (AF: 68° 33′ S, 78° 1′ E); Old Wallow (OW: critical to the formation of functional microbiomes 68° 36′ S, 77° 58′ E); Rookery Lake (RL: 68° 36′ S, 77° 57′ within these harsh environments ([45]; Bahram et al. E); Heidemann Valley (HV: 68° 35′ S, 78° 0′ E); and The 2018 [20];). Unless competition is a major driving force Ridge (TR: 68° 54′ S, 78° 07′ E). Four sites were chosen within the relatively species poor eukaryotic and archaeal from the Windmill Islands: Mitchell Peninsula (MP: 66° communities, their emerging neutral status may also 31′ S, 110° 59′ E); Browning Peninsula (BP: 66° 27′ S, promote greater resilience against perturbations due to 110° 32′ E); Robinson Ridge (RR: 66° 22′ S, 110° 35′ E); their ephemeral natures, which is perhaps a cyclic and Herring Island (HI: 66° 24′ S, 110° 39′ E). At each
Zhang et al. Microbiome          (2020) 8:37                                                                                                       Page 9 of 12

site, soil samples (n = 93) from the top 10 cm were taken                         Fluorometer (ThermoFisher Scientific, NSW, Australia)
along three parallel transects following a geospatially ex-                       as described in van Dorst et al. 2014. Diluted DNA (1:10
plicit design [7]. All soils (n = 837) included in this study                     using nuclease-free water) was submitted to the Rama-
were previously submitted for extensive chemical and                              ciotti Centre for Genomics (UNSW, Sydney, Australia)
physical attributes (Table S2) [7, 50] (Fig. 5).                                  for amplicon paired-end sequencing on the Illumina
                                                                                  MiSeq platform (Illumina, California, USA) with nega-
DNA extraction and Illumina amplicon sequencing                                   tive and positive (mock) controls in accordance to proto-
DNA was extracted in triplicate from soil samples using                           cols from Bioplatforms Australia (BPA) [50]. All 93
the FASTDNA™ SPIN Kit for Soil (MP Biomedicals,                                   samples from each site were submitted to sequencing
Santa Ana, CA, USA) and quantified using the Qubit™ 4                             for bacteria (n = 837) targeting the 16s rRNA gene using

 Fig. 5 Map of the nine study areas across the a Vestfold Hills (AAD map catalogue No. 14, 499) and b Windmill Islands (No. 14, 179) region of
 Eastern Antarctica, showing approximate sampling locations and c geospatial transect design. At each site, soil samples (n = 93) were taken at
 the following distance points along each transect: 0, 0.1, 0.2, 0.5, 1, 2, 5, 10, 20, 50, 100, 100.1, 100.2, 100.5, 101, 102, 105, 110, 120, 150, 200, 200.1,
 200.2, 200.5, 201, 202, 205, 210, 220, 250 and 300m. Where underlined distance points refer to a subsample (n = 18) submitted for amplicon
 sequencing of eukaryotic (18S rRNA) and archaeal (16S rRNA) soil communities
Zhang et al. Microbiome (2020) 8:37 Page 10 of 12
the 27F/519R [51] primer set. As described in Siciliano MASS v7.3-51.4 package [60] in R. We also included re-
et al. [7], a non-random subsample (n = 18) at each site gion (i.e. Windmill Island or Vestfold Hills) as a random
was selected for the sequencing of micro-eukarya (n = effect in the model selection process, to help in under-
162) and archaea (n = 144) targeting the 18S and 16S standing the regional effects in explaining variation in
rRNA genes using the 1391f/EukBr (Amaral-Zettler richness. We fitted both generalised linear models
et al. 2009) and A2F/519R [52] primer sets, respectively. (GLMs) and generalised additive models (GAMs) with
These include distance points at 0, 2, 100, 102, 200 and smooth terms as either Gaussian or NB distributions. In
202 m along each of the three parallel transects at each addition to AIC, model diagnostic plots (to test normal-
site. ity and heteroscedasticity of variance) were used to help
inform final model selection, especially with regard to
Open OTU picking, assignment and classification the distribution used.
We followed the UPARSE OTU algorithm [53] endorsed
by BPA through directly employing USEARCH 32-bit Domain-level co-occurrence OTU network from
v10.0.240 [54] and VSEARCH 64-bit v2.8.0 [55]. Se- abundance data
quences were quality filtered, trimmed and clustered de OTUs representing > 0.001% of the total relative abun-
novo to pick OTUs at 97% identity. Reads were then dance of the bacterial, eukaryotic and archaeal commu-
assigned to separate sample-by-OTU matrices for each nities within each region were combined for network
amplicon (Table S1). OTUs were taxonomically classi- analyses. Correlations between the relative abundance
fied against the SILVA v3.2.1 SSU rRNA database [56]. of each OTU pair across samples were calculated using
Where applicable, new OTU matrices were merged with the maximal information coefficient (MIC) in the
existing ones using the QIIME 2 (https://qiime2.org) MINE software package [61]. After correction for mul-
feature-table merge option. These were rarefied using tiple testing, statistically significant (P < 0.001) co-
the qiime feature-table rarefy function to generate ran- occurrence relationships between pairs of OTUs were
dom subsamples (bacterial 16S rRNA gene = 700k reads, uploaded into the CYTOSCAPE software [62] to gener-
micro-eukaryotic 18S rRNA gene = 23k reads, archaeal ate network diagrams, displaying only very strong asso-
16S rRNA gene = 850k reads). ciations (MIC > 0.8). Statistical inferences of network
topology were calculated using the Network Analyser
Multivariate and statistical analyses in R algorithm (treatment = ‘undirected’) in CYTOSCAPE
All multivariate and statistical analyses were carried (Table S2).
out in the R environment (R Core Team 2018) using
the subsampled datasets for bacteria, micro-eukarya PLN- and NB-fitted species abundance distribution curves
and archaea. Subsampled rarefaction curves (q = 0) As described in [63], PLN and NB models representing
were generated using the iNEXT package. Non-metric niche and neutral distributions, respectively, were fitted
multidimensional scaling (NMDS) ordinations (dis- to our empirical data using maximum likelihood
tance = ‘Euclidean’ for environmental data and dis- methods. All available samples for bacteria, micro-
tance = ‘Bray-Curtis’ for OTU abundance data) and eukarya and archaea were included in this analysis.
Chao1 richness estimates were calculated in vegan Pooled species abundances were fitted on both regional
v2.5-3 [57]. Unless specified otherwise, all plots were and local scales then displayed on a logarithmic scale.
visualised using a combination of ggplot2 v3.1.0 [58] Akaike weights (wPLN and wNB) were calculated for
and ggpubr v0.2 [59]. PLN- and NB-fits on each dataset to provide a measure
of the relative goodness for fit [64].
Removal of environmental co-variates and model
selection
Supplementary information
To try and better understand the relationship between a Supplementary information accompanies this paper at https://doi.org/10.
range of environmental co-variates, we first constructed 1186/s40168-020-00809-w.
a Pearson correlation matrix to identify co-correlated
variables (R > 0.6), and one of each correlated pair was Additional file 1: Figure S1. Rarefaction curves of subsampled
bacterial, eukaryotic and archaeal communities between sites. In all cases,
removed from the list of potential predictors. Models data was approaching asymptote indicating that sufficient sampling
were then fitted with all predictors (saturated models) depth was achieved. A particularly rich number of bacterial, eukaryotic
using each of the Chao1 richness variables (bacteria, and archaeal species were observed at MP (Mitchell Peninsula), TR (The
Ridge) and RR (Robinson Ridge), respectively. Figure S2. Top 15 most
micro-eukarya and archaea) as the response variable. genus of bacterial, eukaryotic and archaeal communities between sites.
Starting with this saturated model, the best model (i.e. As taxonomic levels decrease, the number of unclassified taxa increase
the most parsimonious—as indicated by the lowest AIC) substantially. Interestingly, archaeal communities were dominated by
Nitrososphaera, a genus of ammonia oxidising archaea possibly
was then identified using the stepAIC function in theZhang et al. Microbiome (2020) 8:37 Page 11 of 12
implicated in nitrogen cycling within these nutrient starved soils. Figure Consent for publication
S3. NMDS plots of microbial OTU communities and environmental soil Not applicable.
parameters. In all cases, soil samples clustered according to site and
broadly by geographic region. Although TR (The Ridge) is more Competing interests
environmentally similar to the Windmill Island sites, it’s soil bacterial and The authors declare that they have no competing interests.
eukaryotic communities cluster more strongly with the Vestfold Hills.
Figure S4. GAM model output of negative binomial distributions of best Author details
1
environmental predictor variables against estimated bacterial Chao1 School of Biotechnology and Biomolecular Sciences, University of New
richness based on AIC, where ‘*’ indicates a significant (PZhang et al. Microbiome (2020) 8:37 Page 12 of 12
18. Rao S, Yuki C, Lacap DC, Hyde KD, Pointing SB, Farrell RL. Low-diversity 45. Aller JY, Kemp PF. Are archaea inherently less diverse than bacteria in the
fungal assemblage in an Antarctic Dry Valley soil. Polar Biology. 2012;35: same environments? FEMS Microbiology Ecology. 2008;65(1):74–87.
567–74. 46. Sakavara A, Tsirtsis G, Roelke DL, Mancy R, Spatharis S. Lumpy species
19. Richter I, Herbold CW, Lee CK, McDonald IR, Barrett JE, Cary SC. Influence of coexistence arises robustly in fluctuating resource environments. PNAS.
soil properties on archaeal diversity and distribution in the McMurdo Dry 2018;115(4):738–43.
Valleys, Antarctica. FEMS Microbiology Ecology. 2014;89:347–59. 47. McGill BJ, Etienne RS, Gray JS, Alonso D, Anderson MJ, Benecha HK, et al.
20. Bell TH, Callender KL, Whyte LG, Greer CW. Microbial competition in polar Species abundance distributions: moving beyond single prediction theories
soils: A review of an understudied but potentially important control on to integration within an ecological framework. Ecology Letters. 2007;10:995–
productivity. Biology. 2013;2:533–54. 1015.
21. Faust K, Raes J. Microbial interactions: from networks to models. Nature 48. Barberán A, Bates ST, Casamayor EO, Fierer N. Using network analysis to
Reviews. 2012;10:538–50. explore co-occurrence patterns in soil microbial communities. The ISME
22. Fierer N. Embracing the unknown: disentangling the complexities of the soil Journal. 2012;6:343–51.
microbiome. Nature. 2017;15:579–90. 49. Janssen PH. Identifying the dominant soil bacterial taxa in libraries of 16S
23. Dumbrell AJ, Nelson M, Helgason T, Dytham C, Fitter AH. Relative roles of rRNA and 16S rRNA genes. Applied Environmental Microbiology. 2006;72(3):
niche and neutral processes in structuring a soil microbial community. The 1719–28.
ISME Journal. 2010;4:337–45. 50. Bissett A, Fitzgerald A, Meintjes T, Mele PM, Reith F, Dennis PG, et al.
24. Nemergut DR, Schmidt SK, Fukami T, O’Neill SP, Bilinski TM, Stanish LF, et al. Introducing BASE: The Biomes of Australian Soil Environments soil microbial
Patterns and processes of microbial community assembly. Microbiology and diversity database. Gigascience. 2016;5:21.
Molecular Biology Reviews. 2013;77(3):342–56. 51. Lane DJ. 16S/23S rRNA sequencing. In: Stackebrandt E, Goodfellow M,
25. Powell JR, Karunaratne S, Campbell CD, Yao H, Robinson L, Singh BK. editors. Nucleic acid techniques in bacterial systematics. New York, NY: John
Deterministic processes vary during community assembly for ecologically Wiley & Sons; 1991. p. 115–47.
dissimilar taxa. Nature Communications. 2015;6:8444. 52. Reysenbach A.L., Pace N.R., Robb F.T., Place A.R., editors. (1995). Archaea: A
26. Scheffer M, van Nes EH, Vergnon R. Toward a unifying theory of laboratory manual—Thermophiles. CSHLP. Protocol, 16, pages 101-107.
biodiversity. PNAS. 2018;115(4):639–41. 53. Edgar RC. UPARSE: Highly accurate OTU sequences from microbial amplicon
27. Tylianakis JM, Soper EJ. Vulnerability of ecosystems to climate. Climate reads. Nature Methods. 2013;10(10):–996.
Vulnerability. 2013;4:229–37. 54. Edgar RC. Search and clustering orders of magnitude faster than BLAST.
28. Vellend M. Conceptual synthesis in community ecology. The Quarterly Bioinformatics. 2010;26(19):2460–1.
Review of Biology. 2010;85(2):183–206. 55. Rognes T., Flouri T., Nichols B., Quince C., Mahé F. (2016). VSEARCH: A
29. Verberk WCEP. Explaining general patterns in species abundance and versatile open source tool for metagenomics. Peer J, https://doi.org/10.7717/
distributions. Nature Education Knowledge. 2011;3(10):38. peerj.2584.
30. Matthews TJ, Whittaker RJ. On the species abundance distribution in 56. Quast C, Pruesse E, Yilmaz P, Gerken J, Schweer T, Yarza P, et al. The SILVA
applied ecology and biodiversity management. Journal of Applied Ecology. ribosomal RNA gene database project: Improved data processing and web-
2015;52:443–54. based tools. Nucleic Acids Research. 2013;41. https://doi.org/10.1093/nar/
gks1219.
31. Ventura M, Canchaya C, Tauch A, Chandra G, Fitzgerald GF, Chater KF, van
57. Oksanen J, Blanchet FG, Friendly M, Kindt R, Legendre P, McGlinn D, et al.
Sinderen D. Microbiol Mol Biol Rev. 2007;71(3):495–548.
vegan: Community ecology package. R package version. 2018;2:5–2.
32. Schleper C, Nicol GW. Ammonia-Oxidising Archaea – Physiology, Ecology
58. Wickham H. (2016). ggplot2: Elegant graphics for data analysis. Springer-
and Evolution. Advances in Microbial Physiology. 2010;57:1–41.
Verlag New York.
33. Finke DL, Snyder WE. Niche partitioning increases resource exploitation by
59. Kassambara A (2018). Ggpubr: ‘ggplot2’ Based publication ready plots. R
diverse communities. Science. 2008;321:1488–9.
package version 0.1.8. https://CRAN.R-project.org/package=ggpubr.
34. Vyverman W, Verleyen E, Wilmotte A, Hodgson DA, Willems A, Peeters K,
60. Ripley B. MASS. R package version. 2019;7:3–51.4 https://cran.r-project.org/
Van de Vijver B, De Wever A, Leliaert F, Sabbe K. Evidence for widespread
web/packages/MASS/MASS.pdf.
endemism among Antarctic micro-organisms. Polar Science. 2010;4:103–13.
61. Reshef DN, Reshef YA, Finucane HK, Grossman SR, McVean G, Turnbaugh PJ,
35. Ferrari BC, Bissett A, Snape I, van Dorst J, Palmer AS, Ji M, et al. Geological
et al. Detecting novel associations in large datasets. Science. 2011;334(6062):
connectivity drives microbial community structure and connectivity in polar,
1518–24.
terrestrial ecosystems. Environmental Microbiology. 2016;18(6):1834–49.
62. Shannon P, Markiel A, Ozier O, Baliga NS, Wang JT, Ramage D, et al.
36. Hubbell SP. The unified neutral theory of biodiversity and biogeography. Cytoscape: A software environment for integrated models of biomolecular
Monographs in Population Biology, Princeton University Press. 2001;MPB-32: interaction networks. Genome Research. 2003;13(11):2498–504.
1–448. 63. Connolly SR, MacNeil MA, Caley MJ, Knowlton N, Cripps E, Hisano M, et al.
37. Allison SD, Martiny JBH. Resistance, resilience, and redundancy in microbial Commonness and rarity in the marine biosphere. PNAS. 2014;111(23):8524–9.
communities. PNAS. 2008;105:11512–9. 64. Burnham KP, Anderson DR. Multimodel inference: Understanding AIC and
38. Delgado-Baquerizo M, Giaramida L, Reich PB, Khachane AN, Hamonts K, BIC in model selection. Sociological Methods & Research. 2004. https://doi.
Edwards C, et al. Lack of functional redundancy in the relationship between org/10.117/0049124104268644.
microbial diversity ad ecosystem functioning. Journal of Ecology. 2016;104:
936–46.
39. Antão LH, Connolly SR, Magurran AE, Soares A, Dornelas M. Prevalence of Publisher’s Note
multimodal species abundance distributions is linked to spatial and Springer Nature remains neutral with regard to jurisdictional claims in
taxonomic breadth. Global Ecology and Biogeography. 2016;26:203–15. published maps and institutional affiliations.
40. Dornelas M, Connolly SR. Multiple modes in a coral species abundance
distribution. Ecology Letters. 2008;11:1008–16.
41. Holt RD. Emergent neutrality. TRENDS in Ecology and Evolution. 2006;21(10):
531–3.
42. Vergnon R, van Nes EH, Scheffer M. Emergent neutrality leads to
multimodal abundance distributions. Nature Communications. 2012;3:663.
43. Tourna M, Stieglmeier M, Spang A, Könneke M, Schintlmeister A, Urich T,
et al. Nitrososphaera viennensis, an ammonia oxidizing archaeon from soil.
PNAS. 2011;108(20):8420–5.
44. Pester M, Rattei T, Flechl S, Gröngröft A, Richter A, Overmann J, Reinhold-
Hurek B, Loy A, Wagner M. amoA-based consensus phylogeny of ammonia-
oxidizing archaea and deep sequencing of amoA genes from soils of four
different geographical regions. Environmental Microbiology. 2012;14(2):525–39.You can also read