Geometry-Aware Satellite-to-Ground Image Synthesis for Urban Areas - CDN
←
→
Page content transcription
If your browser does not render page correctly, please read the page content below
Geometry-Aware Satellite-to-Ground Image Synthesis for Urban Areas

                            Xiaohu Lu1∗ Zuoyue Li2∗ Zhaopeng Cui2† Martin R. Oswald2
                                           Marc Pollefeys2,3 Rongjun Qin1†
                                1
                                  The Ohio State University 2 ETH Zürich 3 Microsoft

                               Abstract

    We present a novel method for generating panoramic
street-view images which are geometrically consistent with
a given satellite image. Different from existing approaches
that completely rely on a deep learning architecture to gen-
eralize cross-view image distributions, our approach explic-
itly loops in the geometric configuration of the ground ob-
jects based on the satellite views, such that the produced
ground view synthesis preserves the geometric shape and
the semantics of the scene. In particular, we propose a
neural network with a geo-transformation layer that turns
predicted ground-height values from the satellite view to a
                                                                           Satellite patch         Predicted street-view panorama
ground view while retaining the physical satellite-to-ground
relation. Our results show that the synthesized image re-              Figure 1: Two examples of our satellite-to-ground imag-
tains well-articulated and authentic geometric shapes, as              ing synthesis. Given a single satellite image patch, we learn
well as texture richness of the street-view in various scenar-         to predict a corresponding street-view RGB panorama in an
ios. Both qualitative and quantitative results demonstrate             end-to-end fashion by leveraging geometric information.
that our method compares favorably to other state-of-the-
                                                                       of all, the view differences are drastic such that the informa-
art approaches that lack geometric consistency.
                                                                       tion extracted from one view usable for inferring the other
                                                                       is highly limited. For instance, we may only observe the
1. Introduction                                                        rooftop of a building in the satellite view with very little
                                                                       or no information about the facades. Secondly, the reso-
    Due to the increasing availability of satellite images (e.g.
                                                                       lution of the inferable information from the satellite view
Google Earth) it is nowadays possible to cover almost ev-
                                                                       is too coarse as compared to the ground images (normally
ery single corner of the world, yet such a capacity for
                                                                       the common regions might just be the ground), thus di-
ground-view images does not exist. Being able to gener-
                                                                       rectly using partial information from the satellite view to
ate a consistent ground view from a given satellite image
                                                                       generate ground views are difficult. Thirdly, the ground-
is extremely useful for applications such as wide-area vir-
                                                                       view images generally exhibit much more local details than
tual model generation, media content enrichment, 3D real-
                                                                       satellite views. As for example in an urban scenario, there
istic gaming, simulations and cross-view matching. This
                                                                       exist many dynamic objects such as pedestrians and vehi-
problem is known as a satellite-to-ground cross-view syn-
                                                                       cles. Also, places with visibly similar street patterns in the
thesis. In this work, we address this problem by proposing
                                                                       satellite view might look completely different in the ground
a geometry-aware framework that preserves the geometric
                                                                       view, which can present a one-to-many mapping leading to
and the relative geographical locations of the ground ob-
                                                                       the lack of diversity when the synthesized ground-view im-
jects by fully utilizing information extracted from a satellite
                                                                       age is conditioned to the satellite views. Finally, due to the
image. Our goal is to represent the ground-view as geomet-
                                                                       limited accuracy and availability of the GPS (Global Posi-
rically realistic as possible.
                                                                       tioning System) information of images, the alignment be-
    This raises several unique and difficult challenges: first
                                                                       tween the satellite and ground-view is often insufficient to
  ∗ These   authors contributed equally to this work.                  serve as training data for learning-based methods.
  † Corresponding    authors.                                              Recently there are several works trying to solve simi-

                                                                   1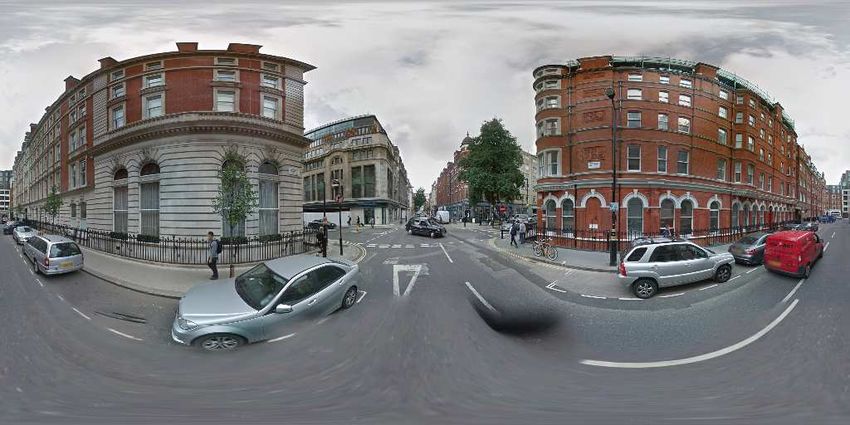
lar problems. Zhai et al. [23] proposed a deep learning               dition, the most reasonable features to be utilized would
method to generate plausible ground-level panoramas from              be semantic information. Castaldo et al. [2] proposed to
aerial images. Features are learned and extracted from the            take advantage of available semantic information from GIS
aerial image and the transformation to the ground level was           maps for matching ground-view images based on the ex-
formed through learning a per-pixel transformation, which             tracted semantic information, and feature descriptors ex-
is further used to generate RGB images through a genera-              tracted in their common regions (e.g. road intersections)
tive model. Regmi et al. [15] proposed to learn the semantic          are then matched. Considering that the manually crafted
segmentation together with RGB images within a uniform                descriptors might not be robust enough, Lin et al. [9] pro-
conditional generative adversarial network (GAN) architec-            posed to use the deep convolution neural networks to learn
ture. Because there is no geometric transformation encoded            feature descriptors from both views, where separate net-
in the network, the synthesized image may be quite different          works respectively for ground and aerial views are trained
from the real one in geometry although it may look reason-            and simple KNN (k-nearest neighborhood) were applied
able. So they further improved their method in [16] and use           for potential matches, which was shown to be effective to
geometric constraints to add some details of roads in the             match local ground-view images over a large aerial image
generated image. However, only a simple homography for                database. Similar ideas were proposed by Hu et al. [5] us-
the overlapping road transformation was considered in this            ing a learning-based method for localizing panoramic im-
approach and the generation of other objects completely re-           ages on larges-scale satellite images, where a two-section
lied on learned transformations which leads to scenes with            Siamese network, namely local feature and global descrip-
a large amount of hallucinated content.                               tor network were proposed to yield reliable features for
    In virtue of the widely available satellite images, we pro-       matching. Other similar works can be found in [21, 22, 20].
pose to address this problem by using the learned height and          Essentially, these works invariably learn the geometric pat-
semantic representations from such a dataset to form a pro-           terns in the overlapping region, for example, road patterns
jective transformation between satellite and ground. This             and junctions. More recently, other approaches such as con-
allows to fully utilize the geometric information represented         ditional GANs have been utilized to synthesize views for
in the satellite view for reality-based cross-view synthesis.         cross-view matching. For example, in the work of [17], an
We utilize this as a novel cross-view image transformation            aerial view was synthesized given a ground-view panorama.
module to transform both semantic and color information               This synthesized aerial view was then combined with a
from a satellite image to the street view. This is followed           ground-view panorama in order to learn feature represen-
by a per-pixel generative model for generating plausible              tations for matching aerial images.
ground-view RGB images using information from the trans-              View Transformations. One of the core components in
formation module. As the transformation represents the ac-            cross-view synthesis and matching is the transformation be-
tual projective relationship cross the two different views,           tween different views. Often geometric information is not
our generated ground-view image is more geometrically                 available and thus learned transformation was presented as
meaningful, thus yielding more realistic panoramic image              an alternative. A few works directly learn such association
textures. Our experiments show that our method outper-                by taking input of aerial images and outputting both ground-
forms state-of-the-art methods.                                       view RGB and semantic images [16, 5], while such methods
    Our contributions are as follows. Firstly, we propose             might only be able to handle scenes with a fixed or similar
an end-to-end network structure ensemble that exploits the            layout. Instead of embedding the transformation in the fea-
geometric constraints of the street-view image generation             ture extraction network, Zhai et al. [23] explicitly proposed
from a satellite image. Secondly, we present a novel cross-           a module that learned independent transformation between
view image transformation module that carries geometric               semantic layout between aerial and ground images, thus the
information inferred from the satellite view as constraints           transformation between scene labels can be performed in a
for ground-view generation. Thirdly, we utilize a novel               non-linear fashion. This method works well with landscape
weighted mask to alleviate small misalignment between the             scene layout and while is incapable of handling geometric
satellite-derived depth image and the geo-tagged google               transformation in complex urban scenes, where occlusions
panoramic image. Lastly, to the authors’ best knowledge,              and non-planar projective transformation exist.
our work is the first cross-view synthesis work that pre-
serves the authentic geometric shape of the ground objects.           Cross-view Synthesis. To synthesize views from a com-
                                                                      pletely different scene, although an intuitive idea is to per-
2. Related Work                                                       form image composition through paired image databases,
                                                                      the most recent works are primarily based on generative
Aerial-Ground Co-location. Aerial-ground co-location is               networks, and more specifically, generative adversarial net-
a relevant topic that considers image-level matching cross            works [3] (GANs) are among the most popular. Regmi et
different views. It is natural that under the cross-view con-         al. [15] generated aerial or ground view images conditioned

                                                                  2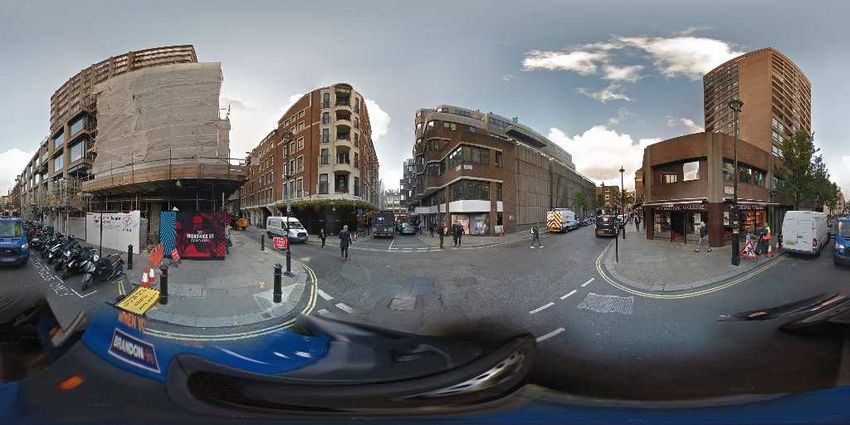
Satellite Stage             Geo-transformation                                                          Street-view Stage
                            Satellite Semantics                  Transformed Street-view Semantics UNet           Refined Street-view Semantics BicycleGAN             Street-view Image
                    !%%&'

                                                  Geo-transformation T
 Satellite Image   UNet

                                                                                                                              !%%')                       !"#$                             !)%&'

                                                                                                                                                            Inv. Geo-transformation T -1
                                                                                                                                                                                     Testing
                    !(%&'                                                                                 ! *+,                       Latent Vector
                                                                                                                                                                            +       Training
                              Satellite Depth                            Transformed Street-view Depth                    Texture Encoder                                              Loss

Figure 2: Overview of our network architecture. Our network operates in three different stages accounting for different
image domains. A differentiable geo-transformation stage transforms between the satellite image domain and the street-
view image domain. Satellite Stage: A U-Net [18] computes for a given satellite image a depth image and corresponding
semantic image. Geo-transformation Stage: The geo-transformation layer takes the depth and semantic satellite images
and transforms them into corresponding depth and semantic panoramic images. Street-view Stage: A second U-Net refines
the semantic panorama. Finally, a BicycleGAN [28] is used to generate photo-realistic images from the semantic panorama.
Rather than using a random seed for the texture generation, we added a separate texture encoder that computes a latent vector
from the input satellite image. Symbols in this figure are different types of losses explained in Sec. 3.4.2.

to the other views. This can be performed as image-to-
image translation [6] once information from the cross-view                                                                     Satellite Depth Image

such as the scene layout can be estimated [23]. GANs learn                                                                     Satellite Color Image
a data distribution and when given a perturbed input, they
generate data samples following that distribution. Since the
ground scene layout predicted from a satellite view through                                                                                              Street    Transformed Depth Panorama
                                                                                                                                                       Viewpoint
a learning-based transformation can be quite similar, the di-
versity of generated images can be a challenge.
                                                                                                                                                                   Transformed Color Panorama
3. Method                                                                                                   Occupancy Grid                 Panoramic Rays

                                                                                                         Figure 3: Illustration of the proposed differential geo-
    In this section, we introduce our framework for realistic                                            transformation T . The satellite depth and semantic labels
street-view image synthesis from a satellite image which is                                              are transformed into a semantic height map, which is then
shown in Fig. 2. Our key idea is to transform the satellite                                              projected into the panoramic image to obtain depth and se-
information to the street-view in a geometrically meaning-                                               mantic labels in the street-view domain.
ful way for better street-view synthesis. To this end, we use
a cascaded architecture with three stages: a satellite stage, a                                          contrast to the network in [12], we utilize a weight-shared
geo-transformation stage, and a street-view stage. The first                                             decoder to learn both the depth and semantic for the satellite
stage estimates both depth and semantic images from an in-                                               image. In our network, both the encoder and decoder have
put satellite image. The second stage transforms the satel-                                              eight layers, while there are two branches for the last two
lite depth and semantic images to street-view via a novel                                                layers of the decoder, which output the predicted satellite
geo-transformation layer. In the last stage, the transformed                                             depth image and semantic image, respectively.
images are utilized to generate the final street-view images.
                                                                                                         3.2. Geo-transformation Stage
All three stages are detailed in the following subsections.
                                                                                                            To synthesize a cross-view image, we transform the
3.1. Satellite Stage
                                                                                                         depth and semantic information from the satellite view to
    This stage follow the assumption that a rough depth im-                                              the street-view in a differentiable way such that the whole
age can be obtained from a single image via a convolutional                                              pipeline can be trained end-to-end. To achieve this goal,
neural network, which has been well investigated in the field                                            we propose the following differentiable geo-transformation
of single image depth estimation [8]. We can further ex-                                                 workflow as shown in Fig. 3. Given an n×n square satellite
ploit the approximately orthogonal projection type of satel-                                             depth image patch D and a corresponding color image patch
lite images and that many faces in urban areas are perpen-                                               C, we perform three steps to obtain a street-view panorama.
dicular to the ground [12]. In addition, semantic labels are                                             Height map generation. First, we transform the satellite
also easily obtained [18]. Motivated by previous work [12],                                              depth image into a ground-based height map using ortho-
we take a U-Net architecture [18] as shown in Fig. 2. In                                                 graphic projection.

                                                                                                    3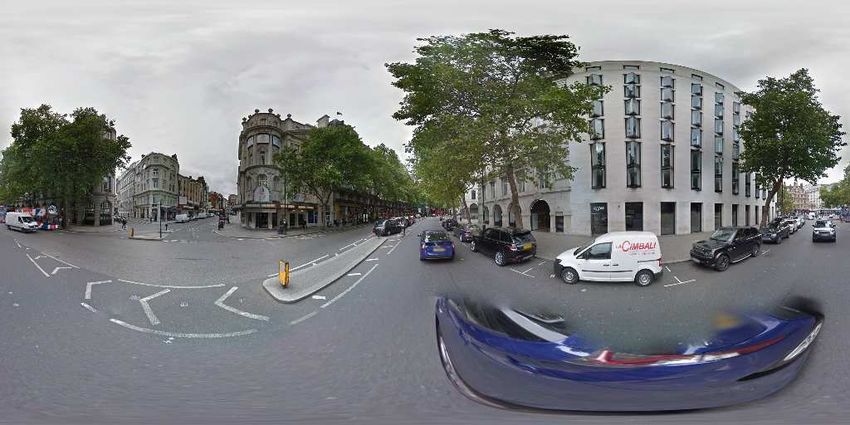
Occupancy grid generation. Second, this height map is                  With the latent code, the network is able to produce more
discretized into an n×n×n occupancy grid G by checking for             diverse results. Nevertheless, the latent vector in the Bi-
each voxel if it is above or below the corresponding height            cycleGAN is originally randomly sampled from a learned
value. The grid is centered around the street-view location            distribution during the inference phase. Rather than gener-
and besides the height value, we also store corresponding              ating multiple street views our goal is to generate one that
RGB values from C in the voxel grid G (see Fig. 3).                    is as realistic as possible. Thus, as shown in Fig. 2, we in-
Panoramic projection. Third, a street view panorama is                 troduce an external encoder which generates such a latent
generated by considering panoramic rays starting from the              vector from the original satellite image. More details of the
central voxel of G and directed to different viewing angles            sub-networks can be found in the supplementary material.
(θ, φ) which are transformed into a 3D directional vector:
                                                                       3.4. Implementation Details
    (vx , vy , vz ) = (cos θ sin φ, − cos θ cos φ, sin θ).   (1)
                                                                       3.4.1   Dataset
Then, to generate a k×2k-sized street-view panorama, we
                                                                       For the satellite image, we select a 5km×5km area centered
evenly sample 2k longitude angles ranging in θ ∈ [0, 2π]
                                                                       in the city of London as the region of interest. The ground
and k latitude angles ranging in φ ∈ [0, π], which results in
                                                                       truth depth and semantic satellite images are generated
k×2k panoramic rays shooting into 3D space. We use the
                                                                       from stereo matching [4, 14, 13] and supervised classifica-
panoramic rays to generate a street-view depth panorama.
                                                                       tion [24] with post corrections, respectively. For the street-
The depth for each pixel in the panorama is determined by
                                                                       view images, we download all available google street-view
the distance between the ray origin and the first encounter-
                                                                       images in this region via the Google API1 , which results in
ing voxel (FEV) in the occupancy grid G along the ray. We
                                                                       almost 30K street-view panoramas in total. Each of these
sample n 3D points along each ray in equal distances ac-
                                                                       panoramas includes location information (longitude, lati-
cording to the voxel size and then compute the depth by
                                                                       tude, orientation). However, this GPS information contain
searching the first non-zero voxel value in the occupancy
                                                                       certain positional errors, meaning that directly aligning the
grid G along the ray.
                                                                       satellite image using the GPS information of the street-view
   The street-view color panorama can be generated in the
                                                                       images typically results in misalignment. In order to miti-
same way. Fig. 3 illustrates the processing pipeline of our
                                                                       gate misalignments, we propose a pre-processing strategy
geo-transformation procedure. We used n = 256 and k =
                                                                       to pick out those well-aligned image pairs by calculating
256 in our experiments. Both the 2D to 3D as well as the
                                                                       their overlap ratios as follows. Firstly, the semantic seg-
3D to 2D transformation procedure is differentiable.
                                                                       mentation result of a real street-view image is obtained by
3.3. Street-view Stage                                                 applying SegNet [1]. Subsequently, the sky pixels in this
                                                                       semantic image are compared with those in the street-view
    In the street-view stage, we first adopt a U-Net [18]              semantic image transformed from the corresponding satel-
to generate refined semantic labels from the transformed               lite depth image to calculate their overlapping ratio. The
panoramas, and then use a BicycleGAN [28] to translate the             image pairs with an overlapping ratio greater than 90% are
semantic labels into an RGB image. As depicted in Fig. 2,              kept as a well-aligned training dataset. In this way, we ob-
the input of the refinement network consists of transformed            tained approximately 2K well-aligned satellite-street-view
depth, semantics, and a resized satellite image, which are             image pairs. Fig. 4 shows examples of our training dataset.
concatenated together. Then, we concatenate the refined
street-view semantics and transformed depth together and
feed them into BicycleGAN as the input. The reason why                 3.4.2   Loss Function
we use BicycleGAN instead of the conventional cGAN [11]                The overall loss function of our full pipeline is defined as
is that the translation between semantics and RGB images in            L = Lsat + Lstr , representing the losses of satellite stage
our setting is kind of a multi-modal image-to-image trans-             and street-view stages respectively. The satellite loss con-
lation, as two street views which look very different may              sists of two terms, Lsat = Ldsat + Lssat , representing the
have similar semantics as long as their structures (e.g. the           L1 losses for the satellite depth image and semantics re-
shape of skyline, the location of sidewalk, etc.) are similar.         spectively. The street-view loss is composed of four terms
The generative modeling setting of cGAN cannot address                 Lstr = Lsstr +LGAN +Lenc +Lrsat , representing a weighted
this kind of ambiguity during training. In BicycleGAN, a               L1 loss for the street-view semantics, the BicycleGAN loss
low-dimensional latent vector is introduced in order to dis-           (consisting of the L1 losses for the generator and the la-
till the ambiguity. Its generator learns to map the given              tent vector encoder, and log-losses for the 2 discrimina-
input, combined with this latent code, to the output. The              tors), an L1 loss for the external encoder and an L1 loss for
encoded latent vector is injected by spatial replication and
concatenated into every intermediate layer in the encoder.               1 https://developers.google.com/maps/documentation/streetview/intro

                                                                   4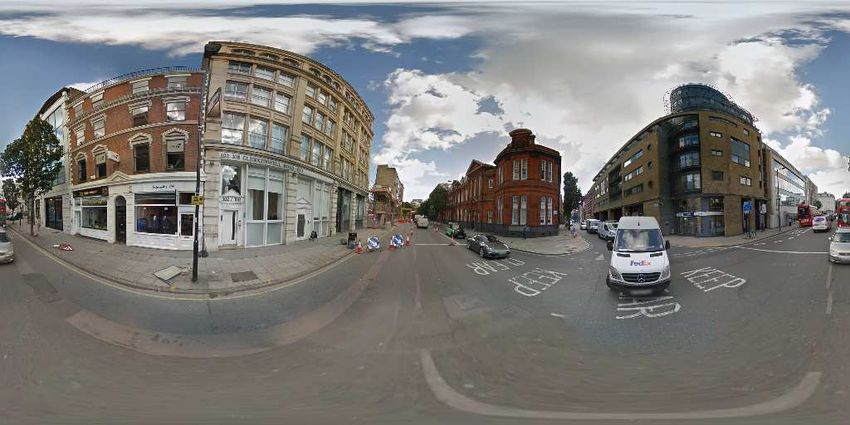
GT Satellite RGB

                                                                                 Panorama RGB & Depth                                      !%"#$

                 (a) aligned satellite-streetview image pairs
                                                                                                        3D Point Cloud
                                                                                                             Predicted Satellite RGB

                                                                                 Figure 5: Visualization of the inverse geo-transformation
                                                                                 T −1 . We consider only the pixels within a 5m radius around
                                                                                 the location (marked by the red circle) for the Lrsat loss.

                       (b) samples of training dataset                           panoramic ray for pixel (i, j), (xc , yc ) = ( wg   hg
                                                                                                                                 2 , 2 ) is the
                                                                                 (x, y) coordinate of the central pixel in the satellite image
                                                                                 image, which is (64,64) for constant since the size (w, h)
                 (c) samples of misaligned training samples                      for the satellite image is (256,256) and the ground sampling
Figure 4: Examples of our training datasets. For (a), from                       distance g is 0.5. After that, the RGB values of the 3D
left to right are the satellite image and the corresponding                      points are picked from the predicted street-view image and
street-view image. For (b), from left to right are the satellite                                                                    r
                                                                                 saved into an RGB image with the same size as Isat     , which
image, satellite depth, satellite semantic, transformed street-                  forms the inverted transformed satellite image. Finally,
view depth, transformed street-view semantic, true street-                       considering that only the road pixels can be observed
view semantic, and true street-view RGB, respectively. For                       in both satellite and street-view images, the L1 loss is
(c), from left to right are the transformed street-view seman-                   calculated just for pixels within a 5m (10 pixels) range to
tic, true street-view semantic, and the misaligned mask.                         the center of the inverted transformed satellite image with
                                                                                  r
                                                                                 Isat . Fig. 5 gives a brief demonstration on the workflow of
the predicted satellite RGB produced by the inverted geo-                        the inverted geo-transformation loss.
transformation, respectively.
    The reason why we adopt a weighted L1 loss for the
street-view semantics is to deal with the misalignment be-                       3.4.3   Training Scheme
tween the satellite image and street-view image (as intro-
                                                                                 Due to the cascaded architecture and the location misalign-
duced in Sec. 3.4.1). The weighted L1 loss is defined as
                                                                                 ment problem, we first pre-train each stage of our pipeline
LW1 = L1 (W ∗ ||I − IGT ||), where W is a weight matrix
                                                                                 independently, and then fine-tune our network in an end-to-
which controls the weight for each pixel and the sign ∗ rep-
                                                                                 end manner. We train our model on a computer with In-
resents the element-wise multiplication. The weight matrix
                                                                                 tel CPU i7, 16GB RAM and an Nvidia GeForce GTX1080
is designed to give less weight to misaligned pixels. As
                                                                                 GPU. The full pipeline is implemented with PyTorch. For
Fig. 4 (c) shows, misaligned pixels usually occur along the
                                                                                 all network trainings, we used Adam [7] as the optimizer
boundaries between sky and buildings, where the sky pixels
                                                                                 with an initial learning rate of 2×10⁻³ , β1 = 0.5. The
may be incorrectly labeled as building and vice versa. We
                                                                                 learning rate is decreased by half every 100 epochs.
reduce the loss for these mislabeled pixels to 10% of the
loss of the remaining pixels.                                                        For the network of the satellite stage, we crop a 256×
    The loss of the inverted geo-transformation Lrsat is de-                     256 patch for each of the 30K panoramas by converting the
signed to make the road pixels in the predicted street-view                      longitude and latitude of the panorama on to the satellite
image as similar as possible to the road pixels in the in-                       images and choose 10K among them to train the satellite
put satellite image. Given the transformed street-view depth                     image to depth and semantic label network. Some training
panorama Iprjd
                , the transformed street-view RGB panorama                       samples for this stage can be found in the first three columns
  r
Ipred , and the corresponding satellite RGB image Isat  r
                                                          , the                  of Fig. 4 (b). This network was trained for 200 epochs.
loss Lrsat is computed in the following four steps. Firstly,                         For the transformed semantics refinement network in
the panoramic ray for each pixel on Iprjd
                                            is calculated as in                  the street-view stage, we utilize the 2K aligned satellite-
Eq. (1). Then, a 3D point (x, y, z) for each pixel (i, j) in                     streetview image pairs for training. The ground truth se-
  d
Iprj can be calculated as:                                                       mantic label of the street-view image is obtained by apply-
                                                                                 ing SegNet [1] directly on our street-view images, which re-
                                    d
                   x = vx (i, j) · Iprj (i, j) + xc ,                            sults in a semantic image with dozens of labels. We further
                                    d
                   y = vy (i, j) · Iprj (i, j) + yc ,                  (2)       merged some of these labels to form a clean semantic image
                                      d                                          with only 4 classes: sky, building, sidewalk, and ground.
                   z = vz (i, j) ·   Iprj (i, j),                                Some training samples for this network can be found in the
         !                                     "
where        vx (i, j), vy (i, j), vz (i, j)       is   the     normalized       4th to 6th columns in Fig. 4 (b). We trained this network

                                                                             5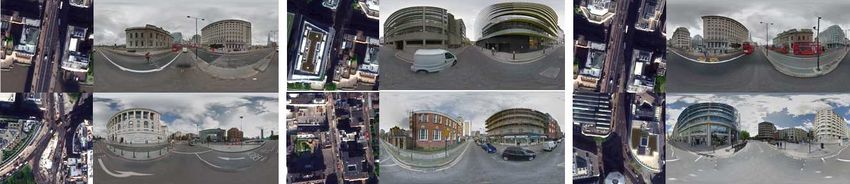
for 50 epochs because the mapping from the input to the            and an ablation study in Sec. 4.2 and 4.3. For more experi-
output is relatively simple, also more epochs can lead to          mental results, please refer to our supplementary material.
over-fitting in practice.
    For the final street-view image generation network, we         4.2. Comparison to State of the Art
use the same 2K image pairs. Also, the default training set-
                                                                       Tab. 1 provides quantitative evaluation results for
tings of BicycleGAN are employed except for the dimen-
                                                                   Pix2Pix [6], Regmi et al. [15], and our method in a test-
sion of the latent vector, which we set to 32, and the ba-
                                                                   ing dataset with 100 samples. Due to the fact that we use
sic feature dimension was set to 96. The external texture
                                                                   more problem-specific knowledge, our method outperforms
encoder has the same architecture as the encoder in Bicy-
                                                                   all competing approaches on all measures. As other ap-
cleGAN. We first train the network on randomly cropped
                                                                   proaches cannot generate depth images, we only evaluate
training pairs for 400 epochs and then train on full image
                                                                   the median depth error of our method, which is 2.62m. We
pairs for 50 epochs.
                                                                   use the same quantitative evaluation measures as in [15] and
                                                                   we can see in Tab. 1 that there is little difference between
4. Experiments                                                     the PSNR, SSIM, and Sharpness Difference (larger is bet-
4.1. Baselines and Evaluation Metrics                              ter) of the three methods, which is reasonable since we have
                                                                   analyzed that the low-level metrics can hardly be utilized to
   Regmi et al. [15] proposes two cGAN-based architec-             judge whether an image is realistic or not.
tures to generate the street-view semantic and RGB image               Fig. 6 shows the qualitative results of these three meth-
given an aerial image patch as input. The “fork architec-          ods. From the figure, we can observe that the quality of the
ture” which uses a weight-shared decoder for the simulta-          generated semantic and RGB images of our method is bet-
neous generation of both the semantic image and the RGB            ter than the other two methods. Firstly, for the street-view
image has been shown to be better than the other “sequence         semantic image, it is obvious that the semantic image of the
architecture” which uses a sequential network generating           work of Regmi et al. is a relatively coarse prediction of the
semantic image first and then the RGB image. We utilized           street-view layout, which may contain significant artifacts
the original code and compared it with the “fork architec-         in some cases (e.g. row 2,3 and 5 in Fig. 6). While for
ture”.                                                             our proposed method, the street-view layout is very close
   Pix2Pix [27, 6] is a well known cGAN-based network              to the ground truth because our geo-transformation layer
which can also be utilized to synthesize street-view images        can transform the true geometric information from the satel-
from the satellite images. Therefore, we also compared to          lite to the street-view. Also, the estimated position of the
this method using the original source code.                        sidewalk in the result of Regmi et al.’s method appears to
   For quantitative assessment we utilize various evalua-          be randomly generated as it does not show many patterns
tion metrics ranging from low-level to high-level. For the         on which building of the scene the sidewalk might appear,
low-level metrics, we follow [15] and use PSNR, SSIM, and          and the sidewalks in our cases are fairly consistent and can
Sharpness Difference metrics, which evaluate the per-pixel         be detected as long as there are buildings. Secondly, for
difference between the predicted image and the ground truth        the quality of the generated RGB image, our method also
image. However, such pixel-wise metrics might not prop-            demonstrates its advantages over the other two methods:
erly assess the visual quality of the images. Therefore, we        Regmi et al. and Pix2Pix, and this should be largely cred-
use the perceptual similarity [25] to compare the images           ited to the high quality of the generated semantic images in
on a higher semantic level. PAlex and PSqueeze denote the          our pipeline. The result of Regmi et al.’s work is slightly
evaluation results based on the backbone of AlexNet and            better than that of Pix2Pix in terms of that Regmi et al.’s
SqueezeNet, respectively. We directly employ their code            work can generate more complete images. However, the
and the provided pre-trained model. For the semantic-level         images generated by both of the two methods are blurred in
metrics we use the pixel-level accuracy and mIoU from              terms of their texture details and only part of the geometric
[10], which is calculated by comparing the semantic labels         configuration can reflect the actual scene the satellite image
of the predicted street-view image and the ground truth im-        captures. Fig. 8 further compares the detailed geometry in-
age generated using SegNet [26]. For the geometric-level           formation of images generated by our method and the state-
metric we utilize the boundary F-score [19] which is de-           of-the-art approaches. We can find that our method can bet-
signed to calculate the overlap between the object bound-          ter recover the building skyline shape. We also noticed that
aries in the predicted and the ground truth images. We also        the fine-detailed objects like trees and buses cannot be re-
compute the median error edepth of the generated panorama          constructed, which is mainly because moving objects (e.g.
depth by taking the depth computed from satellite multi-           buses) and fine-detailed static objects (e.g. trees) cannot be
view stereo reconstruction as the ground truth.                    reconstructed well in the satellite depth and are also incon-
   In the following we present a state-of-the-art comparison       sistent in the cross-view images.

                                                               6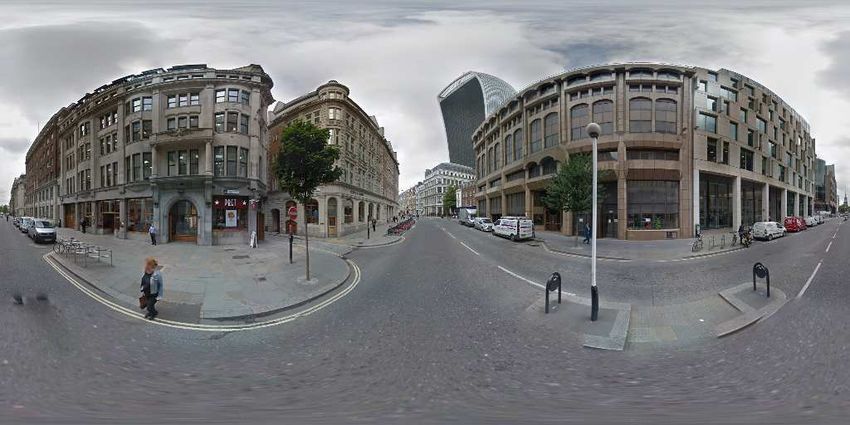
Table 1: Quantitative evaluation of image/semantic quality. Our method consistently outperforms competing approaches.
  Method                   PSNR (↑)   SSIM (↑)     Sharp Diff (↑)    PAlex (↓)       PSqueeze (↓)    mIoU (↑)       Acc. (↑)     Fsem (↑)      edepth (↓)
  Pix2Pix [6]               19.765     0.410          20.514          0.6062           0.4778         0.371          0.434        0.445          N/A
  Regmi et al. [15]         19.839     0.419          20.559          0.5867           0.4430         0.484          0.649        0.486          N/A
  Ours                      19.943     0.440          20.864          0.5816           0.4339         0.548          0.729        0.515          2.62

 Sat. RGB             Street RGB         Our RGB               Our Semantics              [15] RGB              [15] Semantics              [6] RGB
Figure 6: Qualitative comparison. We present a variety of test results of our method, in comparison to Regmi et al. [15],
and Pix2Pix [6]. Our method generates significantly more accurate semantic maps, especially with respect to the skyline, but
also our RGB output looks more realistic and contains fewer artifacts.

4.3. Ablation Study                                                              texture will still be correct but the perception distance of
                                                                                 it will increase. As a result, we can conclude that without
    We further investigate the influence of multiple key com-
                                                                                 depth one may not generate detailed texture in the distant
ponents on the performance of our approach and the de-
                                                                                 areas but still able to get quite good semantics.
tailed quantitative result can be seen in Tab. 2. In the fol-
lowing, we study the impact of three network components.                         Importance of weighted L1 loss.            As mentioned in
Importance of input with depth. In theory, depth can pro-                        Sec. 3.4.2, the weighted L1 loss for Lssat is designed to
vide “scale” information in the generation of local texture.                     reduce the influence of the misalignment problem and im-
Comparing street-view images generated by our method                             prove the quality of the generated street-view semantic im-
(Fig. 7 (d)) and our method w/o depth (Fig. 7 (e)), we can                       ages. To evaluate the importance of the weighted L1 loss,
find that the textures of the objects close to the camera cen-                   we trained our pipeline w/o the weighted L1 loss and out-
ter in the real scene on those images are well generated.                        put the generated street-view semantic image (Fig. 7 (b))
While for those objects far away from the camera center,                         and RGB image (Fig. 7 (f)) for comparison. As can be
the method w/o depth can only generate rough and blurred                         observed, there are some misclassified pixels between the
textures. That explains why the semantic mIoU and accu-                          building class and the road class on the semantic image w/o
racy do not drop too much while the perception distance in-                      weighted L1 loss, also the boundary between the building
creases significantly since the semantic label of the blurred                    roof the sky is mixed in the second row. The misclassifica-

                                                                         7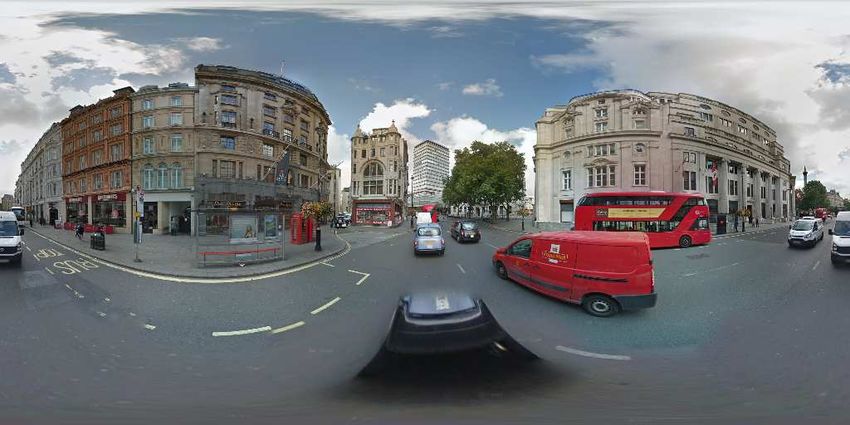
Table 2: Quantitative Ablation Study. We demonstrate the impact of various network components quantitatively.
  Method                             PSNR (↑)         SSIM (↑)         Sharp Diff (↑)      PAlex (↓)        PSqueeze (↓)        mIoU (↑)        Acc. (↑)        Fsem (↑)
  Ours                                 19.943           0.440             20.864            0.5816             0.4339             0.548          0.729           0.515
  w/o depth                            19.991           0.419             20.783            0.6523             0.4539             0.537          0.728           0.534
  w/o weighted L1 loss                 20.170           0.433             20.711            0.5818             0.4364             0.535          0.727           0.505
  w/o geo-transformation layer         20.002           0.401             20.459            0.6518             0.4548             0.509          0.711           0.504

(a) Predicted semantics (b) w/o weighted L1 loss    (c) Ground truth            (d) Ours               (e) w/o depth       (f) w/o weighted L1 loss   (g) w/o geo-transf.
Figure 7: Qualitative Ablation Study. In correspondence to the quantitative ablation study in Tab. 2 we show example result
images for each configuration. Omitting one of the components typically results in worse results.
      Ground truth panorama                              Ours
                                                                                        the buildings generated in the first and third rows are largely
                                                                                        distorted from the ground truth images as shown in Fig. 7
                                                                                        (c). Therefore, the generation of street-view semantics di-
                                                                                        rectly from the predicted satellite depth and semantic im-
                                                                                        ages is more likely to yield geometrically incorrect results
                                                                                        than applying the proposed geo-transformation approach.

                                                                                        5. Conclusion
                                                                                           We presented a novel approach for satellite-to-ground
                                                                                        cross-view synthesis. In particular, we proposed an end-
            Pix2Pix [6]                            Regmi et al. [15]                    to-end trainable pipeline that takes a single satellite image
Figure 8: Comparison of results on skylines. Due to the                                 and generates a geometrically consistent panoramic RGB
explicit use of geometry information, our method estimates                              image. We thus proposed a neural network with a differ-
more accurate skyline profiles. Although the competing                                  entiable geo-transformation layer that links a semantically
methods show results for the same location, the appearance                              labeled satellite depth image with a corresponding seman-
is different mostly due to the incorrect skyline estimation.                            tic panoramic street-view depth image which is finally
                                                                                        used for photo-realistic street-view images generation.
tion on the semantic image further impairs the quality of the                           The geometric consistency across images significantly
generated RGB image as shown in the second row. How-                                    improves the accuracy of the skyline in the panoramic
ever, the misclassification on the semantic image caused by                             ground view which is especially important for urban areas.
the misalignment problem can somehow be relieved in the                                 Our experiments demonstrate that our method outperforms
following network for street-view RGB image generation                                  existing approaches and is able to synthesize more realistic
due to the power of CNN, which the CNN network can tol-                                 street-view panoramic images and in larger variability.
erate some misclassification. This is a reason why the quan-
titative scores in Tab. 2 are not too different.                                        Acknowledgments. Zuoyue Li received funding by a Swiss Data Science
                                                                                        Center Fellowship. Zhaopeng Cui was supported by DSO National Lab-
Importance of the geo-transformation layer. We remove                                   oratories within the project AutoVision. The Multi-view Satellite Images
the geo-transformation layer in our pipeline and feed the                               are acquired from DigitalGlobe. Further, this research was partially sup-
outputs of the satellite stage directly into the street-view                            ported by the Office of Naval Research (Award No. N000141712928) and
stage to see the influence of the geo-transformation layer.                             by the Intelligence Advanced Research Projects Activity (IARPA) via De-
                                                                                        partment of Interior/ Interior Business Center (DOI/IBC) contract number
From Tab. 2, we can see that the semantic mIoU and ac-                                  D17PC00280. The U.S. Government is authorized to reproduce and dis-
curacy drop significantly, while the perceptual score PAlex                             tribute reprints for Governmental purposes notwithstanding any copyright
increases from 0.5816 to 0.6518. This means that both the                               annotation thereon. Disclaimer: The views and conclusions contained
semantic and the perceptual quality of the RGB image gen-                               herein are those of the authors and should not be interpreted as necessar-
                                                                                        ily representing the official policies or endorsements, either expressed or
erated w/o the geo-transformation layer decrease largely.                               implied, of IARPA, DOI/IBC, or the U.S. Government.
This observation is further supported by Fig. 7 (g), where

                                                                                   8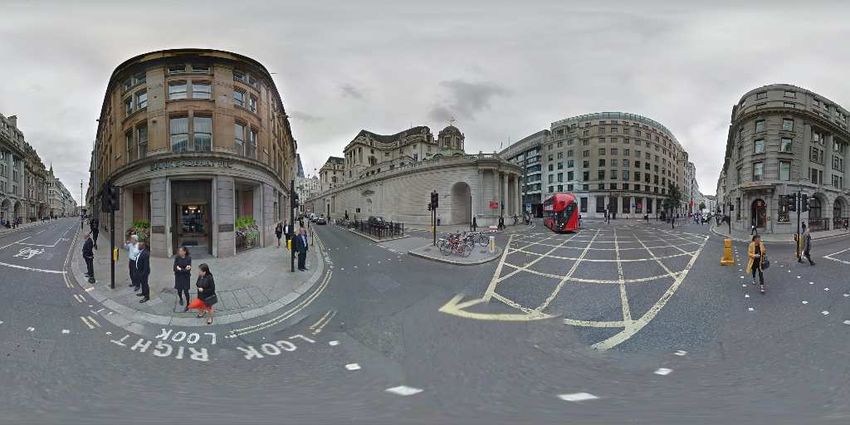
References                                                              [15] Krishna Regmi and Ali Borji. Cross-view image synthesis
                                                                             using conditional gans. In Proceedings of the IEEE Con-
 [1] Vijay Badrinarayanan, Alex Kendall, and Roberto Cipolla.                ference on Computer Vision and Pattern Recognition, pages
     Segnet: A deep convolutional encoder-decoder architecture               3501–3510, 2018. 2, 6, 7, 8
     for image segmentation. IEEE Transactions on Pattern Anal-
                                                                        [16] Krishna Regmi and Ali Borji. Cross-view image synthe-
     ysis and Machine Intelligence, 39(12):2481–2495, 2017. 4,
                                                                             sis using geometry-guided conditional gans. arXiv preprint
     5
                                                                             arXiv:1808.05469, 2018. 2
 [2] Francesco Castaldo, Amir Zamir, Roland Angst, Francesco
                                                                        [17] Krishna Regmi and Mubarak Shah. Bridging the domain
     Palmieri, and Silvio Savarese. Semantic cross-view match-
                                                                             gap for ground-to-aerial image matching. In The IEEE Inter-
     ing. In Proceedings of the IEEE International Conference on
                                                                             national Conference on Computer Vision (ICCV), October
     Computer Vision Workshops, pages 9–17, 2015. 2
                                                                             2019. 2
 [3] Ian Goodfellow, Jean Pouget-Abadie, Mehdi Mirza, Bing
                                                                        [18] Olaf Ronneberger, Philipp Fischer, and Thomas Brox. U-
     Xu, David Warde-Farley, Sherjil Ozair, Aaron Courville, and
                                                                             net: Convolutional networks for biomedical image segmen-
     Yoshua Bengio. Generative adversarial nets. In Advances in
                                                                             tation. In International Conference on Medical Image Com-
     Neural Information Processing Systems, pages 2672–2680,
                                                                             puting and Computer-assisted Intervention, pages 234–241.
     2014. 2
                                                                             Springer, 2015. 3, 4
 [4] Heiko Hirschmuller. Stereo processing by semiglobal match-
                                                                        [19] Towaki Takikawa, David Acuna, Varun Jampani, and Sanja
     ing and mutual information. IEEE Transactions on Pattern
                                                                             Fidler. Gated-scnn: Gated shape cnns for semantic segmen-
     Analysis and Machine Intelligence, 30(2):328–341, 2008. 4
                                                                             tation. In Proceedings of the IEEE International Conference
 [5] Sixing Hu, Mengdan Feng, Rang MH Nguyen, and Gim
                                                                             on Computer Vision, pages 5229–5238, 2019. 6
     Hee Lee. Cvm-net: Cross-view matching network for
                                                                        [20] Yicong Tian, Chen Chen, and Mubarak Shah. Cross-view
     image-based ground-to-aerial geo-localization. In Proceed-
                                                                             image matching for geo-localization in urban environments.
     ings of the IEEE Conference on Computer Vision and Pattern
                                                                             In Proceedings of the IEEE Conference on Computer Vision
     Recognition, pages 7258–7267, 2018. 2
                                                                             and Pattern Recognition, pages 3608–3616, 2017. 2
 [6] Phillip Isola, Jun-Yan Zhu, Tinghui Zhou, and Alexei A
     Efros. Image-to-image translation with conditional adver-          [21] Nam N Vo and James Hays. Localizing and orienting street
     sarial networks. In Proceedings of the IEEE Conference                  views using overhead imagery. In European Conference on
     on Computer Vision and Pattern Recognition, pages 1125–                 Computer Vision, pages 494–509. Springer, 2016. 2
     1134, 2017. 3, 6, 7, 8                                             [22] Scott Workman, Richard Souvenir, and Nathan Jacobs.
 [7] Diederik P Kingma and Jimmy Ba. Adam: A method for                      Wide-area image geolocalization with aerial reference im-
     stochastic optimization. In Proceedings of the International            agery. In Proceedings of the IEEE International Conference
     Conference on Learning Representations, 2015. 5                         on Computer Vision, pages 3961–3969, 2015. 2
 [8] Zhengqi Li and Noah Snavely. Megadepth: Learning single-           [23] Menghua Zhai, Zachary Bessinger, Scott Workman, and
     view depth prediction from internet photos. In Proceedings              Nathan Jacobs. Predicting ground-level scene layout from
     of the IEEE Conference on Computer Vision and Pattern                   aerial imagery. In Proceedings of the IEEE Conference on
     Recognition, pages 2041–2050, 2018. 3                                   Computer Vision and Pattern Recognition, pages 867–875,
 [9] Tsung-Yi Lin, Yin Cui, Serge Belongie, and James Hays.                  2017. 2, 3
     Learning deep representations for ground-to-aerial geolocal-       [24] Qian Zhang, Rongjun Qin, Xin Huang, Yong Fang, and
     ization. In Proceedings of the IEEE Conference on Computer              Liang Liu. Classification of ultra-high resolution orthopho-
     Vision and Pattern Recognition, pages 5007–5015, 2015. 2                tos combined with dsm using a dual morphological top hat
[10] Jonathan Long, Evan Shelhamer, and Trevor Darrell. Fully                profile. Remote Sensing, 7(12):16422–16440, 2015. 4
     convolutional networks for semantic segmentation. In Pro-          [25] Richard Zhang, Phillip Isola, Alexei A Efros, Eli Shechtman,
     ceedings of the IEEE Conference on Computer Vision and                  and Oliver Wang. The unreasonable effectiveness of deep
     Pattern Recognition, pages 3431–3440, 2015. 6                           features as a perceptual metric. In CVPR, 2018. 6
[11] Mehdi Mirza and Simon Osindero. Conditional generative             [26] Bolei Zhou, Hang Zhao, Xavier Puig, Sanja Fidler, Adela
     adversarial nets, 2014. cite arxiv:1411.1784. 4                         Barriuso, and Antonio Torralba. Scene parsing through
[12] Lichao Mou and Xiao Xiang Zhu. Im2height: Height es-                    ade20k dataset. In Proceedings of the IEEE Conference on
     timation from single monocular imagery via fully resid-                 Computer Vision and Pattern Recognition, 2017. 6
     ual convolutional-deconvolutional network. arXiv preprint          [27] Jun-Yan Zhu, Taesung Park, Phillip Isola, and Alexei A
     arXiv:1802.10249, 2018. 3                                               Efros. Unpaired image-to-image translation using cycle-
[13] Rongjun Qin. Rpc stereo processor (rsp)–a software pack-                consistent adversarial networks. In Proceedings of the IEEE
     age for digital surface model and orthophoto generation from            International Conference on Computer Vision, pages 2223–
     satellite stereo imagery. ISPRS Annals of the Photogramme-              2232, 2017. 6
     try, Remote Sensing and Spatial Information Sciences, 3:77,        [28] Jun-Yan Zhu, Richard Zhang, Deepak Pathak, Trevor Dar-
     2016. 4                                                                 rell, Alexei A Efros, Oliver Wang, and Eli Shechtman. To-
[14] Rongjun Qin. Automated 3d recovery from very high reso-                 ward multimodal image-to-image translation. In Advances
     lution multi-view satellite images. In ASPRS (IGTF) annual              in Neural Information Processing Systems, 2017. 3, 4
     Conference, page 10, 2017. 4

                                                                    9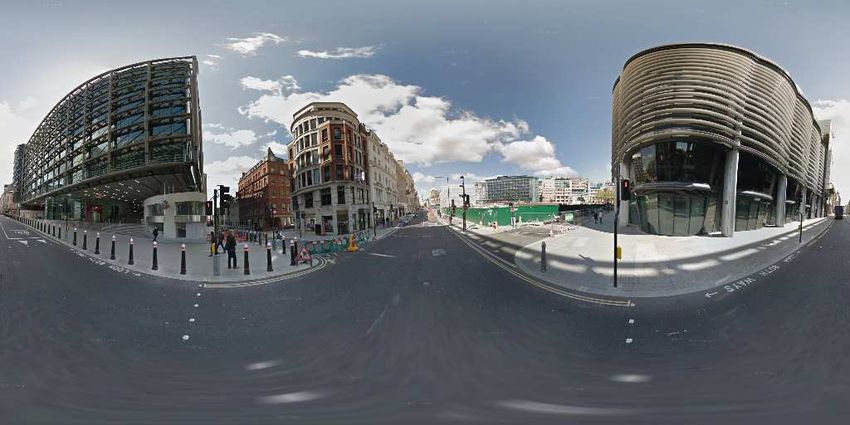
Geometry-Aware Satellite-to-Ground Image Synthesis for Urban Areas
Supplementary Material
Xiaohu Lu1∗ Zuoyue Li2∗ Zhaopeng Cui2† Martin R. Oswald2
Marc Pollefeys2,3 Rongjun Qin1†
1
The Ohio State University 2 ETH Zürich 3 Microsoft
In this supplementary material, we provide further in- We use the default network settings from BicycleGAN’s of-
formation about the generation of our dataset, the detailed ficial implementation2 but changed the dimension of the la-
network architecture, and additional experimental results. tent vector to 32 and changed the number of filters in the
first convolutional layer of all networks to 96. The exter-
1. Dataset nal encoder has exactly the same structure as the encoder in
BicycleGAN [9].
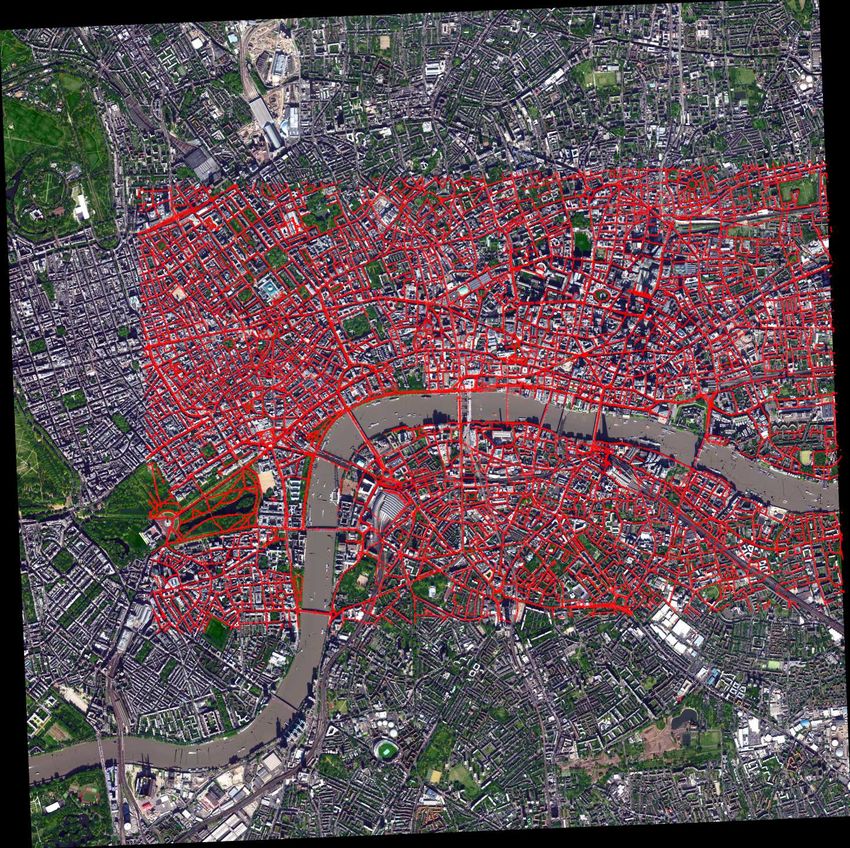
We select an approximate 4km×6km area centered in the
City of London as the region of interest. Then the ground- 3. Additional Experimental Results
truth depth and semantic images are generated from stereo
matching [1, 5, 4] and supervised classification [7], respec- Additional qualitative comparison. Fig. 6 shows addi-
tively. We downloaded the corresponding street-view im- tional results of our method on the test dataset in compari-
ages via the Google Street View Static API1 . Originally, son to Regmi et al. [6], and Pix2Pix [8, 2]. As can be seen,
we obtained 30k street-view panoramas in total with lon- our proposed network performs significantly better on the
gitude, latitude, and orientation information. Fig. 1 shows semantic image generation than the other baseline. Espe-
the coverage of the dataset, where the red lines indicate the cially regarding the correctness, it can be observed that the
trajectories of the downloaded Google street-view panora- generated semantic image of [6] is only a rough guess of
mas. As introduced in Sec. 3.4.1 in the main paper, there are the street-view layout (e.g. row 2, 5, and 7) from the satel-
some misalignments between satellite images and street- lite image without any geometric guidance. While for our
view panoramas due to the error in the GPS information. To method, the street-view layout is almost the same as the
select the well aligned image pairs, we calculate the over- ground truth, because the geometric layout of the scene is
lapping ratios of sky pixels on the geo-transformed street- well preserved from the satellite to the street-view via our
view semantic image and the real street-view semantic im- geo-transformation layer. Furthermore, the estimated posi-
age. The image pairs with overlapping ratio higher than 0.9 tion of the sidewalk in the result of [6] randomly appears
are considered as well aligned (e.g. the first seven rows in in front of buildings. In contrast, our network can learn
Fig. 5), while the rest are considered as not-aligned (the last the relationship between sidewalk and building very well
four rows in Fig. 5). Therefore, we eventually obtain ap- since the geometric information between the two classes
proximate 2k well-aligned satellite-street-view image pairs can be better learned with the transformed street-view depth
for the training phase. image. The improvements of our semantic images even-
tually also lead to significantly better RGB outputs of our
method compared to the baselines. The results of [6] typi-
2. Network Architecture
cally show less artifacts and more plausible street-view im-
Tab. 1 provides a detailed description of the input and ages than Pix2Pix. Nevertheless, the generated images from
output tensor sizes of each sub-network in our pipeline. We both baseline methods have many more blurred texture de-
use the same UNet structure for both UNetsat and UNetstr , tails and only some parts of the scene reflect the actual ge-
of which the network parameters are further detailed in ometric scene configuration corresponding to the satellite
Tab. 2. The BicycleGAN [9] we used consists of a UNet image.
generator, two 3-layer discriminators and a ResNet encoder. Pinhole-camera Test. To testify the flexibility of our net-
work, we also present results for perspective images on the
∗ These authors contributed equally to this work.
† Corresponding
testing dataset which have been generated with the same
authors.
1 https://developers.google.com/maps/documentation/streetview/intro 2 https://github.com/junyanz/BicycleGAN
1Figure 1. Area coverage of our dataset. Originally the satellite images cover an approximately 4km×6km area centered in the City of
London, while the amount of street-view panoramas is around 30k in total.
network without any retraining by replacing the previous also for the pinhole camera setting. Please note that the
panoramic camera model. To this end, we generated images baselines Regmi et al. [6] and Pix2Pix [8, 2] do not gener-
for a virtual pinhole camera using the same optical camera alize and require retraining in order to change the camera
center as the panorama image with the height, width, focal model.
length equal to 256, 256, 64 pixels, and a principle direc-
tion heading to the center of the panorama. Looking at the Discussion on the failure cases. We also provide some
results presented in Fig. 2, it is apparent that our network failure examples in the last three rows of Fig. 6. We no-
generalizes well and produces pleasing street-view images tice that these results do not have a similar skyline layout
compared to the ground truth street-view panoramas. This
2Table 1. Sub-network overview. We detail the input and output dimensions for all major parts in our pipeline.
Model/Layer IO Description Tensor Dimension
Input Satellite RGB Hsat × Wsat × 3
UNetsat
Output Satellite Depth + Semantics Hsat × Wsat × (1 + 3)
Transformed Street-view Depth + Semantics
Input Hstr × Wstr × (1 + 3 + 3)
UNetstr and Resized Satellite RGB
Output Street-view Semantics Hstr × Wstr × 3
Street-view Semantics + Depth
Input Hstr × Wstr × (3 + Nenc )
BicycleGAN and Encoded Latent Vector
Output Street-view RGB Hstr × Wstr × 3
Input Satellite Depth + Semantics Hsat × Wsat × (1 + 3)
Geo-transformation
Output Transformed Street-view Depth + Semantics Hstr × Wstr × (1 + 3)
Input Street-view RGB + Depth Hstr × Wstr × (3 + 1)
Inv. Geo-transformation
Output Inv. Transformed Satellite RGB Hsat × Wsat × 3
Input Satellite RGB Hsat × Wsat × 3
External Encoder
Output Encoded Latent Vector Nenc
Table 2. Detailed UNet network architecture used for the two networks: UNet{sat,str} .
Part Layer Parameters Output Dimension
Conv1+BN+LeakyReLU 4×4, 64, 2 H/2 × W/2 × 64
Conv2+BN+LeakyReLU 4×4, 128, 2 H/4 × W/4 × 128
Conv3+BN+LeakyReLU 4×4, 256, 2 H/8 × W/8 × 256
Conv4+BN+LeakyReLU 4×4, 512, 2 H/16 × W/16 × 512
Encoder
Conv5+BN+LeakyReLU 4×4, 512, 2 H/32 × W/32 × 512
Conv6+BN+LeakyReLU 4×4, 512, 2 H/64 × W/64 × 512
Conv7+BN+LeakyReLU 4×4, 512, 2 H/128 × W/128 × 512
Conv8+BN+LeakyReLU 4×4, 512, 2 H/256 × W/256 × 512
Decov1+BN+ReLU 4×4, 512, 2 H/128 × W/128 × 512
Concat1 cat(Conv7,Decov1) H/128 × W/128 × 1024
Decov2+BN+ReLU 4×4, 512, 2 H/64 × W/64 × 512
Concat2 cat(Conv6,Decov2) H/64 × W/64 × 1024
Decov3+BN+ReLU 4×4, 512, 2 H/32 × W/32 × 512
Concat3 cat(Conv5,Decov3) H/32 × W/32 × 1024
Decov4+BN+ReLU 4×4, 512, 2 H/16 × W/16 × 512
Concat4 cat(Conv4,Decov4) H/16 × W/16 × 1024
Decoder
Decov5+BN+ReLU 4×4, 256, 2 H/8 × W/8 × 256
Concat5 cat(Conv3,Decov5) H/8 × W/8 × 512
Decov6+BN+ReLU 4×4, 128, 2 H/4 × W/4 × 128
Concat6 cat(Conv2,Decov6) H/4 × W/4 × 256
Decov7+BN+ReLU 4×4, 64, 2 H/2 × W/2 × 64
Concat7 cat(Conv1,Decov7) H/2 × W/2 × 128
Decov8+BN+ReLU 4×4, {4,3}, 2 H ×W ×3
Tanh - H × W × {4, 3}
is mainly due to the error in the satellite depth estimation itative examples generated by the models with and with-
and also the misalignment of the satellite image and ground out the loss respectively. As can be seen, the model with
truth images. Moreover, we also noticed that there are very the inverted geo-transformation layer can yield more visi-
small artifacts in our generated panoramas. Actually, this ble white lane lines while the roads generated by the model
kind of artifacts are a known problem of GANs which use without the loss have a relatively uniform gray with sparse
transposed convolution (deconvolution) in the decoder. Ac- lane lines which is not very obvious. We believe that the
cording to [3], this problem could be addressed by replacing layer can help to utilize the evidence provided by satellite
the transposed convolution layer to a combination of bilin- images and can better preserve street patterns. Since we do
ear upsamplling and a general convolution. not have ground truth lane marks, we did not include the
quantitative results.
Qualitative comparison between with and without inv.
geo-transformation layer. In Fig. 3, we provide two qual-
3Satellite RGB Our Semantics Our Depth Our RGB GT Satellite RGB Our Semantics Our Depth Our RGB GT
Figure 2. Image generation results with a pinhole camera model. Given the satellite RGB input, our method can also predict perspective
semantic and depth images, and also generate geometrically correct perspective pinhole-camera images with good texture.
Example 1 Example 2
(a) w/o inverted geo-transf. (b) with inverted geo-transf.
Figure 3. Qualitative comparison between with and without in-
verted geo-transformation layer.
Robustness to content and photometric changes. Strong Example 3 Example 4
photometric changes can influence the performance of the Figure 4. Qualitative comparison regarding to satellite content and
estimated geometry, but typically still lead to plausible photometric changes.
panoramas. Satellites with optical cameras are often in a
sun-synchronous orbit and visit the same place in approxi-
mately the same time of the day. As a result, there are lit-
tle photometric changes on satellite images captured within taken 9 months apart. For image regions with significant ap-
close dates (e.g. within a few weeks). The examples 1 and 2 pearance differences our trained model generates different
in Fig. 4 show a test of our method on two satellite images depth models and the corresponding predicted street-view
with similar contents, leading to very little differences in panorama will no longer preserve the correct geometry of
both texture and layout of the resulting panorama. In con- the scene’s layout. Fortunately, the texture of the predicted
trast, seasonal changes significantly affect sun angles, illu- street-view panorama is still of good quality, which means
mination and structural changes (e.g. cast shadows, snow) that our satellite stage network domains the geometry while
which potentially impact the predicted depth. The exam- the street-view stage controls the texture of the final pre-
ples 3 and 4 in Fig. 4 show satellite images which were dicted street-view panorama.
40.95
0.95
0.94
0.94
0.93
0.92
0.92
0.87
0.87
0.86
0.86
(a) (b) (c) (d) (e) (f) (g)
Figure 5. Samples of our training dataset. Left to right: (a) is the overlapping ratio (the higher the better aligned) of the image, (b) the
satellite image, (c) the ground-truth satellite semantic segmentation, (d) the ground-truth satellite depth, (e) the transformed depth of (d),
(f) the ground-truth street-view semantic, and (g) the ground-truth street-view image, respectively.
5Street RGB Our RGB Our Semantics [6] RGB [6] Semantics [2] RGB
Figure 6. Additional qualitative comparisons. We present additional test results of our method, in comparison to Regmi et al. [6], and
Pix2Pix [2]. The last three rows illustrate failure cases.
6References
[1] Heiko Hirschmuller. Stereo processing by semiglobal match-
ing and mutual information. IEEE Transactions on Pattern
Analysis and Machine Intelligence, 30(2):328–341, 2008. 1
[2] Phillip Isola, Jun-Yan Zhu, Tinghui Zhou, and Alexei A Efros.
Image-to-image translation with conditional adversarial net-
works. In Proceedings of the IEEE Conference on Computer
Vision and Pattern Recognition, pages 1125–1134, 2017. 1, 2,
6
[3] Augustus Odena, Vincent Dumoulin, and Chris Olah. Decon-
volution and checkerboard artifacts. Distill, 2016. 3
[4] Rongjun Qin. Rpc stereo processor (rsp)–a software pack-
age for digital surface model and orthophoto generation from
satellite stereo imagery. ISPRS Annals of the Photogramme-
try, Remote Sensing and Spatial Information Sciences, 3:77,
2016. 1
[5] Rongjun Qin. Automated 3d recovery from very high reso-
lution multi-view satellite images. In ASPRS (IGTF) annual
Conference, page 10, 2017. 1
[6] Krishna Regmi and Ali Borji. Cross-view image synthesis
using conditional gans. In Proceedings of the IEEE Con-
ference on Computer Vision and Pattern Recognition, pages
3501–3510, 2018. 1, 2, 6
[7] Qian Zhang, Rongjun Qin, Xin Huang, Yong Fang, and Liang
Liu. Classification of ultra-high resolution orthophotos com-
bined with dsm using a dual morphological top hat profile.
Remote Sensing, 7(12):16422–16440, 2015. 1
[8] Jun-Yan Zhu, Taesung Park, Phillip Isola, and Alexei A Efros.
Unpaired image-to-image translation using cycle-consistent
adversarial networks. In Proceedings of the IEEE Interna-
tional Conference on Computer Vision, pages 2223–2232,
2017. 1, 2
[9] Jun-Yan Zhu, Richard Zhang, Deepak Pathak, Trevor Darrell,
Alexei A Efros, Oliver Wang, and Eli Shechtman. Toward
multimodal image-to-image translation. In Advances in Neu-
ral Information Processing Systems, 2017. 1
7You can also read