Water Supply (combining Water Conservation) - Activity Management Plan Long Term Plan 2015-2025 - Christchurch City Council

 
CONTINUE READING
Water Supply (combining Water Conservation) - Activity Management Plan Long Term Plan 2015-2025 - Christchurch City Council
Christchurch City Council

Water Supply (combining
    Water Conservation)
           Activity Management Plan

         Long Term Plan 2015–2025
As amended through the Annual Plan 2016/17
                                1 July 2016
Water Supply (combining Water Conservation) - Activity Management Plan Long Term Plan 2015-2025 - Christchurch City Council
Christchurch City Council

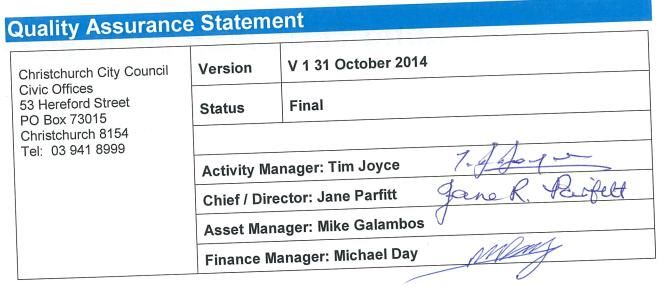
Quality Assurance Statement

 Christchurch City Council   Version      V 1 31 October 2014
 Civic Offices
 53 Hereford Street
 PO Box 73015                Status       Final
 Christchurch 8154
 Tel: 03 941 8999
                             Activity Manager: Tim Joyce

                             Chief / Director: Jane Parfitt

                             Asset Manager: Mike Galambos

                             Finance Manager: Michael Day

Water Supply                                                                  Page ii
Water Supply (combining Water Conservation) - Activity Management Plan Long Term Plan 2015-2025 - Christchurch City Council
Christchurch City Council

Table of Contents
Table of Contents............................................................................................................................. i
List of Tables .................................................................................................................................. ii
1     Key Issues for the Water Supply Activity .................................................................................. 1
    1.1    Community Outcomes ................................................................................................................ 1

    1.2        Effects of growth, demand and sustainability .............................................................................. 1

       Population Growth and Demand .............................................................................................. 1
      Sustainability............................................................................................................................ 1
    1.3    Key Challenges and Opportunities for Water Supply.................................................................... 1

2      Proposed changes to activity ................................................................................................... 3
3     Activity description ................................................................................................................... 4
    3.1     Focusing on what we want to achieve ......................................................................................... 4

    3.2        How we will know we are achieving the outcomes ...................................................................... 4

    3.3        What services we provide ........................................................................................................... 4

    3.4        Benefits and Funding Sources...................................................................................................... 5

    3.5        Key legislation and Council strategies .......................................................................................... 6

4      Levels of service and performance measures .......................................................................... 7
5      Review of cost effectiveness - regulatory functions and service delivery ................................ 20
6     Long Term Infrastructure Strategy ......................................................................................... 21
    6.1   Issues, principles and implications..............................................................................................21

7      Review of cost-effectiveness - infrastructure delivery ............................................................. 24
8     Significant Effects .................................................................................................................. 25
    8.1    Assumptions ..............................................................................................................................26

9      Risk Management .................................................................................................................. 28
10         Improvement Plan ............................................................................................................. 31
11     Operations, Maintenance and Renewals Strategy ............................................................. 32
  11.1   Operations and Maintenance .....................................................................................................32

    11.2       Renewals ...................................................................................................................................32

12         Key Projects ...................................................................................................................... 34
13         Summary of Cost for Activity ............................................................................................. 35
Water Supply (combining Water Conservation) - Activity Management Plan Long Term Plan 2015-2025 - Christchurch City Council
Christchurch City Council

List of Tables
Table 1-1: Key Issues for the Water Supply Activity..........................................................................2
  Table 2-1: Proposed Changes........................................................................................................3
  Table 4-1: Levels of Service ............................................................................................................7

Water Supply                                                                                                                              Page ii
Water Supply (combining Water Conservation) - Activity Management Plan Long Term Plan 2015-2025 - Christchurch City Council
Christchurch City Council

1 Key Issues for the Water Supply Activity
1.1 Community Outcomes
Everything that the Council does in its day-to-day work is focused on achieving community outcomes. All
activities outlined in this plan aim to deliver the results required to achieve these outcomes, contribute to
Council strategies and meet legislative requirements. Likewise, all Council capital and operating expenditure
is directed towards a level of service that moves the community closer to these outcomes now or at some
future point.
The effective management of water supply for Christchurch means achieving the community outcomes that:
 • The Council’s water supplies meet the public’s reasonable needs;
 • Christchurch has clean, safe drinking water;
 • Injuries and risks to public health are minimised;
 • Statutory obligations are met by the Council;
 • Stream and river flows are maintained;
 • Water is used efficiently and sustainably;
 • City assets, financial resources and infrastructure are well managed, now and in the future; and
 • Energy is used more efficiently.
Section 4 shows how these outcomes flow down into and influence the Council’s activities and levels of
service in relation to water supply.

1.2 Effects of growth, demand and sustainability
Population Growth and Demand:
A forecast of population growth has been used to determine where and when Council infrastructure needs to
be developed and at what capacity. Council has considered the influence of changing demographics,
community expectations, industrial/commercial demand, technology and legislation on the demand for this
service. As part of water supply planning Council has:
 • Used the medium growth scenario from the Land Use Recovery Plan (LURP);
 • Assumed the ratio of commercial to residential demand will remain constant;
 • Assumed the water taken per connection targets in the Levels of Service are achieved.
Development of new subdivisions to support growth and house the residential red-zone population is
resulting in a number of projects where growth is a contributing factor. Potential subdivision land in
multiple directions has been made available at the same time under the LURP; this is resulting in
multiple growth projects and adding to the financial pressure on the activity. Required funding to satisfy
known growth projects has been included in the budgets in Section 13. The major growth projects are
listed in Table 10-1 and are identifiable by the project driver column.
Intensification of residential land is encouraged under the LURP and the preceding UDS. Intensification
will see a higher proportion of land used for dwellings and accesses and is anticipated to result in
decreased consumption due to decreased requirements for gardening. Uncertainty over the rate of
intensification makes it difficult to show how intensification will affect demand.
Sustainability:
The Local Government Act 2002 requires local authorities to take a sustainable development approach while
conducting its business. Sustainable development is the fundamental philosophy that is embraced in
Council’s Vision, Mission and Objectives, and that shapes the community outcomes. The levels of service
and the performance measures that flow from these inherently incorporate the achievement of sustainable
outcomes as defined by:
 • The Christchurch City Council Sustainability Policy;
 • Christchurch City Council Biodiversity Strategy 2008-2035;
 • Christchurch City Council Water Supply Strategy 2009-2039;
 • Sustainable Energy Strategy for Christchurch 2008-2018.

1.3 Key Challenges and Opportunities for Water Supply
In working towards the community outcomes and influenced by population growth and demand, Council
faces the challenge of making decisions that prioritise resources to deliver the best mix of services at the

Water Supply                                                                                         Page 1
Water Supply (combining Water Conservation) - Activity Management Plan Long Term Plan 2015-2025 - Christchurch City Council
Christchurch City Council

right level and in a sustainable way. The key challenges and opportunities that have been prioritised by
Council are below in Table 1-1.
Table 1-1

 Key Issue                       Discussion

 Earthquake and the              A series of earthquakes including a magnitude 7.1 on 4 September 2010, a magnitude 6.3 on
 Earthquake Rebuild              22 February 2011 and over 10,000 aftershocks, 2 of which were greater than 6.0 and 59
                                 greater than 5.0. These seismic events caused a significant level of damage to the water
                                 supply network. The majority of Earthquake damage occurred in Lyttelton and the Eastern
                                 Suburbs of Christchurch City.
                                 The Infrastructure Rebuild Management Office (IRMO) and Stronger Christchurch
                                 Infrastructure Rebuild Team (SCIRT) were created for repair and rebuild of horizontal
                                 infrastructure. The Infrastructure Rebuild will not repair all damage in the water network.
                                 In addition, areas of residential land within Christchurch City were red-zoned by the Canterbury
                                 Earthquake Recovery Authority (CERA) and are being compulsorily acquired by the Crown.
                                 The future of this land and infrastructure passing through the land is uncertain; however for
                                 planning purposes it has been assumed that all water supply infrastructure in the residential
                                 red-zone will become redundant.
                                 Some pump stations, reservoirs and access to reservoirs are on land red-zoned due to rock-
                                 fall danger. The future of these assets is also yet to be determined. For planning purposes it
                                 is assumed these assets will remain as-is. Any changes will increase required funding.

 AC pipes are approaching the    Population and building booms in the 1950s and 1960s resulted in the construction of many
 end of their effective lives.   Christchurch suburbs. The majority of water supply infrastructure during this time period was
                                 constructed from asbestos cement (AC) pipes. These pipes are now approaching the end of
                                 their lives resulting in the need for significantly increased renewals expenditure over the next 30
                                 years.

 Water supply to Lyttelton       Water is supplied to Lyttelton, Governors Bay and Diamond Harbour through three pipes, two
 Harbour Basin.                  passing through the Port Hills in the rail tunnel and one in the road tunnel. The rail tunnel pipes
                                 are approaching the end of their lives and will require renewal in the near future. Permission to
                                 renew these pipes from the tunnel owners is uncertain and costs will increase significantly
                                 should Council need to find an alternate route.
                                 Development of a potable water source within the Lyttelton Harbour Basin could increase the
                                 resilience of Lyttelton Harbour Basin water supplies and defer or eliminate the rail tunnel
                                 pipeline renewal requirements.

 Christchurch CBD Trunk          The Eastern Terrace trunk main feeding the Christchurch CBD have been condition assessed
 Mains                           with the results showing renewal is required by 2020. This is a large main with multimillion
                                 dollar renewals costs. Other significant mains in the area are also approaching the end of their
                                 lives.
                                 Water demand may have changed since the construction of these trunk mains and an
                                 investigation into future requirements is recommended to ensure renewals are not financing
                                 unneeded infrastructure. The investigation should be completed in the 2015-16 period to leave
                                 sufficient time for Eastern Terrace trunk main renewal should it be deemed necessary.

 Concurrent growth areas         Land for potential subdivision has been made available in multiple directions at the same time
                                 under the LURP. Meeting the needs of multiple growth areas concurrently is adding to the
                                 quantity of growth driven projects the Council must deliver.

Water Supply                                                                                                             Page 2
Water Supply (combining Water Conservation) - Activity Management Plan Long Term Plan 2015-2025 - Christchurch City Council
Christchurch City Council

2 Proposed changes to activity
Table 2-1 summarises the proposed changes for the management of the Water Supply activity since the Three Year Plan 2013-16 Activity Management Plan.
Table 2-1 Proposed changes to activity

                                                                                                      Level of significance? What                          Options for consultation and
 Key Change                                         Reason                                            investigations are needed?                           engagement

Pressure management project – reduction of high    Improved asset life.                              Computer modelling has been completed.               Consultation and engagement is
pressure areas of the City.                        Reduced power consumption.                        A pilot trial in one zone has been implemented.      being provided for through
                                                                                                     Results from this trial will be used to inform the   Community Board information
                                                   Reduced leakage.                                                                                       sessions, discussions with Property
                                                                                                     decision regarding roll-out over the whole city.
                                                   Reduced service interruptions.                                                                         Council and other stakeholders.
                                                   Improvements to disaster recovery processes.

Waterwise campaign discontinued                    We have not seen a good correlation between the   Low level of significance.                           Water education through school
                                                   campaign and conservation.                        Funding better applied to leak repairs in post       programs.
                                                   Other mechanisms – such as direct billing for     earthquake environment
                                                   excess consumption is far more effective in
                                                   reducing demand

In FY 15/16 conduct investigation into universal   Study to look at the pros and cons of universal   Reasonably significant as could potential move       Plenty of opportunities to consult with
water billing.                                     billing for water and wastewater services.        from targeted rate to capacity and consumption       the community both during and after
                                                                                                     charging basis. Could have significant benefits in   the study is completed.
                                                                                                     reducing water consumption and thereby deferring
                                                                                                     future capital investment to meet peak summer day
                                                                                                     demand.

Water Supply                                                                                                                                                                           Page 3
Christchurch City Council

3 Activity description
3.1 Focusing on what we want to achieve
Council undertakes activities in order to deliver on the community outcomes for Christchurch. The
outcomes that relate most directly to the management of the city’s water supply network are that:
 • The Council’s water supplies meet the public’s reasonable needs;
 • Christchurch has clean, safe drinking water;
 • Injuries and risks to public health are minimised;
 • Statutory obligations are met by the Council;
 • Stream and river flows are maintained (applies to Banks Peninsula surface water intakes);
 • Water is used efficiently and sustainably;
 • City assets, financial resources and infrastructure are well managed, now and in the future; and
 • Energy is used more efficiently.

In addition to these community outcomes the Council also aims to ensure the quality and quantity of aquifer
supplied water takes is protected.

3.2 How we will know we are achieving the outcomes
We will know we are achieving the above outcomes when we see the following results:
•     Statutory requirements and reasonable customer expectations regarding water quality are met
      and ensure clean, safe water is supplied to acceptable taste, clarity and odour levels while health risks
      are managed;
•     Statutory requirements and reasonable customer expectations regarding water quantity and
      continuity of supply are met by applying best practice maintenance, renewal, upgrade and
      acquisition practices that are sustainable and efficient;
•     Water supply schemes are operated in a way that minimises adverse social, cultural environmental
      and economic effects and meets statutory requirements in these areas.
The activities that follow in section 4 and the levels of service within them are all linked to the above results
to ensure Councils stays focused on moving towards the community outcomes. This link aims to confirm
why we are doing the activities – that they will realistically move us closer to our goals – and that service
delivery remains relevant to strategic direction.

3.3     What services we provide
This activity includes the following services:
 • Supplying potable water to properties, through the provision of infrastructure to take, treat (where
     appropriate), store, deliver, maintain, manage and monitor the supply.
Ongoing strategies to deliver this service include a balanced mix of maintenance and renewal to preserve
levels of service plus a capital response where appropriate to respond to increasing demands. Assets
installed during historical growth periods are now at or nearing the end of their lives, combined with ongoing
renewal of earthquake damaged assets a significant increase in renewals is required over the next 30 years.
Much of the infrastructure to serve growth is delivered by private developers then vested in Council. Council
standards including the Infrastructure Design Standard (IDS), Construction Standard Specification (CSS)
Approved Water Supply Installer program and Approved Materials List are maintained and updated on a
regular basis to ensure these new assets meet Council requirements. Recent updates have focussed on
resilience of assets with the aim of improving the restoration of service in future disasters.
In addition investigations are underway to review options available that may change the network
configuration allowing improved system management, cost reductions and enabling the network to recover
more quickly from future earthquake events. This work was planned under the water strategy but has been
accelerated due to the major infrastructure rebuild (water pressure zoning project).
The water supply activity includes 7 water treatment plants, 114 pump stations, 32 reservoirs, 7 stream
intakes, 156 water wells, 1,730km of water mains and 1,630km of sub-mains supplying water to

Water Supply                                                                                           Page 4
Christchurch City Council

approximately 160,000 customers in Christchurch, Lyttelton, Diamond Harbour, Governors Bay, Akaroa,
Takamatua, Duvauchelle Bay, Pigeon Bay, Little River, Birdlings Flat and Wainui.

3.4 Benefits and Funding Sources

3.4.1 Who Benefits?

Who benefits?                                                                                      Key:

Individual                                                                                         Full

Identifiable part of the community                                                                 Majority

Whole community                                 Full                                               Some

Explanatory Comments:
The entire community benefits from this activity.
There are health and environmental benefits from an organised collection processing system for the whole
community.

3.4.2 Who pays?

Funding -                 Other revenue             General rate             Targeted rate
Fees / User               Grants &
Charges                   Subsidies
        10%                        4%                        0%                      86%
       Some                                                                       Majority

Note, Funding Split % is derived from the ‘Summary of Cost for Activity’ ( section 13).

Key:                                                                                              Typically
Full           All or almost all the cost is funded from that source. If the comment is            95%+
               made in the general or targeted rate columns it does not preclude making
               minor charges for the service but indicates that the charges are a
               negligible part of the fund.
Majority       The majority of the activity is funded from this source.                            50%+
Some           Some revenue is derived from this source.
Christchurch City Council

3.5 Key legislation and Council strategies
Key legislation relating to the Council water supplies includes: Local Government Act 1974 and 2002,
Health Act 1956, Health (Drinking Water) Amendment Act 2007; Resource Management Act 1991,
Drinking-Water Standard for New Zealand (as revised), and Water Related Services Bylaw 2008.

Relevant Council strategies include the Christchurch City Council Water Supply Strategy 2009-39 and the
Christchurch City Council Surface Water Strategy 2009-39.

Water Supply                                                                                    Page 6
Christchurch City Council

4 Levels of service and performance measures
Table 4-1 summarises the levels of service and performance measures for the Water Supply activity. Shaded rows are the levels of service and performance
measures to be included in the Long Term Plan. Non-shaded rows are non-LTP management level measures, agreed with and reported to Council but not included
as part of the community consulted document.

Table 4-1

                                Results              Method of                                                Future Performance (targets)           Future
                                                  Measurement (We                                                                                Performance
                              (Activities will                                                                                                    (targets) by
Performance Standards       contribute to these   will know we are meeting
                                                                                                             Year 1      Year 2      Year 3
   Levels of Service        results, strategies   the level of service if…..)     Current     Benchmarks                                             Year 10
                             and legislation)                                   Performance
      (we provide)                                                                                                                                  2024/25
                                                                                                             2015/16    2016/17      2017/18

Supplying potable water to properties, through the provision of infrastructure to take, treat (where appropriate), store, deliver, maintain, manage and
monitor the supply.

Water Supply                                                                                                                               Page 7
Christchurch City Council

                                       Results               Method of                                                             Future Performance (targets)                      Future
                                                          Measurement (We                                                                                                        Performance
                                     (Activities will                                                                                                                             (targets) by
Performance Standards                                     will know we are meeting
                                   contribute to these
                                                          the level of service if…..)       Current                               Year 1          Year 2          Year 3             Year 10
   Levels of Service               results, strategies                                                       Benchmarks
                                    and legislation)                                      Performance
         (we provide)                                                                                                                                                                2024/25
                                                                                                                                 2015/16         2016/17          2017/18

12.0.1          Supply             Statutory                                            2013/14:   17.2    National              12.0.1.1:         12.0.1.1:       12.0.1.1:         12.0.1.1:
                continuous         requirements and                                     2012/13:   16.4    Performance         Number of         Number of        Number of         Number of
                potable water to   reasonable                                           2012/11:   17.6    Review (30 TLAs) –  unplanned         unplanned        unplanned         unplanned
                                                                                                                              interruptions     interruptions    interruptions   interruptions per
                all customers.     customer                                             2009/10:   11.8    12/13: av 20
                                                                                                                                per 1,000         per 1,000        per 1,000     1,000 properties
                                   expectations                                                            (range 2-100)        properties        properties    properties per       per year:
                                   regarding water                                                                              per year:         per year:          year:              ≤50
                                   quantity and                                                            WaterCare Auckland      ≤18               ≤19              ≤20
                                   continuity of supply                                                    96.7% repaired
                                   are met                                                                 within 5 hours
                                                                                        2013/14: 1.64                             12.0.1.2:       12.0.1.2:        12.0.1.2:        12.0.1.2:
                                                                                        2012/13: 1.42                            Number of       Number of        Number of        Number of
                                                                                                                                 unplanned       unplanned        unplanned        unplanned
                                                                                        2009/10: 0.74
                                                                                                                                interruptions   interruptions    interruptions    interruptions
                                                                                                                                greater than    greater than    greater than 4   greater than 4
                                                                                                                                   4 hours         4 hours      hours duration   hours duration
                                                                                                                                duration per    duration per    per week each    per week each
                                                                                                                                 week each       week each           year:            year:
                                                                                                                                    year:           year:            ≤1.75            ≤2.0
                                                                                                                                     ≤1.7           ≤1.7

                                                                                        2013/14:   96.9%
                                                                                                                                   12.0.1.3:    12.0.1.3:      12.0.1.3:          12.0.1.3:
                                                                                        2012/13:   86.0%                         Percentage   Percentage    Percentage of      Percentage of
                                                                                        2011/12:   44%                             of urgent    of urgent    urgent urban       urgent urban
                                                                                        2009/10:   98.6%                         urban leaks  urban leaks        leaks       leaks responded
                                                                                                                                responded to responded to responded to to within 1 hour of
                                                                                                                                within 1 hour within 1 hour within 1 hour of   the leak being
                                                                                                                                  of the leak  of the leak  the leak being        reported:
                                                                                                                                     being        being        reported:            ≥95%
                                                                                                                                   reported:    reported:        ≥95%
                                                                                                                                     ≥90%         ≥90%

 Water Supply                                                                                                                                                                       Page 8
Christchurch City Council

                                       Results               Method of                                                     Future Performance (targets)                   Future
                                                          Measurement (We                                                                                             Performance
                                     (Activities will                                                                                                                  (targets) by
Performance Standards                                     will know we are meeting
                                   contribute to these
                                                          the level of service if…..)       Current                       Year 1        Year 2         Year 3             Year 10
   Levels of Service               results, strategies                                                     Benchmarks
                                    and legislation)                                      Performance
       (we provide)                                                                                                                                                       2024/25
                                                                                                                         2015/16       2016/17        2017/18

12.0.1          Supply             Statutory                                            2013/14:   97.5%                   12.0.1.4:    12.0.1.4:      12.0.1.4:           12.0.1.4:
(cont’d)        continuous         requirements and                                     2012/13:   97.0%                 Percentage   Percentage   Percentage of        Percentage of
                potable water to   reasonable                                           2011/12:   75.5%                   of urgent    of urgent    urgent rural     urgent rural leaks
                                                                                                                          rural leaks  rural leaks       leaks           responded to
                all customers.     customer                                             2009/10:   96.5%
                                                                                                                        responded to responded to responded to        within 2 hours of
                                   expectations                                                                             within 2     within 2   within 2 hours      the leak being
                                   regarding water                                                                       hours of the hours of the    of the leak          reported:
                                   quantity and                                                                           leak being   leak being  being reported:           ≥95%
                                   continuity of supply                                                                    reported:    reported:        ≥95%
                                   are met                                                                                   ≥90%         ≥90%

                                                                                                                         12.0.1.5:     12.0.1.5:       12.0.1.5:          12.0.1.5:
                                                                                        2013/14:   83.9%
                                                                                                                        Percentage    Percentage    Percentage of      Percentage of
                                                                                        2012/13:   71.3%                of medium     of medium      medium leaks      medium leaks
                                                                                        2011/12:   54.7%                   leaks         leaks      repaired within   repaired within 1
                                                                                        2009/10:   98.3%                 repaired      repaired      1 working day     working day of
                                                                                                                          within 1      within 1        of being       being reported
                                                                                                                        working day   working day      reported             ≥90%
                                                                                                                         of being      of being          ≥90%
                                                                                                                         reported      reported
                                                                                                                           ≥90%          ≥90%

                                                                                        2013/14:   83.2%                 12.0.1.6:     12.0.1.6:       12.0.1.6:          12.0.1.6:
                                                                                        2012/13:   79.9%                Percentage    Percentage    Percentage of      Percentage of
                                                                                        2011/12:   56.0%                  of minor      of minor      minor leaks       minor leaks
                                                                                        2009/10:   97.2%                    leaks         leaks     repaired within   repaired within 3
                                                                                                                         repaired      repaired      3 working day     working day of
                                                                                                                          within 3      within 3        of being       being reported.
                                                                                                                        working day   working day      reported.            ≥90%
                                                                                                                          of being      of being         ≥90%
                                                                                                                         reported.     reported.
                                                                                                                           ≥90%          ≥90%

 Water Supply                                                                                                                                                             Page 9
Christchurch City Council

                                       Results               Method of                                                         Future Performance (targets)                      Future
                                                          Measurement (We                                                                                                    Performance
                                     (Activities will                                                                                                                         (targets) by
Performance Standards                                     will know we are meeting
                                   contribute to these
                                                          the level of service if…..)         Current                        Year 1          Year 2           Year 3             Year 10
   Levels of Service               results, strategies                                                        Benchmarks
                                    and legislation)                                        Performance
       (we provide)                                                                                                                                                              2024/25
                                                                                                                            2015/16         2016/17          2017/18

12.0.1          Supply             Statutory                                                                                   12.0.1.7:     12.0.1.7:     12.0.1.7:             12.0.1.7:
                                                           From the time that the                                               Median        Median        Median           Median response
(cont’d)        continuous         requirements and                                       New LoS – No past
                                                           local authority receives                                        response time response time response time              time for
                potable water to   reasonable              notification to the time the   performance.
                                                                                                                                   for           for    for attendance        attendance for
                all customers.     customer                service personnel reach                                           attendance    attendance   for urgent call-      urgent call-outs
                                   expectations            the site. Measured as the                                          for urgent    for urgent   outs following          following
                                   regarding water         median response time.                                               call-outs     call-outs    notification:         notification:
                                   quantity and            Water Supply mandatory
                                                                                                                               following     following     ≤ 1 hour              ≤ 1 hour
                                                           performance measure 3a.
                                   continuity of supply                                                                     notification: notification:
                                   are met                                                                                     ≤ 1 hour      ≤ 1 hour

                                                           From the time that the local
                                                                                                                              12.0.1.8:      12.0.1.8:      12.0.1.8:
                                                           authority receives            New LoS – No past                  Median time Median time Median time to                12.0.1.8:
                                                           notification to the time that performance.
                                                                                                                             to resolve     to resolve   resolve urgent       Median time to
                                                           the service personnel
                                                                                                                            urgent call-   urgent call-     call-outs          resolve urgent
                                                           confirm resolution of the
                                                                                                                           outs following outs following    following        call-outs following
                                                           fault or interruption.
                                                                                                                            notification:  notification:  notification:          notification:
                                                           Measured as the median
                                                                                                                             ≤ 5 hours      ≤ 5 hours      ≤ 5 hours              ≤ 5 hours
                                                           response time.
                                                           Water Supply mandatory
                                                           performance measure 3b.

                                                                                                                             12.0.1.9:      12.0.1.9:         12.0.1.9:          12.0.1.9:
                                                           From the time that the                                             Median         Median            Median        Median response
                                                                                          New LoS – No past                  response       response       response time          time for
                                                           local authority receives
                                                           notification to the time the
                                                                                          performance.                        time for       time for      for attendance     attendance for
                                                           service personnel reach                                          attendance     attendance      for non-urgent    non-urgent call-
                                                           the site. Measured as the                                          for non-       for non-          call-outs      outs following
                                                           median response time.                                            urgent call-   urgent call-       following        notification:
                                                           Water Supply mandatory                                          outs following      outs          notification:       ≤ 3 days
                                                           performance measure 3c.                                          notification:   following          ≤ 3 days
                                                                                                                              ≤ 3 days    notification:≤
                                                                                                                                              3 days

 Water Supply                                                                                                                                                                    Page 10
Christchurch City Council

                                   Results               Method of                                                         Future Performance (targets)                         Future
                                                      Measurement (We                                                                                                       Performance
                                 (Activities will                                                                                                                            (targets) by
Performance Standards                                 will know we are meeting
                               contribute to these
                                                      the level of service if…..)          Current                       Year 1           Year 2           Year 3               Year 10
   Levels of Service           results, strategies                                                         Benchmarks
                                and legislation)                                         Performance
       (we provide)                                                                                                                                                            2024/25
                                                                                                                         2015/16         2016/17          2017/18

12.0.1      Supply             Statutory
                                                       From the time that the                                            12.0.1.10:      12.0.1.10:        12.0.1.10:          12.0.1.10:
(cont’d)    continuous         requirements and                                        New LoS – No past
                                                       local authority receives                                         Median time     Median time     Median time to      Median time to
            potable water to   reasonable              notification to the time that
                                                                                       performance.
                                                                                                                         to resolve      to resolve      resolve non-        resolve non-
            all customers.     customer                the service personnel                                            non-urgent      non-urgent      urgent call-outs    urgent call-outs
                               expectations            confirm resolution of the                                          call-outs       call-outs         following           following
                               regarding water         fault or interruption.                                             following       following       notification:       notification:
                               quantity and            Measured as the median                                           notification:   notification:       ≤ 4 days            ≤ 4 days
                               continuity of supply    response time.                                                     ≤ 4 days        ≤ 4 days
                                                       Water Supply mandatory
                               are met                 performance measure 3d.

                                                                                       New LoS – No past                 12.0.1.11:      12.0.1.11:       12.0.1.11:           12.0.1.11:
                                                                                       performance.                      Number of       Number of        Number of            Number of
                                                                                                                        continuity of   continuity of    continuity of        continuity of
                                                                                                                           supply          supply           supply         supply complaints
                                                                                                                         complaints      complaints     complaints per         per 1,000
                                                                                                                          per 1,000       per 1,000         1,000            customers per
                                                                                                                         customers       customers      customers per            year:
                                                                                                                          per year:       per year:          year:                ≤4
                                                                                                                            ≤ 2.5           ≤ 2.5             ≤3

                                                                                       New LoS – No past                 12.0.1.12:      12.0.1.12:         12.0.1.12:      12.0.1.12:
                                                                                       performance.                      Number of       Number of         Number of        Number of
                                                                                                                        pressure or     pressure or        pressure or   pressure or flow
                                                                                                                            flow            flow        flow complaints   complaints per
                                                                                                                         complaints      complaints          per 1000   1000 connections
                                                                                                                          per 1000        per 1000        connections       per year:
                                                                                                                        connections     connections         per year:          ≤4
                                                                                                                          per year:       per year:             ≤3
                                                                                                                             ≤2              ≤2

 Water Supply                                                                                                                                                                  Page 11
Christchurch City Council

                                    Results              Method of                                                           Future Performance (targets)                          Future
                                                      Measurement (We                                                                                                          Performance
                                  (Activities will                                                                                                                              (targets) by
Performance Standards                                 will know we are meeting
                                contribute to these
                                                      the level of service if…..)       Current                            Year 1           Year 2            Year 3               Year 10
   Levels of Service            results, strategies                                                    Benchmarks
                                 and legislation)                                     Performance
         (we provide)                                                                                                                                                              2024/25
                                                                                                                           2015/16         2016/17            2017/18

12.0.2        Ensure potable                                                        2009-14: Ba      Lower Hutt: Bb         12.0.2.1:      12.0.2.1:      12.0.2.1:                 12.0.2.1:
              water is          Statutory                                                            Hastings City: Uu      MoH risk       MoH risk       MoH risk             MoH risk grading
              supplied in       requirements and                                                     Pegasus: Bb         grading of the grading of the grading of the             of the urban
              accordance with   reasonable                                                           (secure gw)          urban water    urban water     urban water            water supplies
                                customer                                                                                    supplies       supplies        supplies             (excluding NW
              the Drinking                                                                                                 (excluding     (excluding   (excluding NW                  zone):
                                expectations
              Water                                                                                                        NW zone):     NW zone):          zone):                     Ba
              Standards for     regarding water
                                                                                                                               Ba             Ba             Ba
              New Zealand       quality are met

                                                                                                                           12.0.2.2:      12.0.2.2:
                                                                                    2009-14: Da      Prebbleton: De        MoH risk       MoH risk           12.0.2.2:             12.0.2.2:
                                                                                                                         grading of the grading of the       MoH risk          MoH risk grading
                                                                                                     Kaiapoi: Uc
                                                                                                                           NW water       NW water         grading of the      of the NW water
                                                                                                     (non-secure gw)     supply zone: supply zone:           NW water            supply zone:
                                                                                                                              Da             Da            supply zone:               Ba
                                                                                                                                                                Ba

                                                                                                                            12.0.2.3:       12.0.2.3:
                                                                                    2009-14: Uu      Methven: Ud         MoH grading MoH grading               12.0.2.3:            12.0.2.3:
                                                                                                     Waipara town: Ee    of rural water of rural water     MoH grading of       MoH grading of
                                                                                                                           supplies:       supplies:         rural water          rural water
                                                                                                                               Uu               Uu             supplies:           supplies:
                                                                                                                          --------------  --------------           Cc                  Cc
                                                                                                                           Non-LTP         Non-LTP            --------------      --------------
                                                                                                                            12.0.2.4:       12.0.2.4:          Non-LTP             Non-LTP
                                                                                    2013/14:   300   Only 4 TLAs known    Number of       Number of            12.0.2.4:            12.0.2.4:
                                                                                    2012/13:   400   to have an active    highest risk    highest risk        Number of           Number of
                                                                                    2011/12:   112   backflow              properties      properties        highest risk         highest risk
                                                                                    2010/11:   90    programme           assessed and      assessed           properties           properties
                                                                                                                          required to    and required       assessed and         assessed and
                                                                                    2009/10:   268
                                                                                                                             install        to install       required to       required to install
                                                                                                                            backflow        backflow       install backflow         backflow
                                                                                                                          prevention      prevention          prevention          prevention
                                                                                                                            devices          devices            devices             devices
                                                                                                                              ≥100            ≥100                ≥100                 ≥50
                                                                                                                          --------------  --------------      --------------      --------------

 Water Supply                                                                                                                                                                      Page 12
Christchurch City Council

                                  Results               Method of                                                               Future Performance (targets)                         Future
                                                     Measurement (We                                                                                                             Performance
                                (Activities will                                                                                                                                  (targets) by
Performance Standards                               will know we are meeting
                              contribute to these
                                                    the level of service if…..)        Current                                 Year 1           Year 2            Year 3             Year 10
   Levels of Service          results, strategies                                                        Benchmarks
                               and legislation)                                      Performance
       (we provide)                                                                                                                                                                  2024/25
                                                                                                                              2015/16          2016/17           2017/18

                                                                                                                               Non-LTP          Non-LTP           Non-LTP            Non-LTP
                                                                                                                               12.0.2.5:        12.0.2.5:         12.0.2.5:          12.0.2.5:
                                                                                   2013/14:   84%      WaterCare Auck        Proportion of    Proportion of     Proportion of      Proportion of
                                                                                                                              customers        customers         customers          customers
                                                                                   2012/13:   88%       target ≤ 5
                                                                                                                             satisfied with   satisfied with    satisfied with   satisfied with the
                                                                                   2011/12:   85%      complaints / 1000       the water        the water         the water        water supply
                                                                                   2009/10:   92%      Achieved 4.6 / 1000       supply           supply       supply service:    service: ≥90%
                                                                                                                                service:         service:           ≥90%
                                                                                                                                 ≥85%             ≥87%

12.0.2      Ensure potable    Statutory
                                                     Mandatory performance                                                     12.0.2.6:       12.0.2.6:          12.0.2.6:           12.0.2.6:
(cont’d)    water is          requirements and                                     New LoS –           National
                                                     measures encompassing                                                   Number of        Number of          Number of       Number of water
            supplied in       reasonable             complaints received about
                                                                                   2013/14: 0.95       Performance
                                                                                                                             water clarity    water clarity     water clarity    clarity complaints
            accordance with   customer               the networked reticulation                        Review of water       complaints       complaints       complaints per         per 1,000
            the Drinking      expectations           systems for any of the                            suppliers in New       per 1,000        per 1,000           1,000           customers per
            Water             regarding water        following reasons:                                Zealand 12/13yr        customers       customers        customers per            year:
            Standards for     quality are met                                                          across clarity and      per year:       per year:            year:                 ≤1
            New Zealand                              (a) drinking water clarity                        taste                     ≤ 1.5           ≤ 1.5               ≤1
                                                     (b) drinking water taste                          Av = 3.2
                                                                                   New LoS –           (range 0.5 – 14.5)      12.0.2.7:       12.0.2.7:          12.0.2.7:          12.0.2.7:
                                                     (c) Drinking water odour                                                 Number of       Number of          Number of       Number of water
                                                                                   2013/14: 0.75
                                                                                                                              water taste     water taste        water taste     taste complaints
                                                     (d) drinking water pressure                                              complaints      complaints       complaints per        per 1,000
                                                     or flow                                                                   per 1,000       per 1,000           1,000          customers per
                                                                                                                              customers       customers        customers per           year:
                                                     (e) continuity of supply                                                  per year:       per year:            year:               ≤1
                                                                                                                                  ≤1              ≤1                 ≤1
                                                    Water Supply mandatory
                                                    performance measures 4a-f.     New LoS – No past                          12.0.2.8:        12.0.2.8:          12.0.2.8:         12.0.2.8:
                                                                                                                             Number of        Number of          Number of       Number of water
                                                                                   performance.
                                                                                                                             water odour      water odour       water odour      odour complaints
                                                                                                                             complaints       complaints       complaints per       per 1,000
                                                                                                                              per 1,000        per 1,000           1,000          customers per
                                                                                                                             customers        customers        customers per           year:
                                                                                                                              per year:        per year:            year:              ≤ 0.5
                                                                                                                                ≤ 0.5            ≤ 0.5              ≤ 0.5

 Water Supply                                                                                                                                                                        Page 13
Christchurch City Council

                                  Results               Method of                                                            Future Performance (targets)                        Future
                                                     Measurement (We                                                                                                         Performance
                                (Activities will                                                                                                                              (targets) by
Performance Standards                               will know we are meeting
                              contribute to these
                                                    the level of service if…..)       Current                               Year 1         Year 2            Year 3              Year 10
   Levels of Service          results, strategies                                                        Benchmarks
                               and legislation)                                     Performance
       (we provide)                                                                                                                                                             2024/25
                                                                                                                           2015/16         2016/17          2017/18

                                                                                  New LoS – No past                         12.0.2.9:      12.0.2.9:          12.0.2.9:         12.0.2.9:
                                                                                  performance.                             Number of      Number of          Number of         Number of
                                                                                                                             drinking       drinking       drinking water    drinking water
                                                                                                                              water          water           pressure or    pressure or flow
                                                                                                                           pressure or    pressure or     flow complaints    complaints per
                                                                                                                               flow           flow            per 1,000     1,000 customers
                                                                                                                           complaints     complaints       customers per        per year:
                                                                                                                            per 1,000      per 1,000            year:              ≤4
                                                                                                                           customers      customers              ≤3
                                                                                                                            per year:      per year:
                                                                                                                                ≤2             ≤2

                                                                                                                           12.0.2.10:      12.0.2.10:       12.0.2.10:          12.0.2.10:
                                                                                  New LoS – No past   National             Number of       Number of        Number of           Number of
                                                                                  performance.        Performance         continuity of   continuity of    continuity of       continuity of
                                                                                                      Review 13/14 will      supply          supply           supply        supply complaints
                                                                                                      provide NZ wide      complaints      complaints     complaints per        per 1,000
                                                                                                      data from 2015 on     per 1,000       per 1,000         1,000           customers per
                                                                                                                           customers       customers      customers per           year:
                                                                                                                            per year:       per year:          year:               ≤4
                                                                                                                              ≤ 2.5           ≤ 2.5             ≤3

12.0.2                                                                                                                      12.0.2.11:    12.0.2.11:         12.0.2.11:        12.0.2.11:
                                                     Mandatory performance
(cont’d)    Ensure potable    Statutory                                           New LoS – No past                        Proportion of Proportion of      Proportion of     Proportion of
                                                     measures encompassing
            water is          requirements and       complaints received about    performance.                              complaints    complaints         complaints        complaints
            supplied in       reasonable             the networked reticulation                                           remediated to remediated to      remediated to    remediated to the
            accordance with   customer               systems for any of the                                                     the           the         the customers’       customers’
            the Drinking      expectations           following reasons:                               ditto                 customers’    customers’        satisfaction:     satisfaction:
                                                                                                                           satisfaction: satisfaction:         ≥95%              ≥95%
            Water             regarding water         (f) the local authority’s                                               ≥95%          ≥95%
            Standards for     quality are met        response to any of these
            New Zealand                              issues.

                                                    Water Supply mandatory
                                                    performance measures 4a-f.

 Water Supply                                                                                                                                                                   Page 14
Christchurch City Council

                            Results               Method of                                                             Future Performance (targets)                        Future
                                               Measurement (We                                                                                                          Performance
                          (Activities will                                                                                                                               (targets) by
Performance Standards                         will know we are meeting
                        contribute to these
                                              the level of service if…..)          Current                             Year 1          Year 2           Year 3              Year 10
   Levels of Service    results, strategies                                                             Benchmarks
                         and legislation)                                        Performance
      (we provide)                                                                                                                                                         2024/25
                                                                                                                      2015/16         2016/17          2017/18

                                                                                                                       12.0.2.12:      12.0.2.12:        12.0.2.12:         12.0.2.12:
                                                                              2013/14: 99.5%                         Proportion of   Proportion of     Proportion of      Proportion of
                                              Water Supply mandatory          2012/13: 100%                              urban           urban       urban residents    urban residents
                                              performance measures 1a & 1b.                                            residents       residents     supplied water     supplied water
                                                                              2011/12: 100%
                                                                                                                        supplied        supplied      compliant with     compliant with
                                                                              2010/11: *                                 water            water        the DWSNZ          the DWSNZ
                                                                              2009/10: 99.8%                           compliant       compliant          bacterial          bacterial
                                                                                                                        with the        with the        compliance         compliance
                                                                              (* excluded from annual                   DWSNZ           DWSNZ        criteria:≥ 99.8%   criteria:≥ 99.8%
                                                                              compliance survey due                     bacterial       bacterial
                                                                              to earthquakes)                         compliance      compliance
                                                                                                                        criteria:       criteria:≥
                                                                                                                        ≥ 99.8%          99.8%

                                                                                                                       12.0.2.13:      12.0.2.13:       12.0.2.13:         12.0.2.13:
                                                                              2013/14:   100%                        Proportion of   Proportion of    Proportion of      Proportion of
                                              Water Supply mandatory          2012/13:   92%                              rural           rural      rural residents    rural residents
                                              performance measures 1a & 1b.   2011/12:   82%                           residents       residents     supplied water     supplied water
                                                                              2010/11:   81%                            supplied        supplied     compliant with     compliant with
                                                                              2009/10:   67%                             water           water        the DWSNZ          the DWSNZ
                                                                                                                       compliant       compliant         bacterial          bacterial
                                                                                                                        with the        with the       compliance         compliance
                                                                                                                        DWSNZ           DWSNZ            criteria:          criteria:
                                                                                                                        bacterial       bacterial        ≥ 99.8%            ≥ 99.8%
                                                                                                                      compliance      compliance
                                                                                                                        criteria:       criteria:
                                                                                                                        ≥ 99.5%         ≥ 99.8%

Water Supply                                                                                                                                                               Page 15
Christchurch City Council

                                  Results              Method of                                                                       Future Performance (targets)                        Future
                                                    Measurement (We                                                                                                                    Performance
                                (Activities will                                                                                                                                        (targets) by
Performance Standards         contribute to these   will know we are meeting
                                                                                                                                     Year 1           Year 2            Year 3
   Levels of Service          results, strategies   the level of service if…..)          Current                 Benchmarks                                                                Year 10
                               and legislation)                                        Performance
       (we provide)                                                                                                                                                                       2024/25
                                                                                                                                     2015/16         2016/17           2017/18

12.0.2      Ensure potable                          Water Supply mandatory
(cont’d)    water is          Statutory             performance measures 1a & 1b.
                                                                                    2013/14: 79%               National               12.0.2.14:     12.0.2.14:      12.0.2.14:            12.0.2.14:
            supplied in       requirements and                                      2012/13: 79%               Performance          Proportion of  Proportion of  Proportion of          Proportion of
            accordance with   reasonable                                            2011/12: 79%               Review 13/14 will        urban          urban     urban residents       urban residents
                              customer                                                                                                residents      residents   supplied water        supplied water
            the Drinking                                                            2010/11: *                 provide NZ wide         supplied   supplied water compliant with         compliant with
            Water             expectations                                          2009/10: 79%               data from 2015 on
                              regarding water                                                                                           water     compliant with   the DWSNZ             the DWSNZ
            Standards for                                                                                                          compliant with the DWSNZ          protozoal             protozoal
                              quality are met
            New Zealand                                                             (* excluded from annual                         the DWSNZ        protozoal      compliance            compliance
                                                                                    compliance survey due to                          protozoal     compliance        criteria:             criteria:
                                                                                    earthquakes)                                     compliance   criteria:≥ 79%      ≥ 99.8%               ≥ 99.8%
                                                                                                                                       criteria:
                                                                                                                                        ≥ 79%

                                                                                                                                       12.0.2.15:     12.0.2.15:        12.0.2.15:        12.0.2.15:
                                                                                                                                    Proportion of   Proportion of     Proportion of     Proportion of
                                                    Water Supply mandatory
                                                    performance measures 1a & 1b.                                                  rural residents rural residents   rural residents   rural residents
                                                                                                                                        supplied   supplied water    supplied water    supplied water
                                                                                    2013/14:   11%             ditto                      water    compliant with    compliant with    compliant with
                                                                                    2012/13:   11%                                 compliant with the DWSNZ           the DWSNZ         the DWSNZ
                                                                                    2011/12:   11%                                   the DWSNZ        protozoal         protozoal         protozoal
                                                                                    2010/11:   11%                                     protozoal     compliance        compliance        compliance
                                                                                    2009/10:   11%                                    compliance       criteria:         criteria:         criteria:
                                                                                                                                         criteria:     ≥ 99.8%           ≥ 99.8%           ≥ 99.8%
                                                                                                                                         ≥ 80%
                                                                                                                                      (subject to
                                                                                                                                         Akaroa
                                                                                                                                       treatment
                                                                                                                                          plant
                                                                                                                                     successfully
                                                                                                                                    completed on
                                                                                                                                          time)

 Water Supply                                                                                                                                                                            Page 16
Christchurch City Council

                                     Results               Method of                                                            Future Performance (targets)                        Future
                                                        Measurement (We                                                                                                         Performance
                                   (Activities will                                                                                                                              (targets) by
Performance Standards                                   will know we are meeting
                                 contribute to these
                                                        the level of service if…..)        Current                            Year 1           Year 2            Year 3             Year 10
   Levels of Service             results, strategies                                                        Benchmarks
                                  and legislation)                                       Performance
         (we provide)                                                                                                                                                              2024/25
                                                                                                                              2015/16         2016/17           2017/18

                                                                                      New LoS – No past   Ditto – non-LTP    --------------  --------------    --------------      --------------
                                                                                      performance.        level               Non-LTP         Non-LTP           Non-LTP             Non-LTP
                                                                                                                             12.0.2.16:      12.0.2.16:        12.0.2.16:          12.0.2.16:
                                                                                                                            Proportion of   Proportion of     Proportion of      Proportion of
                                                                                                                                water       water supplies    water supplies     water supplies
                                                                                                                            supplies with    with a MoH        with a MoH         with a MoH
                                                                                                                                a MoH         approved          approved        approved Water
                                                                                                                              approved      Water Safety      Water Safety        Safety Plan:
                                                                                                                            Water Safety         Plan:             Plan:              100%
                                                                                                                                 Plan:          100%              100%                 (risk
                                                                                                                                100%             (risk             (risk         management)
                                                                                                                                 (risk      management)       management)
                                                                                                                            management)

12.0.3        Monitor the        Statutory                                            2013/14:   26.2                          12.0.3.1:        12.0.3.1:         12.0.3.1:        12.0.3.1:
              condition of the   requirements and                                     2012/13:   23.1                         Number of        Number of         Number of     Number of breaks
              water supply       reasonable                                           2011/12:   17.5                        breaks per       breaks per        breaks per       per 100km of
                                                                                                                              100km of          100km of      100km of water water main each
              network.           customer                                             2009/10:   16.5
                                                                                                                             water main       water main         main each     year. (excluding
                                 expectations                                                                                 each year.       each year.           year.          3rd party
                                 regarding water                                                                            (excluding 3rd   (excluding 3rd    (excluding 3 rd
                                                                                                                                                                                  damage):
                                 quantity and                                                                                    party            party       party damage):         ≤ 50
                                 continuity of supply                                                                         damage):         damage):             ≤ 30
                                 are met                                                                                         ≤ 28             ≤ 29

                                                                                                                               12.0.3.2:      12.0.3.2:           12.0.3.2:       12.0.3.2:
                                                                                      2013/14:   126.6                        Number of      Number of           Number of    Number of breaks
                                                                                      2012/13:   130.1                       breaks per     breaks per          breaks per      per 100km of
                                                                                      2011/12:   83                         100km of sub- 100km of sub-       100km of sub-    sub-main each
                                                                                      2009/10:   81.5                         main each      main each           main each    year. (excluding
                                                                                                                                 year.          year.               year.         3rd party
                                                                                                                            (excluding 3rd (excluding 3rd      (excluding 3rd    damage):
                                                                                                                                 party          party         party damage):        ≤ 175
                                                                                                                              damage):       damage):              ≤ 135
                                                                                                                                ≤ 130          ≤ 130

 Water Supply                                                                                                                                                                      Page 17
Christchurch City Council

                                     Results               Method of                                                     Future Performance (targets)                     Future
                                                        Measurement (We                                                                                               Performance
                                   (Activities will                                                                                                                    (targets) by
Performance Standards                                   will know we are meeting
                                 contribute to these
                                                        the level of service if…..)        Current                     Year 1          Year 2           Year 3            Year 10
   Levels of Service             results, strategies                                                    Benchmarks
                                  and legislation)                                       Performance
         (we provide)                                                                                                                                                     2024/25
                                                                                                                      2015/16          2016/17         2017/18

12.0.4        Maintain                                                                2013/14:   0.30                    Annual         Annual      Annual average Annual average
              pumping            Statutory                                            2012/13:   0.34                average kWh average kWh            kWh of       kWh of electricity
              efficiency in      requirements and                                     2011/12:   0.41                 of electricity of electricity electricity used  used per m3 of
              city’s             reasonable                                           2010/11:   0.38                 used per m3 used per m3 of per m3 of water      water pumped:
                                 customer                                                                               of water         water         pumped:            ≤ 0.35
              reticulation                                                                                              pumped:        pumped:          ≤ 0.37
                                 expectations
              (excluding rural                                                                                           ≤ 0.37         ≤ 0.37
              townships)         regarding water
                                 quantity and
                                 continuity of supply
                                 are met

12.0.5        Ensure consent                                                          2013/14:   0                     Number of        Number of       Number of        Number of
              compliance.        Minimises adverse                                    2012/13:   0                   infringement     infringement    infringement     infringement
                                 social, cultural                                                                      notices for      notices for     notices for  notices for major
                                                                                      2011/12:   0
                                 environmental and                                    2010/11:   0                      major or         major or        major or      or persistent
                                 economic effects                                                                      persistent       persistent      persistent      breaches of
                                 and meets statutory                                                                  breaches of      breaches of     breaches of        resource
                                 requirements                                                                           resource         resource        resource        consents
                                                                                                                        consents         consents        consents    regarding water
                                                                                                                       regarding        regarding   regarding water supply network
                                                                                                                     water supply     water supply supply network      operation as
                                                                                                                        network           network     operation as  reported by ECan
                                                                                                                     operation as     operation as     reported by        or CCC:
                                                                                                                      reported by      reported by   ECan or CCC:           Zero
                                                                                                                        ECan or      ECan or CCC:          Zero
                                                                                                                          CCC:             Zero
                                                                                                                          Zero

 Water Supply                                                                                                                                                            Page 18
Christchurch City Council

                                      Results               Method of                                                                  Future Performance (targets)                           Future
                                                         Measurement (We                                                                                                                  Performance
                                    (Activities will                                                                                                                                       (targets) by
Performance Standards                                    will know we are meeting
                                  contribute to these
                                                         the level of service if…..)        Current                                  Year 1            Year 2            Year 3               Year 10
   Levels of Service              results, strategies                                                            Benchmarks
                                   and legislation)                                       Performance
         (we provide)                                                                                                                                                                         2024/25
                                                                                                                                    2015/16           2016/17            2017/18

12.0.6                                                   The percentage of real        New LoS – No past
                Maintenance       Statutory              water loss from the local     performance.                                  ≤ 15.0%         ≤ 15.2% water     ≤ 15.4% water     ≤ 20% water loss
                of the            requirements and       authority’s networked                                                      water loss            loss              loss
                reticulation      reasonable             reticulation system –         Current system total
                network -         customer               including a description of    loss est 22.4% (public
                Reduce the        expectations
                                                         the methodology used to       and private) - 12.3%
                percentage of     regarding water        calculate this –              from public only)
                real water loss   quantity and
                from the local    continuity of supply   Water Supply mandatory
                authority’s       are met                performance measure 2.
                networked
                reticulation
                system

12.0.7          Demand                                    Water Supply mandatory                                Benchmarks to be    Average 298       Average 298       Average 298          Average 298
                                                          performance measure 5.                                sourced            litres per day,   litres per day,   litres per day,   litres per day, per
                Management
                -Manage the                                                                                                          per resident      per resident      per resident          resident
                average
                consumption
                of drinking
                water per day,
                per residents

 Water Supply                                                                                                                                                                                Page 19
Christchurch City Council

5 Review of cost effectiveness - regulatory functions and
  service delivery
Service: Water Supply
                                Current Arrangements
 Governance               Funding                  Delivery                                   Estimated
                                                                                              Cost
 CCC                      CCC                            CCC and CCO (City Care Ltd)          $32.0 million

     Arrangements that cannot reasonably be
            changed in next two years
     Governed by          Contract or binding            Not cost effective to review            Option
      Legislation              agreement
                       Christchurch City Council         This contract has been in place      No review
                       Maintenance of City Water         for less than 6 years and has        necessary at
                       and Wastewater Network            greater than 2 years remaining.      this time
                       Contract.
Network operation and communication systems maintenance are completed in-house by CCC.
General network maintenance is carried out by City Care Limited under the Christchurch City Council
Maintenance of City Water and Wastewater Network Contract. The contract commenced 1 July 2010 with
an initial 5 year duration and extensions for high performance. Including extensions the contract will expire
in at least 2017 with further extensions moving this out to 2019. Award of the contract was on a non-
competitive basis, however an external, independent review of contract rates was conducted to ensure
Council obtained market value.
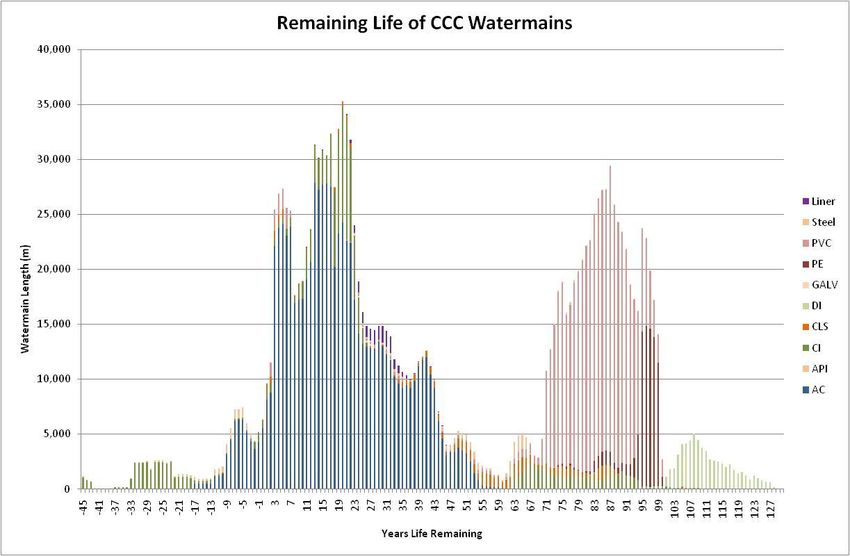
Water Supply                                                                                       Page 20
Christchurch City Council

6 Long Term Infrastructure Strategy
6.1    Issues, principles and implications
6.1.1 Residential Red Zone
SCIRT supplied information indicates 10.16km of water supply reticulation infrastructure is within
the residential red zone areas. It is unclear if this includes the areas red zoned due to rock fall risk
so this number may increase. For planning purposes it has been assumed all water supply
infrastructure in the Avon River residential red zone will be decommissioned due to redundancy.
A number of water supply pump stations, reservoirs and associated access tracks are on land red-
zoned due to rock-fall danger. Current plans are to retain these assets as-is since the time staff
are on-site is very low. Should health and safety or resiliency issues require changes to these
plans a funding increase will be required.
6.1.2 Earthquake Legacy
Long term effects on the water supply network resulting from the earthquake are not well
understood. SCIRT has completed works to return service to all customers and renewed a number
of water mains. Approximately 50% of the water mains that meet the renewals criteria will not be
renewed by SCIRT and remain for Council to renew.
Ground settlement is continuing following the earthquakes. Further water supply failures are
possible from this settlement.
Movement during the earthquakes potentially caused microscopic cracks in water mains.
Microscopic cracks in asbestos cement (AC) water mains decrease the pipe life leading to
premature failure. The extent of this issue and potential outcome to the water supply network are
not currently known.
Earthquake damaged wastewater and storm water networks pose a hazard to the water supply
network, especially on hillsides. During storm events wastewater or storm water escaping their
respective damaged networks can scour material surrounding water pipes leading to a failure.
This occurred in two occasions in 2014.
6.1.3 Aging Network
The first public water supplies serving the Christchurch Area were Akaroa and Lyttelton in 1890,
Sydenham in 1903 and then Christchurch CBD and Southern Christchurch in 1908. Technology
advances lead to different pipe materials depending on installation dates. Initially cast iron pipes
with an expected life of 120 years were used. Post WW2 through to the mid 1980’s asbestos
cement (AC, 60 year life) became the material of choice until health concerns led to a move to
plastic pipes. The post-war “baby boom” period was a significant time of expansion for
Christchurch with approximately 50% of the water supply reticulation network consisting of AC
pipes installed at this time.
Both the AC and early cast iron pipes are approaching the end of their effective lives are require
renewal. Renewals requirements are predicted to rise significantly over the next 15 years followed
by 30 years of elevated renewals rates.
6.1.4 Pressure Management Project
A proposed pressure management project will see the Christchurch City water supply network split
from the seven existing pressure zones into approximately fifteen new zones. The pressure in the
majority of new zones will be reduced from current levels. Positive effects of this project include
reduced pumping costs, reduced water leakage, increased in pipe life and increased resiliency with
earlier return to service following natural disasters.
Although an extended service life can be expected for pipes in pressure reduced zones this only
applies to pipes in good condition. Pipe assets that are already in poor condition or at the end of
their lives will not be granted life extensions.

Water Supply                                                                                  Page 21
Christchurch City Council

6.1.5 Network Optimisation
Since network installation population demographics, land use, customer habits and technologies
have all changed resulting in changing local water demand. Local demand changes are also
anticipated as a result of growth and the pressure management project.
Renewal provides an opportunity to review the demand in an area and install the correctly sized
infrastructure to meet demand. Installation of correctly sized infrastructure optimises the network
and avoids additional costs from undersized assets or overinvestment. Demand models and the
network model should be fully developed, updated and calibrated to provide tools for correct sizing
on infrastructure.
6.1.6 Climate Change
Climate change has the potential to affect both supply of, and demand for water.
Warmer drier conditions are likely to result in increased water demand for irrigation and
recreational use; however as an increase in land use intensity is expected to occur at the same
time there will be a decrease in irrigated land and therefore the overall impact is unclear.
Christchurch City, Lyttelton, Governors Bay and Diamond Harbour are fed from groundwater
sources. An increase in rainfall in the aquifer recharge areas means the Christchurch City and
Lyttelton Harbour Basin water supplies should not experience adverse changes to water quantity
or quality. Local water quality issues mat arise should sea level changes however move the fresh
water/salt water interface inland. This could be remedied through decommissioning of coastal
pump stations and replacement with inland pump stations with trunk mains to the coastal pressure
zones.
Wainui water supply scheme is also groundwater fed. Rainfall reductions are predicted for the
Wainui aquifer recharge zone; however due to the low flows extracted for the water supply scheme
the climate change rainfall decrease is not anticipated to affect availability of water.
Due to salt-water contamination of the existing bore a new water source for the Birdlings Flat water
supply scheme is currently under investigation. As the water source is not yet established it is not
possible to determine how it could be affected by climate change.
Akaroa, Takamatua, Duvauchelle Bay, Pigeon Harbour and Little River water supply schemes are
fed from surface water sources. The climate change predictions of decreased rainfall will result in
reduced river flows and are likely to directly impact the quantity of water available to be taken for
water supplies. High flow periods of turbid water are expected as a result of the increased rainfall
intensity. This turbid water is not suitable for treatment in the existing water treatment plants and
therefore treatment plant upgrades and significantly increased storage may be required to maintain
water supplies to these areas in the future.
6.1.7 System Losses
SCIRT leak detection work following the earthquakes returned the average water supply network
leakage rate to 129L per connection per day or 14.9%. These numbers are based on night-flow
field testing of the Christchurch City and Lyttelton Harbour Basin water supplies and do not include
rural Banks Peninsula supplies. No recent testing has been carried out on Banks Peninsula
supplies but some testing is proposed for the current year.
The figure of 129L/connection/day was achieved following significant expenditure by SCIRT. It is
unlikely this expenditure can be maintained by Council and therefore the leakage rate will increase.
Council is aiming to maintain leakage below the pre-quake rate of 165L/connection/day.
Due to water conservation efforts the percentage water loss will increase even if actual leakage
rates remain constant.
6.1.8 Reliability of Supply

Water Supply                                                                              Page 22
Christchurch City Council

A decreased reliability of supply is anticipated, primarily due to increased failures in the aging
reticulation network. Reticulation failures cause short term (approximately 5 hour) outages to
groups of individual properties but are typically limited to one block or less.
Larger scale supply limitations commonly occur in Lyttelton, Akaroa and Takamatua. Lyttelton
large scale outages are caused by high demand from the Port Company to refill cruise ship water
tanks resulting in Exeter reservoir being drained. Possible remedies for this are to increase the
supply to the reservoir or limit maximum flows to the port.
Summer water restrictions are often imposed on Akaroa and Takamatua. A project to construct a
new water treatment plant, increased storage volume and merge the existing three schemes into a
single scheme is underway. On completion this is expected to avoid the need for future
restrictions.
Salt water contamination has occurred at the Birdlings Flat water supply bore rendering it
unusable. In the short term water tankers from Christchurch are providing water to Birdlings Flat
while a new water source is developed.
The decentralised nature of Christchurch City water sources provides a resilient network unlikely to
be affected by failures at individual bores or pump stations.
Christchurch City hillside pressure zones are each fed from a single reservoir and Banks peninsula
water supplies are each fed from a single treatment plant. Lack of redundancy means reservoir or
treatment plant failures could cause supply interruptions; however water storage means short-term
faults will not result in supply interruptions.
Lyttelton Harbour Basin water supplies have a number of areas where resiliency is an issue, these
include:
       •       Supply pipes to Lyttelton through the Port Hills;
       •       Supply pipes on the seabed from Lyttelton to Diamond Harbour; and
       •       The supply pipe from Lyttelton to Governors Bay.
Access to the Port Hills and seabed pipes is limited and requires specialised equipment and
expertise. Catastrophic failure of any of these pipes or the Port Hills tunnels has the potential to
cut water supply to individual settlements of the Lyttelton Harbour Basin as a whole. Actual
interruptions will depend on the duration of outages as water is stored in reservoirs in the Lyttelton
Harbour Basin. Rail tunnel pipes are approaching the end of their lives and a project to renew
them is in the LTP, resiliency will be considered as part of this project. The Governors Bay pipeline
is constructed of a known poor quality material and may fail prematurely, a project to replace this
pipeline will be submitted in the near future.

Water Supply                                                                                 Page 23
You can also read