Policy Paper Water Scarcity - PFZW
←
→
Page content transcription
If your browser does not render page correctly, please read the page content below
Policy Paper
Water Scarcity

                               1        Introduction
Release date:                  Pensioenfonds Zorg en Welzijn (PFZW) is the pension fund of, for and by the Dutch healthcare
25 August, 2020                and welfare sector. At PFZW, employees and employers jointly aim to ensure a good collective
                               pension in a liveable world. Our primary task is to provide our beneficiaries with the best
                               possible pension. Hence, we first and foremost strive for an optimal risk-adjusted return on
                               our investments. We believe that a good pension is worth more in a liveable word. That is
                               why investing in a sustainable manner is important to us. We are convinced that integrating
                               Environmental, Social and Governance (ESG) issues leads to improved financial performance in
                               the long run. We believe that financial and social return go hand in hand.

                               This paper defines water scarcity as a global challenge, as a systemic risk and investment
                               opportunity, and explains why PFZW cares about it.

                               The opposite of water scarcity is water security, which the UN defines as “The capacity of a
                               population to safeguard sustainable access to adequate quantities of acceptable quality water for
                               sustaining livelihoods, human well-being, and socio-economic development, for ensuring protection
                               against water-borne pollution and water-related disasters, and for preserving ecosystems in a climate
                               of peace and political stability”1.

                               1.   http://www.unwater.org/publications/water-security-infographic/

Policy Paper Water Scarcity                                                                                                   1 / 21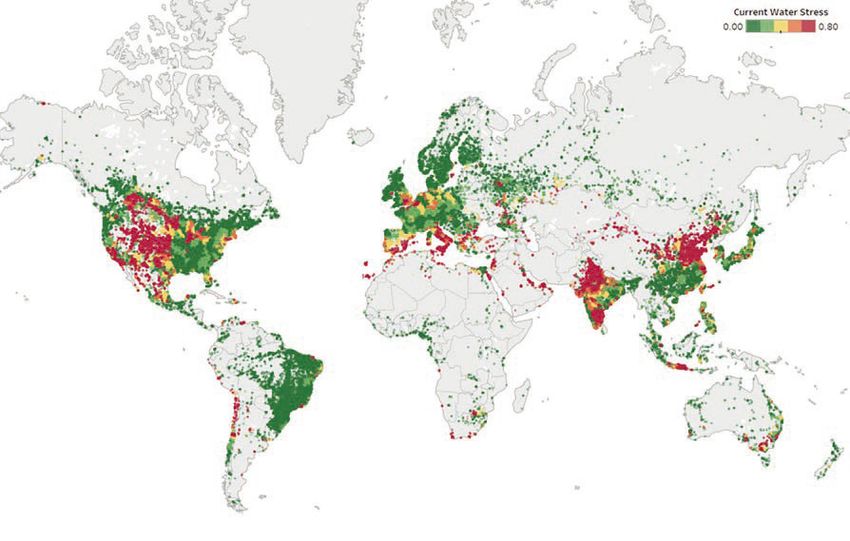
That water scarcity requires special attention (like other ESG externalities) is because water
                                    is underpriced relative to its value. The consequences are that it is both overused and
                                    underinvested. Similarly, the social cost of water pollution is rarely paid by the polluter, which
                                    worsens (clean) water scarcity.

                                    The graphic below summarizes the key challenges with regard to water scarcity that this paper
                                    will address.

            There has been a                          By 2030,           Water scarcity currently                     By 2050, an additional

               55% drop
                                           global demand for                  affects more than
                                                                                                                     2.3 billion
                                                                                       40%
                                            water is expected
                    in globally                    to grow by                                          people can be expected to be living in

                                                   50%
               available fresh                                                            of the    areas with severe waterstress, especially
              water per capita                                                            global    in North and South Africa and South and
                   since 1960                                                         population                                Central Asia

        Agriculture accounts for          Water scarcity, exacerbated by climate                          Worldwide, the total cost of water
          70%        of all water
                    withdrawals
                                         change, could cost some regions up to
                                                          6% of theirGDP
                                                                                                         insecurity to the global economy is
                                                                                                                                estimated at

                                                                                                           US$500 billion
           globally and for over

                 90% in the                 The 5th assessment of the Intergovernmental Panel on
                                                      Climate Change (IPCC) projects that for each
                                                                                                           annually. Including environmental
               majority of Least                                                                          impacts, this figure may rise to 1%
            Developed Countries
                        (LDCs)...                 degree of global warming, approximately      7%           of global gross domestic product
                                                                                                                                       (GDP)
                                                      of the global population will be exposed to a
                   and  70%                                                 decrease of renewable
                more food will be
                 needed by 2050                                  water resources of at least   20%

Source: UNU-INWEH. Water            This paper serves three purposes:
Crisis Report (2017)                •	Being transparent to our external stakeholders about PFZW’s views on water scarcity
                                    •	Communicating views by PFZW on water scarcity to the companies it invests in2.
                                    •	Providing guidance for PFZW asset managers for integrating water scarcity in investment
                                       decisions.

                                    The policy paper will first define the importance of water scarcity, both in general terms and
                                    more specifically for PFZW as an institutional investor and ‘universal owner’ of assets. It proceeds
                                    with a framework to address water scarcity in the portfolio as an investment risk and as an
                                    investment opportunity. The paper concludes with the position PFZW takes with regard to the
                                    various initiatives on water scarcity, and the instruments and steps for PGGM and external
                                    portfolio managers to take to implement PFZW policy.

                                    2.    As NBIM does with its water expectation document, see
                                    https://www.nbim.no/en/the-fund/responsible-investment/risk-management/water-management/

Policy Paper Water Scarcity                                                                                                                    2 / 21
2 The importance of water scarcity
Physical need3
Even on the blue planet fresh water is scarce since of all the water on earth 97.5% is salty and
a further 1.75% is frozen at the poles, in glaciers or in permafrost. So all life and all economic
activity on earth relies on just 0.75% of water either as surface water or groundwater. It is
important to distinguish consumptive water use (water that is evaporated and ‘lost’ to the
atmosphere) and water abstractions—where water is used and returned to rivers, lakes or
groundwater. Agriculture is the largest evaporator of water by far. But industry and power,
sectors that merely abstract water, similarly rely on the availability of water (for process and
cooling purposes).
Global water resources, %
Glaciers Ground Freshwater Soil
Oceans and ice caps water lakes moisture
Atmos-
sphere
Surface & Wetlands
atmosphere
Vegetation
Freshwater Permafrost Rivers
Water abstraction from rivers, lakes and groundwater, %
Evaporation from resevoirs
Agriculture Power
Domestic and other industrial
Consumptive use of abstracted water. %
Domestic and industrial
Agriculture
Source: The Economist. Special
Report on Water (2019)
3. This section is adapted from the Special Report on Water by The Economist (2019)
Policy Paper Water Scarcity 3 / 21Meanwhile agricultural, industrial, power and domestic demands on that 0.75% of the world’s
water are growing apace with the world’s population but especially with its wealth, largely driven
by changing diets (more meat).
Population, GDP and water use - historical and projected data
Numbers Population (millions) Real GDP in USD (ten billions) Water use km3/yr
14,000 7000
12,000
6000
10,000
5000
8,000
4000
6,000
4,000 3000
2,000 2000
0 1000
1950 1960 1970 1980 1990 2000 2010 2020 2030 2040 2050
Source: HSBC. Global Equities According to the UN’s latest annual World Water Development Report4 current global water use
Water (2018) is six times greater than it was a century ago—and is expected to increase by another 20-50%
by 2050. The volume of water used—about 4,600 cubic kilometers a year—is already near the
maximum that can be sustained without supplies shrinking dangerously. A third of the world’s
biggest groundwater systems are already in danger of drying out.
And it well get worse: more than a quarter of humanity—1.9bn people, with 73% of them in
Asia—live in areas where water resources will be over-stressed. The number facing shortages
almost doubles if one counts those at risk of not having adequate access to clean water at least
one month a year. And water shortages will not just be in poor countries. Australia, Italy, Spain
and the US are going to be affected too as the map below shows.
4. http://www.unwater.org/publications/world-water-development-report-2019/
Policy Paper Water Scarcity 4 / 21Source: The Economist. Special
Report on Water (2019) Socio-economic need
While population and economic growth drive up water demands, climate change worsens
supply imbalances both in space and in time. The upshot is intensifying competition and
conflict. In some cases this could be at the detriment of local communities, small businesses and
subsistence farmers. Looming water crises have consistently ranked in the top five high in the
annual Global Risks Report by the World Economic Forum, and did so again in the 2020 edition5.
As it is for many other issues, climate change acts as a magnifier of water scarcity too.
Paradoxically, it is likely to both prolong droughts as well as cause more flooding. The World
Bank has assessed the impact of climate change on GDP in 2050. Driven in large part by
worsening water scarcity, GDP in 2050 may be suppressed by up to 7% in East Asia and 14% in
the Middle East6.
Human need
Safe water supplies, hygienic sanitation and good water management are fundamental to
global health and are indeed a human right7. Almost one tenth of the global disease burden
could be prevented safe drinking water and sanitation facilities (every year 1.4 million children
die from diarrhea) and better water management to reduce the risks of water-borne infectious
diseases such as malaria (500,000 deaths), and accidental drowning during recreation (280,000
deaths). In addition, 5 million people could be protected from being seriously incapacitated from
elephantiasis and another 5 million from trachoma (river blindness)8.
5. World Economic Forum, The Global Risks Report 2020 see: http://www3.weforum.org/docs/WEF_Global_
Risk_Report_2020.pdf
6. World Bank, High and Dry (2016), see: http://www.worldbank.org/en/topic/water/publication/
high-and-dry-climate-change-water-and-the-economy
7. http://www.unwater.org/water-facts/human-rights/
8. World Health Organization, see: https://www.who.int/features/qa/70/en/
Policy Paper Water Scarcity 5 / 21Investment need
Clean water for all, Sustainable Development Goal 6, has a number of targets, see Appendix 1.
The total capital cost of meeting targets 6.1 and 6.2 are estimated at $114 billion per year (range:
$74 to $166 billion) until 2030. That is some three times current investment levels9.
Source: World Bank. The Costs
of Meeting the 2030 SDG Targets
on Drinking Water, Sanitation, 250
and Hygiene (2016)
$, billions per year
200
150
100
50
0
20
21
22
29
16
18
19
23
26
28
15
24
25
17
27
20
20
20
20
20
20
20
20
20
20
20
20
20
20
20
O&M Captial
Note: O&M = operations and maintenance.
Including developed markets and waste water treatment, estimates of the required capital
expenditures are higher still, from $225 billion in 2016 to $311 billion in 202310.
That these investment needs are not being met is chiefly because water is underpriced, deterring
investment in infrastructure and technology. Remarkably, utility water prices tend to be lowest in
the most water-stressed of places.
9. Guy Hutton and Mili Varughese, The Costs of Meeting the 2030 Sustainable Development Goal Targets
on Drinking Water, Sanitation, and Hygiene (World Bank, 2016)
10. Global Water Intelligence, Financing Water to 2030 (2018)
Policy Paper Water Scarcity 6 / 21€ 3.0
Total water cost per m3 (EUR)
€ 2.5
€ 2.0
€ 1.5
€ 1.0
€ 0.5
€ 0.0
Ac o
ew K on
D l
i
Li ra
rk o
ta y
s on
Si as
Zü ey
Ka Be h
as in
Am en ty
M erd a
bo m
ne
Ad Te ur
s an
Al ba
e ty
d
Al lhi
G an s
ng ai
ui ou
iv ao
H air k
Ca g K i
g
om n
Pa R sa
m at
Ch City
u bu
Lo ab
b
r
Is Cit
pe on
N to
st ev
ag
Yo yot
ew a
M Tow
c
ua gh
on o
ns rl
Sh gie
Ci
yd a
el a
na ab
c
ba
g
p
dn
ri
ad d
e
a
N rab
ur
di hr
sb
La d
Q zh
h
H m
Ab n
os
Ve
dh
ic
D
Ab
Vl ng
n
a
G
Jo
N
Source: Global Water Heavily regulated prices for water do not relay supply and demand imbalances11. Thus water
Intelligence (2017) shortages, albeit long in the making, can still surprise water users, companies and investors,
witness Sao Paolo (2015), California (2017) and Cape Town (2018). Even the Netherlands was hit
by an extraordinary drought over the summer of 2018 with unforeseen effects on, for example,
river transport12.
11. This is where water differs from oil (an often-made but mistaken analogy)
12. https://newmobility.news/2018/11/28/low-water-level-rhine-cause-of-dry-gas-stations-in-the-netherlands/
Policy Paper Water Scarcity 7 / 213 PFZW definition of water scarcity
The United Nations define water security as the opposite of water scarcity as “The capacity of a
population to safeguard sustainable access to adequate quantities of acceptable quality water for
sustaining livelihoods, human well-being, and socio-economic development, for ensuring protection
against water-borne pollution and water-related disasters, and for preserving ecosystems in a climate
of peace and political stability”13.
Because of its many attributes, including cultural and (geo)political, PFZW has in 2015 chosen to
focus on the first and most investment-relevant part of the UN definition: “safeguard sustainable
access to adequate quantities of acceptable quality water” which it interprets to also include
companies’ efficient use and the reduction of pollution of increasingly scarce water supplies14.
With this definition PFZW can keep its commitment (as part of the Dutch pension funds’
Agreement on Responsible Investment, IMVB15) to the human right to safe drinking water and
sanitation as recognized by the United Nations in 201016 as well as to the OECD Guidelines for
Multinational Enterprises17.
Water scarcity has been one of the priority thematic areas for PFZW to increase its positive
impact since 2015. It is also one of the many ESG issues that it requires its asset managers to
integrate in investment decisions, motivated by:
• Better world. Clean water for all is one of the Sustainable Development Goals (#6) to which
PFZW wants to contribute at market-rate financial returns.
• Responsibility. The over-abstraction and pollution of fresh water creates adverse impacts on
people and their environment. PFZW has committed itself to minimize such adverse impacts
through various initiatives including the Dutch pension funds’ Agreement on Responsible
Investment (IMVB). Water security is also embedded in some of issues and sectors tracked by
the ‘Eerlijk Pensioenlabel’, notably Nature, Food and Mining.
• Risk & return. It falls within PFZW’s fiduciary duty to reduce direct and indirect portfolio risks
that stem from worsening water scarcity.
This paper neither addresses excess water (flooding) nor sea level rise associated with climate
change. These are aspects dealt with in the policy paper on climate change, pollution and
emissions. Also not in scope is sanitation as the natural –and important- complement to the
supply of clean water. Specific linkages with Human rights, Food security and Health will be
explored in the respective policy papers. In fact, as part of the biosphere, water is linked to most
of the other SDGs18.
13. http://www.unwater.org/publications/water-security-infographic/
14. http://www.unwater.org/water-facts/scarcity/
15. https://www.imvoconvenanten.nl/nl/pensioenfondsen
16. https://www.unwater.org/water-facts/human-rights and https://www.un.org/waterforlifedecade/human_
right_to_water.shtml
17. http://mneguidelines.oecd.org/MNEguidelines_RBCmatters.pdf and http://www.oecd.org/daf/inv/
mne/48004323.pdf
18. https://www.unwater.org/publications/water-sanitation-interlinkages-across-2030-agenda-sustainable-
development/
Policy Paper Water Scarcity 8 / 21Relevant standards, data sources and evaluation methodologies
In the absence of water prices that reflect and pinpoint local water scarcity, it is all the more
important to refine and standardize investors understanding of water scarcity risks and
responses. To that end, company water use data must be combined with contextual water
security data to assess the water risk a company (or utility or municipality) may be exposed to19.
That exposure may be mitigated by management responses that either lower water dependence
or raise the (collective) water security.
Source: Ceres. Investor Water
Water resource
Toolkit (2018)
security
ion Physi
Reg fic c
regula al
eci t
sp social r ory
isks
nc ce al k m Cor
de r
ci ris a p
Re
re nag
en ou
y ng ure
ex rat n
sp
sp
or me e
e a
dep r res
op Fin s
at nt
po i
e ns
on
e
o
se
e
Wat
Need ter
Specifi stry
Ind onse
res
c wa
s
ustry
p
Indu
Corporate water risk dashboard
Various water standards exist for the collection of comparable water dependency (use), security
(context) and management response data. The most important are:
• CDP/Water, see https://www.cdp.net/en/water. This is the biggest repository of companies’
water use data, mostly for use by investors.
• Global Reporting Initiative water and effluent standard: https://www.globalreporting.org/
standards/gri-standards-download-center/gri-303-water-and-effluents-2018/. This is to guide
companies’ disclosure of their water-related impacts on people and the environment.
• World Resources Institute Aqueduct, see https://www.wri.org/our-work/project/aqueduct.
This is a series of maps projecting various dimensions of current and future water risk.
• Ceres Aquagauge, see https://www.ceres.org/resources/tools/ceres-aqua-gauge-
comprehensive-assessment-tool-evaluating-corporate-management. This is a tool to rate the
companies’ management response.
• CEO Water Mandate, see https://ceowatermandate.org/humanrights/. This is a UN-mandated
commitment platform for corporate water action, including on human right to water building.
In addition to general standards, highly water-dependent sectors have issued sector-specific
guidelines for oil and gas20, mining21 and beverage22 sectors.
19. This is where water differs from carbon, the emission of which is place and time-independent for its
climate change impact.
20. By IPIECA, the global oil and gas industry association for environmental and social issues, see http://
www.ipieca.org/our-work/environment/water-management/
21. By the International Council on Mining and Metals (ICMM), see https://www.icmm.com/
water-disclosure-standard
22. By the Beverage Industry Environmental Roundtable (BIER), see https://www.bieroundtable.com/water
Policy Paper Water Scarcity 9 / 21While CDP Water remains the principal repository of water use data, its coverage is patchy
and the response rate seems to have peaked. For complete coverage and comparable data
most investors depend on data providers such as Bloomberg, MSCI or S&P/Trucost. Big data
and satellite (spatial) data in particular promise to be a welcome supplement to voluntary
disclosure23. Asset-mapping is taken up by a number of other organizations in support of the
assessment of various spatially-defined risks24.
In recent years a number of tools have been developed to assess or monetize companies’
exposure to water risks in different asset classes.
Evaluates Corporate
Best Evaluates Financial
Corporate Locations
Tool/Dataset/Resource Suited Primarily a… Water Risk Data in
Response Embedded
For Exposure Output
to Risk in Tool
Bloomberg Water Risk Valuation Tool (WRVT) Equities Financial Model ● ● ●
CDP Corporate Water Database Equities
Questionnaire
& Dataset ● ● ◑ ◑
Ceres Aqua Gauge™ Equities Questionnaire ●
Ceres SEC Water Risk Search Tool Equities Data Mining ● ◑ ◑
Earth Genome Private Equity
Maps & Datasets,
Services ● ◑ ◑
EcoLab/Trucost Risk Monetizer Equities Model & Datasets ● ◑ ●
Equarius waterBeta Equities
Financial Model,
Services ● ◑ ◑ ●
InVEST-Integrated Valuation
of Ecosystem Services & Trade-Offs
Private Equitiy
Models, Datasets,
Services ● ● ◑
NCFA Bank Drought Stress Test Tool
Bank Credit
Portfolios
Scenario Models,
Datasets ● ●
NCFA Corporate Bonds Water Credit Risk Tool Corporate Bonds Model & Datasets ● ◑ ●
Sustainable Water Management Profiling Municipal Bonds
Assessment
Standard ● ● N/A* N/A
WRI Aqueduct™ Equities Maps & Datasets ● ◑**
WWF-DEG Water Risk Filter Equities
Maps, Datasets,
Models ● ◑ ◑
● Has Information ◑ Some Information No information
* Profiles Water Agencies
** If used in Bloomberg corporate location overlay possible
Source: Ceres. Investor Water
Toolkit (2018)
23. Combining various data, the World Resources Institute for example has estimated
Indian utilities exposure to water shortages, see https://www.wri.org/blog/2018/02/
water-shortages-cost-indian-energy-companies-billions
24. For example by FourTwentySeven for climate change (including droughts and floods), see http://427mt.
com/our-solutions/
Policy Paper Water Scarcity 10 / 214 Framework to address water scarcity
in the investment portfolio
Integrating financially material risks
Water scarcity (i.e. insecurity) is the ultimate systemic risk, one that universal asset owners like
PFZW cannot run away from. It is an externality (since water prices rarely reflect its scarcity value
or the social cost of pollution) that can suddenly morph into an ‘internality’ for investors with a
long-term horizon and global scope. Thus it can affect various sectors and asset classes, from
listed equities and fixed income to real estate and infrastructure.
At the company level water scarcity can be a financial risk through a number of drivers
that ultimately affect revenues and growth prospects, operating costs and licenses, capital
expenditures and costs of goods sold, and/or the value of the asset itself.
WATER RISK DRIVERS
CLIMATE GROWING WEAK FAILING WATER
CHANGE COMPETITION REGULATION INFRASTRUCTURE POLLUTION
FINANCIALLY MATERIAL BUSINESS RISKS
MARKET RISK REPUTATIONAL RISK REGULATORY & OPERATIONAL RISK
LITIGATION RISK
Higher price volatility Brand equity impacts from Compliance risks due to Reduced primary crop or
of agricultural ingredients consumer concerns and violations of regulations livestock production
advocacy campaigns within the supply chain
Inconsistent Higher transport costs to haul
or reduced input Failure to anticipate future inputs longer distances
or ingredient supply government action such
as reallocation of water rights Stranded assets due to
Loss of contracts or increased rates. shifting production zones
or market access
Legal action or sanctions
for failure to address
negative environmental
or human rights impacts
PROFIT & LOSS BALANCE SHEET
Decreased Revenue
Stranded Assets
Increased Costs
Source: Ceres. Investor Water On the basis of the materiality map by the Sustainability Accounting Standards Board (SASB),
Toolkit (2018) Ceres has classified material water quantity and quality risks across the value chain for different
industries.
Policy Paper Water Scarcity 11 / 21Supply Chain Operations Product Use / End of Life
GICS Industry
Water Quantity Water Quality Water Quantity Water Quality Water Quantity Water Quality
Food Products
Beverages
Household Durables
Construction Materials
Paper & Forest Products
Oil, Gas & Consumable Fuels
Energy Equipment & Services
Metals & Mining
Water Utilities
Electric Utilities
Chemicals
/////////////////////////
Containers & Packaging /////////////////////////
/////////////////////////
Hotels, Restaurants & Leisure
Real Estate Management & Development
Internet Software & Services
Semiconductors & Semiconductor Equipment
= High Risk = Medium Risk = Unclear or Low Risk Indicates Ceres Addition
Source: Ceres. Investor Water Highly water dependent industries are obviously more vulnerable to water scarcity. These
Toolkit (2018) typically include power, energy and mining, and food and beverage. The latter mostly because of
the large water footprint of their agricultural supply chains.
Water footprint
650 Barley 650 Wheat 1400 Sorghum 2500 Millet
650 Toast 750 Cane sugar 90 Tea 840 Coffee
2500 Burger 4650 Beef 1000 Milk 2500 Cheese
Source: Water Footprint Network
Policy Paper Water Scarcity 12 / 21A large water footprint may be a financially material water risk where the continued provision
of clean water is imperiled, i.e. where water-dependent industries are located in water-insecure
places.
Source: DNB. Values at risk Some industries and commodities are concentrated in water-stressed countries.
(2019)
88% 80% 74% 67% 63% 62% 59% 59% 57%
coal mining textiles agriculture base metal chemicals / F&B paper metals mining global GDP
refining production
Top-4 producers China (53%) China (40%) China (30%) China (43%) China (27%) China (25%) US (22%) US (12%) US (12%)
(of 29 countries Australia (11%) India (8%) India (11%) US (8%) US (17%) US (16%) China (18%) Australia(10%) Australia(10%)
prone to water stress,
US (8%) Italy (5%) US (6%) India (6%) S-Arabia (3%) Mexico (3%) China (6%) China (6%)
in terms of GVA)
Indonesia (4%) Indonesia (5%) Indonesia (4%) Italy (1%) India (2%) India (3%) Italy (1%) Chili (5%) Chili (5%)
The extent of companies’ exposure can be expressed in different ways, depending on data
availability. A first, rudimentary approximation is simply the number and percentage of
production locations in water stressed areas. Further refinements are the percentage of
production capacity and the percentage of actual production in such areas. Finally, that exposure
can be expressed as the business value (EBIT) at risk as estimated by, among other tools,
Ecolab’s Water Risk Monetizer25. Companies can reduce that risk by a variety of measures to
either increase water use efficiencies and/or improving water security, underpinned by proper
governance arrangements including performance incentives.
25. https://www.ecolab.com/sustainability/water-risk-monetizer
Policy Paper Water Scarcity 13 / 21The scarcity of water as a production factor also has a macro-dimension that is not directly
related to the location or even the water use of a company. Prolonged shortages of water may
push up a variety of commodity and input prices (inflation) or depress economic growth26.
Estimates depend on the structure of the economy; in India water shortages may cost up to 6%
of GDP27.
PFZW requires its asset managers to reduce financially material water risk in the portfolio. The
principal instrument for this is engagement with selected companies in sectors that are highly
water-dependent with operations in regions that are acutely water-stressed. In the absence of
meaningful water prices, it also engages with some of the market initiatives to develop the data
and standards to support investors’ water risk assessment. See Appendix 3.
Reducing negative impact
Water is life. As the most basic of human needs, water is often a very emotive issue. Over-
abstraction and pollution of water have an immediate potential to affect people’s access to
clean drinking water and their livelihoods. Highly water-dependent and polluting sectors such
as energy28, mining29 , pharma30 and food and beverage31 can cause large negative impacts
on surrounding communities and their environment, either through withdrawing or through
polluting scarce water. See Appendix 2 for more examples. Groundwater depletion and
groundwater pollution are cause for particular concern as negative impacts are near-impossible
to remedy. Large scale hydro-energy development has its own adverse impacts, notably through
community displacement and loss of biodiversity.
Competition for and pollution of scarce water tends to receive close scrutiny by civil society and
NGOs (at least where such is allowed). Ceres maintains a database as part of its Water Investor
Hub with various water-related news, including negative impact and incidents32. For consumer-
facing companies (and by extension their investors) negative impact can quickly turn into a
material risk as examples from the food & beverage sector suggest33.
26. To draw a parallel with CO2 disclosure this could be referred to as ‘scope 4’ water risk exposure in
addition to a company’s on-site water use (scope 1), its water purchases (scope 2), and its suppliers or product
markets (scope 3)
27. https://www.bbc.com/news/world-asia-india-44492994
28. https://www.ft.com/content/fa7893bc-9175-11e8-b639-7680cedcc421
29. https://www.bbc.co.uk/news/resources/idt-sh/brazil_dam_disaster
30. https://zembla.bnnvara.nl/nieuws/fabrikant-van-nederlandse-medicijnen-buit-werknemers-uit-en-
vervuilt-milieu
31. http://www.mightyearth.org/tyson-responds-to-environmental-campaign-and-public-pressure-
addresses-pollution-in-supply-chain/
32. https://investorportal.ceres.org/s/report/00O1H000007yWqdUAE/
materiality-news-for-investor-water-hub
33. See for example https://en.wikipedia.org/wiki/Plachimada_Coca-Cola_struggle and https://www.
businessinsider.nl/nestle-closes-controversial-arizona-plant-2019-2/ and https://www.bbc.com/news/
science-environment-47029485
Policy Paper Water Scarcity 14 / 2137
34
29 28
13
10
7 7
5
3
United Mexico Chile Brazil Peru Colombia Argentina India Nigeria Ecuador
States
Source: ISS. Dealing with Water PFZW seeks to prevent, stop or remedy the negative impact of its investments, including water-
Scarcity—an ESG perspective related impacts. According to the Dutch pension funds’ Agreement for Responsible Investment
(2018) (IMVB) it will do so through investment policy, implementation and reporting. That Agreement
is anchored in the OECD Guidelines for Multinational Enterprises34 and UN Guiding Principles of
Business and Human Rights35 that spell out companies’ duties to protect the interests of their
various stakeholders.
To establish negative impact it relies on data providers such as Sustainalytics which screens
listed companies’ compliance with the OECD guidelines. Minimum standards will also be
observed in private markets using instruments such as the ESG toolkit by British development
bank CDC36.
Increasing positive impact
The various global trends of “too little, too much or too dirty” do not just drive water risk, they
drive investment opportunity as well.
Source: Impax Asset
Global trend Response
Management. Investing in water
(2016) Demand for clean water Water scarcity is a top risk identified by governments,
outpaces supply corporations and academia
Required investment in $7.5 trillion projected spending globally over next 15 years in
global infrastructure water infrastructure
Tightening global water $300 billion directed to address water pollution by China’s
regulation water 10 plan
Adaptation to changing Increasing incidence of both drought and flooding cause
weather patterns investment requirements in water systems
Innovation and evolving New technology and upgrades to existing systems create
technology further investment opportunities
Since many regions have already maxed out their sustainable water supplies, most investment
opportunities are in water demand management through increasing efficiencies and waste water
treatment and reuse. Desalination is the exception as it does increase water supplies albeit at
high cost compared to waste water reuse.
Waste water collection and treatment is of particular importance for its links to public health.
That includes the removal of pharmaceutical and micro-pollutants, a relatively new problem.
34. http://mneguidelines.oecd.org/guidelines/
35. http://www.unwater.org/water-facts/human-rights/ and https://www.ohchr.org/Documents/Publications/
FactSheet35en.pdf
36. https://toolkit.cdcgroup.com/es-topics/
Policy Paper Water Scarcity 15 / 21The investment opportunity set grows considerably when water treatment is combined
with energy and food production. This so-called energy-water-food nexus includes various
technologies ranging from energy and resource recovery from wastewater to hydrogen as a fuel,
energy store or feedstock for the production of synthetic proteins37. The taxonomy developed
with APG for solutions to the Sustainable Development Goals (SDGs) is an attempt to capture
and define relevant and investible opportunities, including those for SDG6.
These opportunities can be pursued through a variety of asset classes including listed equities
(BOA), rates and inflation (blue bonds), infrastructure and private equity. However, the water
market is highly fragmented where current mandates require opportunities to be sizable, low-
cost delivering market-rate returns.
37. http://www.unwater.org/water-facts/water-food-and-energy/
Policy Paper Water Scarcity 16 / 215 Conclusion and further steps
This paper has defined water scarcity as a global challenge and as a portfolio risk for PFZW. It
also addresses the investment opportunities that stem from an issue that is bound to grow in
importance and urgency—both in terms of financial materiality as well as in terms of impact on
public and environmental health.
PFZW will pursue water scarcity-reducing investment opportunities, notably in infrastructure,
private equity, fixed income and listed equity. It will do so on the basis of the taxonomies of
solutions and decision rules developed for Sustainable Development Goal 6.
On the risk side, PFZW will continue its involvement in initiatives that aim to improve investors
understanding of future water-related risks, and indeed their ability to compare companies’
exposure to and management of water risk. It will continue its engagement with selected
companies in the most water-dependent sectors and the most water-stressed geographies, and
adjust its priorities according to the Dutch pension funds’ Agreement on Responsible Investment
and the ‘Eerlijk Pensioenlabel’, as appropriate. In addition to financial materiality more attention
will be paid to negative impacts on vulnerable people and their environment by companies in
large-footprint sectors such as mining and energy.
Policy Paper Water Scarcity 17 / 216 Sources
• China’s water crisis, by Charlie Parton (2018),
see https://www.chinadialogue.net/reports/10608-China-s-looming-water-crisis/en
• Climate Change Adaptation: The Pivotal Role of Water, by UN Water (2010)
http://www.unwater.org/publications/climate-change-adaptation-pivotal-role-water/
• Costs of Meeting the 2030 Sustainable Development Goal Targets on Drinking Water,
Sanitation, and Hygiene, by Guy Hutton and Mili Varughese (2016)
• Dealing with Water Scarcity—an ESG perspective, by ISS (2018)
• Financing Water to 2030, by Global Water Intelligence (2018)
• Global Equities Water, by HSBC (2018)
• Global Risks Report, by World Economic Forum (2020)
see: http://www3.weforum.org/docs/WEF_Global_Risk_Report_2020.pdf
• Groundwater, by The Conversation (2019),
see https://theconversation.com/water-underground-source-for-billions-could-take-more-
than-a-century-to-respond-fully-to-climate-change-110551
• High and Dry: Climate Change, Water, and the Economy, by World
Bank (2016), see http://www.worldbank.org/en/topic/water/publication/
high-and-dry-climate-change-water-and-the-economy
• How does safe water impact global health?, by World Health Organization (2008), see https://
www.who.int/features/qa/70/en/
• Investing in water, by Impax Asset Management (2016)
• Investor Water Toolkit, by Ceres (2018), see https://www.ceres.org/resources/toolkits/
investor-water-toolkit
• On the future of water (video), by Quartz.com, see https://qz.com/is/
what-happens-next-2/1438726/future-of-water/
• Perfect Storm, by Council on Energy, Environment and Water (2018), see https://www.ceew.in/
sites/default/files/CEEW-UN-The-Perfect-Storm-June18_1.pdf
• Report on impact of global warming, by IPCC (2018), see https://www.ipcc.ch/sr15/
• SDG 6 Synthesis Report on Water and Sanitation, by UN Water (2018), see http://www.
unwater.org/publication_categories/sdg-6-synthesis-report-2018-on-water-and-sanitation/
• Special Report on Water, by The Economist (2019)
• Special reports on Water, by The Economist (2003 and 2010), see https://www.
economist.com/special-report/2003/07/17/priceless and https://www.economist.com/
special-report/2010/05/20/for-want-of-a-drink
• Too little too much, by ING (2015)
• Uncharted Waters, by World Bank (2017), see http://www.worldbank.org/en/news/
feature/2017/10/24/uncharted-waters
• Values at risk, by DNB (2019)
• Water Crisis Report, by UNU-INWEH (2017)
• Water Footprint Network, see https://waterfootprint.org/en/
• Water Gap, by WaterAid (2018), see https://washmatters.wateraid.org/publications/
the-water-gap-state-of-the-worlds-water
• Water Scarcity: Will Investors be Left High and Dry?, by Sustainalytics (2016)
• When the Rivers Run Dry: The Global Water Crisis and How to Solve it, by Fred Pearce (2018)
• World Water Development Report, by UN Water (2019), see http://www.unwater.org/
publication_categories/world-water-development-report/
Policy Paper Water Scarcity 18 / 21Appendix 1: Sustainable Development
Goal 6
Policy Paper Water Scarcity 19 / 21Appendix 2: Examples of water-driven
business impacts
Company Date Industry Location Description
NTPC Mar-2016 Utilities Kolkata, India NTPC is forced to shut down its 1,600 MW Farakka thermal power plant
due to a water shortage, which leads to an increase in power prices on
the India energy exchange.
EDELCA Mar-2016 Utilities Caracas, A prolonged drought reduces electricity output from the Guri dam and
Venezuela forces the government to ration electricity and water supplies.
Growthpoint Mar-2016 Real Estate Johannesburg, The worst drought in South African history led to a 33% reduction
Properties South Africa in the country’s corn harvest in 2015 and contributed to general
economic weakening. Property companies are struggling with rising
vacancies and unpaid rents.
KPCL Mar-2016 Utilities Karnataka, Water scarcity forces the shutdown of two units at the Raichur Thermal
India Power Station, a 1,750 MW thermal power station.
Sabesp Sep-2015 Utilities Sao Paulo, Brazil’s worst drought in 80 years leads to an 80% collapse in net
Brazil income for Sabesp, Brazil’s largest publicly traded water utility.
Starbucks May-2015 Food California, US Starbucks elects to move its bottled water business from California to
Products Pennsylvania due to drought conditions.
EDP May-2015 Utilities Sao Paulo, EDP tells investors that impacts from the ongoing drought in Brazil
Brazil could reduce earnings by USD 167–223m in 2015.
J.M. Smucker Apr-2015 Food Sao Paulo, Increases prices on Folger’s K-Cup coffee packs by 8% in response to
Products Brazil negative impact of Brazil’s drought on coffee harvest.
Campbell Mar-2015 Food California, US Reports a 28% decline in profits at its California-based carrot division
Soup Products due in part to drought conditions.
Anglo Jan-2015 Diversified Atacama, Chile The company discloses that water constraints at the Los Bronces
American Metals copper mine in Chile have led to “a material decrease in production”.
GrainCorp Nov-2014 Food Brisbane, GrainCorp discloses a 64% drop in 2014 profits due to drought
Products Australia conditions that impact grain deliveries and exports.
Coca-Cola Jun-2014 Food Uttar Pradesh, Coca-Cola is forced to abandon an USD 81m bottling factory in India
Products India due in part to local water shortages and allegations of excessive water
use.
Infosys Jul-2013 Software & Chennai, India A severe water shortage pushes Infasys to the brink of a shutdown.
Services Projected losses were estimated to be more than USD 1m per day.
Policy Paper Water Scarcity 20 / 21Appendix 3: Key water initiatives
• Ceres’ Investor Water Hub
Investor • Interfaith Center for Corporate Responsibility (ICCR) — water working group
Water
Groups • Principles for Responsible Investment (PRI) — water working group
• China Water Risk
Groups and • Ceres’ Investor Network — North America (working groups include focus
Organizations on deforestation, disclosure, green bonds, etc.)
that Provide • Asia Investor Group on Climate Change (AIGCC) — Australia and Asia
Investor Support Climate and
Sustainability • Investor Group on Climate Change (IGCC) — Australia and New Zealand
and Resources
Groups • Institutional Investors Group on Climate Change (IIGCC) — Europe
Note: Climate and • International Corporate Governance Network (ICGN) — Global
water issues are • Council of Institutional Investors (CII) — North America
often connected. • RIA Canada and SHARE Canada
• US SIF and European SIF
• Global Investor Coalition — Global (Ceres, AIGCC, IGCC, IIGCC)
• The United Nations’ Sustainable Development Goals (SDG 6 )
Guides on the Human Right • The UN Guiding Principles on Business and Human Rights and Universal
to Water and Sanitation and Declaration of Human Rights: The Human Right to Water and Sanitation
the United Nations’ Sustainable • CEO Water Mandate and SHIFT’s Guidance for Companies on Respecting the
Development Goals Human Rights to Water and Sanitation
• ICCR’s Stakeholder Responsibilities in Managing Access to Water
• World Economic Forum’s Global Risks Report 2017 — highlighting water’s
Reports on the Economic high-level position in the context of global threats
Importance of Water • Charting Our Water Future , McKinsey & Company
• High and Dry: Climate Change, Water and the Economy ,The World Bank
• Ceres’ Investor Water Handbook
• Ceres’ SEC Filing Water Search Tool
• Ceres’ Water Earnings Impact Tracker, available via Investor Water
Hub membership
• Ceres’ The Ripple Effect, Water Risk in the Municipal Bond Market
• Ceres’ Feeding Ourselves Thirsty: Tracking Food Company Progress Toward
a Water-Smart Future
Research Resources Analyzing • Bloomberg’s Transcript Analysis Function (TA), where investors can search
the Materiality of Water Risk earnings calls for topics such as “drought, flood, water scarcity” to see how
often they are linked to lower revenue and earnings.
• CDP Annual Global Water Reports and associated company-specific
questionnaires
• Sustainability Accounting Standards Board (SASB) industry briefs, including
analysis of material water risks for specific industries (see SASB website
and Buy/Sell Chapter)
•Investor Water Risks in the Mining Sector, NBIM and Columbia University Study
• Ceres’ The 21st Century Investor Blueprint for Sustainable Investing
• Action on Climate: A Practical Guide for Fiduciaries , SEIU, Responsible
Guides on Developing Investment Endowments Coalition
Beliefs and Policies • How Asset Owners Can Drive Responsible Investment: Beliefs, Strategies and
Mandates, PRI
20-11852 December 2020
• Writing a Responsible Investment Policy: Guidance for Asset Owners , PRI
Policy Paper Water Scarcity 21 / 21You can also read