Annual Business Plan 2020-2021 - Clare and Gilbert Valleys ...
←
→
Page content transcription
If your browser does not render page correctly, please read the page content below
Annual Business Plan
2020-2021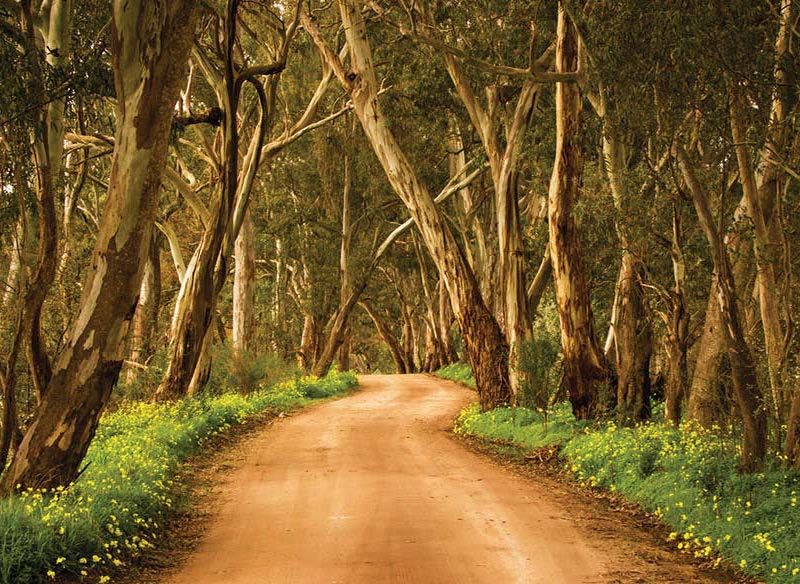
CONTENTS
About the Clare & Gilbert Valleys                 3

Mayor & CEO Message                               5

Introduction                                      6

Influences and Priorities                         7

Continuing Services                               8

Services Reduced or Discontinued                  9

Public Consultation                              10

Council Members                                  11

Strategic Plan 2019-2029                         12

Rates 2020-2021                                  22

Services Charges                                 23

Average Rates                                    24

Valuation Statistics & Annual Rates Statistics   25

Funding the Business Plan                        26

Council’s Financial Sustainability               28

Statement of Comprehensive Income                30

Statement of Financial Position                  31

Statement of Changes in Equity                   32

Statement of Cash Flows                          33

Uniform Presentation of Finances                 34
Forecasted Financial Indicators                  35

                                                      2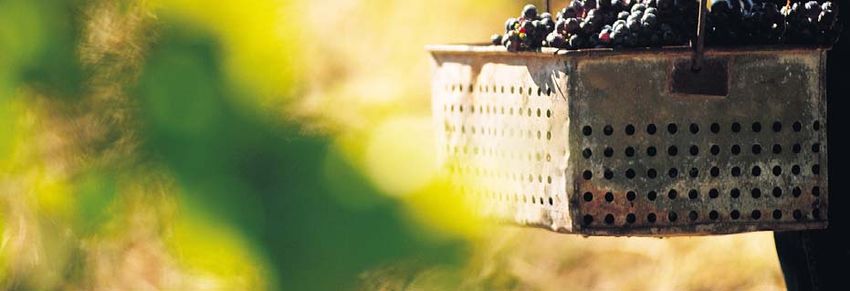
About the
The Clare and Gilbert Valleys form part of the traditional lands of the Ngadjuri peoples and their
rich connection and association with this place is recognised.
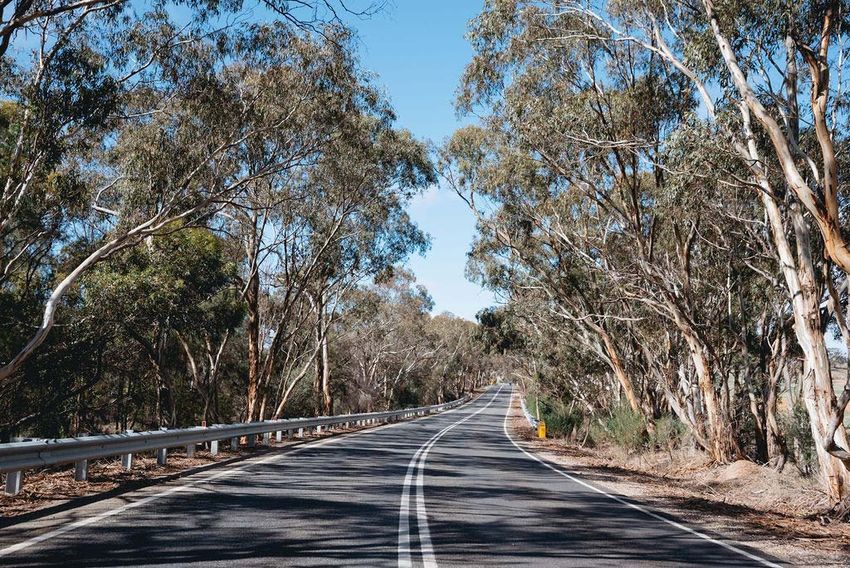
Our district comprises some of the most productive lands and scenic landscapes in Australia
which deliver premium products and experiences. Located adjacent to the outer metropolitan
area of South Australia’s capital Adelaide, the Clare and Gilbert Valleys enjoy the advantages
of proximity and accessibility with an enviable rural lifestyle.
The Clare Valley wine region is famous for its world class Riesling and has achieved recognition
as Australia’s Capital of Riesling. Combined with Shiraz as another staple, and emerging wine
varieties, the Clare Valley continues to have a strong future in viticulture and winemaking.
The corner stones of the economy are the productive and fertile lands of the Clare and Gilbert
Valleys combined with favourable climatic conditions resulting in excellent broad acre cropping
opportunities and livestock production. This strength provides a solid foundation for enviable
food experiences and an increasing trend towards value-adding beyond the farm gate.
The Clare and Gilbert Valleys is described as a tapestry of towns, villages and rural landscapes
across which our population of 9,311 is dispersed. Ranging from the service towns of Clare,
Riverton, Saddleworth and Auburn through to the villages of Stockport, Tarlee, Rhynie, Manoora,
Mintaro, Watervale, Sevenhill, Armagh, Waterloo, Hilltown, Leasingham, Stanley Flat and
Marrabel each has a proud history, great stories and a positive future.
The Clare and Gilbert Valleys is home to the renowned Riesling Trail, which hosts cycling and
walking from Barinia in the north to Auburn in the south, it covers more than 35kms along the old
railway corridor. A southern extension through the Rattler Trail, from Auburn through to Riverton,
makes a total distance of 60kms. The Heysen, Mawson, Kidman and Lavender Trails also traverse
the Council’s landscape offering a diversity of active experiences.
Education is a focus for the Clare and Gilbert Valleys with excellent public and private schools,
and a number of training organisations. A quality library service is provided through full time
libraries at Clare, Saddleworth and Riverton, with an agency in Auburn. The strong presence of
the University of the Third Age enables a wide variety and range of interests to be explored.
Clare and Gilbert Valleys is also represented by a number of service clubs including Lions, Rotary
and Apex.
The high level of health and associated services available locally, including two hospitals, four
medical and two dental practices, and an excellent ambulance service along with the
presence of the Mid North Community Passenger Network Scheme, provide well for those who
need assistance.
3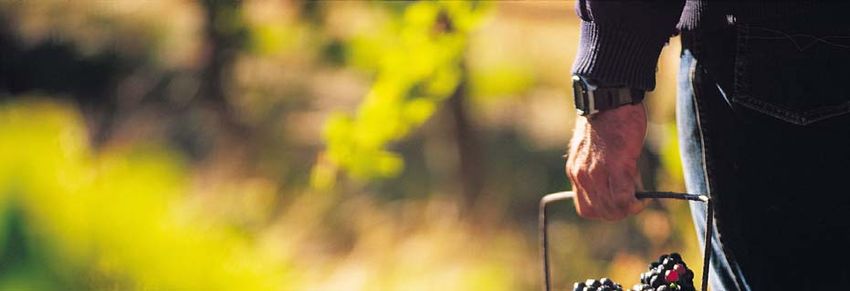
The Clare and Gilbert Valleys region is an accessible destination for visitors to utilise the many
excellent accommodation venues, function centres and tourist facilities available, including the
wide variety of historic sites and events which occur in the area.

The Clare and Gilbert Valleys comprise safe communities with a low crime rate and a strong
police presence. An active and efficient emergency service is present throughout the region
provided by dedicated and well-trained volunteers of the Country Fire Service, State Emergency
Services and SA Ambulance. The region also has access to many State and Federal
Government agencies including: Primary Industries and Regions SA, Landscape Board and
Department of Environment & Water, Regional Development Australia Yorke and Mid North,
Department of Education, Country Health SA, SA Water, Department of Planning, Transport and
Infrastructure and Services SA sub branch.

                                                                                                     4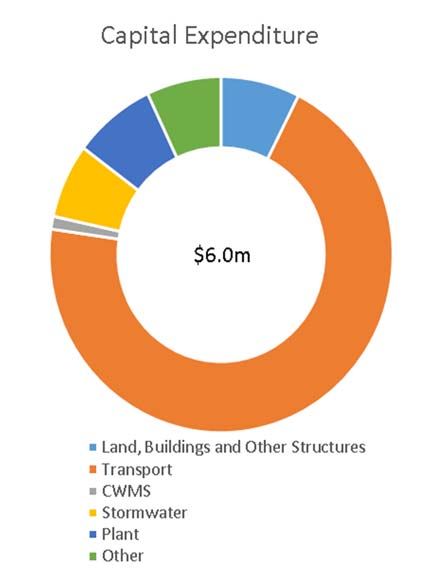
MAYOR & CEO MESSAGE
The Clare and Gilbert Valleys’ communities have been faced with numerous challenges in
recent times with two years of drought and then the COVID-19 pandemic. Two key sectors,
primary production and tourism, have been impacted by these events.

The coming year will require Council to help with the rebuilding process as the district recovers
from the economic impact of these crises. However, it is also a time of recovery for Council and
the 2020/21 Annual Business Plan and Budget has been developed with a view to maintaining
the goal of long-term sustainability.

The Council was fortunate to receive two rounds of Drought Communities Funding and more
recently infrastructure funding to assist in the economic recovery from the impacts of the COVID
-19 pandemic.      Council has also created an assistance package for those sectors of the
economy that have been impacted by the pandemic. In addition, Council made several
decisions, outside of the normal budgeting cycle, to provide significant funds to the Clare Oval
redevelopment and the Watervale Community Centre.

Like many regional councils, the small population of CGVC is making it increasingly difficult for
Council to maintain the large number of ageing community buildings and other structures that
sit on its Asset Register. These buildings considerably increase the amount of depreciation that
needs to be collected.

Council’s historical approach to rate rises, the increases in depreciation, and unplanned
budget decisions made in the 2019-20 financial year have had significant impacts on Council’s
Long Term Financial Plan.

Time has been taken to review its past decisions and those of previous Councils and it has
become clear that a number of tough decisions need to be made if rate rises are to be kept in
check and Council’s long-term sustainability maintained.

Council has focused its attention on understanding its statutory obligations and the need to first
and foremost ensure they are provided.       After that, funding of additional services can be
considered. It has become clear that Council is funding more non-mandated services than it is
collecting rates to fund. Therefore, a number of programs and initiatives will be discontinued or
will have their funding reduced.

Council has also reduced a range of its administrative costs and will continue to look for further
efficiencies. There are also plans to evaluate Council assets and identify those that are surplus
to requirements.

The 2020-21 Annual Business Plan and Budget details the services, programs and projects that
can be provided for the coming financial year. It also outlines how these services, programs
and projects will funded.

Mayor Wayne Thomas                             Dr Helen Macdonald
                                               Chief Executive Officer

                                                                                                     5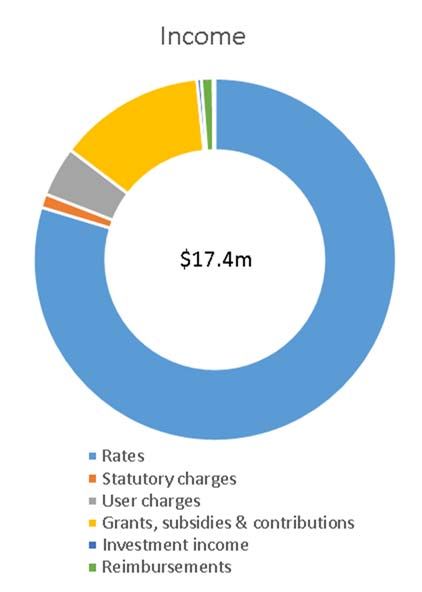
INTRODUCTION
The Clare & Gilbert Valleys Council is the peak regional government entity responsible for
providing services, infrastructure assets, managing community funds and advocating on behalf
of our residents.

The Annual Business Plan summarises the services, programs and projects that Council proposes
to deliver in the 2020-2021 financial year.      It outlines Council’s strategic and operational
objectives for the provision of projects and valuable services to the local community, some of
which have a benefit to the greater region.

The focus will be on core services which include road reseals and resheeting, footpaths,
stormwater, drainage, and community wastewater management schemes.                       Managing
Council’s statutory responsibilities in health, building and planning assessment will continue, with
a focus on providing quality customer service.

Council will place a high priority on value for money services and will continue to review and
reassess what it does, thereby identifying and working to achieving operational efficiencies.

                                                                                                       6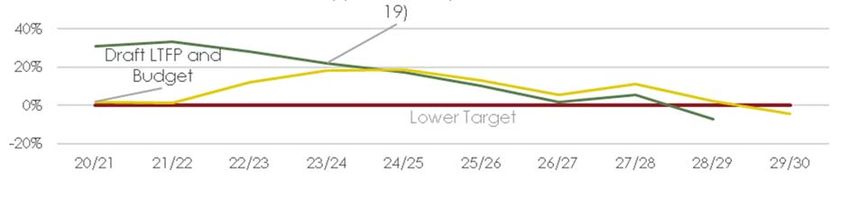
INFLUENCES and
PRIORITIES
There are a number of significant factors that have influenced the preparation of the Clare &
Gilbert Valleys Council Annual Business Plan and Budget for 2020/2021. These include:
The increase in the Consumer Price Index (CPI) for all groups was 2.2% for the quarter ended
31 March 2020.
Local Government Price Index which measures the increase in costs for Local Government
was 1.6% as at the March 2020 quarter.
Impact of COVID-19 and other economic / environmental pressures.
Negotiated Enterprise Agreements which provide for wage and salary increases.
Increasing fees and charges imposed by other levels of Government especially in the area of
waste management.
Fees set by the State Government are below the cost of delivery.
Requirements to maintain and improve infrastructure assets to acceptable standards,
including roads, footpaths, storm water drainage and community waste management
systems.
State and Australian grant funding not keeping pace with the increase in associated service
delivery and asset maintenance costs.
Commitments to the Clare Oval Redevelopment Committee.
In response to these factors and to minimize the burden on ratepayers the Annual Business Plan
has been prepared within the following guidelines:
An increase in general rate revenue of 2.9%
Community waste water management scheme charge will be $390
Kerbside waste collection charge will be $211.
Council’s priorities will be:
Active pursuit of State and Australian Government grants
Attraction and retention of quality employees
Enhancement of Council’s profile in the community with improved consultation and
transparent decision making
Use of Asset Management Plans and the Long Term Financial Plan to achieve long term
sustainability
Review of work practices to explore opportunities in efficiencies and service delivery, including
information technology
To produce a 3 year rolling road plan for all roads
Undertake Council’s annual works program with a commitment to fund road resheets and
reseals, footpaths, and stormwater.
7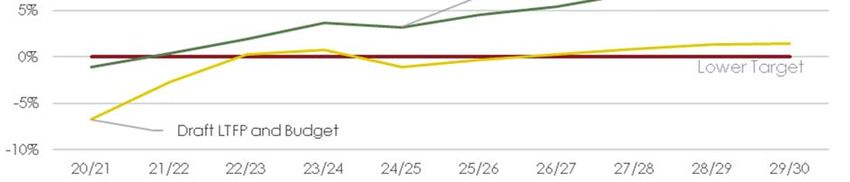
CONTINUING SERVICES
All Councils have basic responsibilities under the Local Government Act and other relevant
legislation. These mandatory activities include:
Regulatory activities e.g. maintaining the voters’ roll and supporting Council Members
Setting rates, preparing an Annual Budget and determining longer-term strategic management
plans for the area
Management of basic infrastructure including roads, footpaths, parks, public open space, street
lighting and storm-water drainage
Community wastewater management systems
Development planning and control, including building safety assessment
Various environmental health services
Dog and Cat Management
Fire season preparedness
Rubbish Collection
In response to community needs the Council also provides non-mandatory services and programs
including:
Library services
Street cleaning and rubbish collection
Town Halls and community buildings
Cemetery management
Economic development
Fire prevention services
Environmental programs
The Clare Art House and other community spaces
Community & volunteer programs
Valleys Lifestyle Centre – Managed by YMCA
Sporting and recreational facilities
Community Passenger Network
In all services, the Council seeks to be responsive to changing needs. Community feedback and
surveys undertaken from time to time, check levels of satisfaction and areas for improvement.
The Council also operates a number of facilities on a fee for service basis (but not necessarily at full
cost recovery). These facilities provide important community benefits while also generating
revenue for services and projects of benefit to the Clare & Gilbert Valleys Council and include:
Caravan parks at Riverton and Auburn
Rubbish Collection including recycling
Community Waste Management Schemes.
8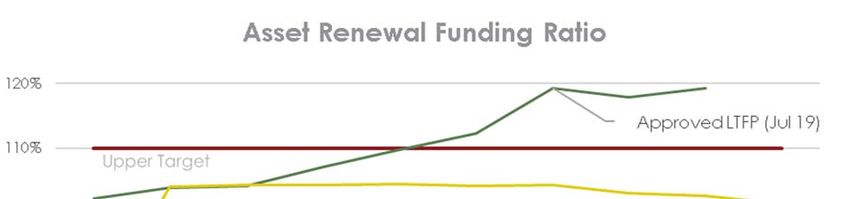
SERVICES REDUCED OR DISCONTINUED
Below is a list of key activities and services that have been reduced or discontinued.

                                                              Original
Services / Activities                                          Budget               Budget
                                                              2019/20           2020/21

Art and Culture                                                 10,000                   0

Clare Flood Management Design                                  110,000              10,000

Civic Receptions                                                10,000                   0

Council Meeting meals                                           10,000                   0

Donations on Request                                            40,000                   0

Economic Development Activities & Grant Writing                130,000              65,000

European Wasp Eradication                                         2000                   0

Events Support Program                                          50,000              20,000

Governance Consultancy                                          40,000              30,000

Heritage Restoration Fund                                       26,000                   0

Mt Lofty Ranges World Heritage List bid                          5,000                   0

Library Building Maintenance                                    11,000               5,000

Street Cleaning                                                 65,000              55,000

Tree maintenance                                                85,000              65,000

Yoshinaga visit                                                 10,000                   0

The items listed do not represent Councils full allocation for that service area.

                                                                                             9
PUBLIC CONSULTATION
The consultation period for the Annual Business Plan and Budget for 2020-2021 commenced on
Wednesday 17 June 2020, with written submissions closing at 5.00pm on Wednesday 8 July
2020.

Public notices were placed in the local newspaper with documents available at:
-   Council Offices at 4 Gleeson Street, Clare
-   Online feedback form on Council websites – www.claregilbertvalleys.sa.gov.au

All written submissions and online feedback were presented to a Council meeting for
consideration on Monday 13 July 2020.

Community members who had registered to do so were able to present verbally to Council via
the electronic meeting process during the Special Council Meeting on 13 July 2020.

                                                                                             10
COUNCIL MEMBERS
Clare & Gilbert Valleys Council comprises a Mayor and nine area Councillors.
The Council is responsible for policy making and decisions that impact on future plans for the
district, and the lives and livelihoods of individuals, organisations and businesses within it.
The role of Council Members is to:
Represent the interests of residents and ratepayers, to provide community leadership and
guidance, and to facilitate communication between the community and the Council.
Participate in the deliberations and civic activities of the Council.
Formulate the Council’s objectives and policies.
Keep the Council’s objectives and policies under review to ensure they are appropriate and
effective.
Keep Council’s resource allocation, expenditure and activities, and the efficiency and
effectiveness of its service delivery under review.
Standing, from left:
Cr Brian Koch, Cr Ian Burfitt, Cr Ann Alder, Cr Malcolm Bartholomaeus, Cr Nedd Golding
Sitting, from left:
Cr Leon Bruhn, Deputy Mayor Cr Elizabeth Calvert, Mayor Wayne Thomas
Cr Cate Hunter, Cr Lucy Drummond
11STRATEGIC PLAN 2020
The Strategic Plan is an important document guiding the direction of Council. It is structured so
that Council’s decision making can be informed by the strategies set out in the Strategic Plan
2019-2029.
The following table includes the project priorities for the 2020-2021 financial year with regard to
the strategies identified in the Strategic Plan.
Clare & Gilbert Valleys Council - Vision Statement
Grow our population while maintaining an engaged, vibrant and attractive community with a
shared respect for our natural and built environment and a productive economy that fosters
innovation and excellence.
1 Connected and Empowered Community
1.1 Strengthen opportunities for the community to participate in learning. $694,000
Ensure the Library service is a modern learning hub for current and future needs
Continue to offer events for young people such as book and science weeks and NAIDOC
1.3 Create an environment that supports and encourages a healthy and resilient community.
Continue to share grant opportunities with groups and clubs, write letters of support and assist
with grant applications
Identify other opportunities for more youth art work to be established throughout the region.
Ongoing funding for Peak Bodies $78,000
1.4 Advocate for enhanced medical and health service offerings to meet the needs of the
community, in particular our ageing population.
Continue to support the Council representative on the local Hospital Advisory Committees
Prepare a Regional Public Health Plan and Disability Access and Inclusion Plan $10,000
1.5 Support the development of quality facilities for retirement and aged living.
Advocate for continued financial support for the Regional Passenger Network Service
121.6 Enhance the residential streets of the towns and villages.
Develop a Footpath Policy for all townships
Footpath project from 2019/20 budget that has not been completed
Clare Main St Footpath
Detail design for the upgrade of the Clare Main St footpath from Gleeson St to Burton St present-
ed challenges when trying to meet Australian Standards. The area around the Edwards Plaza
however could not be completed without changes to the Plaza area. A successful redesign
process will allow multiple options to be considered and construction to commence in spring
2020.
Main Street Project from 2019/2020 Budget that has not been completed
Clare Main Street Streetscape works
A number of art works and sculptures that could not be commenced because of COVID-19
Pandemic will be delivered by the end of 2020 in accordance with the State Government’s Plac-
es for People grant received in June 2019.
1.7 Design and deliver well-planned townships with adequate capacity for housing,
infrastructure, employment, business activity and recreational areas.
Implement the Open Space and Recreation Strategy
Operate and maintain the Valleys Lifestyle Centre $667,000
Operate and maintain Riverton Pool $159,000
Support the Clare Oval Redevelopment Committee to upgrade the Clare
Oval Precinct—Total commitment $1,385,000 with $1,002,000 in 2020/21 year
and $383,000 in 2021/22 year
Continue to support the Sport and Recreation officer under the Star Club program in conjunction
with the Regional Council of Goyder and Wakefield Regional Council. $23,000
1.8 Enhance the uniqueness of each of our townships through the development of public spaces
that reflect their unique character and local heritage and history.
Work with National Trust on opportunities to support conservation and heritage assets
Ongoing financial support for History Groups $4,000
Enhance our heritage trails— Federal Government providing $66,000 for enhanced regional trails
1.9 Advocate for affordable housing options.
Work with the Department of Planning, Transport and Infrastructure (DPTI) on implementation of
the Planning and Design Code and the future development of residential land.
131.10 Support a growing diversity of community events that cater for all age groups.
Partner with the Landscape Board in the celebration of NAIDOC week
Meet with Ngadjuri elders and corporation to identify opportunities to acknowledge Ngadjuri
connections to Country.
1.11 Advocate for improved telecommunications connectivity.
Work with RDAYMN to have any shortcomings in data delivery and telecommunication
blackspots addressed.
2. Vibrant Local Economy
2.1 Engage with a broad range of stakeholders including State and Federal Government, RDA
(Regional Development Australia), industry associations, local industry and business and
community groups to foster economic growth and development.
Assist RDAYMN and developers to understand the new Planning and Design Code and
where potential development could be located
Implement the actions of the Economic Development Strategy in partnership with RDAYMN
2.2 Support the development of value-add industries to our established agriculture, wine and
tourism industries.
Implement the actions from the New Tourism Experiences Roadmap and the New Trail
Experiences Project - Federal Government providing $66,000 for enhanced regional trails
2.3 Promote Clare as a regional Government and industry service centre for the mid-north
region.
Implement the actions from the New Tourism Experiences Roadmap—Federal Government
providing $66,000 for enhanced regional trails
Work with RDAYMN, CVWGA and SATC to attract a high end accommodation provider to the
Clare Valley
2.4 Support the development and enhancement of a vibrant retail sector recognising the
value of retail precincts to residents and visitors alike.
Support the improvement of in-region visitor servicing and wayfinding
2.5 Foster opportunities for collaboration and co-working to promote Clare as a connected
hub for doing business within and beyond the district.
Implement the actions of Legatus Regional Creative Industries Forum
Tailor the “move to CGVC page” to market to creative and sector skilled people
2.6 Promote the live-ability of the district as an attractive location for resettlement.
Provide promotional information on our website about the region as a good place to live.
142.7 Encourage tourism offerings to cater to a range of interests and varied economic options.
Continue to support and provide funding for Clare Valley Wine Food and Tourism Centre
$200,000
Implement the actions from the New Tourism Experiences Roadmap and the New Trail
Experiences Project— Federal Government providing $66,000 for enhanced regional trails
Continue to support and encourage the Council Caravan Parks
Continue negotiations with Discovery Parks for a new improved leasing of the Clare Caravan
Park
2.8 Encourage the development of a diverse range of tourism products that make use of the
natural characteristics of the area.
Implement the actions from the New Tourism Experiences Roadmap - Federal Government
providing $66,000 for enhanced regional trails
2.9 Support national and international recognition of local industries and achievements.
Provide financial support for the Clare Classic Council contribution $20,000
Continue to promote the Clare Valley brand
2.10 Support the development of a strong and reputable creative industries sector.
Ongoing support of the “Clare Art House” $7,000
2.11 Advocate for the development of tertiary and vocational education opportunities that are
accessible locally.
Work with RDAYMN to find ways to address skill shortages in the tourism sector.
153 Protected and Enhanced Natural and Built Environment
3.1 Implement community safety measures ranging from preventative and contingency planning
through to community education to help manage and mitigate against extreme weather events and
natural disasters.
Commence communication campaign around natural hazards
Develop Community Emergency Risk Assessment and Recovery Plans in partnership with Red Cross for our
various communities.
3.2 Lead the community on initiatives to develop resilience to climate change.
Provide advice on building design through the Development and Community department
3.3 Encourage improved water conservation through community education initiatives.
Lead water conservation practices in Parks Gardens and Recreation facilities
Assess rainwater harvesting and irrigation efficiency opportunities
Provide advice on building design through the Development and Community department
3.4 Address measures to ensure the effective management of high-risk stormwater issues across the
district.
As part of the implementation of the various Storm water Management Plans, the following storm water
upgrades have been listed for 2020/2021 $405,000
Storm water
Giles Corner Rd – Giles Corner
Hartley Rd - Clare
Edward St - Clare (design)
Clare Storm Water Plan – Stage 1 Implementation Plan
Storm water Project from 2019/20 budget that has not been completed:
Gleeson St Drainage
The original concepts for this project had not identified any requirement for easements for the installation
of the proposed pipework. During the detail design process it became clear that easements would be
required and in an effort to minimize the creation of easements numerous design option were explored
further delaying the project. The new design now requires only one easement which is currently being
negotiated with affected landowners. When agreement is reached the project can commence with
completion expected prior to end of 2020.
3.5 Demonstrate community leadership on efficient energy usage.
Implement Energy Audit / Savings outcome $30,000
163.7 Identify improved management practices leading to reduced environment impact.
Continue to support the 5 Bush For Life sites within the Council area
3.8 Support ecological and biodiversity protection of the natural environment including waterways.
$70,000
CWMS
Evaluate and design only of Bulk Chlorine Storage at Riverton, Saddleworth & Clare
Implement expanded waterway clearing program
3.9 Provide for comprehensive management of native vegetation on roads and Council reserves
that enhance the district’s visual amenity.
Develop a Roadside Vegetation Management Plan
4 Quality Services, Assets and Infrastructure
4.3 Provide new and upgraded road infrastructure across the district. $3,944,385
(note - includes renewal works )
Design Main North Road – Clare second Pedestrian Crossing
Township Sealed Roads
Clare
Bright Street - Bright Street - Harriet St to West Tce
Gleeson St from King St to Burton St
Strickland St from Burton St to Victoria Rd
Warenda Rd from Stanley St to 120m S Stanley St
Temple Rd from East End to Strickland St
Wright St from New Rd to End
Temple Rd from East End (Bennett Auto Repairs) to Strickland St
Saddleworth
Patrick St from Burra Rd to Thomas St
Rural Sealed Surfaces
Manoora
Brothers Hill Rd from Barrier Highway to Pine Creek Rd
Auburn
Brothers Hill Rd from Byrne Rd to Rices Creek Rd
Steelton
Main Road 45 Special Local Roads Program Grant Funding
17Springfarm
Springfarm Rd from Farrell Flat Rd to Quarry Rd
Leasingham
Wakefield Rd from Horrocks Highway to 110m West of West Tce
Clare
White Hut Rd from Melrose Ave to Waller Drive
Giles Corner
Giles Corner Rd
Stockport
Stockport Rd shoulders evaluate and design only
Saddleworth
Saddle Rd – Junctions
Mintaro
Copper Ore Rd - Stabilise and reseal from Burton St to Merilden Rd
Burra St Guard Rail - Evaluate and design only
Rural Sheeted Road Surfaces
Black Springs
Black Springs Rd from Barton Hill Rd to Tamarisk Tree Rd
Farleys Rd from Barrier Highway to Cemetery Rd
Heinrichs Rd from Old Burra Rd to end of sheeting at RRD4040
Old Burra Rd from Rd Reserve at RRD 580 to Heinrichs Rd
Old Burra Rd from Heinrichs Rd to Barton Hill Rd
Manoora
Bruhns Rd from Waterloo Rd to end at farm driveway
Barinia
Cornwell Rd from RM Williams Way to Calcannia Rd
Salter Springs
Days Hill Rd from Farm Driveway at RRD 5100 to RRD 6440
Salter Springs Rd from Road Reserve at RRD 5110 to Farm Driveway at RRD 7220
Giles Corner
Giles Corner Rd from O'Sullivans Rd to Start of Seal
18Alma
Giles Corner Rd from Vandeleur Rd to O'Sullivans Rd
Station Rd (South) from Hazelton Rd to Farm Driveway at RRD 3160
Armagh
Hicks Rd from Bend at RRD 1765 to End at RRD 2330
McRae Wood Rd from Farm Driveway at RRD 700 to Benbournie Rd
Hilltown
Harvey Hwy from Lehman Creek Rd to Hilltown Rd
Hilltown Rd from End of Seal to Sommerville Rd
Hilltown Rd from Camels Hump Rd to Council Boundary (North)
Hilltown Rd from Sommerville Rd to Camels Hump Rd
The Camels Hump Rd from Michael Rd to Council Boundary (East)
Mintaro
Kadlunga Rd from Mintaro Rd to Tickle Rd
Benbournie
Lookout Rd (Nth of Clare) from Rossmore Rd to Council Boundary (West)
Waterloo
Main Road 45 from End of Seal to Schwartz Rd
Main Road 45 from Schwartz Rd to Eckermann Rd
Main Road 45 from Eckermann Rd to Mollers Gap Rd
Stanley Flat
McRae Wood Rd from Horrocks Hwy to Farm Driveway at RRD 700
Slaughterhouse Rd from Spring Farm Rd to Moccundunda North Rd
Stanley Stud Rd from Horrocks Hwy to Noble Rd
Spring Farm
Moccundunda Rd from Slaughterhouse Rd to Blockers Rd
Tothill Belt
Tothill Belt Rd from Braewood Rd to Busch Rd
Tothill Belt Rd from Braebrook to Braewood Rd
Mollers Gap Rd from Road Reserve at RRD 4680 to Tothill Belt Rd
Saddleworth
Talbots Rd from Farm Driveway at RRD 1255 to Golf Course Rd
Steelton Rd from Farm Driveway at RRD to I'anson Rd
Steelton Rd from Old Manoora Rd to Farm Driveway at RRD
19Tarlee
Vandeleur Rd from Horrocks Highway to Salt Creek Rd
Vandeleur Rd from Salt Creek Rd to Giles Cnr Rd
Ryelands Rd from Tarlee Rd to Clarkes Rd
Salt Creek Rd Sth from Hill Rd to farm driveway at RRD 2600
Salt Creek Rd Sth from Vandeleur Rd to Hill Rd
Watervale
Upper Skilly Rd from Wakefield Rd to Start of Seal (Popes Hill Rd)
Upper Skilly Rd from End of Seal (Popes Hill Rd) to Hughes Park Rd
Watervale Rd from Springvale Rd to Mintaro Rd
Sollys Hill Rd from Mt Horrocks Rd to End
Bridges
Mintaro
Harvey Highway, Dominic St, Muanu Rd, Min Man Rd, Pioneer Ave and Wendourie Rd $90,000
204.5 Provide well-maintained community facilities that meet the needs of community.
$1,262,000
Fund Playground equipment replacement from Open Space & Recreation Strategy and the
Safety Audit
Mintaro institute – Replacement of Septic Tank
Auburn Recreation Ground – Replacement of Septic Tank
Niche Wall Riverton – Establishment of an additional wall
Provide co-funding towards the development the Clare Oval Redevelopment
4.6 Provide a range of built infrastructure that supports and enhances community and
businesses. $120,000
Clare Library – Heritage Repairs to the Facade
Disability Discrimination Act and Fire Investigation on two Town Halls
Clare Town Hall replacement windows
Assess and evaluate Council building roofs for safe access
Provide funding via the Drought Communities Program for community assets including
enhanced walking trails, adventure playground at Riverton, enhanced information bay at
Tarlee and new Greenkeepers Shed at Clare Golf Club
4.7 Deliver high standards of customer service and customer experience.
Develop improved NHVR permit assessment processes $15,000
Engage Dial Before You Dig for Council infrastructure $15,000
4.8 Have an open space strategy that identifies and enhances existing walking and cycling
paths across the district.
Commence implementation of the Open Space and Recreation Strategy
Ongoing financial support for Riesling Trail and Rattler Trail $4,000
In partnership with neighbouring Councils, create the Adelaide Wine Capital Cycle Trail
Implement the infrastructure upgrades recommended within the Clare Valley Region New Trails
Experiences Project - Federal Government providing $66,000 for enhanced regional trails
21RATES 2020 - 2021
As part of the financial planning and budget processes, Council proposes to increase the
overall general rates by 2.9% over that raised in the 2019-2020 financial year. The actual
increase payable by any individual ratepayer may be more or less than this depending on the
movement in the capital value of their property relative to other properties.
Method Used to Value Land
Council continues to use capital value as the basis for valuing land within the Council area. The
Council considers that this method of valuing land provides the fairest method of distributing
the rate burden across all rate payers. Property value is a good indicator of wealth and capital
value which closely approximates the market value of a property provides the best indicator of
overall property value.
Adoption of Valuation
The Council has adopted the valuations made by the Valuer-General. Anyone who is
dissatisfied with the valuation made by the Valuer General may object to the Valuer General in
writing within 60 days of receiving the notice of the valuation, explaining the basis for the
objection. The Council has no role in the process. It is important to note that the lodgement of
an objection does not change the due date for payment of rates.
The total property valuations (excluding non-rateable) provided by the State Valuation Office
as at 28 June 2020 was $2,971,663,610 - an increase of 6.09% over last year.
Differential General Rates
Council has regard to the relative movements in valuations over the last few years and
acknowledges that a proportion of primary production properties have increased significantly
in comparison to other land use categories. Accordingly, the primary production rate will be
59% of the general rate applying to residential, vacant and other land use codes with the
commercial and industrial rates will be 36% above residential.
Payment of Rates
Rates are payable in four approximately equal instalments. Ratepayers may elect to pay any
instalment in advance. Council will send further notices for each quarter. If the amount due
remains unpaid after the due date, it may be recovered by legal actions.
Minimum Rates
Council has historically applied a minimum rate. For 2020-2021 the minimum rate is $730.
Council considers it appropriate that all rateable properties make a contribution to the cost of
administering the Council’s activities and maintaining the physical infrastructure that supports
each property.
Where a Council applies a minimum rate it must not apply to more than 35% of properties in
the Council area. For Clare & Gilbert Valleys Council the minimum rate currently applies to
approximately 15.07% of properties.
22SERVICE CHARGES
1. Community Wastewater Management Systems
Council provides Community Wastewater Management Systems to properties in Clare, Riverton
and Saddleworth. The cost of operating, maintaining and upgrading this service is recovered
through the application of service charges on each property for which the service is available.
The proposed service charge for Community Wastewater Management Systems in 2020-2021 will
be $390 per unit and is reflected in the budget document. Where the service is provided to non-
rateable land, a service charge is levied against the land.
Total Revenue being $1,044,000
2. Waste Collection Scheme
Council also provides a refuse collection and recycling service within the townships and
settlements of Clare, Saddleworth, Riverton, Mintaro, Sevenhill, Auburn, Watervale, Manoora,
Rhynie, Marrabel, Stockport, Tarlee, Waterloo, Armagh and Golfview Heights (Stanley Flat). The full
cost of operating and maintaining this service is recovered through the application of a service
charge for each property within the listed towns. Where the service is provided to non-rateable
land, a service charge is levied against that land.
Council proposes that the service charge for refuse collection within the designated townships
and collection areas of the Council, will be $211 per annum.
Total Revenue being $794,000
Regional Landscape Levy
The Regional Landscape Levy, set by the Regional Landscape Boards, is a State Government tax
imposed under the Landscape South Australia Act 2019. As such, Council is obliged to collect the
levy on behalf of the State Government. Council collects the Levy on behalf of the Northern and
Yorke Landscape Region. No portion of the levy is retained by Council.
The levy is based on the capital value of land and is shown as a separate charge on the rate
notice.
Net Revenue being $496,626
Rate Rebate
A rebate of rates in respect of any rateable land in the Council area will be available in
accordance with the Local Government Act 1999 and Council’s Rate Rebate Policy. The policy
provides guidance as to the eligibility upon which a ratepayer is entitled to a rebate of rates.
Please refer to Council’s Rate Rebate Policy for further information -
www.claregilbertvalleys.sa.gov.au.
Hardship
Section 182 of the Local Government Act permits the Council, on application to partially or wholly
remit rates or postpone rates, on the basis of hardship. Where a ratepayer is suffering hardship in
paying rates he / she is invited to contact the Rates Officer 08 8842 6400. Council treats such
inquiries confidentially www.claregilbertvalleys.sa.gov.au.
Cost of Living Payments
Cost of Living Payments (previously Pensioner Concessions) are now paid directly to eligible
ratepayers and managed by the State Government.
A full version of Council’s Rating Policy, Deferment of Rates Due to Hardship Policy and Rate
Rebate Policy can be viewed at www.claregilbertvalleys.sa.gov.au
23AVERAGE RATES
This table incorporates the proposed rating and its impact using average valuations.
Average Total Average
Average Rate in Minimum Refuse/ Total
General CWMS Average
Land Use Year Valuation Dollar Rate Recycling
Rates $ Rates Increase
$ $ $ $
$ $ %
Residential: 19/20 259,561 0.004981 715 1,293 380 190 1,863
residential
dwellings, flats,
units 20/21 263,383 0.005044 730 1,329 390 211 1,930 3.58%
Commercial:
Retail shops, 19/20 366,165 0.006724 715 2,462 380 190 3,032
Professional
services eg
accounting, legal, 20/21 367,690 0.006860 730 2,522 390 211 3,123 3.01%
engineering, etc
Industry:
Vehicle repairs, 19/20 351,249 0.006724 715 2,362 380 190 2,932
workshops,
wineries,
manufacturing, 20/21 364,783 0.006860 730 2,502 390 211 3,103 5.86%
etc
Primary
Production: 19/20 688,341 0.003163 715 2,177 - - 2,177
Agriculture, live-
stock,
horticulture,
commercial 20/21 748,474 0.002976 730 2,228 - - 2,228 2.34%
forestry
19/20 93,352 0.004981 715 465 380 190 1,035
Vacant Land:
Vacant allotments
20/21 88,827 0.005044 730 448 390 211 1,049 1.36%
Other:
Government 19/20 231,309 0.004981 715 1,152 380 190 1,722
agencies,
education,
20/21 194,626 0.005044 730 982 390 211 1,583 -8.09%
public utilities
Rate changes for individual assessments will likely vary from these amounts.
The calculations are based on the average valuation as at 28 June 2020 from the State
Valuation Office.
24VALUATION STATISTICS
Budget 2020/21
2019/20
(valuations as at 28/06/2020)
Rateable Rateable
Capital Capital
Capital Valuation Number of Capital Number of
Land Use Value Value
Value Movement Assessments Value Assessments
Proportion Proportion
$'000 $'000
Residential 905,249 30.46% 2.04% 3,437 887,179 31.66% 3,418
Commercial 128,886 4.34% -2.50% 362 132,186 4.72% 361
Industry 29,523 0.99% 3.77% 80 28,451 1.02% 81
Primary Production 1,841,123 61.96% 9.71% 2,454 1,678,175 59.91% 2,438
Vacant 40,640 1.37% 1.01% 463 40,235 1.44% 431
Other 26,243 0.88% -24.87% 136 34,928 1.25% 151
Total 2,971,664 100.01% 6.09% 6,932 2,801,154 100.00% 6,880
Budget 2020/21
2019/20
(valuations as at 28/06/2020)
Rate in Rate in
Rates Rates Rates Rates
Land Use Dollar Dollar
$ % $ %
$
Residential 0.005044 4,595,395 39.83% 0.004981 4,446,737 39.66%
Commercial 0.006860 845,080 7.33% 0.006724 848,740 7.57%
Industry 0.006860 205,451 1.78% 0.006724 192,686 1.72%
Primary Production 0.002976 5,534,550 47.97% 0.003163 5,364,065 47.84%
Vacant 0.005044 289,737 2.51% 0.004981 280,936 2.51%
Other 0.005044 67,331 0.58% 0.004981 78,893 0.70%
Total 11,537,544 99.99% 11,212,057 100.00%
25FUNDING THE BUSINESS
PLAN
Income
To fund the service levels outlined within this
Annual Business Plan the Council raises revenue
from a number of sources. 80 percent of Council’s
income will be raised through rate revenue,
which includes general rates $11.5m, fixed
charges for waste collection $0.8m and
community waste water $1m and the Regional
Landscape levy $0.5m which is a tax the Council
collects on behalf of the Northern and Yorke
Landscape Region.
$’000
Rates 13,892
Statutory charges 213
User charges 786
Grants, subsidies & contributions 2,282
Investment income 68
Reimbursements 182
Other income 25
Expenses
Council will expend $18.6m in operational items
to deliver the services outlined within this plan. This
includes $4.7m in employee costs as Council
continues to be one of the region’s major
employers and $5.7m of depreciation which the
Council is committed to fund so as to renew and
replace its infrastructure assets.
$’000
Employee costs 4,683
Materials, contracts & other expenses 7,971
Depreciation, amortisation & impairment 5,724
Finance costs 253
26FUNDING THE BUSINESS
PLAN continued
Capital Expenditure
Council will spend $4.2m in 2020/21 in renewing
and replacing assets that are nearing, or at the
end of their useful life, as well as $1.8m upgrading
those where an increased service level will
benefit the community. 70 percent of this capital
expenditure will be used on the Council’s
transport network which includes roads, footpaths
and bridges.
$'000
Land, Buildings and Other Structures 445
Transport 4,177
CWMS 70
Stormwater 405
Plant 464
Other 420
Within the above Capital Budget, Council has provided $300,000 unallocated
expenditure for COVID 19 Recovery.
27COUNCIL’S FINANCIAL
SUSTAINABILITY
OPERATING SURPLUS/(DEFICIT)
A council is financially sustainable if it achieves a positive operating surplus/(deficit) ratio over
time. Any surplus of income over expenses can be applied to future proposed capital
expenditure, reducing debt or increasing financial assets.
A short-term operating deficit may be justified to cater for a once-off or short-term fluctuation.
However, it should not happen on average over time. A zero rate means the current generation
of ratepayers is paying for what it is receiving in service levels; a deficit that they are not paying
enough and a surplus paying too much.
Clare & Gilbert Valleys Council is working hard to ensure its future long term sustainability, by
moving towards achieving ongoing small to marginal operating surpluses over time. It will do this
while keeping rate and service charges to a minimum and continuing to provide essential
services. The Council believes the previously forecasted rate increases are not sustainable for the
community. Therefore, the 2020-21 budget incorporates smaller rate increases and anticipates a
more significant deficit than the LTFP adopted in July 2019 and a delayed return to long term
surplus.
The Council will carry out further reviews of service levels to determine where there are savings to
return the operating result to a surplus in a shorter time frame.
NET FINANCIAL LIABILITIES
Net financial liabilities are defined as total liabilities less financial assets. These are expressed as a
percentage of total operating revenue and provides information on the Council’s overall
indebtedness. Where the ratio is falling, it indicates that the Council’s ability to meet its obligations
is strengthening. A council should endeavour to achieve a reducing financial liabilities ratio unless
the Council is increasing or improving its physical asset base if not, it may mean that a council is
funding ongoing deficits through debt.
28Clare & Gilbert Valleys Council is minimising debt. It anticipates that it will require no new
borrowings in 2020-21, using surplus cash instead to fund new capital expenditure to the value of
$1.491 million.
ASSET RENEWAL FUNDING RATIO
The asset renewal funding ratio expresses the total expenditure on asset replacement and
renewal as a percentage of the indexed spending required per Council’s Asset Management
Plans.
Clare & Gilbert Valleys Council will be expending 16% less, or $770,000 on the replacement of its
assets compared to what is indicated in its Asset Management plans in 2020-21. This reduction
occurs from the decision not to replace old plant until future years and using the 2020-21 year to
scope and plan renewal projects delaying expenditure until the 2021-22 financial year.
29STATEMENT OF COMPREHENSIVE INCOME
2018/19 2019/20 2020/21
Audited Original
Budget
Actual Budget
$'000 $'000 $'000
INCOME
Rates 13,158 13,498 13,892
Statutory charges 229 218 213
User charges 884 856 786
Grants, subsidies & contributions 4,078 2,075 2,282
Investment income 205 176 68
Reimbursements 288 180 182
Other income 65 50 25
Total Income 18,907 17,053 17,448
EXPENSES
Employee costs 4,218 4,542 4,683
Materials, contracts & other 8,051 7,420 7,971
Depreciation 5,399 5,267 5,724
Finance costs 396 320 253
Total Expenses 18,064 17,549 18,631
OPERATING SURPLUS / (DEFICIT) 843 (496) (1,183)
Asset disposal & fair value adjustments (1,019) - (23)
Amounts specifically received for new or upgraded
591 315 300
assets
Physical Resources received free of charge - - -
(428) 315 277
NET SURPLUS/(DEFICIT)
Transferred to Equity Statement 415 (181) (906)
Other Comprehensive Income
Changes in revaluation surplus 5,998 - -
Impairment (Expense) / recoupments offset to asset
(44) - -
revaluation reserve
Total Other Comprehensive Income 5,954 - -
TOTAL COMPREHENSIVE INCOME 6,369 (181) (906)
30STATEMENT OF FINANCIAL POSITION
2018/19 2019/20 2020/21
Audited Original
Budget
Actual Budget
$'000 $'000 $'000
ASSETS
Current Assets
Cash and cash equivalents 7,380 2,454 2,535
Trade & other receivables 1,059 887 1,381
Financial Assets 264 267 271
Inventories 456 211 300
Non Current Assets Held for Resale 310 - -
Total Current Assets 9,469 3,819 4,487
Non-current Assets
Financial assets 199 155 84
Infrastructure, property, plant & equipment 147,428 146,316 148,204
Other Non-Current Assets 989 731 989
Total Non-current Assets 148,616 147,202 149,277
Total Assets 158,085 151,021 153,764
LIABILITIES
Current Liabilities
Trade & other payables 1,839 1,004 505
Borrowings 1,078 983 376
Provisions 1,066 1,159 1,278
Total Current Liabilities 3,983 3,146 2,159
Non-current Liabilities
Borrowings 3,729 2,746 2,370
Provisions 16 93 64
Equity Accounted Council Business 292 265 292
Total Non-current Liabilities 4,037 3,104 2,726
Total Liabilities 8,019 6,250 4,885
NET ASSETS 150,066 144,771 148,879
EQUITY
Accumulated Surplus 9,808 10,417 8,621
Asset Revaluation Reserves 131,115 125,161 131,115
Other Reserves 9,143 9,193 9,143
Total Council Equity 150,066 144,771 148,879
31STATEMENT OF CHANGES IN EQUITY
Asset
Accumulated Other TOTAL
Revaluation
Surpluses Reserves EQUITY
Reserve
$'000 $'000 $'000 $'000
2018/19 Audited Actual
Balance at end of previous reporting period 9,393 125,161 9,143 143,697
Net Surplus/(Deficit) for Year 415 - - 415
Other Comprehensive Income
Gain on revaluation of infrastructure,
- 5,954 - 5,954
property, plant & equipment
Transfers between reserves - - - -
Balance at end of period 9,808 131,115 9,143 150,066
2019/20 Original Budget
Balance at end of previous reporting period 10,598 125,161 9,193 144,952
Net Surplus/(Deficit) for Year (181) - - (181)
Other Comprehensive Income
Gain on revaluation of infrastructure,
- - - -
property, plant & equipment
Transfers between reserves - - - -
Balance at end of period 10,417 125,161 9,193 144,771
2020/21 Budget
Balance at end of previous reporting period 9,527 131,115 9,143 149,785
Net Surplus/(Deficit) for Year (906) - - (906)
Other Comprehensive Income - - - -
Gain on revaluation of infrastructure,
- - - -
property, plant & equipment
Transfers between reserves - - - -
Balance at end of period 8,621 131,115 9,143 148,879
32STATEMENT OF CASH FLOWS
2018/19 2019/20 2020/21
Audited Original
Budget
Actual Budget
$'000 $'000 $'000
CASH FLOWS FROM OPERATING ACTIVITIES
Receipts
Rates - general & other 13,391 13,498 13,317
Fees & other charges 229 218 213
User charges 1,491 856 1,050
Investment receipts 217 176 68
Grants utilised for operating purposes 4,078 2,075 2,282
Reimbursements 288 180 182
Other revenues 29 43 25
Payments
Employee costs (4,206) (4,418) (4,547)
Materials, contracts & other expenses (7,825) (7,420) (9,148)
Finance payments (363) (320) (253)
Net Cash provided by (or used in) Operating
7,329 4,888 3,189
Activities
CASH FLOWS FROM INVESTING ACTIVITIES
Receipts
Amounts specifically for new or upgraded assets 591 315 300
Sale of replaced assets 32 185 62
Sale of surplus assets - - 1,100
Repayments of Loans by community groups 61 55 134
Payments
Expenditure on renewal/replacement of assets (6,910) (4,839) (4,189)
Expenditure on new/upgraded assets (447) (2,048) (1,791)
Net purchase of investment securities (4) - -
Loans to community groups - - -
Net Cash provided by (or used in) Investing
(6,677) (6,332) (4,384)
Activities
CASH FLOWS FROM FINANCING ACTIVITIES
Payments
Repayments of borrowings (1,165) (1,079) (982)
Repayment of finance lease liabilities - - -
Net Cash provided by (or used in) Financing
(1,165) (1,079) (982)
Activities
Net Increase (Decrease) in cash held (513) (2,523) (2.177)
Cash & cash equivalents at beginning of period 7,893 4,977 4,712
Cash & cash equivalents at end of period 7,380 2,454 2,535
33UNIFORM PRESENTATION OF FINANCES
2018/19 2019/20 2020/21
Audited Original
Budget
Actual Budget
$'000 $'000 $'000
Income 18,907 17,053 17,448
less Expenses 18,064 17,549 18,631
Operating Surplus / (Deficit) 843 (496) (1,183)
Net Outlays on Existing Assets
Capital Expenditure on renewal and replacement
(6,910) (4,839) (4,189)
of Existing Assets
Depreciation, Amortisation and Impairment 5,399 5,267 5,724
Proceeds from Sale of Replaced Assets 32 185 62
(1,479) 613 1,597
Net Outlays on New and Upgraded Assets
Capital Expenditure on New and Upgraded Assets
(including investment property & real estate (447) (2,048) (1,791)
developments)
Amounts received specifically for New and
591 315 300
Upgraded Assets
Proceeds from Sale of Surplus Assets - 1,100
144 (1,733) (391)
Net Lending / (Borrowing) for Financial Year (492) (1,616) 23
34FORECASTED FINANCIAL INDICATORS
2018/19 2019/20 2020/21
Audited Original
Budget
Actual Budget
$'000 $'000 $'000
Operating Surplus Ratio 4.5% (3%) (7%)
Operating Surplus 843 (496) (1,183)
Total Operating Income 18,907 17,053 17,448
This ratio expresses the operating surplus as a
percentage of total operating revenue.
Net Financial Liabilities Ratio (6%) 13% 2%
Net Financial Liabilities (1,175) 2,222 322
Total Operating Income 18,907 17,053 17,448
Net Financial Liabilities are defined as total liabilities
less financial assets. These are expressed as a
percentage of total operating revenue.
Asset Renewal Funding Ratio 149% 96% 84%
Net Asset Renewals 6,878 4,839 4,189
Infrastructure & Asset Management Plan required
4,625 5,056 4,966
expenditure
Net asset renewals expenditure is defined as net
capital expenditure on the renewal and
replacement of existing assets, and excludes new
capital expenditure on the acquisition of additional
assets.
35You can also read