COVID-19 Economic Impacts - Beware the Ides of March A Day Romans Settled Debts - assets.kpmg
←
→
Page content transcription
If your browser does not render page correctly, please read the page content below

COVID-19
Economic Impacts
Beware the Ides of March
A Day Romans Settled Debts

March 19, 2020

KPMG Economics
Constance L. Hunter, CBE   Kenneth Kim, CBE
Chief Economist            Senior Economist
@constancehunter           kennethkim2@kpmg.com
constancehunter@kpmg.com

Henry Rubin
Economic Analyst
henryrubin@kpmg.com
The Federal Reserve held an emergency FOMC meeting on March 15th at which they cut interest rates by 100
                              basis points and announced multiple measures to assist debt capital market liquidity

               “The purpose of the following pages is to study the problem of debt in Rome of the Ciceronian age. A part of this
                   argument will be uncontroversial or at least familiar; that is, the way in which Roman politicians lived in
                                                     prolonged states of indebtedness”

                                                                 M.W. Frederiksen, Caesar, Cicero and The Problem of Debt

                   “There is an inverse relationship between flattening the caseload curve and the economic cost. Flattening the
                   caseload curve is critical but it comes with an economic cost if other measures are not also taken. Even with
                    substantial government assistance “L” shaped downturns may be unavoidable as corporate debt levels are
                                                      simply too high to avoid a day of reckoning.”

                                                                                                                             C. L. Hunter

                               © 2020 KPMG LLP, a Delaware limited liability partnership and the U.S. member firm of the KPMG network of independent member firms affiliated with KPMG International
                               Cooperative (“KPMG International”), a Swiss entity. All rights reserved.
                                                                                                                                                                                                       2

March 19th, 2020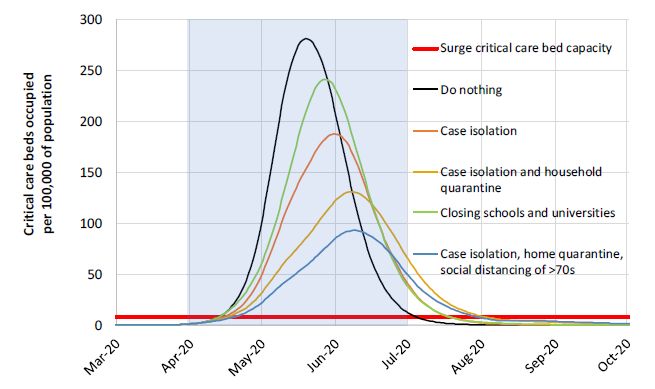
Mapping and Analyzing the COVID-19 Outbreak

                                        1             The Debt Connection

                                        2             Economics of Social Distancing

                                        3             Debt and Social Distancing Interact

                                        4             Concluding Thoughts

                     © 2020 KPMG LLP, a Delaware limited liability partnership and the U.S. member firm of the KPMG network of independent member firms affiliated with KPMG International
                     Cooperative (“KPMG International”), a Swiss entity. All rights reserved.
                                                                                                                                                                                             3

March 19th, 2020
In a growing economy debt amplifies growth, at first
                   Debt Amplifies Growth Through All Channels of Growth                                                                                                                         •   From Roman to modern times,
                                                                                                                                                                                                    expanding debt is a time-
                                                                     Debt to Firms                                                                                                                  honored way to grow
                                                                         and
                                                                                                                                                                                                    economies.
                                                                     Households
                                                                       Expands                                                                                                                  •   Economies that expand debt
                                                                                                                                                                                                    either too quickly or too much
                      Expectations of                                                                              Consumption                                                                      eventually face increased risk
                      Future Growth                                                                                  Grows                                                                          premia; that is higher
                         Expand                                                                                                                                                                     borrowing costs.
                                                                                                                                                                                                •   Higher borrowing costs slow
                                                                                                                                                                                                    growth and can lead to a
                                                                                                                                                                                                    vicious circle of unwinding debt
                                                                                                                                                                                                    like the world experienced in
                                                                                                                            Asset                                                                   the global financial crisis.
                          Investment
                                                                                                                            Prices                                                              •   Adverse shocks can also slow
                            Grows
                                                                                                                             Rise                                                                   growth which can be
                                                                                                                                                                                                    problematic as debt levels are
                                                                                                                                                                                                    no longer sustainable at a
                                                                        Jobs Grow                                                                                                                   lower growth rate.

                        © 2020 KPMG LLP, a Delaware limited liability partnership and the U.S. member firm of the KPMG network of independent member firms affiliated with KPMG International
                        Cooperative (“KPMG International”), a Swiss entity. All rights reserved.
                                                                                                                                                                                                                               4

March 19th, 2020
A shock turns the growth cycle into a downward debt spiral
                   Debt Amplifies Contraction Through All Channels of the Economy
                                                                                                                                                                                                     •   Sometimes debt expansions
                                                                           Shock Hits                                                                                                                    grow enough that no adverse
                                                                           Economy/                                                                                                                      impacts are felt.
                                                                            Financial                                                                                                                •   More often, debt grows too
                                                                            Markets                                                                                                                      much and adverse
                           Expectations of                                                                                                                                                               consequences lead to an
                           Future Growth                                                                                Consumption                                                                      unwind of the debt.
                              Decline                                                                                    Contracts
                                                                                                                                                                                                     •   The unwind can be orderly or,
                                                                                                                                                                                                         as is more often the case,
                                                                                                                                                                                                         disorderly.
                                                                                                                                                                                                     •   The adverse shock of
                                                                                                                                                                                                         coronavirus is a combination of
                                                                                                                                                                                                         supply shock, demand shock
                            Investment                                                                                  Asset Prices                                                                     and financial markets shock.
                               Falls                                                                                        Fall
                                                                                                                                                                                                     •   The Federal Reserve and U.S.
                                                                                                                                                                                                         Government are taking
                                                                                                                                                                                                         measures to lead to a more
                                                                          Jobs Decline                                                                                                                   orderly unwind but there is
                                                                                                                                                                                                         growing concern around timing.
                             © 2020 KPMG LLP, a Delaware limited liability partnership and the U.S. member firm of the KPMG network of independent member firms affiliated with KPMG International
                             Cooperative (“KPMG International”), a Swiss entity. All rights reserved.
                                                                                                                                                                                                                                         5

March 19th, 2020
Risks interact with one another to produce the outcome

                                                         6
Covid-19 will interplay with debt levels and capital markets

                                                               7
The global economy in precarious place to handle shocks
                                                           Real GDP Growth Rates %                                                                                                                        •   The risk of a global recession in
                                                                                                                                                                                                              2020 is extremely high as nations
        Top 10 Countries by GDP                                               2017                                             2018                                             2019
                                                                                                                                                                                                              shutdown economic activity to limit
  1                      U.S.                                                  2.4                                               2.9                                              2.3                         the spread of COVID-19.
                                                                                                                                                                                                          •   COVID-19 is unique in that it is a
  2                     China                                                  6.9                                               6.7                                              6.1
                                                                                                                                                                                                              supply shock, a demand shock,
  3                     Japan                                                  2.2                                               0.3                                              0.7                         and also a market shock.
  4                   Germany                                                  2.8                                               1.5                                              0.6                     •   As production is curtailed around
                                                                                                                                                                                                              the world, many firms will not have
  5                      U.K.                                                  1.9                                               1.3                                              1.4                         necessary inputs.
  6                     France                                                 2.4                                               1.7                                              1.3                     •   A severe demand shock is also
                                                                                                                                                                                                              underway.
  7                      India                                                 6.5                                               6.7                                              5.3
                                                                                                                                                                                                          •   A hopeful “V” or “U” shaped
  8                      Italy                                                 1.7                                               0.7                                              0.3                         recovery depends on the timing
                                                                                                                                                                                                              and magnitude of government
  9                     Brazil                                                 1.3                                               1.3                                              1.1
                                                                                                                                                                                                              assistance as well as the level
 10                    Canada                                                  3.2                                               2.0                                              1.6                         of corporate debt, and how
                                                                                                                                                                                                              companies and markets cope
      Notes: Annual growth rate y/y%
      Source: KPMG Economics, Respective Countries’ National Statistics Office, Haver Analytics
                                                                                                                                                                                                              with lower demand.

                                  © 2020 KPMG LLP, a Delaware limited liability partnership and the U.S. member firm of the KPMG network of independent member firms affiliated with KPMG International
                                  Cooperative (“KPMG International”), a Swiss entity. All rights reserved.
                                                                                                                                                                                                                                           8

March 19th, 2020
COVID-19 shows up in high frequency manufacturing
Mfg PMI
Europe Jun-19 Jul-19 Aug-19 Sep-19 Oct-19 Nov-19 Dec-19 Jan-20 Feb-20 • The global impact of China’s
France 51.9 49.7 51.1 50.1 50.7 51.7 50.4 51.1 49.8
slowdown was felt around the
Germany 45.0 43.2 43.5 41.7 42.1 44.1 43.7 45.3 48.0
Ireland 49.8 48.7 48.6 48.7 50.7 49.7 49.5 51.4 51.2
world; a PMI reading below 50
Italy 48.4 48.5 48.7 47.8 47.7 47.6 46.2 48.9 48.7 indicates recessionary
Spain 47.9 48.2 48.8 47.7 46.8 47.5 47.4 48.5 50.4 conditions.
U.K. 48.0 48.0 47.4 48.3 49.6 48.9 47.5 50.0 51.7
• The virus outbreak has
Americas
Brazil 51.0 49.9 52.5 53.4 52.2 52.9 50.2 51.0 52.3 disrupted manufacturing supply
Canada 49.2 50.2 49.1 51.0 51.2 51.4 50.4 50.6 51.8 chains and sharply curtailed
Mexico 49.2 49.8 49.0 49.1 50.4 48.0 47.1 49.0 50.0 energy and commodity demand.
U.S. 50.7 50.4 50.3 51.1 51.3 52.6 52.4 51.9 50.7
Asia & Pacific
• What was previously a
Australia 52.0 51.6 50.9 50.3 50.0 49.9 49.2 49.6 50.2 manufacturing-only recession
China 49.4 49.9 50.4 51.4 51.7 51.8 51.5 51.1 40.3 has now spread to the services
Japan 49.3 49.4 49.3 48.9 48.4 48.9 48.4 48.8 47.8 sector.
Korea 47.5 47.3 49.0 48.0 48.4 49.4 50.1 49.8 48.7
India 52.1 52.5 51.4 51.4 50.6 51.2 52.7 55.3 54.5 • We anticipate the March PMI
Indonesia 50.6 49.6 49.0 49.1 47.7 48.2 49.5 49.3 51.9 data for both services and
Malaysia 47.8 47.6 47.4 47.9 49.3 49.5 50.0 48.8 48.5 manufacturing to reflect growing
Singapore 49.6 49.8 49.9 49.5 49.6 49.8 50.1 50.3 48.7 economic stress as social
Vietnam 52.5 52.6 51.4 50.5 50.0 51.0 50.8 50.6 49.0
distancing causes a sharp
decline in demand.
Source: KPMG Economics, IHS Markit, Haver Analytics (Feb 2020)
Note: The Purchasing Managers Index (PMI) is a monthly survey of industry that is a real-time snapshot of economic conditions.
It is a diffusion index and a reading greater than 50 indicates expansion while a reading below 50 indicates contraction.
© 2020 KPMG LLP, a Delaware limited liability partnership and the U.S. member firm of the KPMG network of independent member firms affiliated with KPMG International
Cooperative (“KPMG International”), a Swiss entity. All rights reserved.
9
March 19th, 2020Elevated debt levels make social distancing more costly
Private Nonfinancial Sector Credit • Government efforts to extend
(% of GDP) credit terms for households and
businesses may not come in time
Canada 102% 115% to avoid significant debt defaults.
France 61% 155% • The higher the debt levels the
more costly and economically
China 54% 150% damaging social distancing is for
U.K. 84% 82% an economy.
Japan 59% 103% • U.S. debt capital markets have
seen significant strain as the
U.S. 75% 75% coronavirus spreads globally.
Germany 54% 59% • Outflows from high grade, high
yield and municipal bonds have
Italy 41% 69% been significant. Spreads for
Household Sector
Brazil 30% 43% corporate bonds have widened
Corporate Sector hundreds of basis points.
India 12% 44% Additionally, Treasury market
strain is also being seen in ways
0% 40% 80% 120% 160% 200% 240% that did not manifest during the
Source: KPMG Economics, BIS, Haver Analytics (Q3 2019) global financial crisis of 08.
Excludes Luxembourg, Netherlands, Sweden and others with higher ratios due to smaller GDP size
© 2020 KPMG LLP, a Delaware limited liability partnership and the U.S. member firm of the KPMG network of independent member firms affiliated with KPMG International
Cooperative (“KPMG International”), a Swiss entity. All rights reserved.
10
March 19th, 2020The Economics of Social Distancing
Nations must lower peak to avoid overwhelming health systems
                                                                                                                                                                                                        •   According to a paper by UC
     Flattening the Pandemic Curve
                                                                                                                                                                                                            Berkley economist,
     300                                                                                                                                                                                                    Gournichas, if 50% of the world
 New                                                                                                                                                                                                        is infected, 1% of the world, 76
                                                         Delay peak                                                                                                                                         million people would die.1
Cases
   250
                                                                                                                                                                                                        •   This assumption is based on
                                                                                                                                                                                                            the available critical care beds
     200                          Without                                                                                                                                                                   and a 2% case fatality rate.
                                                                                                    Reduce
                                preventative                                                                                                                                                            •   A strong policy response
                                                                                                     peak
                                 measures                                                                                                                                                                   includes measures that both
                                                                                                     cases
     150                                                                                                                                                                                                    delay and reduce the peak
                                                                                                                                                                                                            number of new cases to
                                                                                                                                      Health system capacity                                                prevent the health care system
     100                                                                                                                                                                                                    from being overrun.
                                                                                                                                                                                                        •   Ongoing research for more
                                                                                                                       With                                                                                 effective treatment and a
        50
                                                                                                                   preventative                                                                             possible vaccine do not solve
                                                                                                                    measures                                                                                the immediate problem of
          0                                                                                                                                                                                                 system capacity.
               0   1   2    3       4         5        6         7         8         9 10 11 12 13 14 15 16from
                                                                                                      Time    17 first
                                                                                                                  18 case
                                                                                                                       19 20
       Source: KPMG Economics, Chart Adapted from CDC/The Economist, 1Gournichas (2020)
                                © 2020 KPMG LLP, a Delaware limited liability partnership and the U.S. member firm of the KPMG network of independent member firms affiliated with KPMG International
                                Cooperative (“KPMG International”), a Swiss entity. All rights reserved.
                                                                                                                                                                                                                                      12

March 19th, 2020
Illness can be severe and lengthy, even with treatment
Symptom Timeline of First U.S. COVID-19 Patient
Hospital • COVID-19 infection begins with
Travel a 2-14 day incubation period
from Urgent Day Day Day Day Day Day Day Day Day Day Day before symptoms arise
China Work Work Home Care 1 2 3 4 5 6 7 8 9 10 11
followed by severe flu-like
Day of Illness 1 2 3 4 5 6 7 8 9 10 11 12 13 14 15
Subjective Subjective
symptoms for ~2 weeks.
Fever (°C) fever fever
37.2 37.9 39 39.4 39.1 39.4 38.8 39.4 37.3 36.8 36.8 36.3
• At present, research suggests
Cough that approximately 20% of
those who contract COVID-19
Rhinorrhea
will need hospital treatment
Fatigue that is extensive.
Nausea • This puts significant strain on
healthcare facilities as well as
Vomiting
on the economy.
Diarrhea
Abdominal
Discomfort
Jan. Jan. Jan. Jan. Jan. Jan. Jan. Jan. Jan. Jan. Jan. Jan. Jan. Jan. Jan. Jan.
15 16 17 18 19 20 21 22 23 24 25 26 27 28 29 30
Date
Source: KPMG Economics, World Health Organization
© 2020 KPMG LLP, a Delaware limited liability partnership and the U.S. member firm of the KPMG network of independent member firms affiliated with KPMG International
Cooperative (“KPMG International”), a Swiss entity. All rights reserved.
13
March 19th, 2020Scenario analysis for the UK shows social distancing needed
Policy Description
Mitigation Strategy for the U.K.
Symptomatic cases stay at home for 7 days, reducing
Case isolation in the non-household contacts by 75% for this period.
home Household contacts remain unchanged. Assume 70% of
household comply with the policy.
Following identification of a symptomatic case in the
household, all household members remain at home for
Voluntary home
14 days. Household contact rates double during this
quarantine
quarantine period, contacts in the community reduce by
75%. Assume 50% of household comply with the policy.
Reduce contacts by 50% in workplaces, increase
Social distancing of those
household contacts by 25% and reduce other contacts
over 70 years of age
by 75%. Assume 75% compliance with policy.
All households reduce contact outside household,
Social distancing of entire school or workplace by 75%. School contact rates
population unchanged, workplace contact rates reduced by 25%.
Household contact rates assumed to increase by 25%.
Closure of all schools, 25% of universities remain open.
Closure of schools and Household contact rates for student families increase by
universities 50% during closure. Contacts in the community increase
by 25% during closure.
Source: KPMG Economics, Imperial College COVID-19 Response Team, Neil Ferguson (2020)
© 2020 KPMG LLP, a Delaware limited liability partnership and the U.S. member firm of the KPMG network of independent member firms affiliated with KPMG International
Cooperative (“KPMG International”), a Swiss entity. All rights reserved.
14
March 19th, 2020Medical professionals make comparison to SARs in 2003
Total Confirmed Cases as of March 19, 2020
Logarithmic Scale • The majority (65%) of cases are
now outside of China.
256000 9600
• Many analysts are highlighting
128000 the similar path of the outbreak to
4800 SARS. While the absolute
64000 numbers are larger with Covid-
19, the pattern of infection is
32000 Total COVID-19 Cases, 2400 similar, so far.
1/20/20 to Today (LHS)
16000 • To stay abreast of developments,
Total SARS Cases, 1200 we encourage people follow the
8000 3/17/03 to 5/31/03 (RHS) WHO, New England Journal of
4000 600 Medicine, and The Lancet to
name a few.
2000 • On January 31, 2020, 94
300
1000 academic journals, societies,
institutes, and companies signed
500 150 a commitment to making
research and data on the disease
freely available, at least for the
duration of the outbreak.
Source: KPMG Economics, World Health Organization, COVID-19 on the left-hand side, SARS on the right-hand side
© 2020 KPMG LLP, a Delaware limited liability partnership and the U.S. member firm of the KPMG network of independent member firms affiliated with KPMG International
Cooperative (“KPMG International”), a Swiss entity. All rights reserved.
15
March 19th, 2020Inverse relationship between health and economic impact
Flattening the Recession Curve • Flattening the caseload curve
is critical but it comes with an
economic cost if other
measures are not also taken.
• Governments are learning by
doing when addressing the
economic risks of closing the
economy and asking citizens to
engage in social distancing.
• Countries with higher levels of
debt will require greater
assistance by their
governments to prevent “L”
shaped economic downturns.
• Even with substantial
government assistance,
“L” shaped downturns may be
unavoidable.
Source: KPMG Economics, Gournichas (2020)
© 2020 KPMG LLP, a Delaware limited liability partnership and the U.S. member firm of the KPMG network of independent member firms affiliated with KPMG International
Cooperative (“KPMG International”), a Swiss entity. All rights reserved.
16
March 19th, 2020Social distancing leads to a collapse in activity
Change in Total Restaurant Diners • Global restaurant diners were
Year over Year - % Change down 89% year-over-year as of
20% 20% March 18th. Data suggests this
will fall to a 100% decline and
remain there for several
0% 0% weeks.
• Restaurants are a useful proxy
-20% -20% for person to person retail
United States activity.
-40% United Kingdom -40% • Many restaurants, already
Canada operating on thin margins, will
Mexico be forced to lay off staff and/or
-60% -60% close in the coming weeks.
Germany
Australia • Weekly unemployment claims
-80% -80% in the U.S. surged 33% wk/wk
Ireland
data released for the week of
-100% -100% March 14th.
Source: KPMG Economics, OpenTable (March 18, 2020), Haver Analytics
© 2020 KPMG LLP, a Delaware limited liability partnership and the U.S. member firm of the KPMG network of independent member firms affiliated with KPMG International
Cooperative (“KPMG International”), a Swiss entity. All rights reserved.
17
March 19th, 2020Cell phone traffic data reveal many retail outlets see decline
Visits Index ( 2020 vs. 2019)
Source: KPMG Economics, KPMG Strategy, SafeGraph Foot Traffic
© 2020 KPMG LLP, a Delaware limited liability partnership and the U.S. member firm of the KPMG network of independent member firms affiliated with KPMG International
Cooperative (“KPMG International”), a Swiss entity. All rights reserved.
18
March 19th, 2020Already weak auto sales will see bigger declines in March
City-level Automobile Dealers Foot Traffic Visits Index ( 2020 vs. 2019)
Source: KPMG Economics, KPMG Strategy, SafeGraph Foot Traffic
© 2020 KPMG LLP, a Delaware limited liability partnership and the U.S. member firm of the KPMG network of independent member firms affiliated with KPMG International
Cooperative (“KPMG International”), a Swiss entity. All rights reserved.
19
March 19th, 2020Those with fewer resources most likely to be laid off
How U.S. Adults Cover an Unexpected $400 Expense
• 24% of U.S. workers do not
75% have paid sick leave. This
population is likely to be most
61% vulnerable economically should
Nearly 40% of U.S.
the virus spread.
adults could not cover
a $400 expense • Some large firms are able to
50% change their policies in the face
of the health crisis, but many
are too small to offer such
assistance.
27% • 9.4% of Americans do not have
25% healthcare. This population be
adversely impacted even with
12% changes implemented to make
testing widely available for free.
• Government assistance to those
0% most in need is critical, but will
Cash, savings, or credit Borrow or sell something Could not cover the likely be too late to avoid lost
card expense consumption for a month.
Source: KPMG Economics, Federal Reserve Board (2019)
© 2020 KPMG LLP, a Delaware limited liability partnership and the U.S. member firm of the KPMG network of independent member firms affiliated with KPMG International
Cooperative (“KPMG International”), a Swiss entity. All rights reserved.
20
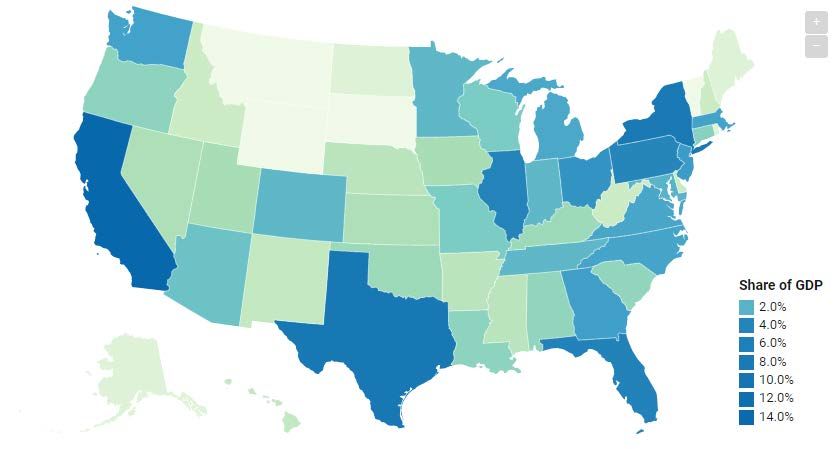
March 19th, 2020Lower wage industries have greater multipliers in downturn
Industry Earnings and Share of U.S. GDP
$45/hour • Lower wage workers are less
Utilities Information likely to have savings and are
the most likely to be unable to
meet even non-discretionary
Finance & Related spending needs.
Professional &
• Thus the multiplier on how
Average Hourly Earnings
Mining Business Services
$35/hour
COVID-19 impacts the
Wholesale Trade
economy is greater for low
Construction
wage employees, we estimate
Education & Health
Other Services, between 1.3-1.7x the size of
Except Government Manufacturing the industry in terms of
$25/hour
Risk Level economic impact.
Transportation & High Risk • Social distancing and
Warehousing At Risk collapsing trade will impact the
Retail Trade
Leisure & Hosp. sectors highlighted in orange
the most but no sector will
escape unscathed.
$15/hour
0% 5% 10% 15% 20% 25%
Industry Share of Nominal GDP
Note: Industries/employees most at risk are denoted with an orange circle
Source: KPMG Economics, BLS, BEA, Haver Analytics
© 2020 KPMG LLP, a Delaware limited liability partnership and the U.S. member firm of the KPMG network of independent member firms affiliated with KPMG International
Cooperative (“KPMG International”), a Swiss entity. All rights reserved.
21
March 19th, 2020Goods trade with China centered on machinery and agriculture
U.S. Trade Exposure to China (2017)
HS2
Top 5 Imports Top 5 Exports
Total Share of Imports Share of Total Total Share of Imports Share of Total
($Bil.) from China U.S. Imports ($Bil.) from China U.S. Exports
Machines $240.0 50% 10.3% Transportation $28.1 21% 1.2%
Miscellaneous $61.9 13% 2.6% Machines $25.3 19% 1.1%
Textiles $39.3 8% 1.7% Vegetable Products $15.3 11% 0.7%
Metals $24.0 5.0% 1.0% Chemical Products $11.7 8.8% 0.5%
Plastics and Rubbers $20.0 4.2% 0.9% Instruments $11.7 8.8% 0.5%
HS4
Top 5 Imports Top 5 Exports
Total Share of Imports Share of Total Total Share of Imports Share of Total
($Bil.) from China U.S. Imports ($Bil.) from China U.S. Exports
Broadcasting Equipment $67.4 14% 2.9% Planes, Helicopters, and Spacecraft $13.4 10% 0.6%
Computers $46.6 10% 2.0% Soybeans $12.4 9% 0.5%
Office Machine Parts $26.9 6% 1.1% Cars $11.5 9% 0.5%
Models and Stuffed Animals $12.5 2.6% 0.5% Integrated Circuits $7.75 5.8% 0.3%
Other Furniture $11.7 2.4% 0.5% Crude Petroleum $3.91 2.9% 0.2%
HS6
Top 5 Imports Top 5 Exports
Total Share of Imports Share of Total Total Share of Imports Share of Total
($Bil.) from China U.S. Imports ($Bil.) from China U.S. Exports
Transmit-receive Apparatus (TV, Radio, etc.) $67.4 14% 2.9% Fixed Wing Aircraft $13.1 10% 0.6%
Computer Data Storage Units $37.4 8% 1.6% Soybeans $12.4 9% 0.5%
Parts and Accessories of Data Processing Equip. $26.8 6% 1.1% Medium Sized Cars $8.39 6% 0.4%
Toys $12.5 2.6% 0.5% Monolithic Integrated Circuits $7.71 5.8% 0.3%
Color TVs and Monitors $9.01 1.9% 0.4% Petroleum $3.81 2.9% 0.2%
Source: KPMG Economics, MIT Observatory of Economic Complexity
© 2020 KPMG LLP, a Delaware limited liability partnership and the U.S. member firm of the KPMG network of independent member firms affiliated with KPMG International
Cooperative (“KPMG International”), a Swiss entity. All rights reserved.
22
March 19th, 2020Trade with Italy concentrated in medical, autos, chemicals
U.S. Trade Exposure to Italy (2017)
HS2
Top 5 Imports Top 5 Exports
Total Share of Imports Share of Total Total Share of Imports Share of Total
($Bil.) from Italy U.S. Imports ($Bil.) from Italy U.S. Exports
Machines $9.7 22% 0.4% Chemical Products $5.1 30% 0.3%
Transportation $9.2 21% 0.4% Machines $3.1 19% 0.2%
Chemical Products $6.8 15% 0.3% Mineral Products $1.7 10% 0.1%
Foodstuffs $3.5 7.7% 0.1% Transportation $1.2 7.0% 0.1%
Metals $2.1 4.7% 0.1% Instruments $1.1 6.4% 0.1%
HS4
Top 5 Imports Top 5 Exports
Total Share of Imports Share of Total Total Share of Imports Share of Total
($Bil.) from Italy U.S. Imports ($Bil.) from Italy U.S. Exports
Cars $5.0 11% 0.2% Packaged Medicaments $1.9 11% 0.1%
Packaged Medicaments $3.6 8% 0.2% Human or Animal Blood and Vaccines $1.8 11% 0.1%
Wine $1.8 4% 0.1% Gas Turbines $0.9 5% 0.1%
Passenger and Cargo Ships $1.6 3.6% 0.1% Crude Oil $0.62 3.7% 0.0%
Human or Animal Blood and Vaccines $1.2 2.6% 0.1% Aircraft Parts $0.62 3.7% 0.0%
HS6
Top 5 Imports Top 5 Exports
Total Share of Imports Share of Total Total Share of Imports Share of Total
($Bil.) from Italy U.S. Imports ($Bil.) from Italy U.S. Exports
Medium Sized Cars $3.6 8% 0.2% Medicaments Nes, in Dosage $1.9 11% 0.1%
Medicaments Nes, in Dosage $2.6 6% 0.1% Blood, Toxins, Cultures, Medical Use $1.8 11% 0.1%
Cruise Ships and Boats $1.6 4% 0.1% Petroleum and Crude $0.62 4% 0.0%
Wines $1.4 3.1% 0.1% Aircraft Parts $0.57 3.4% 0.0%
Large Sized Cars $1.32 2.9% 0.1% Waste/Scrap, Precious Metals ex. Gold $0.45 2.7% 0.0%
Source: KPMG Economics, MIT Observatory of Economic Complexity
© 2020 KPMG LLP, a Delaware limited liability partnership and the U.S. member firm of the KPMG network of independent member firms affiliated with KPMG International
Cooperative (“KPMG International”), a Swiss entity. All rights reserved.
23
March 19th, 2020Federal Government Action: to date and near-term prospects
This month and next, Congress and the President have focused on three tranches of emergency measures in response
to COVID-19. One has been enacted; the second may be enacted by week’s end; the third remains conceptual.
Coronavirus Preparedness and Response Supplemental Appropriations Act, 2020 (Public Law 116-123) – March 6th
• $8.3 billion emergency relief law included $7.8 billion in discretionary funding.
• Mainly uses existing Department of Health and Human Services programs. Significant flow-downs to the states. (OGA
Executive Action Report available)
Families First Coronavirus Response Act (H.R. 6201) – March 18th
• Would require health insurers to cover COVID-19 test costs, sick and family leave benefits for employers with less
than 500 employees, offset with payroll tax credits.
Economic Stimulus Package – details to be determined
• Discussions of economic stimulus package that could exceed $1 trillion
• Sector-focused and individual-focused elements, perhaps including direct payments to Americans tiered by income
‘Stafford Act’ of 1988
Releases tens of billions of dollars from the Federal Emergency Management Agency’s (FEMA) Disaster Relief fund.
The declaration also allows the government to delay tax collections.
Source: KPMG Economics, KPMG’s Office of Government Affairs
© 2020 KPMG LLP, a Delaware limited liability partnership and the U.S. member firm of the KPMG network of independent member firms affiliated with KPMG International
Cooperative (“KPMG International”), a Swiss entity. All rights reserved.
24
March 19th, 2020Debt and Social Distancing
The VIX index is more than a barometer of market sentiment
    CBOE Volatility Index (VIX)                                                                                                                                                                         •   A higher VIX occurs in times of
                                                                                                                                                                                                            stock market sell-off.
                                                                   2008                                                                                               2009
              Jun        Jul               Aug                       Sep                      Oct                      Nov                     Dec                       Jan                            •   An elevated VIX is associated
     100                                                                                                                                                                                      100           with wider corporate bond
                                                                                                                                                                                                            spreads; the higher borrowing
                       COVID-19 Outbreak
                                                                                                                                                                                                            costs reduce corporate
                       Global Financial Crisis                                                                                                                                                              investment which in turn
        75                                                                                                                                                                                    75            reduces GDP.
                                                                                                                                                                                                        •   The VIX is an important tool for
                                                                                                                                                                                                            economists to model the knock-
        50                                                                                                                                                                                    50            on effects of market selloffs on
                                                                                                                                                                                                            capital spending.

        25                                                                                                                                                                                    25

          0                                                                                                                                                                                   0
              Nov        Dec                Jan                      Feb                     Mar                       Apr                     May                       Jun
                        2019                                                                          2020
       Source: KPMG Economics, Wall Street Journal (March 19, 2020), Haver Analytics
                                © 2020 KPMG LLP, a Delaware limited liability partnership and the U.S. member firm of the KPMG network of independent member firms affiliated with KPMG International
                                Cooperative (“KPMG International”), a Swiss entity. All rights reserved.
                                                                                                                                                                                                                                   26

March 19th, 2020
Stress appears in money markets, Fed establishes CPFF
U.S. 90-Day Nonfinancial Commercial Paper • A breakdown in market
(vs USD Swap OIS 3M spread) functioning for the commercial
bps paper market necessitated the
Financial Crisis
150 Fed to announce a
Commercial Paper Funding
Facility (CPFF) on March 17th
in order to support the flow of
100 credit to businesses which
ultimately distribute paychecks
to households.
• The commercial paper (CP)
50 market finances a wide range
of economic activity, supplying
credit and funding for auto
loans and mortgages.
0
• CP also supplies short-term
liquidity to meet the operational
needs of companies.
-50
Source: KPMG Economics, Bloomberg (March 13, 2020)
2002 2005 2008 2011 2014 2017 2020
Source: KPMG Economics, Bloomberg (March 17, 2020).
© 2020 KPMG LLP, a Delaware limited liability partnership and the U.S. member firm of the KPMG network of independent member firms affiliated with KPMG International
Cooperative (“KPMG International”), a Swiss entity. All rights reserved.
27
March 19th, 2020Banks estimated to have adequate capital buffers
Liquidity of Largest U.S. Banks • Capital buffers built up after the
global financial crisis are
Potential Credit Drawdowns Liquidity Pool
necessary as firms draw down on
credit lines provided by banks.
$159.5 billion
Citigroup $438.0 • Bloomberg estimates firms will
draw down at least $700 billion in
$158.7 credit lines.
Bank of America $464.0
• Bloomberg estimates this will
$151.8 entail selling “liquid” assets; this
JPMorgan $545.0 will no doubt cause continued
strain in the bond market, both
$139.5 treasuries and corporate fixed
Wells Fargo $373.0 income.
$57.4 • Assets assumed to be liquid are
Goldman Sachs $170.0 experiencing widening bid/offer
spreads as liquidity dries up in
$40.3 some markets.
Morgan Stanley $178.0 • Continued Fed liquidity support is
essential to keep markets
$0 $200 $400 $600 functioning.
Source: KPMG Economics, Bloomberg Economics, Company Filings
© 2020 KPMG LLP, a Delaware limited liability partnership and the U.S. member firm of the KPMG network of independent member firms affiliated with KPMG International
Cooperative (“KPMG International”), a Swiss entity. All rights reserved.
28
March 19th, 2020At least 25% Baa corporate bonds at risk of downgrade
U.S. Baa Corporate Bonds • Over 50% of investment grade
$136bn corporate bonds, a full $2.7tn,
$148bn Technology are rated Baa, which is the
Materials 5% $621bn
6% Financials lowest rung on the investment
$159bn 23% grade ratings ladder.
Utilities
6% • The most leveraged
companies will see their ability
$191bn
Consumer Discretionary to repay hampered by a
7% sudden decline in income.
• Rollover risk is also a
$225bn
significant factor, reflected in
Consumer Staples
$355bn
widening bond spreads.
8%
Health Care
13%
• In particular, energy firms face
substantial downgrade risk due
$241bn to the fall in oil prices below
Industrials $30 per barrel.
9%
$322bn • Consumer Discretionary,
$310bn Communications
Energy 12% Materials, Industrials and
11% Financials all face significant
challenges as well.
Source: KPMG Economics, Bloomberg (March 17, 2020), Total = $2.7tn
© 2020 KPMG LLP, a Delaware limited liability partnership and the U.S. member firm of the KPMG network of independent member firms affiliated with KPMG International
Cooperative (“KPMG International”), a Swiss entity. All rights reserved.
29
March 19th, 2020High yield corporate bonds at risk of default in a recession
U.S. HY Corporate Bonds • The consumer discretionary
$34bn and energy sectors are at a
$72bn Utilities particularly high risk of default
Consumer Staples $242bn
3%
6% Communications from an oil price below $30 and
$79bn 21%
a sudden fall in consumption.
Technology
7% • With auto assembly lines
closed, industries in that supply
$88bn
Industrials
chain are at high risk and we
8% expect elevated defaults in
industrials, materials, and high
yield financials.
$98bn
Energy $196bn
• Without a rapidly deployed
9% Consumer Discretionary federal assistance program to
17% distressed companies, defaults
are likely to be higher than
$108bn during the global financial
Materials crisis.
9%
$115bn
$114bn Financials
Health Care 10%
10%
Source: KPMG Economics, Bloomberg (March 18, 2020), Total = $1.2tn
© 2020 KPMG LLP, a Delaware limited liability partnership and the U.S. member firm of the KPMG network of independent member firms affiliated with KPMG International
Cooperative (“KPMG International”), a Swiss entity. All rights reserved.
30
March 19th, 2020CLOs account for about ½ of leveraged loan market
U.S. CLOs Outstanding • The U.S. collateralized loan
obligation (CLO) market
$Bil. $Bil.
reached $617bn at the end of
$600 $600 2018, accounting for
approximately half of U.S.
leveraged loans outstanding.
• Insurance companies (28%),
mutual funds (16%), banks
$400 $400 (15%), pension funds (10%)
held roughly half of Cayman-
issued CLOs at year-end 2018.
• A sudden drop in consumption
impacts the ability of
$200 $200 companies to repay and
widened bond spreads
increase the cost of rolling over
debt.
• There is a strong possibility
$0 $0 M&A and Private Equity will be
2006 2008 2010 2012 2014 2016 2018 adversely impacted.
Source: KPMG Economics, SIFMA
© 2020 KPMG LLP, a Delaware limited liability partnership and the U.S. member firm of the KPMG network of independent member firms affiliated with KPMG International
Cooperative (“KPMG International”), a Swiss entity. All rights reserved.
31
March 19th, 2020A strong dollar hurts dollar borrowers the world over
Foreign Currencies Weaker Against Dollar • A rush to safe haven assets such
% Chg. Jan 20th to Mar 17th, 2020 as the U.S. dollar, Yen and Euro
has caused other currencies to
Mexican Peso MXN, -14.9 weaken.
Brazilian Real BRL, -13.4
South African Rand ZAR, -10.9 • Around $3 trillion of loans are
Australian Dollar AUD, -9.7 outstanding in U.S. dollars that
Indonesian Rupiah IDR, -7.7 have been issued by non-U.S.
Turkish Lira TRY, -6.6 domiciled corporations and
British Pound GBP, -5.6 businesses.
Canadian Dollar CAD, -5.5
South Korean Won KRW, -5.0 • Commodity exporters which
Singapore Dollar SGD, -4.8 engaged in dollar funding are
Argentine Peso ARS, -4.6 going to be at risk of default as
Thai Baht THB, -4.6 commodities decline.
Indian Rupee INR, -3.8
Chinese Renminbi CNY, -2.0 • The Federal Reserve has opened
Swedish Krona SEK, -2.0 swap lines with global central
Philippine Peso PHP, -0.1 banks to ease dollar liquidity
Hong Kong Dollar HKD, -0.1 globally and to help stem the steep
Euro EUR, 0.1 appreciation of the U.S. Dollar.
Japanese Yen JPY, 2.4
-25% -20% -15% -10% -5% 0% 5% 10%
Source: KPMG Economics, BBG (March 17, 2020)
© 2020 KPMG LLP, a Delaware limited liability partnership and the U.S. member firm of the KPMG network of independent member firms affiliated with KPMG International
Cooperative (“KPMG International”), a Swiss entity. All rights reserved.
32
March 19th, 2020Weaker currencies raise concerns about EM debt burdens
China Debt Grows to $21 Trillion Over 10 years • Emerging market debt has
300% more than doubled in many
countries as the aftermath of
China Hong Kong the financial crisis ushered in
% Change NFC Debt 2009-Q3'19
an era of low and negative
Indonesia bond yields, seemingly
indefinitely.
200%
• Hong Kong, Mexico,
Singapore, Turkey, Indonesia,
and Brazil all borrowed
India Thailand substantial amounts of dollar-
Mexico denominated debt in relation
100% Singapore to their GDP; depreciations in
Poland Risk Level their currencies and in many
Turkey commodities will make it more
Malaysia High
Medium difficult to meet debt
Korea
Brazil Low obligations.
Russia
0%
0% 25% 50% 75%
USD-Denominated Share of Debt
Source: KPMG Economics, IIF, Haver Analytics
© 2020 KPMG LLP, a Delaware limited liability partnership and the U.S. member firm of the KPMG network of independent member firms affiliated with KPMG International
Cooperative (“KPMG International”), a Swiss entity. All rights reserved.
33
March 19th, 2020Oil prices decline, challenging the profitability of some firms
Oil Prices • Oil prices have fallen more
$80 $80 than 60% from their recent
peak in early January.
• Saudi Arabia slashed its crude
production and is threatening
$60 $60 record output after Russia
chose not to comply with
OPEC’s proposed production
cuts. Market share is worth
more than profitability to Saudi
$40 $40 Arabia.
WTI ($/Barrel) • Sustained oil prices below
Brent ($/Barrel) $30/barrel will impact U.S.
shale producers many of which
$20 $20 are heavily leveraged and
could face downgrades and
increased default rates.
$0 $0
Apr May Jun Jul Aug Sep Oct Nov Dec Jan Feb Mar
Source: KPMG Economics, EIA, CME Group, Financial Times, Haver Analytics (Mar 18, 2020)
© 2020 KPMG LLP, a Delaware limited liability partnership and the U.S. member firm of the KPMG network of independent member firms affiliated with KPMG International
Cooperative (“KPMG International”), a Swiss entity. All rights reserved.
34
March 19th, 2020Lofty oil price forecasts underpin many producer budgets
• IMF analysis of federal
budgets’ assumptions and
IMF Fiscal Breakeven Oil Prices in $/bbl breakeven prices suggest
continued downward pressure
Projections CDS Spread (bps)
on prices will strain producer
Country 2018 2019 2020 1-Jan-20 17-Mar-20 fiscal budgets.
Iran $82 $156 $195 - - • Issuing debt to maintain
Iraq $45 $62 $60 387 957 spending levels is becoming
increasingly costly as wider
Kuwait $54 $54 $55 36 102 credit default spreads indicate.
Russia $51 $49 - 55 202 • Capital markets are pricing in
Saudi Arabia $89 $86 $84 56 64 the risk that many producers
will face difficulties meeting
United Arab Emirates $67 $70 $70 91 323 fiscal obligations.
Note: Most recent CDS spreads for Russia and Saudi Arabia are from Mar 13 and Feb 24 respectively
Source: KPMG Economics, IMF “Regional Economic Outlook: Middle East and Central Asia”, Statistical Appendix Table 6, • Many face touch choices about
Economic Expert Group (Russia), Bloomberg cutting fiscal spending, risking
unrest among their
populations.
© 2020 KPMG LLP, a Delaware limited liability partnership and the U.S. member firm of the KPMG network of independent member firms affiliated with KPMG International
Cooperative (“KPMG International”), a Swiss entity. All rights reserved.
35
March 19th, 2020Fed delivers two emergency rate cuts to aid economy
United States: Emergency Fed Rate Cuts • On March 3, the Federal Open
Basis points (bps) Market Committee (FOMC) voted
unanimously to cut rates by 50 bps in
an emergency move to support
0
economic activity “in the face of new
risks to the economic outlook.”
-25 • On March 15, the FOMC
implemented a second emergency
rate cut of 100 bps, bringing interest
-50 rates down to the zero-lower-bound.
Tech Weak Stock Lehman • The FOMC also announced $700
9/11 Market
-75 Bubble Economy billion in quantitative easing
Crash measures, with $500 billion in U.S.
Treasury securities purchases and
Subprime
-100 $200 billion in mortgage-backed
Mortgage
securities (MBS) purchases.
Crisis
Covid-19 • Chair Powell has repeatedly
-125 highlighted that the Fed will use all
Mar Apr Sep Aug Jan Oct Mar 3 Mar 15 of the tools at its disposal to assist
2001 2001 2001 2007 2008 2008 2020 2020 the economy and markets.
Source: KPMG Economics, Oxford Economics, Federal Reserve Board
© 2020 KPMG LLP, a Delaware limited liability partnership and the U.S. member firm of the KPMG network of independent member firms affiliated with KPMG International
Cooperative (“KPMG International”), a Swiss entity. All rights reserved.
36
March 19th, 2020Government assistance evolves as the situation unfolds
U.S. Monetary & Fiscal Response
Type Date Action
Federal Reserve Mar-03-2020 Intermeeting 50 bps cut in fed funds rate, "new risks to the economic outlook"
Mar-09-2020 Daily overnight repo operations raised from $100 bn to $150 bn
Mar-10-2020 Two-week term repo operations raised from $20 bn to $45 bn
Mar-12-2020 Offer minimum $175 bn in daily overnight repos and minimum $45 bn two-week term repos
Offer three 1m term repos at $50 bn each
Mar-12-2020 Offer $500 bn in 3m repo
Purchase $60 bn per month across range of Tsy securities through April 13, 2020
Mar-13-2020 Offer $500 bn in 3m repo, $500 bn in 1m repo
Offer 3m and 1m repo operations for $500 bn on a weekly basis
Offer minimum $175 bn in daily overnight repos, minimum $45 bn in 2wk term repo 2x a wk
Mar-15-2020 Intermeeting 100 bps cut in fed funds rate to 0-0.25%
Purchase $500 bn in Treasury securities, $200 bn in mortgage-backed securities
Eliminates penalty rate on discount window borrowing, reserve requirements cut to 0%
Coordinated action with major central banks lowering US dollar liquidity swaps by 25 bps
Mar-16-2020 Additional overnight repo operation of $500 bn
Mar-17-2020 Fed establishes Commercial Paper Funding Facility (CPFF) to support flow of credit to
households and businesses
Mar-18-2020 Fed establishes Money Market Mutual Fund Liquidity Facility (MMLF)
Mar-20-2020 Expands MMLF to include municipal money markets
Federal Government Mar-06-2020 President Trump signs $8.3 bn coronavirus spending bill
Mar-13-2020 President Trump declares national emergency, $50 bn emergency funding for states
Mar-14-2020 Proposed House bill: Free coronavirus testing, emergency paid sick days (14 days),
Expanded unemployment insurance: $2 bn to state unemployment insurance programs,
Expanded food security: $1 bn to food assistance programs
Mar-17-2020 President Trump proposes $850 bn economic stimulus package with $50 bn for airlines
© 2020 KPMG LLP, a Delaware limited liability partnership and the U.S. member firm of the KPMG network of independent member firms affiliated with KPMG International
Cooperative (“KPMG International”), a Swiss entity. All rights reserved.
37
March 19th, 2020Majority of country is engaging in extreme social distancing
Confirmed Cases as of March 19, 2020 • Social distancing will cause a
large drop in discretionary
1187 spending, likely 30% y/y in
52 March, 75% y/y in April and
11 15
22 45% y/y in May assuming
75 91 39 256 social distancing can conclude
11 11 155 4158
171 33 in late April or early May.
18
39 189 97 • Job losses for the most
84 29 742
89 vulnerable Americans will likely
79 295 56 30
221 2 also cause a decline in non-
890 26 26 91 107
35 discretionary spending as well.
106 120
• Federal assistance will help,
44 16 46 60
28 but is likely to come with a lag
68 287 such that a severe drop in
347 50 spending is unavoidable.
229
9 390
16
Source: KPMG Economics, Bureau of Economic Analysis, Johns Hopkins University, Haver Analytics
© 2020 KPMG LLP, a Delaware limited liability partnership and the U.S. member firm of the KPMG network of independent member firms affiliated with KPMG International
Cooperative (“KPMG International”), a Swiss entity. All rights reserved.
38
March 19th, 2020Coronavirus pandemic will cause a recession
U.S. 2020 GDP Forecast Worsen as Data Reveals Slowdown Magnitude • Our base case involves a fall in
Annualized Real GDP Growth global GDP to -12% in Q1 of
2020.
2.5% • We also expect fiscal stimulus
1.6% to be distributed in late April at
the earliest – too late for many
March 15th March 19th to avoid unemployment and
Forecast Forecast missed payments and
0.0% expenditures.
• The extent of equity market
decline and bond market fallout
will determine if the health
-2.5% crisis becomes a “U” or “L”
shaped recession.
-2.8%
• Our forecast expects S&P
earnings to fall 25%, and P/E
-4.3% ratios to decline to 14x.
-5.0%
Pre-Coronavirus Global Q1 GDP -8% Global Q1 GDP -12%
Note: Forecasts are inherently time sensitive and projections are dated as of March 19, 2020.
Source: KPMG Economics, Macroeconomic Advisors by IHS Markit, Haver Analytics
© 2020 KPMG LLP, a Delaware limited liability partnership and the U.S. member firm of the KPMG network of independent member firms affiliated with KPMG International
Cooperative (“KPMG International”), a Swiss entity. All rights reserved.
39
March 19th, 2020Preliminary analysis suggests -4.3% y/y growth for 2020
Contributions to US GDP Growth • The biggest impact will be due
Percentage Points to lower consumption, weaker
5.0 Forecast 5.0 business investment (as firms
engage in precautionary
behavior due to elevated
2.5 2.5 uncertainty), and lower
inventory accumulation arising
from a combined supply shock
0.0 0.0 and weakened demand.
• We expect to see a firm fiscal
-2.5 -2.5 response from the federal
Consumption government as the COVID-19
Business Investment
Residential Investment situation deteriorates further,
-5.0 Inventory -5.0 but at the best case this will
Govt result in a “U” shaped
Net Exports recession.
-7.5 GDP -7.5
Full Year Full Year
2019 2020
Note: Forecasts are inherently time sensitive and projections are dated as of March 19, 2020.
Source: KPMG Economics, BEA, Macroeconomic Advisors by IHS Markit, Haver Analytics
© 2020 KPMG LLP, a Delaware limited liability partnership and the U.S. member firm of the KPMG network of independent member firms affiliated with KPMG International
Cooperative (“KPMG International”), a Swiss entity. All rights reserved.
40
March 19th, 2020U.S. forecast is morphing from “V” to “U” or “L” shape
Contributions to US GDP Growth • Q1 GDP growth could show a
Percentage Points Consumption significant impact from COVID-19
Business Investment
Residential Investment due to a complete shutdown of
5.0 5.0 economic activity in March.
Inventory
Govt • Q2 and Q3 will reveal a large
Forecast Net Exports
2.5 GDP 2.5 adverse impact from falling
consumption, business
investment and exports.
0.0 0.0 • In times of an outbreak of a new
disease, research shows that
-2.5 -2.5 consumers engage in “aversion
behavior”.
• Social distancing policies being
-5.0 -5.0 enacted by a number of states,
including the cancellation of large
gatherings in any venue, will
-7.5 -7.5 sharply curtail consumption in the
Full Year Q1 Q2 Q3 Q4 months ahead, reducing the odds
2019 2020 of a quick recovery.
Note: Forecasts are inherently time sensitive and projections are dated as of March 19, 2020.
Source: KPMG Economics, BEA, Macroeconomic Advisors by IHS Markit, Haver Analytics
© 2020 KPMG LLP, a Delaware limited liability partnership and the U.S. member firm of the KPMG network of independent member firms affiliated with KPMG International
Cooperative (“KPMG International”), a Swiss entity. All rights reserved.
41
March 19th, 2020U.S. GDP likely to rebound in second half of 2021
U.S. Growth Forecast • COVID-19 impact will likely
Annualized Real GDP Growth extend beyond this year.
• We expect U.S. GDP to
2.5% 2.3% recover into positive territory in
second half of 2021.
• An earlier recovery is possible
0.8%
given the fiscal stimulus
currently being considered by
0.0% Congress.
-1.1%
-2.5%
-4.3%
-5.0%
2019 2020 2021 2022
Note: Forecasts are inherently time sensitive and projections are dated as of March 19, 2020.
Source: KPMG Economics, BEA, Macroeconomic Advisors by IHS Markit, Haver Analytics
© 2020 KPMG LLP, a Delaware limited liability partnership and the U.S. member firm of the KPMG network of independent member firms affiliated with KPMG International
Cooperative (“KPMG International”), a Swiss entity. All rights reserved.
42
March 19th, 2020China Is the Preview Movie for Global Covid-19 Economic Impact
Chinese travel has been down 60-95% since mid-January
    Daily Passenger Volumes in China No Recovery Yet
    2019 to 2020                                                                                                                                                                                        •   Travel volume is a leading
                                                                                                                                                                                                            barometer of China’s overall
      Y/Y%                                                                                                                  Roads                                                     Y/Y%                  economic activity.
       40%                                                                                                                  Railways                                                   40%
                                                                                                                            Airlines                                                                    •   Following the Lunar New Year,
                                                                                                                            Waterways                                                                       passenger volumes in China
        20%                                                                                                                                                                              20%
                                                                                                                                                                                                            collapsed by 87% compared to
                                                                                                                                                                                                            the same period a year ago and
          0%                                                                                                                                                                             0%
                                                                                                                                                                                                            have yet to meaningfully
                                                                                                                                                                                                            recover.
      -20%                                                                                                                                                                               -20%
                                                                                                                                                                                                        •   With China currently only seeing
      -40%                                                                                                                                                                               -40%               around 15-16 million trips per
                                                                                                                                                                                                            day, it will be some time until
      -60%                                                                                                                                                                               -60%               economic activity return to
                                                                                                                                                                                                            normal levels.
      -80%                                                                                                                                                                               -80%           •   Q1 GDP growth estimates range
                                                                                                                                                                                                            from -11% y/y (Bloomberg) to
    -100%                                                                                                                                                                                -100%              -40% y/y (JPMorgan Chase). We
                                                                                                                                                                                                            fear Q2 may also be slightly
                                                                                                                                                                                                            negative as well.
       Source: KPMG Economics, Ministry of Transport, Haver Analytics (March 17, 2020)
                                © 2020 KPMG LLP, a Delaware limited liability partnership and the U.S. member firm of the KPMG network of independent member firms affiliated with KPMG International
                                Cooperative (“KPMG International”), a Swiss entity. All rights reserved.
                                                                                                                                                                                                                                    44

March 19th, 2020
Chinese auto sales fell dramatically in January and February
China: Passenger Car Sales Plummet in 2020 • Vehicle purchases provide a look
Y/Y% Y/Y% into the health of Chinese
20% 20% consumers and industry.
• Prior to COVID-19, China’s auto
sales were negative for a full year
0% 0% due to weak demand.
• Sales plunged to -80% y/y in
February and we expect a similar
-20% -20% decline in March.
• As an auto manufacturing hub,
Hubei province’s shutdown will
-40% -40% ripple negatively throughout the
global auto industry; these effects
are being felt acutely in South
-60% -60% Korea, Japan, and Germany.
-80% -80%
Jan Apr Jul Oct Jan Apr Jul Oct Jan
2018 2019 2020
Source: KPMG Economics, China Association of Automobile Manufacturers (Feb 2020), Haver Analytics
© 2020 KPMG LLP, a Delaware limited liability partnership and the U.S. member firm of the KPMG network of independent member firms affiliated with KPMG International
Cooperative (“KPMG International”), a Swiss entity. All rights reserved.
45
March 19th, 2020Highly leveraged property sector faces crumbling demand
China: Total Property Sales • February property sales fell 36%
YTD y/y in value and by 40%
Y/Y% China: Value of Buildings Sold (YTD, Yuan) Y/Y% YTD y/y in terms of floor space,
40% 40% putting builders in a precarious
situation.
• Further, property investment
20% 20% declined by 16% YTD y/y and
infrastructure investment fell by
30.3% YTD y/y.
• Construction has also been
0% 0% slowed by the absence of
migrant workers as many have
not returned to work from their
-20% -20% home provinces even after
quarantines have been lifted.
• Falling sales and construction
-36% will put enormous pressures on
-40% -40% builders, most of whom financed
Jan Apr Jul Oct Jan Apr Jul Oct Jan Apr Jul Oct Jan new projects with large amounts
2017 2018 2019 2020 of high-interest debt.
Source: KPMG Economics, China Association of Automobile Manufacturers (Feb 2020), Haver Analytics, Rhodium Group
© 2020 KPMG LLP, a Delaware limited liability partnership and the U.S. member firm of the KPMG network of independent member firms affiliated with KPMG International
Cooperative (“KPMG International”), a Swiss entity. All rights reserved.
46
March 19th, 2020Chinese economy hobbled, slow recovery highly likely
China: Economic Indicators
• Chinese experience shows that
Y/Y% Fixed Asset Investment Index no industries were spared from
40% Retail Sales 90 the outbreak.
Industrial Output • Retail sales, and industrial
Composite PMI (RHS)
output all rapidly declined and
20% 70 fell year-over-year at the worst
rates in decades.
• We estimate that first quarter
real GDP in China will fall by at
0% 50 least 10% at a q/q annualized
rate.
• This is a much deeper decline
-20% 30 than what occurred during the
global financial crisis.
• Further, although the PBOC has
provided stimulus, the credit
-40% 10
channel is weak and many
SMEs face liquidity challenges.
Note: People’s Bank of China (PBoC), Small- and Medium-sized Enterprise (SME)
Source: KPMG Economics, China Association of Automobile Manufacturers (Feb 2020), Haver Analytics
© 2020 KPMG LLP, a Delaware limited liability partnership and the U.S. member firm of the KPMG network of independent member firms affiliated with KPMG International
Cooperative (“KPMG International”), a Swiss entity. All rights reserved.
47
March 19th, 2020Concluding Thoughts
Countries with high debt and elderly face most risk
       As of March 18th, 2020
                                                                                                                                                                         Private
                                                                                                                                     Share of the                                                        •   The countries with the greatest
                               Cases per Mil.                                                                                                                          Nonfinanical
               Country                                            Total Cases                      Total Deaths                      Population
                                   Pop.
                                                                                                                                     Over Age 70
                                                                                                                                                                       Debt-to-GDP                           number of older people are the
                                                                                                                                                                        (Q3-2019)                            most at risk in terms of death
       Italy                           589.8                           35,713                             2,978                              17%                            110.5%                           rate and strain on medical
       Switzerland                     352.4                             3,028                               28                              14%                            253.6%                           resources.
       Spain                           297.6                           13,910                               623                              15%                            152.4%                             •   Japan – 21% over 70
       Norway                          288.2                             1,550                                 6                             12%                            239.0%                             •   Italy – 17%
       Iran                            209.4                           17,361                              1135                                4%                                  -
                                                                                                                                                                                                               •   Germany – 16%
       Austria                         183.8                             1,646                                 4                             14%                            138.9%
                                                                                                                                                                                                               •   Sweden – 15%
       Denmark                         183.1                             1057                                  4                             14%                            221.7%
       South Korea                     164.2                             8,413                               84                              10%                            195.0%
                                                                                                                                                                                                               •   Spain – 15%
       Germany                         147.6                           12,327                                28                              16%                            113.7%                             •   U.K. – 13%
       France                          138.8                             9,043                              148                              15%                            216.3%                             •   U.S. – 11%
       Sweden                          127.4                             1,279                               10                              15%                            255.8%                             •   South Korea – 10%
       China                            56.4                           80,906                             3,237                                6%                           204.8%                             •   Singapore – 7%
       United States                    23.7                             7,786                              118                               11%                           150.5%
                                                                                                                                                                                                               •   China – 6.5%
       United Kingdom                   11.6                             2,626                               71                              13%                            165.3%
                                                                                                                                                                                                               •   Iran – 4%
       Japan                             7.0                              889                                29                              21%                            161.5%
       Source: KPMG Economics, Johns Hopkins University, UN Population Statistics, BIS, Haver Analytics
                                 © 2020 KPMG LLP, a Delaware limited liability partnership and the U.S. member firm of the KPMG network of independent member firms affiliated with KPMG International
                                 Cooperative (“KPMG International”), a Swiss entity. All rights reserved.
                                                                                                                                                                                                                                       49

March 19th, 2020
Global Impact
• Virus in 183 countries as of March 20th
• Countries with oldest populations most at risk for high death rates and adverse
news flows
• Social distancing is necessary but comes at a great economic cost
• Government efforts to mitigate the economic cost are evolving in response to the
crisis
• Longer-term impact is felt by indebted companies or those with poor cash flows,
those that cannot remain open, cannot employ people or cannot make debt
payments
• Coordinated and individual government action is underway to mitigate negative
health and economic impacts
• Nevertheless the virus is estimated to produce “U” or “L” shaped economic
outcomes
Source: KPMG Economics, www.worldometers.info, WHO, Johns Hopkins, World Bank
© 2020 KPMG LLP, a Delaware limited liability partnership and the U.S. member firm of the KPMG network of independent member firms affiliated with KPMG International
Cooperative (“KPMG International”), a Swiss entity. All rights reserved.
50
March 19th, 2020Thank you
Some or all of the services described herein may not be permissible
for KPMG audit clients and their affiliates or related entities.

kpmg.com/socialmedia

The information contained herein is of a general nature and is not intended to address the circumstances of any particular
individual or entity. Although we endeavor to provide accurate and timely information, there can be no guarantee that such
information is accurate as of the date it is received or that it will continue to be accurate in the future. No one should act upon
such information without appropriate professional advice after a thorough examination of the particular situation.

© 2020 KPMG LLP, a Delaware limited liability partnership and the U.S. member firm of the KPMG network of independent
member firms affiliated with KPMG International Cooperative (“KPMG International”), a Swiss entity. All rights reserved.

The KPMG name and logo are registered trademarks or trademarks of KPMG International.
You can also read