A carnivorous plant genetic map: pitcher/insect-capture QTL on a genetic linkage map of Sarracenia
←
→
Page content transcription
If your browser does not render page correctly, please read the page content below
Published Online: 29 November, 2018 | Supp Info: http://doi.org/10.26508/lsa.201800146
Downloaded from life-science-alliance.org on 2 June, 2021

Resource

A carnivorous plant genetic map: pitcher/insect-capture
QTL on a genetic linkage map of Sarracenia
Russell L Malmberg1,2 , Willie L Rogers1, Magdy S Alabady1,3

The study of carnivorous plants can afford insight into their                            are beginning to be applied to identify sequences associated with the
unique evolutionary adaptations and their interactions with                              evolution of carnivory (Wheeler & Carstens, 2018). However, until this
prokaryotic and eukaryotic species. For Sarracenia (pitcher                              report, a classic genetic linkage mapping approach has not been
plants), we identified 64 quantitative trait loci (QTL) for insect-                       implemented with these systems; we have used pitcher plants of the
capture traits of the pitchers, providing the genetic basis for                          genus Sarracenia to develop such a genetic map.
differences between the pitfall and lobster-trap strategies of                               Sarracenia pitcher plants are potentially useful for addressing a
insect capture. The linkage map developed here is based upon                             number of developmental, physiological, ecological, and evolutionary
the F2 of a cross between Sarracenia rosea and Sarracenia                                questions. Some of these are: How the pitchers actually digest the
psittacina; we mapped 437 single nucleotide polymorphism and                             insects and obtain nutrition is of interest; for example, the flow of
simple sequence repeat markers. We measured pitcher traits
                                                                                         nitrogen and phosphorous (Gallie & Chang, 1997; Ellison, 2006; Butler &
which differ between S. rosea and S. psittacina, mapping 64 QTL
                                                                                         Ellison, 2007; Karagatzides et al, 2009, 2012) has been studied. Pitcher
for 17 pitcher traits; there are hot-spot locations where multiple
                                                                                         plants provide an opportunity to study their unique interactions with
QTL map near each other. There are epistatic interactions in many
                                                                                         microbial communities; they contain a microbiome associated with
cases where there are multiple loci for a trait. The QTL map
                                                                                         insect digestion within their pitchers (Buckley et al, 2003; Gotelli &
uncovered the genetic basis for the differences between pitfall-
                                                                                         Ellison, 2006; Koopman et al, 2010; Koopman & Carstens, 2011; Baiser
and lobster-traps, and the changes that occurred during the
                                                                                         et al, 2012), a partially enclosed container offering an experimentally
divergence of these species. The longevity and clonability of
                                                                                         manipulable system suitable for studying eukaryotic-host/microbiome
Sarracenia plants make the F2 mapping population a resource for
                                                                                         relationships. The plants and their pitchers can be used to study the
mapping more traits and for phenotype-to-genotype studies.
                                                                                         developmental, evolutionary, and ecological tradeoffs associated with
DOI 10.26508/lsa.201800146 | Received 3 August 2018 | Revised 16 November                phenotypic plasticity as under high nitrogen conditions, the leaves will
2018 | Accepted 19 November 2018 | Published online 29 November 2018                     grow as flattened phyllodia (a leafstalk flattened into a blade shape
                                                                                         which is photosynthetically more efficient than a pitcher [Ellison &
                                                                                         Gotelli, 2002]) instead of as a pitcher. There are 14–50 named taxa within
Introduction                                                                             the genus (Schnell & McPherson, 2011; Weakley, 2015), and these can all
                                                                                         hybridize with each other, yielding abundant material for investigating
Insect-eating plants fascinate scientists and the general public;                        the role of hybridization in plant evolution. Some of these taxa are
Darwin was so taken with their unique adaptations that he used the                       endangered, posing conservation genetics issues, such as how much
word “wonderful” 15 times in his descriptions of them (Darwin, 1888).                    genetic diversity is present in given populations, and what is the best
The carnivorous behavior of plants evolved independently, possibly                       way to preserve it? All of these example areas of inquiry would benefit
as many as nine times (Givnish, 2015; Wheeler & Carstens, 2018).                         from the availability of a genetic linkage map.
These organisms live in nutrient poor conditions, such as wetland                            Pitcher plants are also charismatic attractive plants which can
bogs, and are able to obtain minerals, primarily nitrogen and                            captivate broad audiences and help raise awareness of scientific
phosphorous, from capturing and digesting insect prey (Darwin, 1888;                     issues in the general public. For an overview—a lively recent book
Ellison & Adamec, 2018; Adlassnig et al, 2012; Bradshaw & Creelman,                      covers many aspects of Sarracenia and carnivorous plant biology in
1984). Their leaves are specialized to perform multiple functions;                       detail (Ellison & Adamec, 2018).
secrete attractive scents (Jurgens et al, 2009), capture insects, secrete                    Some of the difficulties in using Sarracenia as a genetic mapping
extracellular digestive enzymes, absorb nutrients, photosynthesize,                      system are: (a) it takes 3–4 y for a plant to produce seeds, (b) 1 cM on
and develop microbial symbioses. Comparative genomic approaches                          a genetic map would correspond on average to more than 106

1
 Department of Plant Biology, Miller Plant Sciences Building, University of Georgia, Athens, GA, USA 2Institute of Bioinformatics, Davison Life Sciences Building, University
of Georgia, Athens, GA, USA 3Georgia Genomics and Bioinformatics Core, University of Georgia, Athens, GA, USA

Correspondence: malmberg@uga.edu
Willie L Rogers’ present address is State Botanical Garden of Georgia, University of Georgia, Athens, GA, USA

© 2018 Malmberg et al.                                                                    https://doi.org/10.26508/lsa.201800146    vol 1 | no 6 | e201800146        1 of 19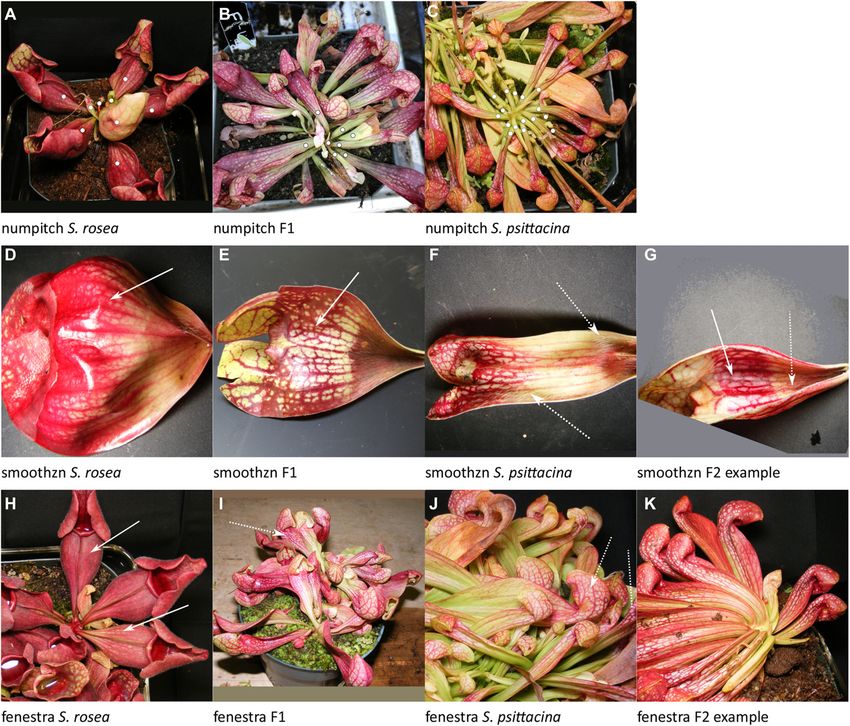
basepairs because of the large genome size (Rogers et al, 2010), and     Results
(c) the presence of a recent partial genome duplication (Srivastava
et al, 2011) will complicate identifying orthologs. On the other hand:   Linkage map
(a) the species/taxa can all be crossed with each other, and natural
hybrids have been found for most of the combinations; (b) pitcher        Hecht (1949) has described the chromosomes in root tip meta-
plants are long-lived perennials and can be readily vegetatively         phases of six Sarracenia species, including S. purpurea and
propagated, so that after genotyping individuals, a mapping pop-         S. psittacina, as 2N = 26 or 1N = 13; a finished genetic map might thus
ulation can be reused multiple times and the same genotype grown         have 13 linkage groups. Figs 1 and 2 show the genetic linkage map
under multiple growth conditions for phenotyping.                        we developed, with linkage groups shown that are greater than 10
    We report developing an F2 generation of more than 200 in-           cM, or that are shorter than 10 cM but which also have a QTL
dividuals from a cross between Sarracenia rosea (Sarracenia pur-         mapping to them. Most of the markers we used for genetic mapping
purea venosa burkii) and Sarracenia psittacina, and use this F2 to       were single nucleotide polymorphisms (SNPs) identified by se-
create a genetic map with markers and pitcher quantitative trait loci    quencing from RNA (RARseq) or DNA (RADseq), plus there were a
(QTL). S. rosea was chosen as a parent as it is the Southeastern U.S.    few simple sequence repeat markers (SSRs). The final total of 437 is
variant of S. purpurea, the most common, most familiar, and widely       made up of 343 RNA-based SNPs, 78 DNA-based SNPs, and 16 SSRs.
distributed of the Sarracenias in North America. S. psittacina was       These are distributed into 42 linkage groups with a total length of
chosen as it is the most morphologically diverse and distinctive of      2,017 cM; 12 of the linkage groups contain a small number of markers
the Sarracenias, with a decumbent, horizontal, pitcher growth habit;     and are less than 10 cM in length. The overall average density is 1
its pitchers have been described as lobster-trap–like with respect to    marker every 4.6 cM. The 13 largest linkage groups contain 273
catching insects, meaning that the insects can enter readily but have    markers with a total length of 1,446 cM, and with the shortest of the
difficulty exiting. The other Sarracenias can be described as having      13 having a length of 76.7 cM. The DNA-based markers were gen-
pitfall traps into ponds. S. rosea and S. psittacina are in different    erally interspersed among the RNA-based markers, with 39 of them
subgroups of the genus, based upon a recently developed phylogeny        either a single isolated DNA marker or a doublet of two DNA
of the taxa within the genus (Stephens et al, 2015) generated from the   markers. There were a few clusters of DNA-based markers: linkage
sequences of 199 nuclear genes. S. rosea groups with the other           group 24 was comprised entirely of 6 RADseq markers covering
S. purpurea-related taxa, whereas S. psittacina groups with Sarra-       20 cM whereas linkage group 27 was entirely 3 RADseq markers over
cenia minor–related and Sarracenia flava–related taxa; hence, it is       13 cM; the end of linkage group 1 contained 5 RADseq markers over
reasonable to expect some genetic differentiation between S. rosea       37 cM; near one end of linkage group 8 there was a group of
and S. psittacina suitable for creating a genetic map. A third sub-      5 RADseq markers and 1 SSR over 28 cM.
grouping within the genus contains Sarracenia oreophila, Sarracenia         The STACKS program (Catchen et al, 2013) generated sequence
rubra–related taxa, Sarracenia alata, and Sarracenia leucophylla.        tags of 143 bases for each of the SNPs reported, as listed in Sup-
    Some of the pitcher traits differing between S. rosea and            plemental Information 5. We performed Blast2Go (Conesa et al,
S. psittacina have previously been investigated to identify their        2005; Gotz et al, 2008) analyses of these sequence tags for the SNPs
roles in insect attraction and capture (Horner et al, 2018). For ex-     (Supplemental Information 7). We could not detect a particular
ample, the striking patterns of red stripes on pitchers, and other       pattern in the functional annotations that would suggest anything
carnivorous plants, have been suggested to be involved in insect         about the nature of the sequences containing SNPs either overall or
attraction (Schaefer & Ruxton, 2008). Many Sarracenia also have          just the SNPs located near the mapped QTLs.
white windows or fenestrations in patterns on the pitchers which            We did notice five instances of SNP tag sequence similarity
have been hypothesized to confuse trapped insects (Moran et al,          where the SNPs were located in different regions of the genetic
2012). There are morphological differences between S. psittacina         map, suggesting gene duplications. These included:
pitchers and the pitchers of other Sarracenia, including the size and
orientation of the orifice, the shapes of the hoods above and around      R7834 (lg3-pos32) and RI736 (lg3-pos59) with 100% identity over 143/
the orifice, the presence of tissue and hairs apparently meant to trap    143 bases;
the insects within the pitchers, and the overall small size of the       R6009 (lg3-pos139) and R6000 (lg16-pos27) with 90% identity over
S. psittacina pitcher (Naczi, 2018); Naczi made the intriguing obser-    72/143 bases;
vation and suggestion that S. psittacina pitchers are more similar to    R8080 (lg4-pos40) and R8078 (lg4-pos70) with 100% identity over
juvenile pitchers of other Sarracenia, and hence that their de-          120/143 bases;
velopmental evolution may be characterized as heterochrony. These        R7818 (lg7-pos99) and R7820 (lg22-pos20) with 90% identity over
pitcher differences between S. rosea and S. psittacina are thus some     128/143 bases;
of the possible candidate traits for QTL genetic mapping.                R1768 (lg8-pos0) and R1769 (lg15-pos0) with 100% identity over 97/
    We used the methods of genotyping by sequencing and re-              143 bases.
striction site–associated RNA-sequencing (RARseq [Alabady et al,
2015]) to generate linkage groups and a genetic map with more than       Pitcher traits mapped in F2
430 mapped markers covering 2017 cM. We identified and mapped
64 QTL for 17 pitcher traits which differ between the two parental       We measured a variety of pitcher traits that are different between
species and which give insights into the genetic bases of the pitfall    S. rosea and S. psittacina to attempt to map their genetic bases.
versus lobster-trap insect-capture strategies of Sarracenia.             Fig 3 shows the parental plants and F1, giving an overall impression

Sarracenia genetic linkage map with QTL   Malmberg et al.                https://doi.org/10.26508/lsa.201800146   vol 1 | no 6 | e201800146   2 of 19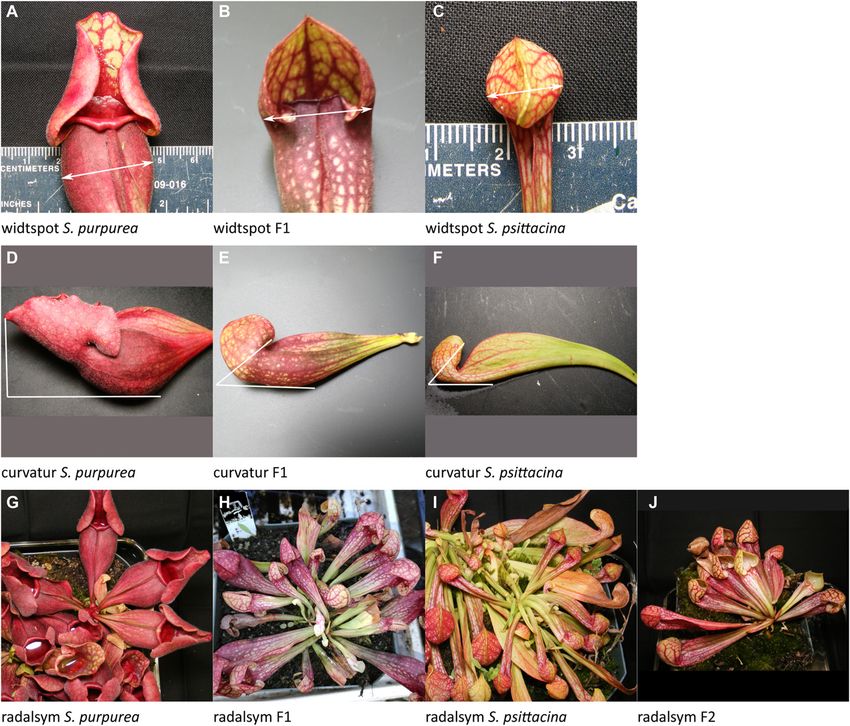
Figure 1. Linkage groups with QTLs mapped (continued in Fig 2).
Linkage groups are shown and numbered in decreasing order of length in cM. Linkage groups 1–30 are shown as they are greater than 10 cM in length; in addition groups 31,
34, and 39 are shown as QTLs mapped to them. QTLs are indicated by their name and by vertical lines which indicate a Bayesian position confidence interval, as
calculated by R/qtl (Broman et al, 2003; Broman & Sen, 2009; Arends et al, 2010). When there are multiple loci for the same quantitative trait, these are indicated by a
numbered trait name, which are numbered in decreasing order of %PVE such that number one indicates the locus with the highest %PVE. The genetic map was rendered by
the R/LinkageMapView package (Ouellette et al, 2018).
Source data are available for this figure.

Sarracenia genetic linkage map with QTL     Malmberg et al.                            https://doi.org/10.26508/lsa.201800146    vol 1 | no 6 | e201800146       3 of 19
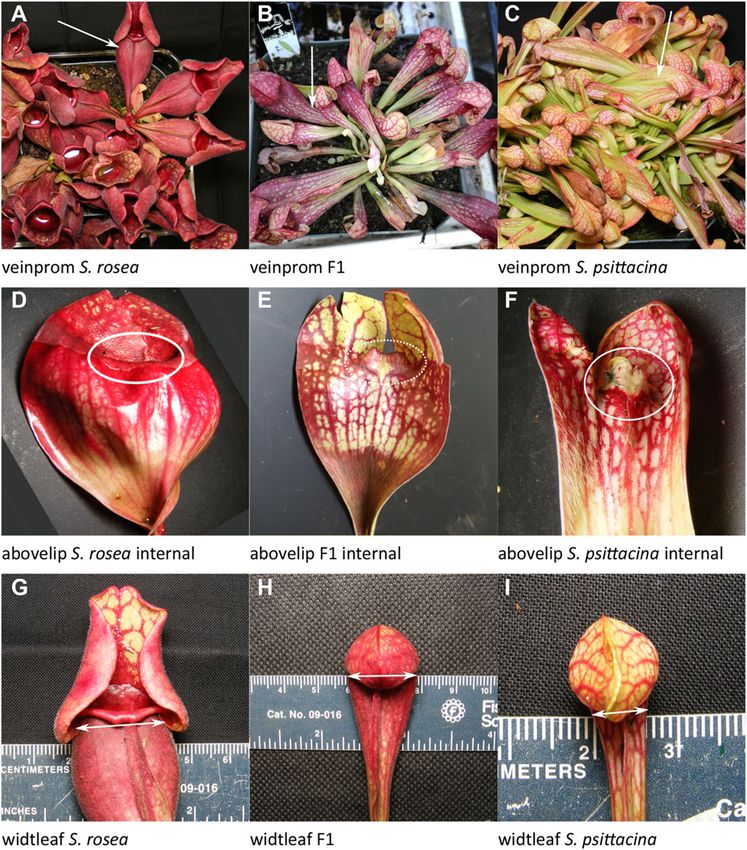
Figure 2. Linkage groups with QTLs mapped (continued from Fig 1).
Linkage groups are shown and numbered in decreasing order of length in cM. Linkage groups 1–30 are shown as they are greater than 10 cM in length; in addition groups 31,
34, and 39 are shown as QTLs mapped to them. QTLs are indicated by their name and by vertical lines which indicate a Bayesian position confidence interval, as
calculated by R/qtl (Broman et al, 2003; Broman & Sen, 2009; Arends et al, 2010). When there are multiple loci for the same quantitative trait, these are indicated by a
numbered trait name, which are numbered in decreasing order of %PVE such that number one indicates the locus with the highest %PVE. The genetic map was rendered by
the R/LinkageMapView package (Ouellette et al, 2018).
Source data are available for this figure.

of the plants. For each quantitative trait mapped, the R/qtl fitqtl()                   having the highest individual %PVE, and then descending in order;
function gives an estimate of the total phenotypic variance which is                   thus for traitx, traitx-1 has the highest individual %PVE, traitx-2 has
explained (%PVE, the heritability of the trait) in the F2 population by                the second highest, and so on. Figs 4, 5, 6, 7, 8, and 9 illustrate each
the postulated loci and the pairwise interactions, epistasis, be-                      of the individual pitcher traits measured. Table 2 summarizes the
tween them. We describe here the traits mapped and the genetic                         results for each trait and locus, whereas Table 3 lists the epistatic
loci and interactions involved, giving them in descending order of                     interactions detected.
percent phenotypic variance explained; the eight letter codes                             There were nine traits measured which failed to show any
shown are those used in the data files and in Table 1. When more                        heritability; these are described in the Materials and Methods
than one locus is involved, the loci are numbered with locus-1                         section for their value as negative data.

                                                                                                                 Figure 3. Pitchers of the parents and the F1.
                                                                                                                 (A) S. purpurea. (B) F1. (C) S. psittacina.
                                                                                                                 Source data are available for this figure.

Sarracenia genetic linkage map with QTL     Malmberg et al.                            https://doi.org/10.26508/lsa.201800146    vol 1 | no 6 | e201800146       4 of 19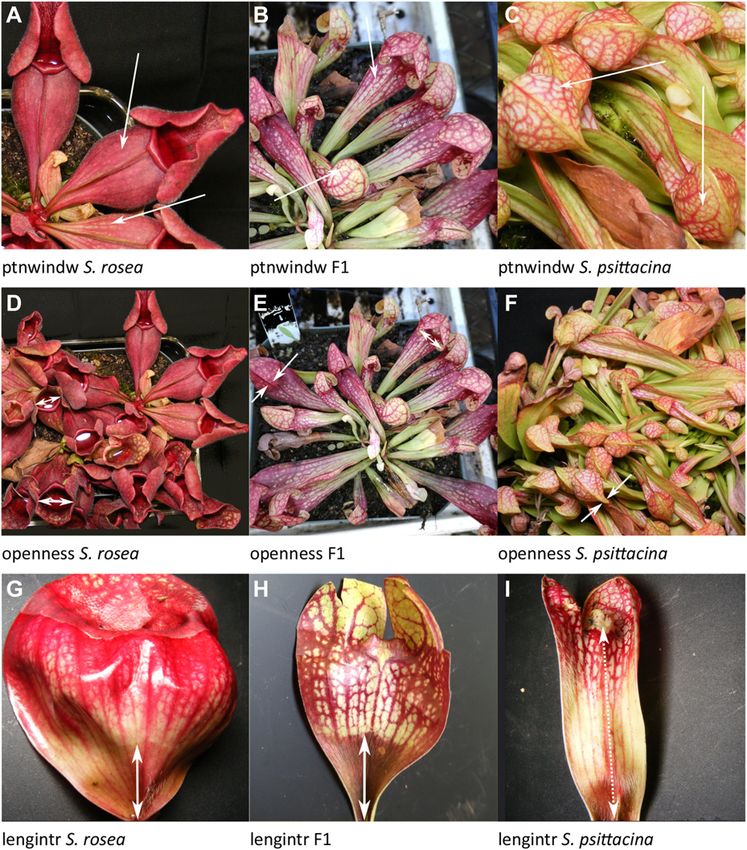
Table 1. The 17 quantitative traits where a locus or loci mapped, listed in   fenestra: White windows on the pitcher; 58%–99% PVE; 15 loci plus
the order discussed in the text.                                              65/105 interactions (Fig 4H–K).
 8 letter code                            In words
                                                                                  S. psittacina pitchers have a windowing-effect pattern of white
 numpitch                                 Number of pitchers per rosette      areas, whereas S. rosea pitchers do not. This was scored on a
 smoothzn                                 Zone lacking hairs in pitcher       6-point scale with 0 being S. psittacina–like, and 6 being S. rose-
 fenestra                                 White color windows on pitchers     a–like. A total of 13 significant loci were identified with 2 additional
                                                                              loci included as having significant interactions with other loci. The
 periotuk                                 Periostome inward or outward
                                                                              number of possible pairwise interactions among the 15 loci was too
 heigwing                                 Height of wing
                                                                              large to describe in a single genetic model to be evaluated by fitqtl
 ptnwindw                                 Pattern of color                    (); the 55% PVE listed for the full model, and the values shown for
 openness                                 Degree of openness of pitchers      the individual loci were obtained from a purely additive model. We
 lengintr                                 Internal length of hairy region     explored the pairwise interactions by testing subsets of them in
                                                                              groups together with the additive effects; in some cases the final %
 veinprom                                 Well-defined veins
                                                                              PVE was as high as 99%; 65/105 interactions were significant. In
 abovelip                                 Tissue above the lip line           the purely additive model, the locus fenestra-1 explained 15% of the
 widtleaf                                 Leaf width below opening            phenotypic variance, whereas other loci explained 7% or less. The
 openfrac                                 Fraction of pitchers open           dominance relationships were: no dominance—loci 1, 2, 3, 4, 7, 10,
 leafcolr                                 Leaf color ignoring veins
                                                                              and 15; over/under-dominance—loci 8, 11, and 12; S. rosea domi-
                                                                              nance—loci 5 and 14; S. psittacina dominance—loci 6, 9, and 13. The
 deggreen                                 Degree of green color
                                                                              allele effect values were mixed across the loci, with some in the
 widtspot                                 Leaf width at widest spot           directions of each parent.
 curvatur                                 Pitcher curvature
                                                                              periotuk: Periostome in or out; 50% PVE; 5 loci plus 1 of 10 pairwise
 radalsym                                 Rosette radial symmetry
                                                                              interactions (Fig 5A–F).
Details of trait measurement are given in the results.
                                                                                 Is the periostome tucked inward, S. psittacina–like as part of the
                                                                              lobster-trap morphology, or protruded, S. rosea–like as part of the
numpitch: Number of pitchers/leaves per rosette; 100% PVE; 9 loci             pitfall morphology? This was scored on a 4 point scale with S.
plus 36 of 36 pairwise interactions (Fig 4A–C).                               psittacina–like inward tucking as 0, S. rosea–like protrusion as 3,
                                                                              and with intermediates scored as 1 or 2. There were five significant
   This is a count of the leaves/pitchers on a single rosette. S. rosea       loci, with one of the possible pairs, periotuk-2 and periotuk-3,
usually totals 4–6 leaves whereas S. psittacina can have up to 30.            having a significant interaction. Periotuk-1 and periotuk-5 have
There are nine loci, and all pairwise interactions are significant. The        dominance by the S. psittacina allele; periotuk-2 and periotuk-3
pairwise interactions were individually small in their %PVE but               show no dominance; periotuk-4 has dominance by the S. rosea
totaled to 39% for the 36 pairs. The dominance relationships were:            allele. The allele effect values were generally in the direction of
no dominance—loci 4, 6, 7, and 9; S. rosea dominance—locus 8;                 S. rosea.
S. psittacina dominance—loci 1, 2, 3, and 5. The allele effect values
were mixed across the multiple loci, with some in the direction of            heigwing: Height of wing; 43% PVE; five loci (Fig 5G–I).
S. rosea and some in the direction of S. psittacina.
                                                                                 This is the height of the wing perpendicular to the pitcher from
smoothzn: Smooth area lacking hairs (trichomes) within pitcher;               its highest point directly back to where it meets and fuses with the
97% PVE; 9 loci plus 36 of 36 pairwise interactions (Fig 4D–G).               leaf/body of the leaf. Heigwing-1 and heigwing-3 had no domi-
                                                                              nance; heigwing-2 and heigwing-5 had over- or underdominance;
   In S. rosea there is a glossy smooth zone with a polished look             heigwing-4 had dominance by the S. rosea allele. The allele effect
directly above the hairy zone at the base of the pitcher. S. psittacina       values were mixed in the directions of both parents.
lacks this smooth zone entirely; sometimes at the lip there can be a
very small area of waxy surface but never this smooth zone. The F2s           ptnwindw: Pattern of Color; 30% PVE; three loci plus two of three
may have sporadic or plentiful hairs in a smooth zone, or pores for           pairwise interactions (Fig 6A–C).
the hairs but no actual hairs seen. Nine significant loci were
identified, all with similar %PVE. All the pairwise interactions were             This is a measure of the patterning of the color with respect to
significant; however, the sizes of the %PVE for each of the in-                veins and windows (fenestrations) on the pitcher. The color can be
teractions were small. For the 36 interactions, the sum of their %PVE         either green or a shade of purple. It was scored on a 0 to 3 point
was 32%. The dominance patterns were: no dominance—loci 2, 4,                 scale, where 0 is a solid color with veins not easily distinguishable
and 7; over/under-dominance—loci 1, 6, and 9; S. rosea domi-                  (S. rosea), three indicates the veins and windows are highly no-
nance—locus 8; S. psittacina dominance—loci 3 and 5. The allele               ticeable (S. psittacina), and one and two are intermediate states.
effect values were mixed across the multiple loci, with some in the           Ptnwindow-1 and ptnwindow-3 have dominant S. psittacina alleles,
directions of each parent, but more in the direction of S. rosea.             whereas ptnwindow-2 shows no dominance. Ptnwindow-1 has

Sarracenia genetic linkage map with QTL   Malmberg et al.                     https://doi.org/10.26508/lsa.201800146   vol 1 | no 6 | e201800146   5 of 19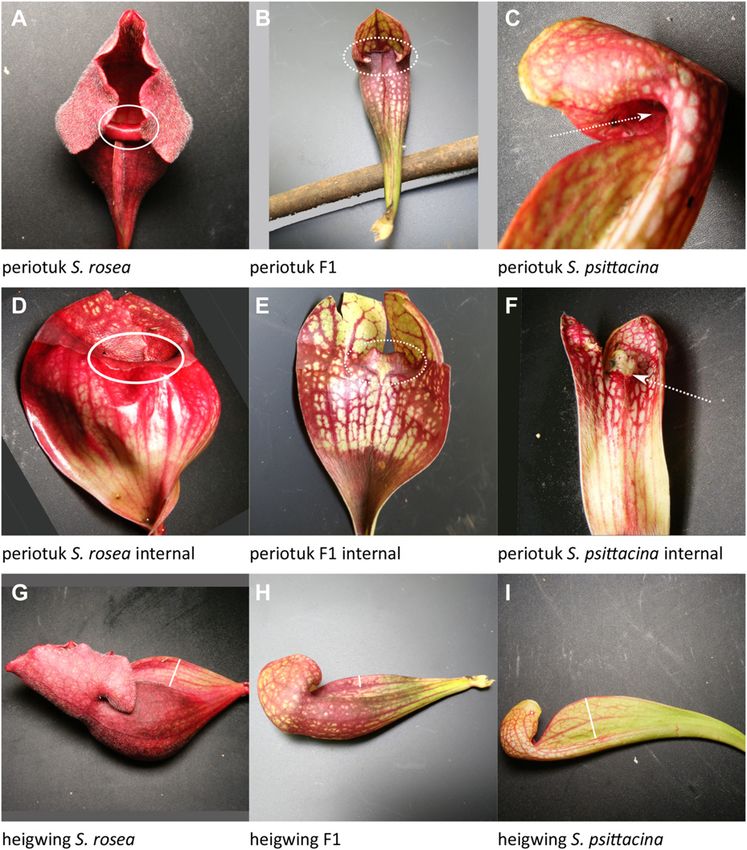
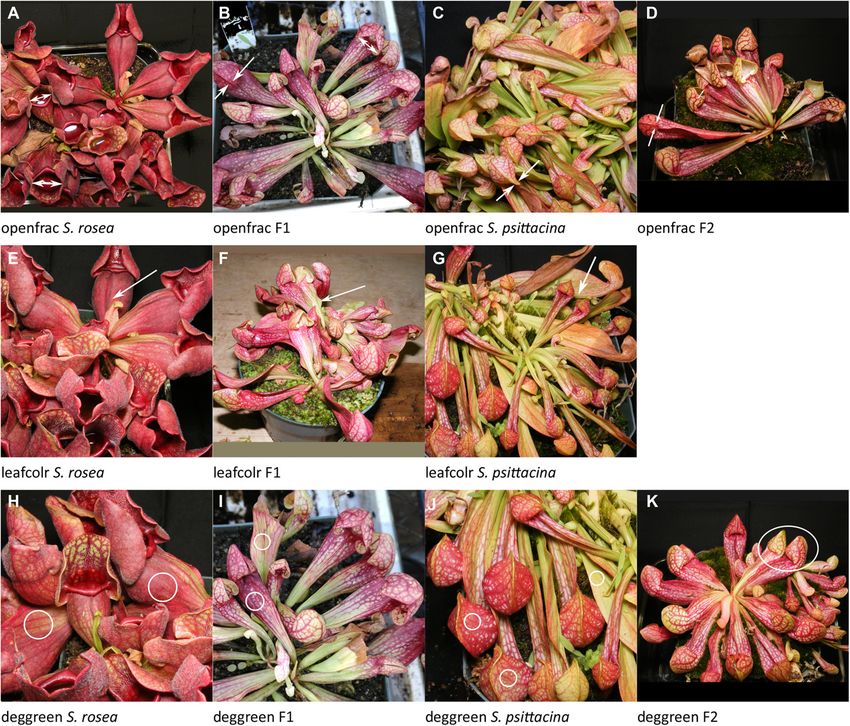
Figure 4. Examples of traits scored.
Listed in order of decreasing %PVE, the same order as discussed in the text. (A–C) Dots indicate pitchers in rosette to be counted. (D, E) The solid arrow points to the glossy
zone free of hairs. (F) The dashed arrow points to hairs throughout. (G) The solid arrow points to the smooth zone in pitcher otherwise more similar to S. psittacina. (H) The
arrows point to absent or weak windowing effect. (I, J) The arrow points to white window effect. (K) Well-defined white windows due to distinct color borders.
Source data are available for this figure.

significant interactions with each of ptnwindow-2 and ptwindow-3.                          S. rosea–like and zero being S. psittacina–like. There were three
The allele effect values were in the direction of S. psittacina.                          significant loci. Openness-1 and openness-2 both have dominance
                                                                                          by the S. psittacina allele, whereas openness-3 shows no domi-
openness: Degree of openness of pitchers; 26% PVE; three loci                             nance. The allele effect values were in the directions of S. psittacina.
(Fig 6D–F).
                                                                                          lengintr: Internal length hairy region; 23% PVE; two loci plus zero of
   This measures the degree of openness of the operculum to the                           one pairwise interaction (Fig 6G–I).
pitcher mouth, and is related to, but different, from openfrac which
is the fraction of pitchers open. In S. rosea these are always open                          This is the distance from the base of the leaf where it attaches to
(pitfall trap), whereas in S. psittacina they are nearly always sealed                    the meristem upward until where the line of hairs ends, measured in
closed except for a small opening (lobster-trap). The degree of                           pitchers which have been sliced open. In S. rosea this is at the very
openness was measured on a six point scale with five being                                 base of the leaf and does not extend very far upward; there is usually

Sarracenia genetic linkage map with QTL      Malmberg et al.                              https://doi.org/10.26508/lsa.201800146      vol 1 | no 6 | e201800146        6 of 19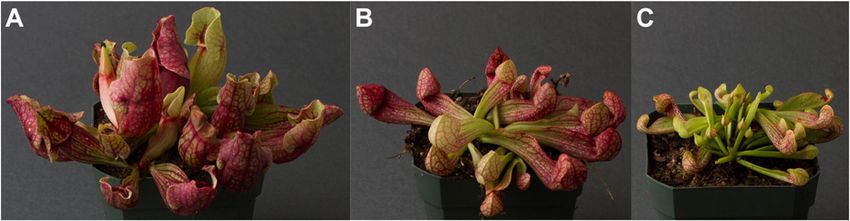
Figure 5. Examples of traits scored.
                                                                                                      Listed in order of decreasing %PVE, the same order as
                                                                                                      discussed in the text. (A) The lip is curled outward. (B)
                                                                                                      The lip extends slightly upward. (C) The lip extends
                                                                                                      upward and inward. (D) There is no visible tissue above
                                                                                                      lip. (E) There is a small amount of tissue upward from
                                                                                                      lip. (F) There is tissue extending upward and inward
                                                                                                      from lip.
                                                                                                      Source data are available for this figure.

a pronounced clearly visible line at the base signaling the end of the        thing to S. rosea there is no tissue extending upward but instead
hairy section. In S. psittacina this includes the entire length of the leaf   tissue curled down and under to form the lip rim as part of the
right up to the peristome. The F2s have a wide range of region lengths        pitfall trap. There are two significant loci with a significant in-
and can have sporadic hairs appearing out of place. There are two             teraction between them. Considered individually, abovelip-1 has
loci, with the lengintr-1 showing no dominance and lengintr-2                 dominance by the S. psittacina allele, whereas abovelip-2 has
showing partial dominance by the S. psittacina direction.                     dominance by the S. purpurea allele; the highest value occurs in
                                                                              individuals heterozygous for both loci.
veinprom: Well-defined veins; 18% PVE; one locus (Fig 7A–C).
                                                                              widtleaf: Leaf width, 17% PVE, two loci plus one of one pairwise
   S. psittacina tends to have well-defined easily traceable veins,
                                                                              interaction (Fig 7G–I).
whereas S. rosea can have veins which are less clearly visible in the
context of the leaf. This was scored on a 3 point scale with 0 being
                                                                                 This is the width of the leaf directly below the mouth opening.
most well-defined, and 2 being least defined. There was one sig-
                                                                              There are two significant loci, and the interaction between the two
nificant locus with no dominance.
                                                                              is also significant. The locus effects were in opposing directions
Abovelip: Tissue above the lip line; 17% PVE; two loci plus one of one        with the largest widths in pitchers homozygous for the widtleaf-1
pairwise interaction (Fig 7D–F).                                              locus from S. psittacina and widtleaf-2 locus from S. rosea. There is
                                                                              no significant dominance.
   This measures the length of the tissue above the lip line. When
one slices the leaves open (down the back of the leaf and filet the            openfrac: Fraction of pitchers open (pitfall) versus mostly closed
leaf open), S. psittacina has tissue extending upward protruding              (lobster); 16% PVE; two loci plus zero of one pairwise interaction
into the bell that makes the lobster-trap. When one does the same             (Fig 8A–D).

Sarracenia genetic linkage map with QTL   Malmberg et al.                     https://doi.org/10.26508/lsa.201800146   vol 1 | no 6 | e201800146       7 of 19
Figure 6. Examples of traits scored.
Listed in order of decreasing %PVE, the same order as
discussed in the text. (A–C) Do the veins and windows
have similar or different color patterns? (D–F) The
degree of openness of pitcher. (G–I) The length of the
region containing hairs from base upward.
Source data are available for this figure.
This is the fraction of pitchers which are open, S. rosea pitfall-like, green and 3 is no green. There was one locus found, explaining 8% of the
versus mostly closed with just a small periostome opening at the phenotypic variation, with dominance by the S. rosea allele.
base, S. psittacina or lobster-trap–like. There are two loci, with no
interactions; openfrac-2 shows dominance by the S. psittacina allele. widtspot: Widest leaf width; 8% PVE; one locus (Fig 9A–C).
leafcolr: Leaf color, green versus purple, ignoring veins; 16% PVE; This is the width of the leaf at its widest spot, which may be either
two loci plus one of one pairwise interaction (Fig 8E–G). above or below the mouth, whereas the widtleaf measure is always
just below the mouth opening, and maps to different loci. The one
This is the degree of purpleness, with green scored as 0, intense locus found shows dominance by the S. psittacina allele.
purple scored as 3, and intermediate shades as 1 or 2. Two significant
genetic loci were found, with an interaction between them. The most curvatur: Pitcher curvature, 6% PVE; one locus (Fig 9D–F).
intense color was found when the two loci were both homozygous for
the S. psittacina allele, but the least intense was when leafcolr-1 was This was measured as the angle between a flat area on the back
homozygous for the S. psittacina allele and leafcolr-2 was homo- of the pitcher and the tip of the operculum. For S. rosea, this
zygous for the S. rosea allele. Leafcolr-1 had some dominance by number is usually 90° but for S. psittacina it is always less than 50°.
S. psittacina, and leafcolr-2 showed no dominance. One significant locus was found which explained 6% of the phe-
notypic variation. There is no evidence for dominance.
deggreen: Degree of green color; 8% PVE; one locus (Fig 8H–K).
radalsym: Rosette radial symmetry, 4% PVE, one locus (Fig 9G–J).
This is an overall estimate of how much green versus red there is in an
individual. In some F2 plants, individual pitchers could vary significantly This is a visual observation of whether or not the rosettes have
from each other. Plants were scored on a 0 to 3 point scale where 0 is all radial symmetrical looking downward at them. In some non-symmetric
Sarracenia genetic linkage map with QTL Malmberg et al. https://doi.org/10.26508/lsa.201800146 vol 1 | no 6 | e201800146 8 of 19Figure 7. Examples of traits scored.
Listed in order of decreasing %PVE, the same order as
discussed in the text. (A–C) How well defined and easily
traceable are the veins? (D–F) The length of tissue
above the lip line. (G–I) The width of the leaf directly
below the mouth opening.
Source data are available for this figure.
F2 plants, the pitchers bunch together more on one side of the rosette subspecies of S. purpurea, S. rosea. For 17 pitcher traits which differ
than the other; or the pitchers may project upward and outward at between these taxa, we identified 64 loci which were placed on the
irregular angles. This was scored as a binary trait, 1 or 0. A single genetic map. This is the first genetic linkage map and QTL mapping
significant genetic locus was found which explained 4% of the phe- for a carnivorous plant.
notypic variation. S. rosea has greater symmetry than S. psittacina; and
this trait had significant dominance by the S. psittacina direction. A genetic linkage map for Sarracenia
Our linkage map contains 437 markers across 42 linkage groups,
Traits in the F1
with a total length of 2,017 cM. Twelve of these linkage groups were
10 cM or less in length. Previous cytogenetic work (Hecht, 1949)
The F1 plants were largely intermediate in all traits examined
indicated that there are 1N = 13 chromosomes. The 13 longest of the
between the two parental species (Fig 3). Many of the traits we
linkage groups we have identified range from 189.9 cM to 76.6 cM
measured had multiple loci detected, with a mix of dominance
with a total length of 1,446 cM. For comparison, grape, Vitis, is a
relationships and allele effects; hence, the intermediate state of the
species with extensive sequencing, and its transcript sequences are
F1 is not surprising.
some of the most similar to those of Sarracenia transcripts as
detected by Blast comparisons (Srivastava et al, 2011). A recent Vitis
linkage map (Wang et al, 2017) had 6,000 markers with a total length
Discussion of 2,186 cM in 19 linkage groups with lengths ranging from 86 cM to
237 cM. A linkage map of maize (Davis et al, 1999), certainly one of
We have constructed a linkage map of Sarracenia using an F2 the genetically most well-studied plants, contains 10 linkage groups
generation of a cross between two species, S. psittacina and a representing 10 chromosomes, and has a total length of 1,723 cM;
Sarracenia genetic linkage map with QTL Malmberg et al. https://doi.org/10.26508/lsa.201800146 vol 1 | no 6 | e201800146 9 of 19Figure 8. Examples of traits scored. Listed in order of decreasing %PVE, the same order as discussed in the text. (A–D) The fraction of pitchers open. (E–G) Green versus red/purple leaf color. (H–K) The fraction of pitchers with green versus red/purple leaves. Source data are available for this figure. the maize genome is about 70% of the size of the Sarracenia ge- sequencing efforts. Although we were successful in generating some nome. These comparisons suggest that our current linkage map SNP markers which were able to be mapped with the RADseq pro- covers most of the total genetic map, more than 80% of it, and lead tocol (Elshire et al, 2011) (78 SNPs), the RARseq (Alabady et al, 2015) to a rough global estimate of 1.4 × 10⁶ bp per cM for Sarracenia. method of generating markers from RNA was more productive (343 There were several difficulties in constructing the genetic map: it SNPs). A few of the RNA-based markers we mapped showed evidence took a long time, more than 10 y, to generate the F2 plants. The of duplications. The existence of high quality reference genome parents were heterozygous at multiple loci as we did not start with sequences from both the two parents, S. rosea and S. psittacina pure lines as parents (Mendel, 1951). Sarracenia has a relatively large would likely greatly improve the genetic map. genome size estimated to be 3.6 × 10⁹ basepairs (Rogers et al, 2010). There is a recent partial genome duplication which dates to about Pitcher trait inheritance the time of the divergence of the species within the genus (Srivastava et al, 2011), perhaps 2 million years ago. These difficulties likely lead The focus of our trait measurements has been on pitcher traits to the map being incomplete in spite of our multiple rounds of as insectivory is a hallmark of the genus, and insectivorous Sarracenia genetic linkage map with QTL Malmberg et al. https://doi.org/10.26508/lsa.201800146 vol 1 | no 6 | e201800146 10 of 19
Figure 9. Examples of traits scored.
Listed in order of decreasing %PVE, the same order as discussed in the text. (A–C) The width of the leaf at its widest spot. (D–F) The angle between a flat area on the back of
the pitcher and the tip of the operculum. (G–J) The degree of radial symmetry of rosette, with asymmetry seen in F2.
Source data are available for this figure.

adaptations are the reason for the general fascination with these                         somewhat differently; conversely a different environment might
plants. There are a wide diversity of pitcher morphologies within the                     reduce the %PVE for other traits.
Sarracenia genus, which may be associated with their insect-eating                           The %PVE varied from 3.7% (radalsym) to 96.5% (smoothzn) and
lifestyle, and may represent differences in insect-catching and                           99.6% (numpitch) for the full models. Radalsym was presence or
digestion strategies across the species. We picked 26 different                           absence of a lack of radial symmetry in the pitcher rosettes
pitcher traits to measure; for 17 of these traits we were able to map                     (Fig 9G–J); both parents have greater radial symmetry than some
significant QTLs, whereas nine of them failed to map. Our current                          of the F2 plants which showed the most extreme phenotype.
study established the genetic system and was an initial exploration                       Smoothzn is the glossy internal region free of hairs found in S. rosea
of quantitative trait heritability in one particular setting. Any of                      (Fig 4D–G), whereas numpitch is the number of leaves/pitchers per
these traits may behave differently when the plants are grown in a                        rosette (Fig 3A–C). The next highest %PVE after numpitch and
different environment. Some of the traits which showed no in-                             smoothzn was 55.3% (periotuk) (Fig 5A–F). The high %PVE may par-
heritance or low %PVE could have higher heritability if studied                           tially be due to these two traits being straightforward to score in

Sarracenia genetic linkage map with QTL      Malmberg et al.                             https://doi.org/10.26508/lsa.201800146     vol 1 | no 6 | e201800146        11 of 19
Table 2.   Quantitative traits mapped and their loci.

                               Linkage        Nearest        Position   Position                 %      P-                             Effect
 QT model      QT loci                                                                  LOD                     Significance Effect                 Dominance
                               group          marker         max.       interval                 PVE    value                          SD
 numpitch-
                                                                                        246.2    99.6   0.000   ***
 full
               numpitch-1           26        D163468             3.8   3.8–3.8         165.1    16.1   0.000   ***            0.03      1.01      T
               numpitch-2           30        S151516            10.4   10.4–10.4       163.4    15.4   0.000   ***             1.21    0.99       T
               numpitch-3           15        R1047              14.9   14.9–14.9       163.4    15.4   0.000   ***           –0.62      1.02      T
               numpitch-4           18        RI18               22.2   22.2–22.2       163.1    15.3   0.000   ***            0.09      1.03      —
               numpitch-5           31        RI787               0.0   0.0–0.0         161.0    14.6   0.000   ***            0.67      1.29      T
               numpitch-6            2        R8150              59.0   59.0–59.0       154.3    12.5   0.000   ***           –0.60      1.34      —
               numpitch-7            4        R3585             106.8   106.8–106.8     153.3    12.3   0.000   ***            0.57     0.99       —
               numpitch-8            9        RI1092             20.6   20.6–20.6       142.2     9.5   0.000   ***           –0.42     0.96       R
               numpitch-9             1       RI809               7.5   7.5–7.5         136.3     8.3   0.000   ***            0.70      1.13      —
 smoothzn-
                                                                                        163.9 96.5      0.000   ***
 full
               smoothzn-1           40        R8758               0.0   0.0–0.0          73.1    12.1   0.000   ***             2.39     1.13      O
               smoothzn-2            3        R5859, RI321      120.0   120.0–120.0       71.3   11.5   0.000   ***           –0.24      2.32      —
               smoothzn-3            11       R5369              56.0   56.0–62.0        70.0    11.1   0.000   ***             4.46     1.52      T
               smoothzn-4           22        S177374             2.0   2.0–2.0          69.6    11.0   0.000   ***           –0.06      2.25      —
               smoothzn-5            4        R9402              49.3   48.8–58.0        67.8    11.5   0.000   ***             3.27     1.43      T
               smoothzn-6           16        R4706              32.0   32.0–32.0        67.5    11.4   0.000   ***             1.28     1.97      O
               smoothzn-7            3        RI29, R1276        56.0   56.0–56.0        67.5    11.4   0.000   ***            0.17      1.19      —
               smoothzn-8            8        R2844              79.7   79.7–79.7        66.0    10.0   0.000   ***             2.92     1.45      R
               smoothzn-9           29        R3218               0.0   0.0–0.0          62.4     9.0   0.000   ***            0.38      2.32      O
 fenestra-
                                                                                         39.6    55.3   0.000   ***
 full
               fenestra-1            3        D303799           108.1   108.1–108.1      14.8    15.7   0.000   ***           –0.84     0.15       —
               fenestra-2           26        D163468             3.8   3.8–8.2            7.5    7.4   0.000   ***           –0.53     0.14       —
               fenestra-3           15        R1048              12.5   12.5–12.5          7.4    7.3   0.000   ***           –0.40     0.15       —
               fenestra-4            2        D35350             37.5   28.1–37.5         5.6     5.4   0.000   ***           –0.30     0.14       —
               fenestra-5             1       D284377           189.9   189.9–189.9       5.4     5.2   0.000   ***           –0.39     0.13       R
               fenestra-6            4        R8078              70.3   65.2–109.1        4.7     4.5   0.000   ***            0.26     0.17       T
               fenestra-7           34        R600                1.0   1.0–6.0           4.1     3.9   0.000   ***           –0.22     0.13       —
               fenestra-8           18        R6464              47.3   43.6–47.3         3.6     3.4   0.001   ***           –0.02     0.15       O
               fenestra-9            4        R8498             120.8   109.1–120.8       3.4     3.2   0.001   **             0.14     0.26       T
               fenestra-10          12        R906               68.3   13.6–71.5         3.2     3.0   0.002   **             0.17     0.16       —
               fenestra-11          13        R7097              59.9   0.0–59.9          2.6     2.5   0.005   **             0.19     0.13       O
               fenestra-12            7       RI1018             70.0   42.3–104.3        2.6     2.4   0.006   **            –0.07     0.12       O
               fenestra-13          19        R4633              20.9   20.9–38.6         2.3     2.1   0.011   *             –0.20     0.13       T
               fenestra-14           8        D45428              6.1   0.0–79.7           1.5    1.4   0.053                 –0.29     0.14       R
               fenestra-15           17       R2675              27.5   0.0–54.8          0.8     0.7   0.215                 –0.24     0.12       —
                                                                                                                             (Continued on following page)

Sarracenia genetic linkage map with QTL   Malmberg et al.                     https://doi.org/10.26508/lsa.201800146   vol 1 | no 6 | e201800146       12 of 19
Table 2. Continued
Linkage Nearest Position Position % P- Effect
QT model QT loci LOD Significance Effect Dominance
group marker max. interval PVE value SD
periotuk-
34.4 50.3 0.000 ***
full
S150112,
periotuk-1 5 116.0 82.0–112.0 12.3 14.1 0.000 *** 0.29 0.12 T
D353206
periotuk-2 3 R6003 146.7 92.0–146.7 11.9 13.7 0.001 *** 0.34 0.10 —
periotuk-3 4 R4020 65.2 51.4–78.0 11.6 13.2 0.001 *** 0.19 0.10 —
periotuk-4 1 D284377 189.9 186.0–189.9 11.6 12.0 0.002 ** 0.01 0.12 R
D482611,
periotuk-5 1 144.0 0.0–164.0 9.3 11.3 0.012 * 0.27 0.13 T
RI570
heigwing-
27.9 43.4 0.000 ***
full
heigwing-1 3 R1469 45.2 45.2–45.2 12.7 16.7 0.000 *** 2.41 0.64 —
heigwing-2 30 S151516 10.4 10.4–10.4 11.2 14.5 0.001 ** –0.96 0.52 O
heigwing-3 16 R1856 41.2 13.3–58.6 10.1 12.9 0.005 ** 1.79 0.47 —
heigwing-4 17 D197566 18.0 18.0–18.0 9.2 11.7 0.011 * –0.79 0.56 R
heigwing-5 3 R5859 116.8 116.8–116.8 8.3 10.5 0.028 * –0.65 0.67 O
ptnwindw-
17.6 30.2 0.000 ***
full
ptnwindw-1 8 R1768 0.0 0.0–4.0 12.6 20.4 0.000 *** –0.08 0.08 T
ptnwindw-2 34 R600, D285722 2.0 0.6–6.0 11.5 16.7 0.000 *** –0.23 0.11 —
ptnwindw-3 3 R5391 70.0 66.0–120.0 8.5 13.3 0.000 *** –0.12 0.07 T
openness-
14.7 25.8 0.000 ***
full
openness-1 3 D63270 87.0 69.9–87.0 10.5 17.7 0.000 *** –0.56 0.13 T
openness-2 5 D353206 114.1 113.4–114.1 5.6 9.0 0.007 ** –0.37 0.14 T
openness-3 1 R8063 111.9 57.4–117.0 5.6 9.0 0.007 ** –0.33 0.14 —
lengintr-
12.9 23.2 0.000 ***
full
lengintr-1 4 R8078 76.0 40.0–92.0 9.1 15.7 0.000 *** –5.71 1.07 —
lengintr-2 14 R934 37.4 29.1–56.0 5.7 9.4 0.000 *** –4.39 1.02 T
veinprom veinprom 3 R3403 111.2 116.0–116.0 9.9 18.3 0.000 *** 0.37 0.05 —
abovelip-
9.0 16.9 0.000 ***
full
abovelip-1 5 RI682 72.0 70.0–77.3 7.7 14.2 0.000 *** –0.34 0.19 R
abovelip-2 3 RI736 58.8 49.6–64.0 7.2 13.2 0.000 *** 0.30 0.19 T
widtleaf-
9.1 16.9 0.000 ***
full
widtleaf-1 11 D299124 66.0 60.0–72.0 8.3 15.3 0.000 *** 2.20 0.52 —
widtleaf-2 22 S177374 0.0 0.0–4.0 6.9 12.5 0.000 *** –0.39 0.52 —
openfrac-
7.9 16.2 0.000 ***
full
openfrac-1 3 R8309 83.3 57.2–95.5 6.0 11.9 0.000 *** 0.12 0.03 —
openfrac-2 20 R6925 26.8 1.7–31.5 4.3 8.5 0.004 ** 0.09 0.04 T
(Continued on following page)
Sarracenia genetic linkage map with QTL Malmberg et al. https://doi.org/10.26508/lsa.201800146 vol 1 | no 6 | e201800146 13 of 19Table 2. Continued
Linkage Nearest Position Position % P- Effect
QT model QT loci LOD Significance Effect Dominance
group marker max. interval PVE value SD
leafcolr-
8.6 16.0 0.000 ***
full
leafcolr-1 8 D325443 17.2 14.0–30.0 8.3 15.3 0.000 *** 0.21 0.12 T
leafcolr-2 18 R1315 34.0 6.0–42.0 7.5 13.8 0.000 *** –0.14 0.13 —
deggreen deggreen 3 R3403 111.2 66.0–122.0 4.2 8.3 0.000 *** 0.29 0.07 R
widtspot widtspot 18 D126613 11.9 0.0–26.4 4.2 8.3 0.000 *** –0.32 0.08 T
curvatur curvatur 2 D35350 36.0 12.0–98.0 3.1 6.2 0.001 *** 2.67 0.74 —
radalsym radalsym 1 RI12 95.0 24.0–188.0 1.8 3.7 0.015 * –0.10 0.06 T
QTL Model: For traits where there are multiple loci identified, the full model is indicated on the first line of the group with a -full suffix, then with individual loci
numbered below that. Traits are listed in decreasing order of percentage phenotypic variance explained; within a multi-locus trait, loci are numbered in
decreasing order of percentage phenotypic variance explained. Trait codes are given in Table 1. Position Max refers to the most likely single position and
Position Interval gives the range from a Bayesian confidence interval. LOD is the log-odds score, %PVE is the percentage phenotypic variance explained by that
model or locus. In the case of the -full models, except for fenestra, this includes additive effects of each locus and all pairwise interactions. For individual loci
for a trait which has multiple loci, the %PVE is taken from the R/qtl fitqtl() dropone analysis. For fenestra, there were too many possible pairwise interactions
hence the full model and the individual loci are taken from a purely additive model; fenestra-14 and fenestra-15 are included because subsequent calculations
of pairwise interactions indicated they had some significant interactions as listed in Table 3. P-value is the probability based upon an F-statistic; significance
levels are indicated based upon * forTable 3. Interactions between loci for the same trait with >1% phenotypic variance explained. QT model QTL pair LOD %PVE P-value Significance leafcolr 1:2 7.2 13.08 0.000 *** widtleaf 1:2 6.0 11.85 0.000 *** abovelip 1:2 5.5 9.91 0.000 *** ptnwindw 1:3 5.9 8.87 0.000 *** ptnwindw 1:2 5.9 8.85 0.000 *** smoothzn 6:1 17.1 1.46 0.000 ** smoothzn 2:6 15.5 1.31 0.001 ** smoothzn 2:1 14.3 1.19 0.001 * smoothzn 2:8 13.9 1.15 0.001 * smoothzn 7:8 13.6 1.12 0.002 * smoothzn 2:5 13.2 1.08 0.002 * smoothzn 3:4 12.9 1.06 0.002 * smoothzn 7:9 12.8 1.04 0.002 * smoothzn 8:3 12.7 1.03 0.003 * smoothzn 7:2 12.4 1.01 0.003 * smoothzn 7:6 12.4 1.01 0.003 * numpitch 8:5 87.9 2.54 0.000 *** numpitch 9:2 87.5 2.51 0.000 *** numpitch 6:1 84.2 2.30 0.000 *** numpitch 9:3 76.8 1.89 0.000 *** numpitch 7:4 73.5 1.73 0.000 *** numpitch 1:2 72.9 1.70 0.000 *** numpitch 7:2 69.8 1.56 0.000 *** numpitch 2:5 68.2 1.49 0.000 *** numpitch 6:5 67.9 1.48 0.000 *** numpitch 4:5 67.3 1.45 0.000 *** numpitch 7:1 65.2 1.36 0.000 *** numpitch 8:3 64.9 1.35 0.000 *** numpitch 3:4 62.7 1.27 0.000 *** numpitch 7:5 57.9 1.10 0.000 *** numpitch 6:3 55.9 1.03 0.000 *** numpitch 9:5 55.5 1.02 0.000 *** numpitch 1:5 54.9 1.00 0.000 *** Special case—fenestra: The 65 possible interactions discovered among loci in decreasing order of significance were: 12:15, 12:4, 12:9, 14:3, 12:6, 11:4, 5:6, 12:11, 5:11, 7: 4, 10:4, 7:15, 12:10, 3:6, 7:13, 10:3, 10:8, 1:9, 5:15, 14:7, 11:10, 7:10, 12:3, 7:8, 14:8, 5:8, 14:15, 5:9, 3:13, 1:7, 10:15, 1:15, 1:3, 14:11, 11:3, 3:4, 1:11, 7:6, 5:3, 10:6, 7:3, 7:11, 3:8, 1:6, 11:9, 1:2, 7:9, 2:5, 1:10, 12:8, 3:9, 14:10, 1:4, 13:9, 5:7, 7:12, 5:14, 1:13, 2:8, 14:6, 6:9, 2:3, 3:15, 2:11, 10:9. QTL Model: See Table 1 for an explanation of the names. The QTL-pair refers to the locus numbers which are interacting. Interactions are listed which are significant and for which %PVE >1%, except for fenestra. LOD is the log-odds score. %PVE is the percentage phenotypic variance explained by that interaction. P-value is the probability; significance levels are indicated based upon * for
and S. rosea have a smooth, glossy, hair-free zone above a more hirsute       results from the presence and absence of particular pitcher features.
region, whereas S. psittacina has hairs (trichomes) throughout. The           Our pitcher QTL were measured at only a relatively full grown stage of
presence of hairs is possibly important for S. psittacina to help keep the    the pitchers; comparison of pitchers of S. rosea, S. psittacina, and the
insects trapped inside, in combination with the narrow opening and            F2 plants at various developmental stages might help examine the
inward periostome, whereas S. rosea has its pitcher pond, and thus may        hypothesis (Naczi, 2018) that heterochrony is a part of the S. psit-
not need hairs in that region. Fig 4G is an example of an F2 pitcher which    tacina developmental evolution. Hybridization can occur between all
is largely S. psittacina–like in shape, but which has some smoothzn.          species or taxa within the genus, raising questions about what is the
Fenestration, the pattern of white windows, has been interpreted as           nature of a species in Sarracenia, and what evolutionary genetic
being involved in insect prey-attraction (Schaefer & Ruxton, 2014). This      mechanisms exist which might maintain a species in the face of
is found in S. psittacina, not S. rosea; we found the fenestra quantitative   rampant hybridization. The genetic map and the F2 population could
trait has 13–15 loci and potentially a large number of interactions           be tools which contribute to solving these problems.
among them. The genetic loci underpinning the periotuk, openness,                One of the attractions of this system is that the F2 plants are long-
openfrac, smoothzn, and fenestra traits are thus involved in the pitfall      lived and are easily subdivided for vegetative propagation. Given a set
versus lobster-trap differences in insect-capture strategy.                   of F2 plants which have been genotyped, it should be possible to readily
                                                                              map multiple additional QTLs by scoring the trait of interest across
Evolution                                                                     these plants, then performing a QTL analysis with the same marker and
                                                                              map files. For any traits of interest, these could be scored under
The phylogeny of the genus from Stephens et al (2015) divides the             multiple environmental conditions by growing clones of the charac-
taxa into two main groups—tall pitcher plants (S. oreophila, Sar-             terized genotypes. Similarly, additional analyses might improve the
racenia alabamensis, S. alata, S. rosea, and related taxa) and mixed-         number of markers in each F2 plant, and then it would be straight-
sized pitcher plants (S. purpurea, S. minor, S. psittacina, S. flava and       forward to reanalyze the data with a more detailed genetic map.
other taxa); S. psittacina is the shortest, smallest, and most hori-
zontal in its growth habit. The radiation of the taxa within the genus
was relatively recent, possibly 2 million years ago at a time co-
incident with a partial genome duplication (Srivastava et al, 2011).
                                                                              Materials and Methods
Our analysis detected 64 trait loci which differ between S. rosea and
                                                                              Cross
S. psittacina. The analysis of crosses between similar plant species
has shown examples of both a small number of major effect loci,
                                                                              The initial cross was between the southeastern variety of S. pur-
and also a larger number of minor effect loci for traits contributing
                                                                              purea, S. rosea (S. purpurea venosa burkii) (male), and S. psittacina
to the evolution or domestication of these species (as examples
                                                                              (female). F1 plants were grown and selfed to generate F2 indi-
[Doebley, John, 1992; Wills & Burke, 2007; Brandvain et al, 2014;
                                                                              viduals. All plants were grown in the Plant Biology Depart-
Fishman et al, 2014; Wang et al, 2015; Garner et al, 2016; Kenney &
                                                                              ment greenhouses, University of Georgia, Athens, Georgia, USA
Sweigart, 2016; Badouin et al, 2017]). The pattern we have seen in the
                                                                              (33°55945.70N 83°21949.60W).
pitcher traits examined so far is more similar to having a large
number of minor effect loci. We have not examined floral traits
whose inheritance might be expected to provide insight into the               RNA-based markers
divergence of S. rosea and S. psittacina; superficially, the flowers of
the two parental species differ modestly in size and color, but their         We used the restriction site associated RARseq method, as de-
overall morphology is very similar. Particularly where there are              scribed by Alabady et al (2015), to generate RNA-based SNP markers.
multiple loci for the same trait, some of the genetic differences we          RNA was isolated from each of the F2 plants then these were re-
have found might be related to duplications of portions of the                verse transcribed into cDNA using the methods described (Alabady
genome, beyond the five pairs of loci listed which map at different            et al, 2015). The cDNA samples were digested with restriction MseI,
locations. The multiple loci may be identifying paralogous genes.             then the resulting fragments were size fractionated on an agarose
                                                                              gel to produce fragments of 250–600 bp. These fragments were
Prospects                                                                     ligated to oligonucleotide adapters which contained unique
                                                                              barcodes for each individual plant and which prepared the samples
We have generated a linkage map which is 80% complete; the                    as libraries for Illumina sequencing. The sequencing was performed
successful mapping of a number of pitcher QTLs demonstrates                   on the NextSeq platform.
some of the potential of this system. We have studied a variety of               We generated reference transcriptome sequences from S. rosea
pitcher morphological traits, but there are many other questions              and S. psittacina with deep coverage, using both nextseq (Illumina)
that could be similarly addressed with these F2 plants by measur-             and long read Iso-Seq (PacBio) platforms. SNP identification was
ing appropriate traits, provided they differ between S. rosea and             performed using the program STACKS (Catchen et al, 2013) version
S. psittacina. As examples: The roles of the various pitcher compo-           1.48; we performed reference-based SNP detection by compari-
nents in insect capture and digestion might be studied in F2 plants           son of the sequences from the F2 plants to the reference tran-
which contain various combinations of the traits, such as hairs               scriptomes. In the final marker set used for mapping, the SNPs
(trichomes), fenestrations, and periostome structures, to determine           detected from the NextSeq ranscriptome reference begin with the
the effect of each; specific combinations of QTL could be used to test         letter R followed by the number assigned by STACKS. The actual

Sarracenia genetic linkage map with QTL   Malmberg et al.                     https://doi.org/10.26508/lsa.201800146   vol 1 | no 6 | e201800146   16 of 19
SNPs in their sequence contexts are given in the Supplemental suggested an initial LOD score criterion of 6.1 for the mapping
Information 5. process; we actually used LOD 6.5.
Blast2Go (Conesa et al, 2005; Gotz et al, 2008) analysis of the
DNA-based markers sequence tags for the mapped SNP markers was performed using
version 5.1.12 with a standard annotation pipeline of blast and
We used standard restriction site–associated DNA sequencing interpro searches followed by go mapping and annotation. The
(RADseq) methods (Elshire et al, 2011) to generate a subset of summary results table (Supplemental Information 7) is organized in
genomic fragments for sequencing. A double digest with MspI and genetic map order with the marker and QTL positions indicated on
SbfI succeeded in generating sequences with a reasonable the genetic map.
probability of being matched across the F2 individuals. After the
size selection, the fragments were ligated to oligonucleotide QTL mapping
adapters which contained unique barcodes for each individual
plant and which prepared the samples as libraries for Illumina The R package qtl (Broman et al, 2003; Broman & Sen, 2009; Arends
sequencing. The sequencing was carried out on the NextSeq et al, 2010) was used for mapping the quantitative traits. The qtl
platform. SNPs were detected by the software STACKS as a denovo, package functions scanone() and scantwo() were used to scan for
non-referenced–based, pipeline. In the final marker set used for candidate loci, and then makeqtl() and fitqtl() were used to evaluate
mapping, the SNPs detected from RADseq begin with the letter D the qtl models. 2,000 permutations were used to set significance
followed by the number assigned by STACKS. The actual SNPs in levels. Significant QTLs were identified for 17 of 26 quantitative traits.
their sequence contexts are given in the Supplemental Infor- The ANOVA approach of the fitqtl() function was used to determine
mation 5. the significance of single or multiple loci per trait, and to report the
A total of 16 SSRs (microsatellites), isolated as described in significance of all pairwise interactions among these loci, or pairwise
Rogers et al (2010) were also used as markers in the map con- epistasis. Effectplot() was also used to help assess allele effects and
struction. The SSR primer sequences are given in the Supplemental dominance; examples are given in Fig S1. The QTL effects were
Information 6. calculated by R/qtl as 0.5 * (rosea_value - psittacina_value).
We tested some of the mqm multiple qtl mapping functions;
Traits however, the mqmaugment() function never finished its analysis,
which suggests that this approach does not work well with our
The F2 plants were greenhouse grown. The plant traits discussed dataset (Broman in Google Groups R/qtl discussion, 2017). The traits
were measured in May 2017, when most of the F2 plants were 5 y old. and their scoring are discussed in more detail in the Results
The traits are illustrated in Fig 4 (parents) and in Fig 5 (F2 examples). section. The package LinkageMapView (Ouellette et al, 2018) works
In addition to the traits presented in the results and discussion, together with the qtl package, and was used to generate the genetic
there were nine traits which failed to show any genetic component map and QTL diagrams.
to the phenotypic variance: plant height (plheight); a combination
of pitcher width and wing height measured in a profile (winglfpf);
the distance from the back of the leaf to the tip of the operculum Data Availability
measured in a profile (pfloperc); the width of the pitcher at its
widest point above the mouth opening, periostome, (widtbell); a
The sequencing data from this publication have been deposited to
measure of the location of green in a leaf of mixed color (locgreen);
the NCBI SRA database (https://www.ncbi.nlm.nih.gov/bioproject/)
a measure of the color of the veins (veincolr); a measure of the
and assigned the identifier PRJNA288354 with SRA identifiers
thickness of the periostome lip (periowid); total length from base to
SRR8096761 and SRR8096762. The data required for genetic marker
crown (lengbscr); and one measure of whether the periostome was
and QTL mapping are contained in Supplemental Information 2, 3, 4,
more S. rosea or S. psittacina—like (perioinv).
5, 6, 7 accompanying this manuscript.
Map construction
R version 3.4.3 2017-11-30 (R Core Team, 2013), and the packages that
Supplementary Information
are associated with this version were used in this analysis. The R
Supplementary Information is available at https://doi.org/10.26508/lsa.
package onemap (Margarido et al, 2007) was used to construct the
201800146.
map, with some additional analyses of the linkage map performed
by the R package qtl (Broman et al, 2003; Broman & Sen, 2009;
Arends et al, 2010). Markers were discarded if they appeared in
fewer than 10% of the total genetic lines; F2 genotypes were dis- Acknowledgements
carded if they had fewer than 10% of the total number of markers;
any marker showing segregation distortion was discarded. The final The project was completed over a number of years and we had help and
useful discussions with a number of individuals, including: Jess Stephens, Na
dataset contained 281 F2 lines (genotypes), and 572 markers. The Wang, Ed McAssey, Jim Leebens-Mack, Jim Hamrick, Greg Cousins, Mary Jo
onemap function group() formed linkage groups, then order_seq() Godt, Lisa Donovan, Ron Determann, Kelly Dawe, Jenny Cruse-Sanders, Mi-
and ripple_seq() were used to form the maps. The onemap package chael Boyd, and John Burke. Two manuscript reviewers provided helpful
Sarracenia genetic linkage map with QTL Malmberg et al. https://doi.org/10.26508/lsa.201800146 vol 1 | no 6 | e201800146 17 of 19comments and suggestions. Funding supporting this research was received Catchen J, Hohenlohe PA, Bassham S, Amores A, Cresko WA (2013) Stacks: An
from a University of Georgia Distinguished University Professorship research analysis tool set for population genomics. Mol Ecol 22: 3124–3140.
fund to RL Malmberg. doi:10.1111/mec.12354
Conesa A, Gotz S, Garcia-Gomez JM, Terol J, Talon M, Robles M (2005) Blast2GO:
Author Contributions A universal tool for annotation, visualization and analysis in
functional genomics research. Bioinformatics 21: 3674–3676.
doi:10.1093/bioinformatics/bti610
RL Malmberg: conceptualization, resources, data curation, software,
formal analysis, supervision, funding acquisition, validation, in- Darwin CR (1888) Insectivorous Plants, Darwin F (ed), 2nd edn, London, United
Kingdom: John Murray
vestigation, visualization, methodology, project administration, and
writing—original draft, review, and editing. Davis GL, McMullen MD, Baysdorfer C, Musket T, Grant D, Staebell M, Xu G,
Polacco M, Koster L, Melia-Hancock S, et al (1999) A maize map
WL Rogers: data curation, investigation, methodology, project ad- standard with sequenced core markers, grass genome reference
ministration, and writing—review and editing. points and 932 expressed sequence tagged sites (ESTs) in a 1736-locus
MS Alabady: resources, data curation, software, formal analysis, map. Genetics 152: 1137–1172
investigation, methodology, and writing—review and editing. Doebley J (1992) Mapping the genes that made maize. Trends Genet 8:
302–307. doi:10.1016/0168-9525(92)90261-2
Conflict of Interest Statement Ellison AM, Adamec L (eds) (2018) Carnivorous Plants: Physiology, Ecology,
and Evolution. Oxford, UK: Oxford University Press
The authors declare that they have no conflicts of interest. Ellison AM (2006) Nutrient limitation and stoichiometry of carnivorous
plants. Plant Biol 8: 740–747. doi:10.1055/s-2006-923956
Ellison AM, Gotelli NJ (2002) Nitrogen availability alters the expression of
References carnivory in the northern pitcher plant, Sarracenia purpurea. Proc
Natl Acad Sci USA 99: 4409–4412. doi:10.1073/pnas.022057199
Elshire RJ, Glaubitz JC, Sun Q, Poland JA, Kawamoto K, Buckler ES, Mitchell SE
Adlassnig W, Koller-Peroutka M, Bauer S, Koshkin E, Lendl T, Lichtscheidl IK
(2011) A robust, simple genotyping-by-sequencing (GBS) approach for
(2012) Endocytotic uptake of nutrients in carnivorous plants. Plant J 71:
high diversity species. 8: e62137. doi:10.1371/journal.pone.0062137
303–313. doi:10.1111/j.1365-313X.2012.04997.x
Alabady MS, Rogers WL, Malmberg RL (2015) Development of transcriptomic Fishman L, Sweigart AL, Kenney AM, Campbell S (2014) Major quantitative trait
markers for population analysis using restriction site associated RNA loci control divergence in critical photoperiod for flowering between
sequencing (RARseq). PLoS One 10: e0134855. doi:10.1371/journal. selfing and outcrossing species of monkeyflower (Mimulus). New
pone.0134855 Phytol 201: 1498–1507. doi:10.1111/nph.12618
Arends D, Prins P, Jansen RC, Broman KW (2010) R/qtl: High-throughput Gallie DR, Chang SC (1997) Signal transduction in the carnivorous plant
multiple QTL mapping. Bioinformatics 26: 2990–2992. doi:10.1093/ Sarracenia purpurea: Regulation of secretory hydrolase expression
bioinformatics/btq565 during development and in response to resources. Plant Physiol 115:
1461–1471. doi:10.1104/pp.115.4.1461
Badouin H, Gouzy J, Grassa CJ, Murat F, Staton SE, Cottret L, Lelandais-Brière C,
Owens GL, Carrère S, Mayjonade B, et al (2017) The sunflower genome Garner AG, Kenney AM, Fishman L, Sweigart AL (2016) Genetic loci with parent-
provides insights into oil metabolism, flowering and Asterid of-origin effects cause hybrid seed lethality in crosses between
evolution. Nature 546: 148–152. doi:10.1038/nature22380 Mimulus species. New Phytol 211: 319–331. doi:10.1111/nph.13897
Baiser B, Gotelli NJ, Buckley HL, Miller TE, Ellison AM (2012) Geographic Givnish TJ (2015) New evidence on the origin of carnivorous plants. Proc Natl
variation in network structure of a nearctic aquatic food web. Glob Acad Sci USA 112: 10–11. doi:10.1073/pnas.1422278112
Ecol Biogeogr 21: 579–591. doi:10.1111/j.1466-8238.2011.00705.x Gotelli NJ, Ellison AM (2006) Food-web models predict species abundances in
Bradshaw WE, Creelman RA (1984) Mutualism between the carnivorous response to habitat change. PLos Biol 4: 1869–1873. doi:10.1371/
purple pitcher plant and its inhabitants. Am Midl Nat 112: 294–304. journal.pbio.0040324
doi:10.2307/2425436 Gotz S, Garcia-Gomez JM, Terol J, Williams TD, Nagaraj SH, Nueda MJ, Robles M,
Brandvain Y, Kenney AM, Flagel L, Coop G, Sweigart AL (2014) Speciation and Talon M, Dopazo J, Conesa A (2008) High-throughput functional
introgression between Mimulus nasutus and Mimulus guttatus. PLoS annotation and data mining with the Blast2GO suite. Nucleic Acids Res
Genet 10: e1004410: doi:10.1371/journal.pgen.1004410 36: 3420–3435. doi:10.1093/nar/gkn176
Broman in Google Groups R/qtl Discussion (2017) R/qtl discussion: Hecht A (1949) The Somatic chromosomes of Sarracenia. Bull Torrey Bot Club
mqmaugment running forever. https://groups.google.com/forum/ 76: 7–9. doi:10.2307/2481882
#!searchin/rqtl-disc/mqmaugment$20running$20forever%7Csort: Horner JD, Plachno BJ, Bauer U, Di Giusto B (2018) Chapter 12 attraction of
date/rqtl-disc/qtlh7DoM-sk/JjqvZ17QAQAJ prey. In Carnivorous Plants: Physiology, Ecology, and Evolution, Ellison
Broman KW, Sen S (2009) Guide to QTL mapping with R/qtl. 1–396. New York, AM, Adamec L (eds) 157–166. Oxford, United Kingdom: Oxford
NY: Springer-Verlag University Press
Broman KW, Wu H, Sen S, Churchill GA (2003) R/qtl: QTL mapping in Jurgens A, El-Sayed AM, Suckling DM (2009) Do carnivorous plants use
experimental crosses. Bioinformatics 19: 889–890. doi:10.1093/ volatiles for attracting prey insects? Funct Ecol 23: 875–887. doi:10.1111/
bioinformatics/btg112 j.1365-2435.2009.01626.x
Buckley HL, Miller TE, Ellison AM, Gotelli NJ (2003) Reverse latitudinal trends Karagatzides JD, Butler JL, Ellison AM (2009) The pitcher plant Sarracenia purpurea
in species richness of pitcher-plant food webs. Ecol Lett 6: 825–829. can directly acquire organic nitrogen and short-circuit the inorganic
doi:10.1046/j.1461-0248.2003.00504.x nitrogen cycle. PLoS One 4: e6164. doi:10.1371/journal.pone.0006164
Butler JL, Ellison AM (2007) Nitrogen cycling dynamics in the carnivorous Karagatzides JD, Butler JL, Ellison AM (2012) Pitcher plant Sarracenia purpurea
northern pitcher plant, Sarracenia purpurea. Funct Ecol 21: 835–843. and the inorganic nitrogen cycle. In Plant Physiology, Stewart P,
doi:10.1111/j.1365-2435.2007.01307.x Globig S (eds) 15–28. Palm Bay, FL: Apple Academic Press
Sarracenia genetic linkage map with QTL Malmberg et al. https://doi.org/10.26508/lsa.201800146 vol 1 | no 6 | e201800146 18 of 19You can also read