Genetic characterization of large parathyroid adenomas - Bioscientifica
←
→
Page content transcription
If your browser does not render page correctly, please read the page content below
Endocrine-Related Cancer (2012) 19 389–407

Genetic characterization of large
parathyroid adenomas
Luqman Sulaiman1,2, Inga-Lena Nilsson3, C Christofer Juhlin1,2,4,
Felix Haglund1,2, Anders Höög4, Catharina Larsson1,2 and Jamileh Hashemi1,2
1
 Medical Genetics Unit, Department of Molecular Medicine and Surgery, Karolinska Institutet, Karolinska University Hospital CMM
L8:01, SE-171 76 Stockholm, Sweden
2
 Center for Molecular Medicine, Karolinska University Hospital, L8:01, SE-171 76 Stockholm, Sweden
3
 Endocrine Surgery Unit, Department of Molecular Medicine and Surgery, Karolinska Institutet, Karolinska University Hospital P9:03,
SE-171 76 Stockholm, Sweden
4
 Department of Oncology-Pathology, Karolinska Institutet, Karolinska University Hospital P1:02, SE-171 76 Stockholm, Sweden
(Correspondence should be addressed to C Larsson at Medical Genetics Unit, Department of Molecular Medicine and Surgery,
Karolinska Institutet, Center for Molecular Medicine, Karolinska University Hospital CMM L8:01; Email: catharina.larsson@ki.se)

Abstract
In this study, we genetically characterized parathyroid adenomas with large glandular weights, for
which independent observations suggest pronounced clinical manifestations. Large parathyroid
adenomas (LPTAs) were defined as the 5% largest sporadic parathyroid adenomas identified
among the 590 cases operated in our institution during 2005–2009. The LPTA group
showed a higher relative number of male cases and significantly higher levels of total plasma
and ionized serum calcium (P!0.001). Further analysis of 21 LPTAs revealed low MIB1
proliferation index (0.1–1.5%), MEN1 mutations in five cases, and one HRPT2 (CDC73) mutation.
Total or partial loss of parafibromin expression was observed in ten tumors, two of which also
showed loss of APC expression. Using array CGH, we demonstrated recurrent copy number
alterations most frequently involving loss in 1p (29%), gain in 5 (38%), and loss in 11q (33%).
Totally, 21 minimal overlapping regions were defined for losses in 1p, 7q, 9p, 11, and 15q and
gains in 3q, 5, 7p, 8p, 16q, 17p, and 19q. In addition, 12 tumors showed gross alterations of entire
or almost entire chromosomes most frequently gain of 5 and loss of chromosome 11. While gain of
5 was the most frequent alteration observed in LPTAs, it was only detected in a small proportion
(4/58 cases, 7%) of parathyroid adenomas. A significant positive correlation was observed
between parathyroid hormone level and total copy number gain (rZ0.48, PZ0.031). These
results support that LPTAs represent a group of patients with pronounced parathyroid
hyperfunction and associated with specific genomic features.
Endocrine-Related Cancer (2012) 19 389–407

Introduction                                                                    Swedish population have recognized PHPT in about
Primary hyperparathyroidism (PHPT) is one of the                                3.4% of this entity (Lundgren et al. 2002).
most common endocrine disorders. Affected patients                                 Previous studies have identified several causative
typically present with high levels of ionized serum                             genetic events in PHPT contributing to the overall
calcium (S-Ca2C) resulting from abnormally high                                 understanding of the molecular pathogenesis of the
production of parathyroid hormone (PTH). In about                               disease. Constitutional mutations are most common
85% of cases, PHPT is due to an adenoma, multi-                                 not only in the tumor suppressor genes MEN1 (11q13;
glandular disease accounts for about 15% of cases, and                          Chandrasekharappa et al. 1997, Lemmens et al. 1997)
1% of patients have parathyroid carcinoma (DeLellis                             and HRPT2 (CDC73; 1q31.2; Carpten et al. 2002) but
et al. 2004). The disease is more common among                                  also occur in CASR (3q21.1; Carling et al. 2000,
postmenopausal women, and screening studies in the                              Simonds et al. 2002) and CDKN1B/p27 (12p13.1;
Endocrine-Related Cancer (2012) 19 389–407                                                                                DOI: 10.1530/ERC-11-0140
1351–0088/12/019–389 q 2012 Society for Endocrinology Printed in Great Britain             Online version via http://www.endocrinology-journals.org
This is an Open Access article distributed under the terms of the Society for Endocrinology’s Re-use  Downloaded
                                                                                                            Licencefrom Bioscientifica.com
                                                                                                                      which                at 07/28/2021
                                                                                                                             permits unrestricted        08:14:29AM
                                                                                                                                                      non-
                                                                                                                                                      via free access
commercial use, distribution, and reproduction in any medium, provided the original work is properly cited.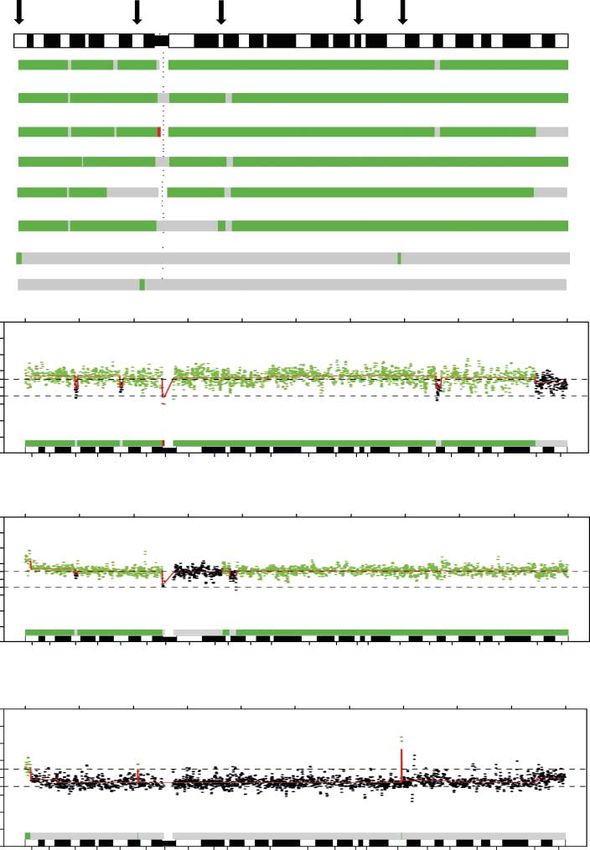
L Sulaiman et al.: DNA copy numbers in large parathyroid adenomas

Pellegata et al. 2006). Somatic mutations are               In studies of sporadic parathyroid adenomas, associ-
commonly seen for MEN1 in parathyroid adenomas              ations have been made between molecular features and
(Heppner et al. 1997, Farnebo et al. 1998) and for          tumor size. For example, one study reported differ-
HRPT2 in parathyroid carcinomas (Howell et al. 2003,        ential microarray gene expression profiles in sporadic
Shattuck et al. 2003). Chromosome 11 rearrangements         parathyroid adenomas with different glandular weights
between PTH and cyclin D1/PRAD1 have been                   (Rosen et al. 2005).
detected in a few cases of sporadic PHPT (Arnold               The genetic background of LPTA has not been
et al. 1989). In addition, two cases of somatic             characterized so far. In this study, we hypothesized that
translocations have been reported, including a              large glandular weight and associated phenotypes may
t(1;5)(p22;q32; Örndal et al. 1990) and a                  be attributed to distinct genetic abnormalities. To test
t(4;13)(q21;q14; Sammarelli et al. 2007).                   our hypothesis, we characterized the mutation status of
   Screenings of PHPT adenomas for genomic altera-          the MEN1 and HRPT2 genes and applied high-
tions by comparative genomic hybridization (CGH;            resolution array CGH to assess copy number altera-
Agarwal et al. 1998, Palanisamy et al. 1998, Farnebo        tions (CNAs) in a panel of such tumors representing the
et al. 1999, Hemmer et al. 2001, Garcia et al. 2002),       5% largest sporadic parathyroid adenomas in our
loss of heterozygosity (LOH; Cryns et al. 1995, Tahara      institution.
et al. 1996, 1997, Williamson et al. 1997, Carling et al.
1998, Dwight et al. 2000, 2002, Correa et al. 2002),
and array CGH (Yi et al. 2008) have identified              Materials and methods
recurrent losses in 1p, 3q, 6q, 9p, 11p, 11q, and 15q
                                                            LPTA cases
and gains of 16p and 19p.
   While the risk groups of familial and malignant          Cases with LPTA were identified from patients operated
PHPT have been partly elucidated at the molecular           for PHPT in the Karolinska University Hospital, Stock-
level, less is known about sporadic parathyroid             holm, Sweden, during 2005–2009. A total of 590 patients
adenomas with pronounced clinical and tumor pheno-          were identified who were without a known genetic
types. The terms Large or Giant adenoma have been           predisposition for the disease and had a parathyroid
applied to describe cases of parathyroid tumors             adenoma of a specified weight that had been examined at
with glandular weights far larger than the median           routine clinical histopathology (Table 1). From the
weight (650 mg) of unselected parathyroid adenomas          distribution of tumor sizes, we identified a group of 31
(Almquist et al. 2010). Publications describing cases of    patients representing the 5% largest tumors with
large parathyroid tumors are so far limited; however,       glandular weight R4 g (Supplementary Figure 1, see
male overrepresentation and increased biochemical           section on supplementary data given at the end of this
symptoms have been observed in limited case series          article), which were classified as LPTAs.
(Takeichi et al. 1983, Lalanne-Mistrih et al. 2002,            Nineteen of these 31 LPTA cases were included in
Chiofalo et al. 2005, O’Neal et al. 2011). Several          genetic studies based on frozen tissue sample avail-
studies have compared adenoma weight with bio-              ability. Two additional LPTA tumors (cases 1 and 2)
chemical parameters. While some of these have               were identified from our previous studies (Juhlin et al.
reported positive correlations between parathyroid          2006). Details for the 21 cases investigated here,
adenoma weight and levels of blood calcium (both            concerning demographic and biochemical parameters,
total plasma and S-Ca2C) and PTH, other studies did         are presented in Table 2. One patient had a known
not reveal such correlations (Hedbäck et al. 1995,         history of irradiation to the head and neck region
Bindlish et al. 2002, Randhawa et al. 2007).                (case 8), two had renal stones (cases 4 and 20), and one
Furthermore, increased parathyroid adenoma weight           had renal failure (case 3). No clinical/family history
was found to be associated with higher risk of death        suggestive of multiple endocrine neoplasia or familial
(Hedbäck et al. 1995). These circumstances imply that      PHPT syndrome could be elicited. Based on the
large parathyroid adenoma (LPTA) patients could have        clinical, surgical, and pathological findings, all patients
more aggressive clinical presentations. The aforemen-       were diagnosed with single gland disease classified as
tioned features of LPTA are also in line with               parathyroid adenoma or atypical adenoma according to
observations that parathyroid carcinomas generally          the World Health Organization (WHO) criteria
have a higher glandular weight than regular adenomas        (DeLellis et al. 2004). The diagnosis of atypical
(Kebebew 2001, Shane 2001, Robert et al. 2005,              adenoma was based on the histopathological features
Agarwal et al. 2006, Fernandez-Ranvier et al.               such as capsular engagement, trabecular formation,
2007) and mostly have pronounced clinical symptoms.         vascular invasion, fibrous bands, and increased MIB1
                                                                                  Downloaded from Bioscientifica.com at 07/28/2021 08:14:29AM
                                                                                                                                via free access
390                                                                                           www.endocrinology-journals.org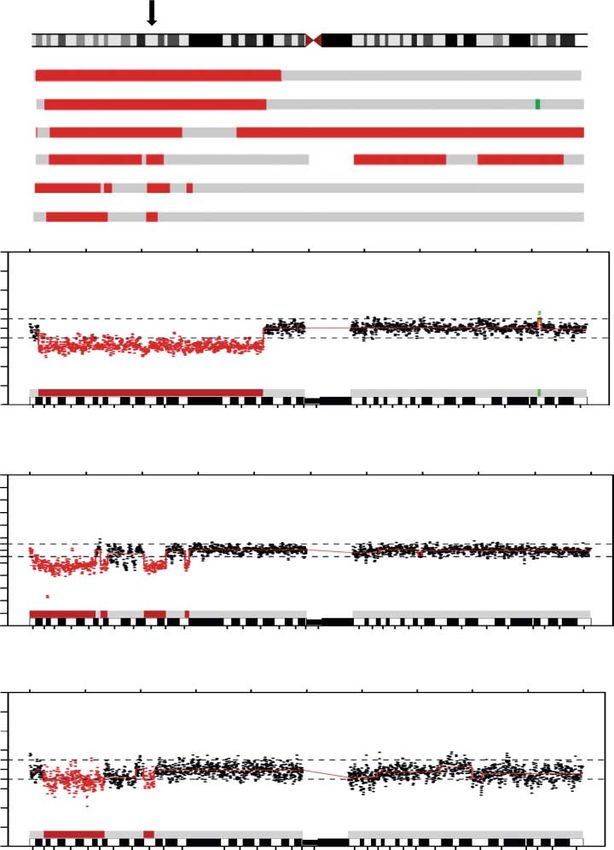
Table 1 Characteristics of the sporadic PHPT adenoma population 2005–2009
Parameter number LPTA R4 g P Adenomas !4 g P P !4 All adenomas P LPTA 1–21 R4 g P
of informative (nZ31) _–\ (nZ559) _–\ to R4 g (nZ590) _–\ (nZ21) _–\
Weight (g) nZ31 nZ559 nZ590 nZ21
Male
Median (min–max) 7.10 (4.07–12.30) 0.54 (0.12–3.91) 0.60 (0.05–27.80) 8.88 (4.07–12.30)
MeanGS.E.M. 7.56G0.90 0.76G0.07 1.34G0.02 8.54G1.02
0.86 !0.001 !0.001 0.77
www.endocrinology-journals.org
Female
Median (min–max) 6.59 (4.12–27.80) 0.37 (0.05–3.80) 0.39 (0.05–27.80) 7.50 (4.23–27.80)
MeanGS.E.M. 7.82G1.31 0.60G0.03 0.90G0.09 9.67G2.44
Gender nZ31 nZ559 nZ590 nZ21
Male
Number (%) 11 (35%) 121 (22%) 0.037 132 (22%) 8 (38%)
Female
Number (%) 20 (65%) 438 (78%) 458 (78%) 13 (62%)
Age at diagnosis (years) nZ31 nZ559 nZ590 nZ21
Male
Median (min–max) 66.0 (37–86) 59.0 (17–85) 59.0 (17–86) 66.0 (37.84)
MeanGS.E.M. 63.2G4.7 56.5G1.5 57.0G1.4 64.4G5.5
0.66 0.054 0.54 0.087 0.41
Female
Median (min–max) 61.0 (29–90) 60.0 (19–92) 60 (19–92) 62.0 (38–83)
MeanGS.E.M. 60.7G3.7 60.1G0.6 60.1G0.6 62.3G3.9
Total plasma calcium nZ29 nZ547 nZ576 nZ21
(mmol/l)
Male
Median (min–max) 3.03 (1.72–3.53) 2.80 (2.48–3.94) 2.81 (2.48–3.94) 3.10 (2.73–3.53)
MeanGS.E.M. 2.94G0.14 2.82G0.03 2.83G0.03 3.1G0.09
0.74 0.001 !0.001 !0.001 0.46
Female
Median (min–max) 3.02 (2.72–3.49) 2.75 (2.46–3.57) 2.75 (2.46–3.57) 3.00 (2.72–3.49)
MeanGS.E.M. 2.94G0.16 2.76G0.01 2.77G0.01 3.07G0.07
Ionized serum calcium nZ28 nZ550 nZ578 nZ18
(mmol/l)
Male
Median (min–max) 1.59 (1.43–1.85) 1.47 (1.30–2.06) 1.48 (1.30–2.06) 1.64 (1.43–1.85)
MeanGS.E.M. 1.55G0.07 1.50G0.01 1.50G0.01 1.64G0.04
0.84 0.001 !0.001 !0.001 0.54
Female
Median (min–max) 1.59 (1.43–1.86) 1.44 (1.29–1.87) 1.44 (1.29–1.87) 1.59 (1.43–1.86)
MeanGS.E.M. 1.63G0.03 1.45G0.01 1.47G0.01 1.63G0.04
n, number; min, minimum; max, maximum. Reference values: glandular weight 0.04–0.06 g; total plasma calcium 2.15–2.55 mmol/l; ionized serum calcium 1.15–1.33 mmol/l. P values
!0.05 were considered as statistically significant.
Endocrine-Related Cancer (2012) 19 389–407
391
via free access
Downloaded from Bioscientifica.com at 07/28/2021 08:14:29AM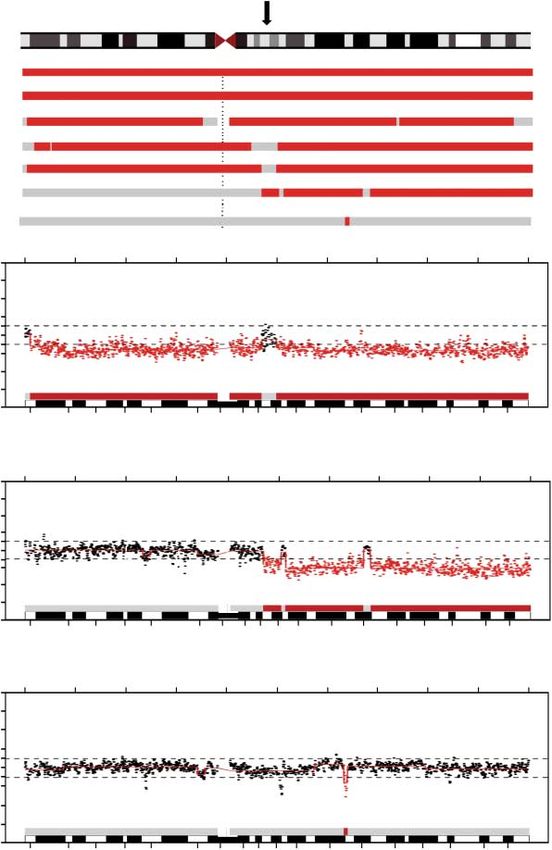
L Sulaiman et al.: DNA copy numbers in large parathyroid adenomas

Table 2 Clinical and histopathological details of the 21 LPTA cases

                                            Calcium (mmol/l)

                                Tumor                                                                              Histopathological
Case        Age      Sex        weight                              P-PTH     Original         Dominating             features of
no.       (years)    (M/F)        (g)        Total     Ionized       (ng/l)   diagnosis        cell type           atypical adenoma

1           75       F            6.54       2.85        –            711     Atypical         Chief cell         Trabecular
                                                                                adenoma
2           36       F           4.86        3.08        –              83    Adenoma          Chief cell         No
3           62       F           5.07        3.00        1.55          424    Adenoma          Chief cell         No
4           41       M           4.28        2.82        –             149    Adenoma          Chief cell         Trabecular
5           57       F           8.50        2.97        1.59          358    Adenoma          Chief cell         No
6           58       F           7.60        3.19        1.86          351    Adenoma          Chief cell         No
7           66       M           5.51        3.12        1.74          256    Adenoma          Chief cell         No
8           74       F           6.06        3.16        1.78          298    Adenoma          Chief cell         No
9           83       F           4.67        2.56        1.48            –    Adenoma          Oxyphilic          No
10          65       F           7.50        2.92        1.41          147    Adenoma          Chief cell         Pleomorphism
11          72       M          12.30        3.00        1.63         1070    Adenoma          Mixed              Trabecular
12          59       M          11.60        3.12        1.85         1280    Atypical         Chief cell         Capsular
                                                                                adenoma                             engagement
13          69       M          10.00        2.66        1.62         1400    Atypical         Mixed              Pleomorphism
                                                                                adenoma
14          54       F          13.50        3.19        1.85         245     Adenoma          Chief cell         Trabecular
15          38       F           7.00        2.81        1.58         248     Adenoma          Mixed              No
16          78       F           4.12        2.72        1.55         142     Adenoma          Chief cell         No
17          64       F           4.50        2.95        1.61         356     Adenoma          Oxyphilic          No
18          83       M           7.10        2.92        1.68         200     Adenoma          Chief cell         No
19          37       M           4.07        2.60        1.43         123     Adenoma          Chief cell         No
20          51       F          27.80        3.13        1.67         513     Adenoma          Chief cell         Trabecular
21          66       M           9.75        3.10        1.72         506     Adenoma          Chief cell         Fibrous bands

Age refers to age at diagnosis; M, male; F, female; –, not available; P-PTH, plasma parathyroid hormone. Reference values: glandular
weight 0.04–0.06 g; total plasma calcium 2.15–2.55 mmol/l; ionized serum calcium 1.15–1.33 mmol/l; serum-PTH 10–65 ng/l.

proliferation index. None of the tumors presented a                 from the normal rim of a parathyroid adenoma, while
diagnostic feature of parathyroid carcinoma, i.e. local             the other two (N2 and N3) were removed inadver-
invasion, lymph node, or distant metastasis. For the                tently during thyroid surgery. Paraffin-embedded
purpose of this study, routine histopathological reports            tumor tissue sections of LPTAs 3–21 were obtained
were reviewed, and routine slides were histopatholo-                for immunohistochemistry, together with anonymous
gically reexamined for LPTA cases 1–21 (Table 2).                   sections of nontumor colon tissue and colon cancer
                                                                    used as controls. In addition, 58 previously published
                                                                    (Forsberg et al. 2005, Haglund et al. 2010) DNA
Tissue samples                                                      samples from parathyroid adenomas were used for
All samples have been collected with oral informed                  qPCR of chromosome 5 loci. Adenomas with a known
consent from the patients and documented in the                     weight R4 g were not included.
patients’ medical files. Ethical approval was granted
from the local ethics committee. Fresh frozen
                                                                    DNA and RNA extraction
parathyroid tissue samples stored at K80 8C were
obtained from the tissue biobank at the Karolinska                  Total genomic DNA and total RNA were extracted
University Hospital. Representative sections from all               using DNeasy Blood and Tissue DNA isolation kit
tumor samples studied were examined microscopically                 (Qiagen AB) and mirVana miRNA Isolation Kit
by a histopathologist and shown to contain at least                 (Ambion, Life Technologies, Applied Biosystems),
70% tumor cells. Frozen tissue samples were obtained                respectively, following the manufacturer’s protocols.
from the 21 LPTA tumors and from three histopatho-                  DNA and the RNA samples were quantified and
logically confirmed nontumorous parathyroid tissues                 checked for quality using NanoDrop A100 (Thermo
(N1, N2, and N3) used as references for the gene                    Scientific, Waltham, MA, USA) and stored at K20 8C
expression study. One of these (N1) was obtained                    until use.
                                                                                            Downloaded from Bioscientifica.com at 07/28/2021 08:14:29AM
                                                                                                                                          via free access
392                                                                                                     www.endocrinology-journals.org
Endocrine-Related Cancer (2012) 19 389–407

Immunohistochemistry                                        Biosystems, Foster City, CA, USA) in ABI 3730
Protein expression of parafibromin, APC, and Ki-67          PRISM DNA Analyzer (Applied Biosystems)
was determined by immunohistochemistry on slides cut        following the protocol of the manufacturer, and the
at 4 mm thickness from paraffin-embedded blocks of          sequencing data were analyzed for mutations using
LPTAs 3–21 and controls using previously published          SeqScape version 2.5.0 (Applied Biosystems).
methodologies (Juhlin et al. 2006). The following
antibodies were used: APC rabbit monoclonal                 Array CGH and data analysis
(EP701Y, cat no. ab40778; Abcam, Cambridge, UK)
at a dilution of 1:100, parafibromin mouse monoclonal       Array CGH was performed for LPTA cases 1–21 using
(2H1, cat no. sc-33638; Santa Cruz Biotechnology, CA,       human BAC 38K arrays generated at the SCIBLU
USA) at a dilution of 1:20, and monoclonal MIB1             Genomics Centre at Lund University, Sweden (www.
(Ki67, clone MIB1; Dako, Hamburg, Germany,                  lu.se/sciblu). These arrays contain 38 000 BAC clones
M7240) at a dilution of 1:200. Stained slides were          (CHORI BACPAC resources; http://bacpac.chori.org/
scanned with a virtual slide scanner (NanoZoomer 2.0-       genomicRearray.php) arranged in a tiling fashion
HT, Hamamatsu, Japan) and viewed using NDP viewer           resulting in a final resolution of about 100–150 kb.
(NanoZoomer Digital Pathology). Exclusion of the            Laboratory procedures and data analyses were carried
primary antibody as well as staining of normal colon        out according to the previously established protocols
tissue were used as negative controls for all antibodies.   (www.lu.se/sciblu; Hashemi et al. 2011). Array CGH
Colon cancer tissue was used as positive control of         slides were scanned in an Axon Scanner 4000A (Axon
Ki-67 expression, as well as parathyroid tissues with       Instruments, Burlingame, CA, USA) and the GenePix
known parafibromin and APC expressions.                     Pro 6.0 software (Axon Instruments) was used for spot
   The result was evaluated by two or more                  identification and image analysis. The resulting data
of the authors. MIB1 index was determined from              were imported into the BioArray Software Environ-
Ki-67-stained slides using both automated scoring of        ment (BASE; http://base.thep.lu.se/) version 2 for
scanned slides and counting of more than 2000 cells         further analysis. CNAs were classified according to
from 5 or more randomly selected high power fields          log2 ratios applying the following thresholds: C0.25
(!40) in the same tumor. Parafibromin staining was          for gain, K0.25 for loss, K1 for homozygous loss, and
scored as positive according to the previous reports,       C1 for amplification. Recurrent aberrations were
total loss or partial loss of nuclear expression, and       defined as aberrations identified in four or more of
in addition, nucleolar expression was evaluated             the samples. Gross chromosomal changes were defined
(Juhlin et al. 2006, 2010). APC was scored as positive      as changes that involved an entire or almost entire
or negative as described in Juhlin et al. (2010).           chromosome. Minimal overlapping regions (MORs)
                                                            were defined as the smallest recurrent CNAs according
                                                            to the definition by Rouveirol et al. (2006). Array CGH
Mutational analysis
                                                            data for all the 21 cases have been submitted in NCBI’s
The coding exons 2–10 of the MEN1 gene and all the          Gene Expression Omnibus through GEO Series
1–17 exons of the HRPT2 gene were sequenced in              accession number GSE36511 (http://www.ncbi.nlm.
both directions in LPTAs 1–21 using previously              nih.gov/geo/quary/acc.cgi).
published primer sequences and experimental con-               Unsupervised hierarchical clustering was per-
ditions with some modifications (Villablanca et al.         formed using Pearson’s correlation distance matrix
2004, Juhlin et al. 2006). PCR was performed in             (R software v2.12.2). Briefly, this algorithm scans
25 ml reactions with 50 ng DNA, 1! PCR buffer,              through the entire array CGH dataset (sex chromosome
200 mM of each dNTPs, 2 mM MgSO4, 0.2 mM of                 clones were excluded), calculates all pair-wise dis-
each primers, and 1 unit TaqDNA polymerase                  tances (degree of similarity regarding the copy number
(Invitrogen Life Technologies). PCR cycling con-            changes), estimates the correlation efficiency for
ditions included 94 8C for 30 s as initial denaturation     each single clone spotted on the slide, and joins the
followed by 30 cycles (MEN1) or 35 cycles (HRPT2)           closest pair of samples. Then, it calculates the pair’s
of 30 s of denaturation at 95 8C, annealing for 30 s at     distance to all other samples in the same pair-wise
52–58 8C, and extension for 30 s at 72 8C. All PCR          approach to find the two other closest pairs. This
products were verified in 2% agarose gels, quantified,      process will be repeated until the distances for all the
and purified using ExoSAP-IT (USB-Affymetrix,               samples are calculated and based on that, samples will
Cleveland, OH, USA). Sequencing was done using              be reordered into a hierarchical structure represented
BigDye terminators v. 1.1 sequencing kit (Applied           by a dendrogram tree (Quackenbush 2006).
                                                                               Downloaded from Bioscientifica.com at 07/28/2021 08:14:29AM
                                                                                                                             via free access
www.endocrinology-journals.org                                                                                             393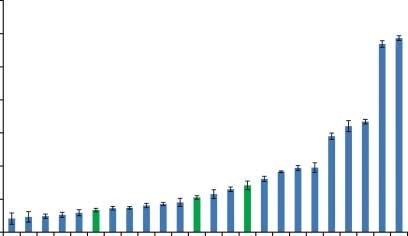
L Sulaiman et al.: DNA copy numbers in large parathyroid adenomas

Genomic quantitative real-time PCR (qPCR)                  Statistical analysis
LPTAs 1–21 as well as 58 additional parathyroid            All statistical calculations were performed using the
adenomas were analyzed by qPCR for copy number             SPSS software (Statistical Software Package for
detection at individual loci in regions of frequent        Windows, V.17; SPSS Inc., Chicago, IL, USA). The
losses or gains in chromosomes 1, 5, and 11. Two           nonparametric Mann–Whitney U test was used to
separate TaqMan Copy Number assays were used for           compare the demographic characteristics between
each of the loci RNF11 (Hs_cn 02893920 in intron           LPTAs and adenomas !4 g, while c2 test was used
1/exon 2 and Hs_cn 02226491 in exon 3), TERT               to investigate the differences in gender distribution.
(3078158 in exon 2 and 2818605 in exon 16), CARD6          Relationships between variables were assessed with
(3056294 in exon 1 and 888745 in exon 3), PIK3R1           Spearman’s rank correlation test. P values below 0.05
(2532703 in exon 6/intron 6 and 2558647 in exon 17),       were considered as statistically significant.
APC (02966112 in intron 3/exon 4), LMNB1
(1652643 in exon 1 and 2496887 in exon 11), and
MEN1 (02189358 in exon 1 and 00270415 in exon 3).          Results
Analyses were carried out according to the protocol        General characteristics for 590 PHPT cases operated
recommended by the manufacturer (Applied Biosys-           for a sporadic parathyroid adenoma during 2005–2009
tems). Samples were amplified in a 7500 FAST               at the Karolinska University Hospital, Stockholm,
machine (Applied Biosystems), using a 96-well              Sweden, are summarized in Table 1. In the entire
format and the cycling conditions: 95 8C for 10 min,       material, the median adenoma weight, total plasma
and 40 cycles of (95 8C for 15 s and 60 8C for 1 min).     calcium, and S-Ca2C levels were significantly higher
Each sample was amplified in triplicate in two             in male patients (0.60 vs 0.39 g; 2.81 vs 2.75, and 1.48
different experiments. Amplification data were ana-        vs 1.44 mmol/l, respectively, P!0.001). However, no
lyzed in the Sequence Detection Software SDS 2.2           statistically significant difference in age at diagnosis
(Applied Biosystems) followed by the CopyCaller            was observed. Thirty-one of the 590 cases (5%)
software V1.0 (Applied Biosystems) for prediction of       presented as LPTA weighing R4 g, while 559 cases
copy numbers. Data were normalized to RNaseP               (95%) had an adenoma weight !4 g (Supplementary
(Hs_cn 4403326), which was amplified in parallel,          Figure 1). Comparison of demographic variables
and calibrated to pooled normal DNA (Promega).             revealed a higher relative number of male cases
Negative controls constituted of amplifications with-      among LPTAs (11 males/20 females, 35%) compared
out sample DNA.                                            with tumors !4 g (121 males/438 females, 22%;
                                                           PZ0.037). Furthermore, preoperative levels of
                                                           calcium (both total plasma and S-Ca 2C) were
Quantitative reverse transcription PCR                     significantly higher for LPTA cases than adenomas
(qRT-PCR)                                                  !4 g (median 3.03 and 1.59 vs 2.80 and 1.47 mmol/l,
                                                           respectively, P!0.001; Table 1).
Expression of the CARD6 gene was quantified in
                                                              The 21 cases entered into the molecular character-
LPTAs 1–21 and the three reference parathyroids N1–3       ization also tended to include relatively more male
by qRT-PCR. In brief, 500 ng total RNA was reverse         cases (PZ0.075) and exhibited significantly higher
transcribed to cDNA using High-Capacity cDNA               S-Ca2Clevels (median 1.64 vs 1.47 mmol/l, P!0.001;
Reverse Transcription Kit (Applied Biosystems)             Tables 1 and 2). Eighteen of these had been classified
following the manufacturer’s instructions. qRT-PCR         as adenoma and three as atypical adenoma at the
was performed in triplicate applying standard amp-         original routine histopathological work-up. However,
lification conditions and a 96-well plate format in        review of all cases showed that some histopathological
a StepOnePlus real-time PCR machine (Applied               features associated with atypical adenoma were also
Biosystems). Normalization was done against the            present in six tumors classified as adenoma originally
housekeeping gene 36B4, which is known to be               (LPTAs 4, 10, 11, 14, 20, and 21, Table 2). These
ubiquitously expressed in parathyroid tissue (Forsberg     included trabecular growth pattern, pleomorphism, and
et al. 2005, Juhlin et al. 2006). Commercially available   fibrous bands. However, the limited extent of these
assays were used for CARD6 (Hs00261581_m1;                 features did not motivate a classification as atypical
Applied Biosystems) and 36B4 (Hs99999902_m1).              adenoma. In addition, automated and manual scoring
The expression of CARD6 was then quantified using          of Ki-67 immunoreactivity revealed low MIB1
the Delta–Delta Ct method (2KDDCt ).                       proliferation index of 0.1–1.5 and 0.1–0.6%,
                                                                                  Downloaded from Bioscientifica.com at 07/28/2021 08:14:29AM
                                                                                                                                via free access
394                                                                                           www.endocrinology-journals.org
Endocrine-Related Cancer (2012) 19 389–407
respectively, in all cases analyzed. The hypercalcemia Expression of parafibromin and APC
was normalized in all cases and no recurrences were Expression of the APC and parafibromin proteins was
detected at the follow-up. evaluated by immunohistochemistry in LPTAs 3–21
for which slides were available (Table 3). The findings
are illustrated in Fig. 1. Nine cases showed positive
Mutation screening of the MEN1 and HRPT2 parafibromin expression, while five cases (7, 12, 13,
genes 17, and 19) were negative and five cases (8, 10, 11, 14,
Detected mutations are illustrated in Supplementary and 16) had partial loss of nuclear staining. For APC,
Figures 2 and 3, see section on supplementary data 17/19 tumors were positive, while two tumors (cases
given at the end of this article and detailed in 13 and 14) were negative for both nuclear and
Table 3. Five MEN1 mutations were observed, which cytoplasmic immunoreactivity.
were all predicted to lead to the introduction of
a premature stop codon and shorter protein. In the Overall array CGH findings
HRPT2 gene, one missense mutation was revealed. In All 21 LPTAs investigated in this study exhibited
addition, intronic base substitutions were detected in CNAs including gains and losses. However, no
HRPT2 (c1067-85COT intron 12 of case 1, c729C homozygous deletions (!K1) or high-level gains
50delAG in intron 7 of case 19, and c1418-17COG (OC1) indicating amplifications were observed. First,
in intron 15 of case 8). we investigated CNAs at the genomic loci of genes
Table 3 Results from immunohistochemistry, mutation screening, and array CGH in LPTAs 1–21
Mutation screeninga Total change by array CGH (Mb)
Case IHC IHC CNA at CNA at Predicted
no. parafibromin APC MEN1 HRPT2 MEN1 HRPT2 protein effect Losses Gains Total
1 – – No No Wt Wt – 187.6 100.2 287.8
2 – – No Loss c.1715del6b Wt Stop codon at 798.5 308.6 1107.1
nt 1825
3 Pos Pos No No Wt Wt – 0.0 45.8 45.8
4 Pos Pos No No Wt c214COT p.Pro71Ser 10.4 1.0 11.4
5 Pos Pos Loss No c.1125del4 Wt Stop codon at 165.0 46.4 211.4
nt 1327
6 Pos Pos No No Wt Wt – 144.9 16.8 161.7
7 Total loss Pos No No Wt Wt – 1.9 0.3 2.2
8 Partial loss Pos No No Wt Wt – 3.8 14.1 17.9
9 Pos Pos No No Wt Wt – 127.7 78.7 206.4
10 Partial loss Pos Loss No Wt Wt – 171.4 2.8 174.2
11 Partial loss Pos Loss No Wt Wt – 267.8 445.9 713.7
12 Total loss Pos No No Wt Wt – 4.2 614.1 618.3
13 Total loss Neg No No Wt Wt – 49.8 785.4 835.2
14 Partial loss Neg No No Wt Wt – 19.9 3.6 23.4
15 Pos Pos No No Wt Wt – 38.0 6.3 44.3
16 Partial loss Pos No No Wt Wt – 207.9 508.4 716.3
17 Total loss Pos Loss Loss c.113del11 Wt Stop codon at 526.1 389.8 915.9
nt 334
18 Pos Pos No No c.398insT Wt Stop codon at 123.7 3.0 126.7
nt 537
19 Total loss Pos No No c.207del14 Wt Stop codon at 1.8 1.5 3.2
nt 333
20 Pos Pos Loss No Wt Wt – 176.2 2.3 178.5
21 Pos Pos No No Wt Wt – 210.9 175.6 386.5
Total 3237.4 3550.4 6787.8
IHC, immunohistochemistry; APC, adenomatous polyposis coli; Pos, positive; Neg, negative; Wt, wild type; CNA, copy number
aberration.
a
Numbering was according to ensemble for the MEN1 (ENST00000312049) and HRPT2 (ENST00000367435) genes.
b
The mutation has been previously reported in Juhlin et al. (2006).
Downloaded from Bioscientifica.com at 07/28/2021 08:14:29AM
via free access
www.endocrinology-journals.org 395L Sulaiman et al.: DNA copy numbers in large parathyroid adenomas
A B
C D
E F
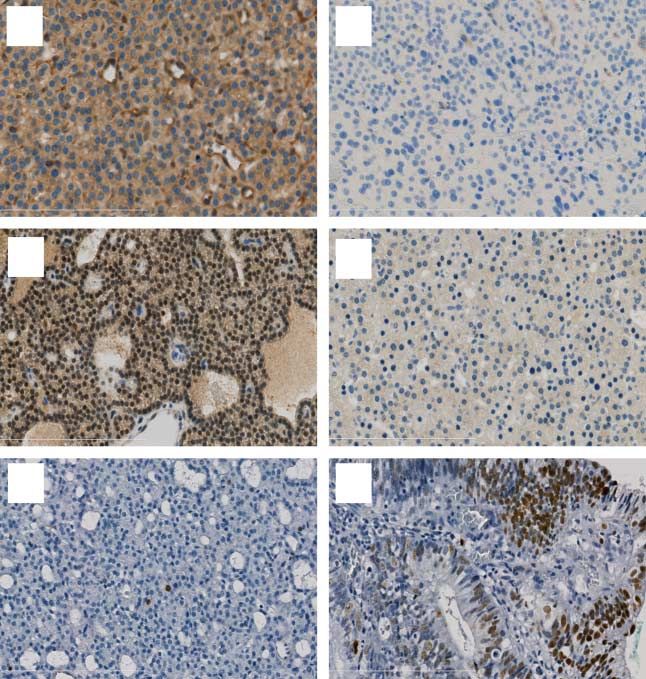
Figure 1 Photomicrographs showing examples of immunohistochemistry analysis of LPTAs. Positive (A) and negative (B)
cytoplasmic immunoreactivity in parathyroid adenomas for APC. Positive (C) and negative (D) staining of parathyroid adenomas for
nuclear parafibromin. MIB1 proliferation index determined by Ki-67 immunostaining of a parathyroid adenoma (E) and a colon cancer
(F) used as positive control. All images are shown at !40 power.
known to be implicated in parathyroid tumors detected in a single tumor ranged from about 2.2 Mb
including MEN1, HRPT2, CASR, APC, CCND1, and (case 7) to 1107.1 Mb (case 2) with a median of
RB1. The MEN1 locus at 11q13 was deleted in 19% of 178.5 Mb (Table 3).
the cases, the HRPT2 locus at 1q31.2 in 9%, and the
CCND1 locus at 11q13.3 in 14%. The CASR locus at 1 3 5 7 9 11 13 15 17 19 21 23
100
3q21 showed normal array CGH profiles in all cases.
Percent gained or lost
75
The APC locus at 5q22.2 was gained in 22.2% of the 50
cases and the RB1 locus in 13q14.2 was gained in 5% 25
0
and lost in 14% of LPTAs (Table 3). –25
We subsequently investigated CNAs in the entire –50
–75
genome which revealed that all chromosomes were –100
involved and changes restricted to a small part of the 2 4 6 8 10 12 14 16 18 2022 24
chromosome were more common than gross chromo- Chromosomes
somal aberrations involving an entire or almost entire
Figure 2 Overview of copy number alterations detected by
chromosome (Fig. 2). Recurrent losses were detected array CGH in 21 cases of LPTA. The whole-genome frequency
on 1p, 7q, 11, 15q, and 21q, and gains were observed plot shows the proportion (in %) of gains (green) and losses
on 3q, 5, 7p, 8p, 16q, 17p, and 19q with the longest (red) detected in each individual chromosome from pter (left) to
qter (right). Individual chromosomes are shown in numbering
combined interval CNAs detected on chromosomes 1, order from 1 (left) to 22 (right). Sex chromosomes (23 and 24)
5, and 11 (Fig. 2). The total amplitude of CNAs were not included in the analyses.
Downloaded from Bioscientifica.com at 07/28/2021 08:14:29AM
via free access
396 www.endocrinology-journals.orgEndocrine-Related Cancer (2012) 19 389–407
Table 4 Most common recurrent MORs detected by array CGH in 21 LPTA cases
Position Size No. of Frequency Selected
Cytoband Start clone End clone (Mb) (Mb) clones % for qPCR
Losses
1p36.31–p35.3 CTD-2280K14 RP13-485J14 6.1–28.7 22.60 281 29
1p35.2–p35.1 RP11-51C12 RP11-125D21 30.8–34.1 3.16 36 29
1p32.3 RP11-183G22 RP11-12C19 50.4–55.2 4.71 53 29 RNF11
7q11.22–q11.23 RP11-746H3 RP11-379D10 71.1–75.3 4.31 73 19
9p21.3–p13.3 RP11-560J9 RP11-475O13 32.9–34.4 1.43 15 19
11p15.5–p11.2 RP11-371C18 RP11-56E13 1.3–48.1 46.80 666 24
11q13.1–q13.2 RP11-472L10 RP11-259D17 63.3–68.2 4.88 55 19 MEN1
11q14.1–q14.2 RP11-726H9 RP11-317J19 85.1–86.1 1.00 10 33
11q22.1–q24.3 RP11-463H5 CTD-2120F5 99.8–130.2 30.40 363 29
15q11.1–q11.2 RP11-207G6 RP11-59F20 18.2–20.3 2.01 39 28
15q15.1–q21.1 RP11-451G20 RP11-226C3 38.5–42.9 4.32 58 19
Gains
3q22.3–q26.33 RP11-809A16 RP11-139K3 140.1–183.8 43.70 542 19
3q27.1 RP11-778D9 RP11-328G15 185.1–186.0 0.63 11 24
5p13.1 RP11-94C22 RP11-19F12 40.8–41.4 0.62 6 29 CARD6
5q12.3–q13.1 RP11-475K24 RP11-417A16 65.9–68.3 2.50 48 29 PIK3R1
5q23.2 RP11-772E11 RP11-368F9 125.9–126.1 0.20 4 33 LMNB1
7p14.1 RP11-556H1 RP11-170L15 37.6–38.1 0.51 4 19
8p23.1 RP11-231L4 RP11-672P7 6.8–7.7 0.87 9 23
16q24.2–24.3 RP11-483N11 RP11-180K1 86.7–87.9 0.13 9 19
17p13.1 RP11-558E15 RP13-696M16 6.9–8.0 1.02 16 23
19q13.2–q13.31 RP11-108I20 RP11-427D11 47.1–48.3 1.14 17 19 DEDD2
Mb, mega base pairs; MOR, minimal overlapping region.
Subchromosomal alterations defined at 5p13.1 (0.6 Mb) and the other two MORs
In order to identify chromosomal regions that may at 5q23.2 (0.2 Mb) and 5q12.1–13.1 (2.5 Mb). The
harbor genes involved in the tumorigenesis of LPTAs, MOR located at 5q23.2 was gained in 7/8 cases with
gain of chromosome 5 and overlapped few genes most
we compared CNA patterns between tumors and
importantly LMNB1, while the other MOR of gain
estimated MORs. MORs that largely or completely
identified at 5q12.1–13.1 was observed in six LPTAs
overlapped with known normal copy number poly-
(29%) and overlapped several genes among others,
morphisms according to the Database of Genomic
PIK3R1.
Variants (http://projects.tcag.ca/variation/) were
Chromosome 11 displayed copy number losses in
excluded. In addition, we identified 11 MORs of loss
seven of the LPTAs (33%) involving the q-arm in all
and ten MORs of gain that were supported by recurrent
the seven cases and the p-arm in five cases (Fig. 5).
CNAs in four or more LPTAs (Table 4).
Gains of chromosome 11 were detected infrequently.
Copy number losses involving the short arm of
Four MORs of losses were identified. The MOR in
chromosome 1 was a frequent finding and detected in
11p15.5–p11.2 including almost the entire p-arm was
six cases (29%; Fig. 3). However, loss of 1q was
deleted in 5/7 cases with the loss of chromosome 11.
infrequent and chromosome 1 rarely showed any gains.
The three MORs of losses in 11q were defined at
Three MORs of loss were identified on the short arm of
11q13.1–2 (4.9 Mb), 11q14.1–2 (1.0 Mb), and
chromosome 1. A 3.2 Mb region in 1p35.1–2, a 4.7 Mb
11q22.1–24.3 (30.4 Mb; Table 4). The 11q14.1–2
interval in 1p32.3, and a 22.6 Mb region in 1p36.31–
interval including PICALM was involved in 7/7 cases
35.3 were each involved in 6/6 cases with loss in 1p
with 11q loss, while the 11q13.1–2 region that
(Fig. 3). The 1p32.3 region harbors several genes, such encompasses the MEN1 gene was deleted in four cases.
as the tumor suppressor genes CDKN2C (P18) and
RNF11.
Chromosome 5 displayed gains in eight LPTAs Large-scale chromosomal alterations
(38%), which in six cases encompassed almost the CNAs corresponding to large-scale chromosomal
entire chromosome (Fig. 4). Three MORs of gains changes were noted in a subset of the 21 LPTAs
were detected in chromosome 5. One MOR was screened with array CGH and revealed as losses or
Downloaded from Bioscientifica.com at 07/28/2021 08:14:29AM
via free access
www.endocrinology-journals.org 397L Sulaiman et al.: DNA copy numbers in large parathyroid adenomas
RNF11
(1p32.3)
p31.1 1q12 q41 43 44
1
6
2
17
21
16
0 24.55 49.1 73.66 98.21 122.76 147.31 171.87 196.42 220.97 245.52
2
1.5
1
Log2 (ratio)
0.5
0.25
0
–0.25
–0.5
–1
–1.5
–2
p36.33
p36.31
p36.22
p36.13
p36.11
p35.2
p34.3
p34.1
p32.3
p32.1
p31.2
p22.3
p22.1
p21.2
p13.3
p13.1
p11.2
q11
q21.1
q21.3
q23.1
q23.3
q24.2
q25.1
q25.3
q31.2
q32.1
q32.3
q42.11
q42.13
q42.3
q44
0 24.55 49.1 73.66 98.21 122.76 147.31 171.87 196.42 220.97 245.52
3
2.5
2
Log2 (ratio)
1.5
1
0.5
0.25
0
–0.25
–0.5
–1
–1.5
–2
–2.5
–3
p36.33
p36.31
p36.22
p36.13
p36.11
p35.2
p34.3
p34.1
p32.3
p32.1
p31.2
p22.3
p22.1
p21.2
p13.3
p13.1
p11.2
q11
q21.1
q21.3
q23.1
q23.3
q24.2
q25.1
q25.3
q31.2
q32.1
q32.3
q42.11
q42.13
q42.3
q44
0 24.55 49.1 73.66 98.21 122.76 147.31 171.87 196.42 220.97 245.52
2
1.5
1
Log2 (ratio)
0.5
0.25
0
–0.25
–0.5
–1
–1.5
–2
p36.33
p36.31
p36.22
p36.13
p36.11
p35.2
p34.3
p34.1
p32.3
p32.1
p31.2
p22.3
p22.1
p21.2
p13.3
p13.1
p11.2
q11
q21.1
q21.3
q23.1
q23.3
q24.2
q25.1
q25.3
q31.2
q32.1
q32.3
q42.11
q42.13
q42.3
q44
Figure 3 Mapping of copy number losses by array CGH in chromosome 1. At the top is shown an ideogram of chromosome 1 with the
location of the qPCR assay RNF11 used for verification indicated by arrow. Each horizontal bar represents one tumor with a detected
loss in chromosome 1 indicated in red. Corresponding array CGH profiles of chromosome 1 are shown below for LPTA cases 6 (top),
21 (middle), and 16 (bottom).
gains that involved an entire or almost entire nine tumors, no large-scale changes were detected.
chromosome. A total of 53 such large-scale changes The most common large-scale aberrations were
were detected in 12 cases, ranging from 1 to 10 gain of chromosome 5 (29%), 3 (19%), 7 (14%),
aberrations per tumor. By contrast, in the remaining and 8 (14%) and loss of chromosome 11 (24%),
Downloaded from Bioscientifica.com at 07/28/2021 08:14:29AM
via free access
398 www.endocrinology-journals.orgEndocrine-Related Cancer (2012) 19 389–407
TERT CARD6 PIK3R1 APC LMNB1
(5p15.33) (5p13.1) (5p13.1) (5p22.2) (5p23.2)
21
2
16
13
11
12
9
20
0 18.09 36.17 54.26 72.34 90.43 108.51 126.6 144.69 162.77 180.86
2.0
1.5
1.0
Log2 (ratio)
0.5
0.25
0
–0.25
–0.50
–1.00
–1.50
–2.00
p15.33
p15.31
p15.1
p14.2
p13.3
p13.1
p11
q11.2
q12.2
q13.1
q13.3
q14.2
q15
q21.2
q22.1
q22.3
q23.2
q31.1
q31.3
q33.1
q33.3
q35.1
q35.3
0 18.09 36.17 54.26 72.34 90.43 108.51 126.6 144.69 162.77 180.86
2.0
1.5
1.0
Log2 (ratio)
0.5
0.25
0
–0.25
–0.50
–1.00
–1.50
–2.00
p15.33
p15.31
p15.1
p14.2
p13.3
p13.1
p11
q11.2
q12.2
q13.1
q13.3
q14.2
q15
q21.2
q22.1
q22.3
q23.2
q31.1
q31.3
q33.1
q33.3
q35.1
q35.3
0 18.09 36.17 54.26 72.34 90.43 108.51 126.6 144.69 162.77 180.86
2.0
1.5
1.0
Log2 (ratio)
0.5
0.25
0
–0.25
–0.50
–1.00
–1.50
–2.00
p15.33
p15.31
p15.1
p14.2
p13.3
p13.1
p11
q11.2
q12.2
q13.1
q13.3
q14.2
q15
q21.2
q22.1
q22.3
q23.2
q31.1
q31.3
q33.1
q33.3
q35.1
q35.3
Figure 4 Mapping of copy number gains by array CGH in chromosome 5. An ideogram of chromosome 5 is shown together with the
location of qPCR assays (arrows) above and horizontal bars representing tumors with detected gain (green) below. Individual array
CGH profiles are shown for LPTA cases 16, 12, and 9.
21 (24%), 13 (14%), and 15 (14%; Fig. 6A). chromosome 5. Ten tumors showed losses which
Chromosomes 2, 14, and 16 did not display any in five cases involved chromosomes 11, but only
large-scale aberrations. Seven tumors showed one or one of these tumors overlapped with gain of
more such gains which in 6/7 cases included chromosome 5 (case 11).
Downloaded from Bioscientifica.com at 07/28/2021 08:14:29AM
via free access
www.endocrinology-journals.org 399L Sulaiman et al.: DNA copy numbers in large parathyroid adenomas
MEN1
(11q13.1)
p15.4 p13 p12 q14.1 21 22.3 23.3 25
10
11
17
9
5
20
4
0 13.45 26.89 40.34 53.78 67.23 80.67 94.12 107.56 121.01 134.45
2.0
1.5
1.0
Log2 (ratio)
0.5
0.25
0
–0.25
–0.50
–1.00
–1.50
–2.00
p15.5
p15.3
p15.1
p14.2
p13
p11.2
p11.11
q12.1
q12.3
q13.2
q13.4
q14.1
q14.3
q22.1
q22.3
q23.2
q24.1
q24.3
0 13.45 26.89 40.34 53.78 67.23 80.67 94.12 107.56 121.01 134.45
2.0
1.5
1.0
Log2 (ratio)
0.5
0.25
0
–0.25
–0.50
–1.00
–1.50
–2.00
p15.5
p15.3
p15.1
p14.2
p13
p11.2
p11.11
q12.1
q12.3
q13.2
q13.4
q14.1
q14.3
q22.1
q22.3
q23.2
q24.1
q24.3
0 13.45 26.89 40.34 53.78 67.23 80.67 94.12 107.56 121.01 134.45
2.0
1.5
1.0
Log2 (ratio)
0.5
0.25
0
–0.25
–0.50
–1.00
–1.50
–2.00
p15.5
p15.3
p15.1
p14.2
p13
p11.2
p11.11
q12.1
q12.3
q13.2
q13.4
q14.1
q14.3
q22.1
q22.3
q23.2
q24.1
q24.3
Figure 5 Mapping of copy number losses by array CGH in chromosome 11. Horizontal bars represent seven LPTAs with
chromosome 11 loss (red). The location of the MEN1 qPCR assay is indicated by arrow and individual profiles are shown for cases 9,
20, and 4.
Clustering and comparison of CNAs with clinical While only one case (case 11) from Cluster 2 had gross
parameters chromosome 11 loss, all the six cases with entire
Unsupervised hierarchical clustering for all array CGH chromosome 5 gain fell into this cluster.
data resulted in two main clusters (Fig. 6B). Cluster 1 The detected CNAs were compared with clinical
included six cases that were exclusively females. Four characteristics for the 21 LPTA cases concerning
of the six cases in Cluster 1 showed gross chromo- amplitude of changes, cluster groups, subchromosomal
some 11 loss without gross chromosome 5 gain. changes, and large-scale aberrations. A statistically
Cluster 2 included 15 cases of which eight were male. significant positive correlation between PTH levels and
Downloaded from Bioscientifica.com at 07/28/2021 08:14:29AM
via free access
400 www.endocrinology-journals.orgEndocrine-Related Cancer (2012) 19 389–407
A confirmed in 4/6 (67%) cases with 1p32.3 loss. To
17
10
16
12
13
18
21
20
11
19
15
14
validate the loss of 11q, we selected only a well-known
1
6
9
5
3
8
2
4
7
Losses
1 gene, MEN1, located in the 4.8 Mb MOR of loss in
4 11q13.1–2. Correlation between CNAs detected by
5 array CGH and qPCR was revealed in 4/4 (100%) cases
9
10
with loss at this specific locus. For chromosome 5, we
11 selected five gene loci including TERT and CARD6 on
12 the p-arm and PIK3R1, APC, and LMNB1 on the q-arm
13 (Table 5). The gains observed by array CGH were also
15 demonstrated by qPCR in 4/6 (67%) cases for TERT, 3/
17
21
6 (50%) for CARD6, 5/6 (83%) for PIK3R1, 5/6 (83%)
22 for APC, and 4/7 (57%) for LMNB1.
Gains We also selected chromosome 5 for further analysis
3 in an extended series of parathyroid adenoma cases.
4 This was based on the finding of chromosome 5 gain as
5 the most common aberration detected in this group of
6
7
LPTA tumors and which has not been previously
8 reported as a frequent alteration in parathyroid
13 adenomas (Palanisamy et al. 1998, Garcia et al.
18 2002). Out of 58 cases, only four cases showed copy
19 number gains for at least one chromosome 5 assay
20
(Table 5).
22
B
CARD6 gene expression
Cluster 1 Cluster 2
–0.1777802 Given the frequent gain of chromosome 5, expression
0.41110986 of the CARD6 gene was quantified in LPTAs 1–21
using qRT-PCR. Five LPTAs (cases 3, 4, 18, 20, and
1.0
21) displayed more than twofold increased expression
1
6
17
9
5
10
3
8
16
12
2
13
18
21
20
11
19
4
7
15
14
M
M
M
M
M
M
M
M
compared with the reference parathyroid tissues
F
F
F
F
F
F
F
F
F
F
F
F
F
(Fig. 7).
Figure 6 Distribution of copy number alterations by array CGH
in the 21 LPTAs. (A) Graphical representation of large-scale
alterations that involve the entire or almost the entire
chromosome. Each colored block represents one chromosomal Discussion
alteration in one tumor with gains marked in green and losses in
red. Case numbers are indicated at the top and chromosome The clinical entity of LPTA has not been well defined,
numbers to the left. (B) Unsupervised clustering of LPTAs 1–21 and in previous studies, different cutoff points for
based on all array CGH data using Pearson correlation matrix
distance. Information of male (M) or female (F) gender is glandular sizes have been applied to define abnormally
indicated next to the case numbers. LPTAs (Lalanne-Mistrih et al. 2002, Rosen et al.
2005). The smallest cutoff used in a recently published
total amplitude of copy number gains was observed
paper was 2 g (O’Neal et al. 2011). In our study, we
(rZ0.48, PZ0.031; Supplementary Figure 4, see
defined 4 g as the cutoff based on the distribution of
section on supplementary data given at the end of
glandular weights for parathyroid adenomas operated
this article). No statistically significant differences in
in our institution during the period 2005–2009. This
biochemical or histopathological characteristics were
group of cases, representing the 5% largest PHPT
observed between the cases in Clusters 1 and 2.
adenomas, exhibited significantly increased calcium
levels and a relatively higher male to female ratio.
Validation by qPCR
These observations are well in agreement with the
qPCR-based copy number assays were used to validate previous studies on large-sized PHPT adenomas
selected regions identified as recurrently lost or gained (Takeichi et al. 1983, Lalanne-Mistrih et al. 2002,
by array CGH in the set of 21 LPTAs (Table 5). For the Chiofalo et al. 2005, O’Neal et al. 2011).
4.7 Mb MOR of loss in 1p32.3, we selected the RNF11 As part of the genetic characterization of LPTAs, we
gene for validation. Loss of RNF11 showed a high screened the MEN1 and HRPT2 genes for mutations
concordance with array CGH findings and could be as these are known to be frequently mutated in
Downloaded from Bioscientifica.com at 07/28/2021 08:14:29AM
via free access
www.endocrinology-journals.org 401L Sulaiman et al.: DNA copy numbers in large parathyroid adenomas
Table 5 Details and results for qPCR analyses
Location Alteration detected
Gene locus Mb Cytoband Type LPTA cases 1–21 Adenomas (nZ58)
Chromosome 1
RNF11 51.7 1p32.3 Loss 7/21 cases (33%) ND
Chromosome 5
TERT 1.2 5p15.33 Gain 5/21 cases (24%) ND
CARD6 40.8 5p13.1 Gain 4/21 cases (19%) 0/58 cases (0%)
PIK3R1 67.5 5q13.1 Gain 11/21 cases (52%) 2/58 cases (3%)
APC 112.0 5q22.2 Gain 6/21 cases (29%) 2/58 cases (3%)
LMNB1 126.1 5q23.2 Gain 4/21 cases (19%) 0/58 cases (0%)
Chromosome 11
MEN1 64.6 11q13.1 Loss 6/21 cases (29%) ND
Reference gene
RNaseP 19.9 14q11.2
Reported alterations were observed by one or both assays used for each gene. ND, not determined.
parathyroid tumors (Heppner et al. 1997, Farnebo et al. chromosomes 1, 5, and 11. Among these, gain of
1998). This revealed five cases with an MEN1 mutation chromosome 5 was the most common and unique
predicted to give a truncated menin protein and one alteration detected in 38% of the 21 LPTAs analyzed.
case with a missense HRPT2 mutation in agreement The array CGH profiles detected confirmed several
with the previous reports of frequent MEN1 mutations findings from the previous reports of chromosomal
and rare HRPT2 mutations in parathyroid adenomas imbalances by LOH or metaphase CGH and in addition
(Carpten et al. 2002, Howell et al. 2003, Krebs et al. identified chromosome 5 gain as a recurrent aberration
2005, Bradley et al. 2006, Juhlin et al. 2006). None of in the LPTA entity. Aberrations restricted to small
the patients for which a MEN1 or HRPT2 mutation was chromosomal regions were also frequently observed,
detected presented clinical indications or a family which may be attributed to the increased resolution
history indicating a familial form of the disease, which of array CGH compared with LOH and metaphase
would suggest that the mutations are somatic. CGH. While the only published array CGH analysis
However, as constitutional DNA was not sequenced, of parathyroid tumors has focused on chromosome 11
the presence of constitutive mutations cannot be (Yi et al. 2008), comparison to published array CGH
determined. Hence, the potential risk of heritable data for other chromosomes cannot be readily performed.
disease should be considered, especially in the HRPT2
Interestingly, gain of chromosome 5 was observed
mutated case for which unexpected mutation carriers
as the most frequent (38%) aberration and commonly
are known to occur. Two MEN1 mutated cases (cases
involved the entire or large parts of the chromosome.
5 and 17) exhibited CNA at the MEN1 locus by qPCR
By contrast, this aberration has not been reported in
(Table 3) and/or array CGH (Fig. 5) together with
high frequency in previous studies of regular para-
presence of sequencing traces for the wild-type allele
thyroid adenomas. For example, studies based on
(Supplementary Figure 2). The wild-type sequencing
trace could result from one or more factors such as
7
contaminating normal tissue, variable amplification
efficiency of the different alleles, subclonal copy 6
Relative mRNA expression
number loss in the tumor cells, or the tumors are 5
hyperdiploid so that a copy number loss still leaves
4
more than one allele in some or all tumor cells.
Using array CGH, we demonstrate recurrent CNAs 3
corresponding to gross chromosomal and/or subchro- 2
mosomal alterations in sporadic LPTAs. This approach
1
is widely used to identify net CNAs targeting cancer-
related genes but does not identify copy number neutral 0
2 12 13 15 9 N3 10 16 19 6 1 N1 11 14 N2 5 7 17 8 3 21 20 18 4
alterations that could be approached by screening for
LOH using, e.g. SNP arrays. In our study, CNAs were Figure 7 mRNA expression of the CARD6 gene in LPTAs 1–21
detected in all cases with frequent involvement of and reference parathyroids (N1–3).
Downloaded from Bioscientifica.com at 07/28/2021 08:14:29AM
via free access
402 www.endocrinology-journals.orgEndocrine-Related Cancer (2012) 19 389–407
metaphase CGH analysis have reported gain of in 1p, of which CDKN2C (P18) has been screened for
chromosome 5 in !14% of parathyroid adenomas point mutations with negative results (Tahara et al.
(Palanisamy et al. 1998, Garcia et al. 2002). However, 1997). The failure to detect frequently mutated target
in parathyroid carcinomas, this abnormality was genes in 1p in parathyroid adenoma and other cancers
revealed in varying frequencies from !10% (Agarwal may suggest the involvement of multiple target genes
et al. 1998, Kytölä et al. 2000). The frequent and/or possibly other inactivating mechanisms such
occurrence of chromosome 5 gain in LPTAs compared as chromosomal rearrangements or inactivation by
with PHPT adenomas is unlikely to result from epigenetic mechanisms.
different resolutions of the applied techniques but The LPTAs demonstrated frequent loss in chromo-
may rather be regarded as a nonrandom chromosomal some 11, with preferential involvement of the long
change characteristic of LPTAs or subsets among arm, comparable to the previously published findings
LPTAs. Copy number gains of chromosome 5 have in parathyroid adenomas based on the metaphase
also been associated with several other tumors such as CGH, array CGH, and LOH analyses (Friedman
low-grade renal cell carcinoma (Reutzel et al. 2001), et al. 1992, Cryns et al. 1995, Agarwal et al. 1998,
adrenocortical tumors (Kjellman et al. 1996), as well as Palanisamy et al. 1998, Farnebo et al. 1999, Dwight
bronchial and gastrointestinal carcinoids (Voortman et al. 2000, Correa et al. 2002, Yi et al. 2008).
et al. 2010). Although the target gene(s) for chromo- Interestingly, LOH studies on parathyroid adenomas
some 5 gain are presently unknown, several genes with have demonstrated larger parathyroid adenoma
known or potential involvement in human cancer are weights in cases with 11q LOH (Friedman et al.
located on this chromosome. For example, the MOR at 1992, Välimäki et al. 2002). The MEN1 gene is known
5q23.2 that was gained in 33% of cases included the to be mutated in the majority of parathyroid adenomas
LMNB1 gene encoding the lamin B1 protein expressed with loss within the 11q13 region. In the LPTAs,
in tumors and plasma from hepatocellular carcinoma the MEN1 locus was lost in the majority of cases with
patients (Sun et al. 2010). Furthermore, the MOR at 11q loss; however, loss was more frequently observed
5p13.1 includes the CARD6 gene, which has been within distal chromosome 11 at 11q14 and 11q22.1–
found overexpressed on the protein level in other q24.3 (Fig. 5). Similar observations suggesting an
cancers such as esophageal, gastric, and colorectal additional locus on chromosome 11 outside the MEN1
cancers (Kim et al. 2010). CARD6 plays an important gene were reported using array CGH in parathyroid
role in the activation of NF-kB signaling, involved in adenomas (Yi et al. 2008).
proliferation, differentiation, and apoptosis (Aggarwal Based on the similarity in glandular size between
2004) and deregulated in many tumor types including LPTAs and parathyroid carcinomas, it has been
parathyroid tumors (Corbetta et al. 2005). The present speculated whether large parathyroid tumors could
observations of CARD6 overexpression as well as copy also be associated with a malignant potential (Hundahl
number gains suggest that evaluation of the protein et al. 1999). None of the LPTAs studied exhibited
expression could be valuable to further study the histopathological features of parathyroid cancer and,
possible involvement of this gene in parathyroid although the follow-up time is limited, no recurrences
tumors. have been detected at the follow-up. To further
Copy number loss in the short arm of chromosome 1 approach this question, we determined MIB1 prolifer-
was recurrently observed in the LPTAs studied (29%) ation index as well as expression of the parafibromin
in agreement with most previous CGH and LOH and APC proteins, each of which have been associated
studies of parathyroid adenomas (Cryns et al. 1995, with parathyroid malignancy. The proliferation index
Agarwal et al. 1998, Farnebo et al. 1999). Similar to was found to be low, below 1.5%, in all LPTAs
observations in regular adenomas, losses in 1p mainly studied. This observation would suggest a benign
affected the distal part, in contrast to parathyroid behavior of the LPTAs based on the previous reports
carcinomas where deletions cluster in the central part of low MIB1 index in parathyroid adenomas compared
of 1p (Kytölä et al. 2000, Välimäki et al. 2002). Loss in with carcinomas (Lloyd et al. 1995). Total or partial
the short arm of chromosome 1 has been reported for loss of parafibromin reactivity was observed in ten
many different cancer types, among others by LOH in tumors, two of which also showed loss of APC
the neuroendocrine tumors such as phaeochromocy- immunoreactivity. However, this was not accompanied
toma and medullary thyroid carcinoma (Mathew et al. by HRPT2 mutations, supporting the previous reports
1987, Khosla et al. 1991) as well as neuroblastoma that loss of parafibromin immunoreactivity does not
(Fong et al. 1989). The genes LCK, EPS15, RNF11, necessarily reflect an HRPT2 mutation (Gill et al.
and CDKN2C (P18) are potential candidates located 2006, Zhang et al. 2006, Juhlin et al. 2007, 2010).
Downloaded from Bioscientifica.com at 07/28/2021 08:14:29AM
via free access
www.endocrinology-journals.org 403L Sulaiman et al.: DNA copy numbers in large parathyroid adenomas
Out of the three cases with an established diagnosis of Declaration of interest
atypical adenoma, two were available for IHC analyses The authors declare that there is no conflict of interest that
(cases 12 and 13). Both these cases exhibited total could be perceived as prejudicing the impartiality of the
loss of parafibromin expression, and in case 13, this research reported.
feature was accompanied by loss of APC expression.
These findings are fully in line with the previous
Funding
reports regarding atypical adenomas and parafibromin
and APC immunoreactivity (Juhlin et al. 2010). As loss The study was financially supported by Swedish Cancer
of APC and parafibromin expression are associated Society, Swedish Research Council (No. 5210-2010-3518),
with parathyroid carcinoma and atypical adenoma Gustav V Jubilee Foundation, Karolinska Institutet and
Stockholm County Council. L Sulaiman is supported by
(Juhlin et al. 2007, 2010), our observations suggest
a research stipend donated from Mr Ahmad Ismail Nanakaly.
that a subset of LPTAs share molecular characteristics
with these entities.
Comparison of the genomic profiles, MEN1 and Author contribution statement
HRPT2 mutations, and APC and parafibromin L Sulaiman, I-L Nilsson, C C Juhlin, C Larsson, and
expression of LPTAs in this study with published J Hashemi conceived and designed the study; L Sulaiman
studies of regular parathyroid adenomas and parathy- performed the experiments. I-L Nilsson, F Haglund,
roid carcinomas suggest the presence of overlapping C C Juhlin, A Höög, and C Larsson contributed to the
as well as distinguishing features. Hence, LPTAs tumor and patient characterization. All authors contributed to
were similar to adenomas concerning frequent MEN1 the interpretation of results and have revised and approved
mutations, infrequent HRTP2 mutations, and losses of the final version of the manuscript.
distal 1p and 11, and more like carcinomas concerning
loss of APC and parafibromin expression and loss Acknowledgements
of chromosome 13. However, gain of chromosome 5 The authors wish to thank Ms Lisa Ånfalk for excellent
was common between LPTA and carcinoma. Taken assistance with tissue sample collection and the medical
together, these observations suggest that LPTAs genetics group at our department for their valuable
exhibit partly overlapping and partly distinguishing comments.
genomic features compared with adenomas and
carcinomas.
The 21 LPTAs fell into two main clusters based References
on the array CGH data, which in large corresponded Agarwal SK, Schrock E, Kester MB, Burns AL, Heffess CS,
to the presence/absence of large-scale chromosomal Ried T & Marx SJ 1998 Comparative genomic
aberrations. This observation may suggest that gain hybridization analysis of human parathyroid tumors.
of chromosome 5 reflect a genetic pathway for a Cancer Genetics and Cytogenetics 106 30–36.
subset of LPTAs that is independent of chromosome (doi:10.1016/S0165-4608(98)00049-1)
Agarwal G, Prasad KK, Kar DK, Krishnani N, Pandey R &
11 loss. It can also be noted that all male cases fell
Mishra SK 2006 Indian primary hyperparathyroidism
into Cluster 2 characterized by chromosome 5 gain.
patients with parathyroid carcinoma do not differ in
Interestingly, a positive correlation was also observed clinicoinvestigative characteristics from those with
between PTH level and total amplitude of copy benign parathyroid pathology. World Journal of Surgery
number gain. However, gender-related differences 30 732–742. (doi:10.1007/s00268-005-0366-5)
and statistical associations to PTH levels for array Aggarwal BB 2004 Nuclear factor-kappaB: the enemy
CGH abnormalities were based on a limited sample set within. Cancer Cell 6 203–208. (doi:10.1016/j.ccr.2004.
and should therefore be substantiated or rejected in 09.003)
a larger panel of LPTAs. Almquist M, Bergenfelz A, Martensson H, Thier M &
In summary, we conclude that LPTAs could Nordenstrom E 2010 Changing biochemical presentation
constitute a subset of parathyroid lesions associated of primary hyperparathyroidism. Langenbecks Archı́ves
of Surgery 395 925–928. (doi:10.1007/s00423-010-
with pronounced PHPT features and specific genomic
0675-5)
aberrations.
Arnold A, Kim HG, Gaz RD, Eddy RL, Fukushima Y, Byers
MG, Shows TB & Kronenberg HM 1989 Molecular
cloning and chromosomal mapping of DNA rearranged
Supplementary data with the parathyroid hormone gene in a parathyroid
This is linked to the online version of the paper at http://dx. adenoma. Journal of Clinical Investigation 83
doi.org/10.1530/ERC-11-0140. 2034–2040. (doi:10.1172/JCI114114)
Downloaded from Bioscientifica.com at 07/28/2021 08:14:29AM
via free access
404 www.endocrinology-journals.orgYou can also read