ELEVATIONAL GRADIENTS AS A MODEL FOR UNDERSTANDING ASSOCIATIONS AMONG TEMPERATURE, BREEDING PHENOLOGY AND SUCCESS - MPG.PURE
←
→
Page content transcription
If your browser does not render page correctly, please read the page content below
ORIGINAL RESEARCH
                                                                                                                                         published: 15 October 2020
                                                                                                                                     doi: 10.3389/fevo.2020.563377

                                            Elevational Gradients as a Model for
                                            Understanding Associations Among
                                            Temperature, Breeding Phenology
                                            and Success
                                            Aisha C. Bründl 1,2,3* , Louis Sallé 2 , Léa A. Lejeune 2 , Enrico Sorato 2 , Alice C. Thiney 2 ,
                                            Alexis S. Chaine 2,4 and Andrew F. Russell 1,2
                                            1
                                             Centre for Ecology and Conservation, College of Life and Environmental Sciences, University of Exeter, Penryn,
                                            United Kingdom, 2 UMR 5321 (Station d’Écologie Théorique et Expérimentale), Centre National de la Recherche Scientifique
                                            (CNRS), Université Paul Sabatier (UPS), Moulis, France, 3 Max Planck Institute for Evolutionary Anthropology, Leipzig,
                                            Germany, 4 Toulouse School of Economics, Institute for Advanced Studies, Toulouse, France

                                            Climate change is associated with advancing phenology of seasonal traits in many
                                            taxa, but shifts by higher trophic levels are generally reduced compared with those
                                            of lower trophic levels. For example, the eclosion date of caterpillars and the lay date
                                            of insectivorous passerine birds have both advanced recently, but the former has done
                                            so more than the latter. While the ensuring phenological mismatch between predator
                          Edited by:
                      Andreas Nord,
                                            and prey is well-documented, our understanding of the origins of this mismatch is more
             Lund University, Sweden        limited. Here we shed light on the interplay between ambient temperature, breeding
                       Reviewed by:         phenology and reproductive success in a single population of blue tits (Cyanistes
               Martha Maria Sander,
                                            caeruleus) nesting over a 1,000 m (∼5◦ C) elevational gradient in the French Pyrenees.
             University of Turin, Italy
                       Jules Chiffard,      During the 6 years of this study, we found that average breeding phenology varied by
       UMR 5175 Centre d’Ecologie           2–9 days among years, but was on average 11 days earlier at low versus high elevation.
    Fonctionnelle et Evolutive (CEFE),
                                France
                                            Despite the delay, breeding at high elevation was associated with lower and more
                  *Correspondence:
                                            variable temperatures during breeding. Early breeders within a given year generally had
                      Aisha C. Bründl       larger clutch sizes than late breeders, which led to more offspring fledged as typically
            aisha.bruendl@gmail.com
                                            found in other studies. However, in three of the 6 years, the probability of producing
                  Specialty section:
                                            fledglings was actually lower among early layers. Additionally, birds breeding at high
        This article was submitted to       elevations who experience conditions typical of early breeders in other populations
 Behavioral and Evolutionary Ecology,
                                            had reduced hatching success and were significantly less likely to fledge any young
               a section of the journal
   Frontiers in Ecology and Evolution       compared with those breeding at lower elevation. Reduced success at high elevation
            Received: 18 May 2020           was not obviously driven by higher nest predation, which was exceptionally low, or
      Accepted: 23 September 2020           reduced food availability because high elevation birds laid clutches of comparable size
        Published: 15 October 2020
                                            and fledged the same number of offspring of comparable mass as those breeding at low
                              Citation:
      Bründl AC, Sallé L, Lejeune LA,
                                            elevation. Our study reveals the capacity for substantial variation in breeding phenology
 Sorato E, Thiney AC, Chaine AS and         within a population, but that the success of early breeders varies across years and
         Russell AF (2020) Elevational
                                            temperature gradients. We suggest that the evolution of phenological advancements
                 Gradients as a Model
      for Understanding Associations        by small endotherms might be curtailed by increased probability of experiencing, and
       Among Temperature, Breeding          failure under, challenging meteorological conditions in late winter or very early spring.
             Phenology and Success.
          Front. Ecol. Evol. 8:563377.      Keywords: Cyanistes caeruleus, environmental cline, environmental constraints, phenotypic plasticity,
     doi: 10.3389/fevo.2020.563377          reproductive investment

Frontiers in Ecology and Evolution | www.frontiersin.org                          1                                         October 2020 | Volume 8 | Article 563377
Bründl et al.                                                                                                  Breeding Phenology Across Elevations

INTRODUCTION                                                               and reduced breeding success (Kluen et al., 2011). Whilst such
                                                                           longitudinal studies clearly provide important insights into the
Recent meta-analyses show that organisms of diverse taxonomic              associations among ambient temperature, breeding phenology
groups are responding to earlier springs by advancing the timing           and success, their duration also means that the results are likely
of key life events (Thackeray et al., 2010, 2016). However, there          to be driven by a combination of plasticity and adaptation
appears to be variation in the extent of advances across trophic           (Charmantier et al., 2008; Ramakers et al., 2019). Further, the
levels, with lower trophic levels advancing their phenology more           inevitable time taken to establish such studies coupled with the
than higher levels (Both et al., 2009b; Thackeray et al., 2010).           pressing need to understand such relationships in a time of rapid
A classic example is seen in invertebrates and insectivorous               climate change, provides an incentive for alternative approaches.
birds breeding in northern temperate latitudes, with invertebrate              One complementary approach might be to use elevational
prey advancing their date of emergence more than predatory                 gradients within a single population of a given species as a means
birds are advancing their lay dates (Visser et al., 1998; Both             of investigating temperature effects on breeding phenology and
et al., 2009a,b). This differential in phenological change leads           its impacts on metrics of breeding success. Such an approach
to the well-documented concept of phenological mismatch, with              can work in principal because temperature declines linearly with
predators increasingly rearing their offspring after the peak              elevation: ∼0.65◦ C for every increase in elevation of 100 m, but
of prey availability (e.g., Durant et al., 2007; Visser et al.,            day length stays constant across the gradient. In accordance,
2012). However, why this mismatch should arise is not clear.               recent meta-analytical (Boyle et al., 2016) and survey-based
One possibility is that, with their faster generation times, prey          (Saracco et al., 2019) approaches demonstrate that avian breeding
are able to evolve adaptive responses to advancing springs                 phenology is delayed at higher elevations. However, a potential
more rapidly than predators with longer generation times                   problem is that habitat structure and invertebrate prey abundance
(Cushing, 1969; Visser and Both, 2005). Another possibility,               might also vary across extensive elevational gradients and do so
however, is that endothermic predators, such as birds, are                 non-linearly (Körner, 2007; Nice et al., 2019) confounding the
constrained from advancing breeding phenology to the same                  ability to surrogate temperature through elevation. To reduce
extent as their invertebrate prey because they suffer more directly        the impact of these potential confounds we need a targeted
and/or indirectly from cold weather (Visser et al., 2015). While           elevational approach that provides representative variation in
climate is warming and springs are advancing, weather can                  temperatures expected under climate change, but minimizes
be prohibitively cold early in the year because day lengths                systematic variation in other significant ecological parameters,
are shorter, resulting in weakened selection for ever-advancing            principally habitat type, cover from predators and food types
breeding phenology in endothermic predators. Testing this                  or abundance. However, few previous studies have used such a
‘environmental constraints’ hypothesis requires investigating the          targeted elevational approach, meaning effects might often be
interplay between temperature, breeding phenology and success              influenced by significant habitat differences, day length or local
which can be challenging in natural settings.                              adaptation (Boyle et al., 2016).
    For example, the obvious way of exploring this interplay is                Here we used a targeted elevation approach in the French
to investigate the relationship between breeding phenology and             Pyrenees to investigate the associations among elevation,
success throughout a breeding season, but such an approach                 breeding phenology and success in a nest box population of blue
is not valid. This is because although early breeding should be            tits (C. caeruleus) across 6 years. Our approach is targeted in
associated with colder weather, it will typically be associated with       two ways. First, the ∼600 nest boxes are located within 5 main
a closer match to peak prey availability (Verhulst and Tinbergen,          areas of contiguous habitat and were within 16 km of each other
1991; Winkler and Allen, 1996; Verhulst and Nilsson, 2008;                 (median = 5 km). This distance is well within the known dispersal
Emmenegger et al., 2014), which will confound the expected                 distance of blue tits (Paradis et al., 1998) and indeed we have
positive relationship between temperature and breeding success             observed several instances of among-site dispersal. Thus, our
under the environmental constraints hypothesis. Indeed, early              nest boxes encapsulate a single breeding population of blue tits.
breeding is typically associated with increased, not reduced,              Second, the elevational gradient is a relatively modest 1,000 m
success (Kluyver, 1951; Verhulst and Tinbergen, 1991; Barba                and critically stops at 1,530 m a.s.l, ∼300 m below the upper
et al., 1995; McCleery and Perrins, 1998). An alternative approach         end of the deciduous tree line in the French Pyrenees. While
is to compare the relationship between phenology and success               this range is sufficient to generate a ∼5◦ C difference in mean
among years that vary in average temperature, although the                 daily (24 h) between low and high elevations, it is insufficient
magnitude of any effect measured is contingent upon the                    to have a major impact on habitat. For example, the habitat is
magnitude of inter-annual variation in temperature, which                  characterized by mixed deciduous woodland across the elevation
is often modest. Nevertheless, long-term longitudinal studies              gradient with no obvious differences in tree height, and all
capturing sufficient inter-annual temperature variation provide            species are represented at all elevations, although there is a shift
some evidence for the environmental constraints hypothesis.                from oak (Quercus robur) domination to beech (Fagus sylvatica)
For example, a 24-yearlong study in pied flycatchers (Ficedula             domination with increasing elevation (Bründl, 2018). Finally,
hypoleuca) showed that low temperatures during early breeding              observations of nestling provisioning show that feeding rates
are associated with reductions in fledging success (Moreno                 marginally decrease but that prey type delivered is comparable
et al., 2015). Similarly, in blue tits (Cyanistes caeruleus) low           across the elevational gradient (Bründl, 2018). Thus, our available
temperatures during egg-laying was linked to hatching delays               evidence suggests that our elevation gradient can be used as a

Frontiers in Ecology and Evolution | www.frontiersin.org               2                                    October 2020 | Volume 8 | Article 563377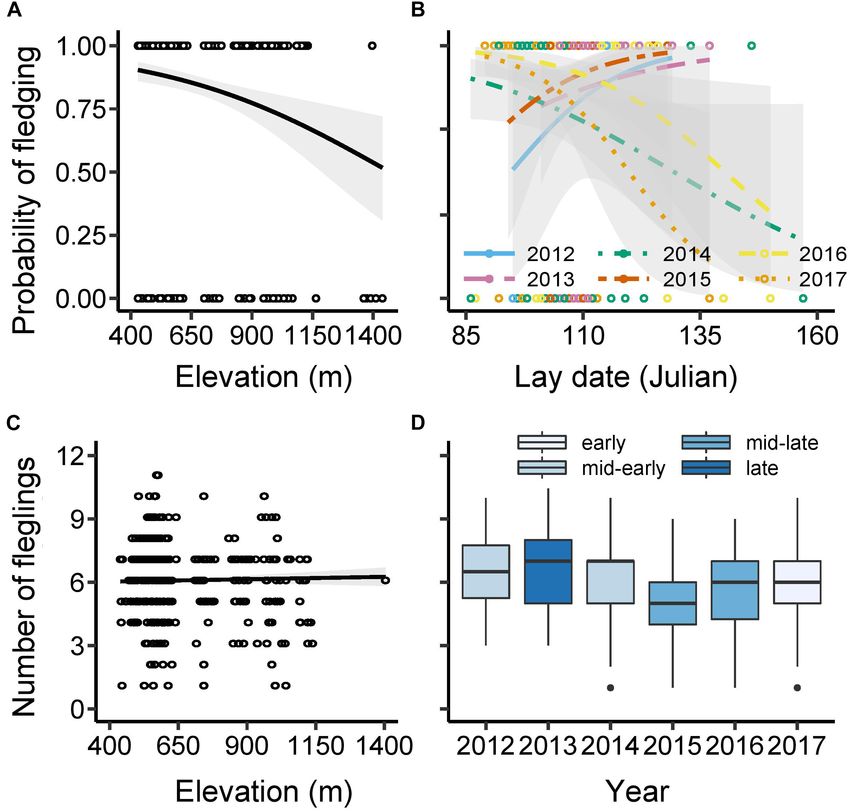
Bründl et al.                                                                                                 Breeding Phenology Across Elevations

natural experiment to investigate the influence of temperature            with elevation (see Körner, 2007). Overall, temperature decreased
variation on breeding phenology and success, without significant          by an average 5◦ C along the elevational cline throughout the
confounds of local adaptation or ecology.                                 breeding season (see section “Results” for specific details).
    The blue tit is a short-lived, small passerine bird with high
fecundity (Perrins, 1979). Previous longitudinal studies have             Breeding Phenology, Investment and
shown that they adjust lay date in response to spring temperatures
and that clutch size and fledging success generally decline with
                                                                          Success
delayed phenology (e.g., Haywood, 1993; Lambrechts et al.,                We recorded lay date, clutch size, hatching failure and fledging
1996; Källander et al., 2017; Shutt et al., 2019). However, cold          success in all years (2012–2017). Each of these parameters was
temperatures during egg-laying have been shown to reduce                  known with precision owing to nest checks every 3–5 days,
the success of early breeders through reduced hatching success            which increased to daily during critical periods. These critical
and lower nestling body mass in a Finnish population of blue              periods were before the onset of laying for recording lay date,
tits, providing some evidence of the environmental constraints            from the sixth egg to clutch completion to determine clutch
hypothesis (Kluen et al., 2011). First, we describe elevational           size and the start of incubation, from day 11 of incubation to
(1,000 m) and annual (2012–2017) variation in breeding                    determine hatching and from day 18 after nestling hatching to
phenology, and its effects on average temperatures experienced            determine fledging success. Our blue tit population is single
during incubation and nestling provisioning. Second, we                   brooded, although pairs are known to make a second nesting
investigate the associations among year, elevation and lay                attempt if the initial brood is abandoned early in the season
date, on clutch size and hatching success. Finally, we test the           (personal observations). No differentiation between first and any
effects of each on fledging success and nestling mass. The                second attempts was possible, since blue tits are known to also use
environmental constraints hypothesis predicts that advanced               natural cavities in our population. Nevertheless, abandonment
breeding phenology is associated with reduced temperatures                is uncommon overall (10% of 535 nesting attempts) and is
during breeding, and that as a consequence metrics of breeding            uninfluenced by elevation (Supplementary Figure 1). In this
success will be reduced among early breeders in some years                study, we removed the 16 nesting attempts that abandoned before
particularly at high elevations.                                          the onset of egg-laying from all analyses, and removed the 41
                                                                          that abandoned during incubation from analyses of hatching
                                                                          and post-hatching analyses. As these latter cases were late in the
MATERIALS AND METHODS                                                     season, they presumably occurred in response to declining food
                                                                          supplies. Thus the total number of hatchlings was determined
Study Population and Habitat                                              as the number of eggs that hatched successfully from clutches
Climate and reproductive data were collected near the research            wherein at least one hatched. The total number of fledglings was
Station for Theoretical and Experimental Ecology of Moulis                estimated as the number of nestlings at ringing (ca. day 15) minus
(SETE, UMR 5321; 42◦ 570 2900 N, 1◦ 050 1200 E), in the French            those found dead after the rest of the brood fledged. Starting in
Pyrenees during the breeding seasons 2012–2017. Overall, our              2013, all nestlings were weighed to the nearest 0.1 g (days 11–18
14 woodlots within 5 main sites contained a total of 626–641              after hatching) using electronic scales. Our full data set comprised
Woodcrete SchweglerTM 2 M nest boxes (32 mm entrance hole                 519 blue tit nests for which lay date was known with precision and
diameter) per year spaced at ∼50 m intervals from 430 to 1,530 m          a full clutch of eggs was laid. However, this sample was reduced in
elevation (Figure 1). The median pair-wise distance between               subsequent analyses owing to rare cases of missing observations,
woodlots was 5 km (range = 0.6–16 km). All woodlots are                   the use of some nests in experiments for other purposes and
connected by a contiguous mosaic of mixed deciduous woodland,             nest abandonment. In 2013–2014, 58 experimental nests were
primarily oak (Quercus robur), ash (Fraxinus excelsior), hazel            excluded from the clutch size analysis, as we modified egg-laying
(Corylus avellana), and beech (Fagus sylvatica), with the former          in these nests (N = 461 remaining). However, this manipulation
three species being more common at lower elevations and beech             did not affect subsequent breeding parameters, since variation
at higher elevations. Temperature data was recorded from the              in the number of eggs incubated and hatchling numbers were
2015 breeding season at three locations across the elevational            returned to natural levels at incubation onset (Bründl et al., 2019).
gradient (565, 847, and 1,335 m a.s.l.) using TinytagTM loggers           The precise sample size for each analysis is provided below.
(TGP-4500 and TGP-4505) positioned on tree trunks 2 m from
the ground. This temperature data, which was recorded every               Statistical Analyses
30 min, allows us to clarify temperature differences during               Statistical analyses were performed in the R environment, version
incubation and nestling as a function of lay date across the              3.5.1 (R Core Team, 2018). Distributions of dependent variables
elevational gradient. We, therefore, use the temperature data             and model residuals were visually inspected for normality.
to validate the utility of using elevation gradients as a means           Normal response terms were analyzed using linear models
of examining potential associations between temperature and               (LMs) in the standard ‘stats’ package (R Core Team, 2018). If
breeding parameters. But we did not analyze detailed impacts              the data were non-normal, generalized linear models (GLMs,
of temperature per se as it is limited to just three sites in three       package = MASS; Venables and Ripley, 2002) were used adjusting
years and is highly correlated with elevation. Precipitation was          residual variance structure accordingly, i.e., the error distribution
not included as it is not expected to decrease in a linear fashion        family and link function (see SOM tables of each analysis;

Frontiers in Ecology and Evolution | www.frontiersin.org              3                                     October 2020 | Volume 8 | Article 563377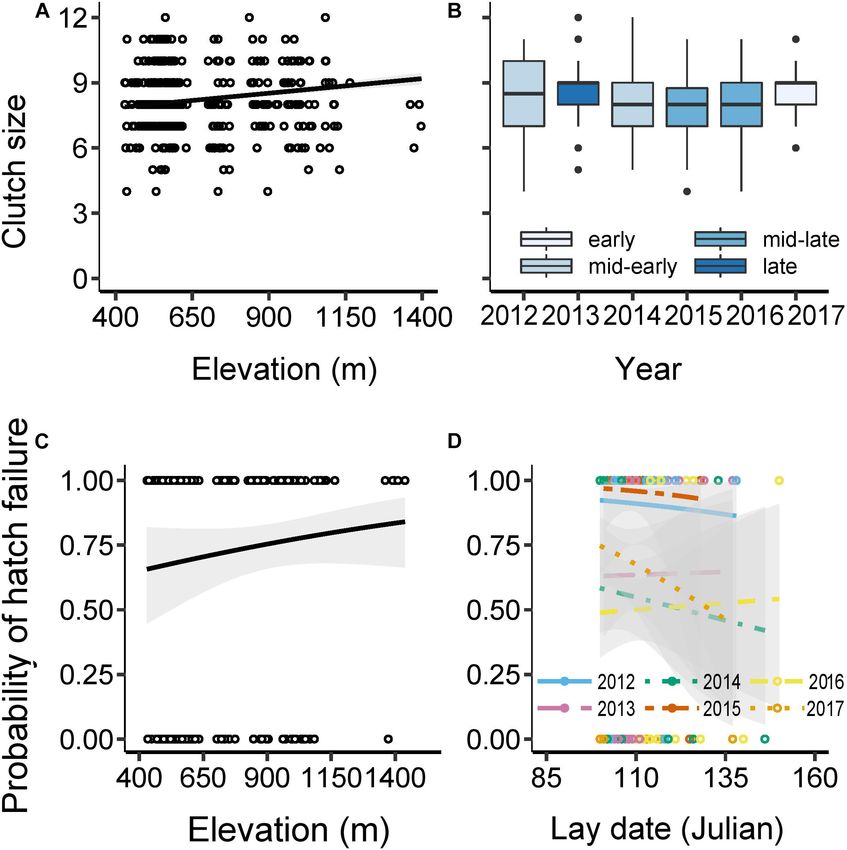
Bründl et al.                                                                                                                     Breeding Phenology Across Elevations

  FIGURE 1 | Topographic map of the study site near the research Station for Theoretical and Experimental Ecology of Moulis (42◦ 570 2900 N, 1◦ 050 1200 E, orange
  marker), in the French Pyrenees. A total of 626–641 nest boxes (blue markers) are spaced at ca. 50 m intervals across 14 woodlots, divided into 5 sites, from
  430–1,530 m elevation. The site names with their elevational ranges are provided. The woodlots are situated within a contiguous mosaic of mixed deciduous
  woodland (see bottom photo). Scale = 1:42000. The top map shows the sites’ location within France. Map generated by l’Institut National de l’Information
  Géographique et Forestiére (© IGN, 2020) via ‘Geoportail.gouv.fr’. The top photo shows a banded blue tit delivering a caterpillar to its nest box.

Thomas et al., 2013). Fitting nest box identity as random terms in                     well as two-way interactions including lay date and/or elevation,
the models explained none of the variance and had no qualitative                       year and clutch size (see S2–S7 for more details). Although
impact on the results (see Supplementary Table 1), presumably                          elevation was fitted as a linear predictor in all statistical models,
because the number of nest boxes far exceeded those occupied by                        we sometimes split the elevational gradient into three elevational
blue tits and the inter-annual survival and philopatry of breeders                     ranges in figures to facilitate visualization and interpretation only
were low [21% for banded females returned to breed in a nest box                       (see Figures). The three categories – low (430–633 m), mid (702–
in a subsequent year (mean number of breeding attempts = 1.2                           904 m), and high (923–1,530 m) elevations – were determined
per banded female, maximum = 4)]. To test the effect of the                            where the greatest gaps in elevation between occupied nest boxes
random term we used corrected Akaike’s Information Criterion                           were observed (see also Schöll et al., 2016), and corresponded
(AICc – for finite sample sizes) set to a Delta of two (Zuur                           to the location of the temperature data loggers (central in
et al., 2009). Nest box identity was thus removed as a random                          each elevational range). We included the possibility of a non-
term from all the subsequent, non-mixed models. All models                             linear (2nd order polynomial) main effect of lay date since
underwent checks for overdispersion and heteroscedasticity of                          the success of very early and late nests might be expected to
residuals (Zuur et al., 2009). Collinearity among explanatory                          be compromised, but it was never significant (Supplementary
terms was tested using a variance inflation factor (VIF) analysis                      Tables 3–7). However, elevation was included only as a linear
(package = car; Fox et al., 2018) which if above 3–7 degrees                           term as we have no clear predictions about non-linear effects and
indicates biased high contribution of a variable to the standard                       visualization of raw data suggested that no non-linear patterns
error of a regression, i.e., multicollinearity (Zuur et al., 2010;                     between elevation and y parameters were likely to be present.
Dormann et al., 2013). However, the VIF between the main                                  First, we investigated how breeding phenology (lay date)
potential collinear terms of lay date and elevation was low (1.22)                     varied with elevation and year (N = 519). Second, we analyzed
and thus both were included as continuous variables in the same                        how clutch size was affected by lay date, elevation and year
models. Non-mixed model selection was based on changes in                              (N = 461), including both the separate effects of elevation and
deviance between full models and models excluding each factor                          lay date on clutch size and the interaction between the two
using the ANOVA function in R (significance set at α < 0.05)                           variables. LMs with normal error structure were applied for both
(Zuur et al., 2009).                                                                   lay date and clutch size analyses. To investigate the probability
    Overall, we conducted six basic models pertaining to: breeding                     of hatch failure, i.e., whether or not nests failed to hatch any
phenology (lay date); clutch size; hatching success; the probability                   eggs, we applied a GLM with binomial error structure (N = 476).
that at least one nestling fledged; the number of nestlings fledged                    In this model, the number of eggs incubated was fitted as a
from successful nests and mean nestling mass per brood. In                             covariate since the area of large clutches exceeds the area of
all models, we fitted lay date (except in the lay date analysis),                      the brood patch, making them more challenging to incubate
elevation, and year as the primary fixed terms of interest, as                         (Haftorn, 1983; Engstrand and Bryant, 2002; Niizuma et al.,

Frontiers in Ecology and Evolution | www.frontiersin.org                           4                                           October 2020 | Volume 8 | Article 563377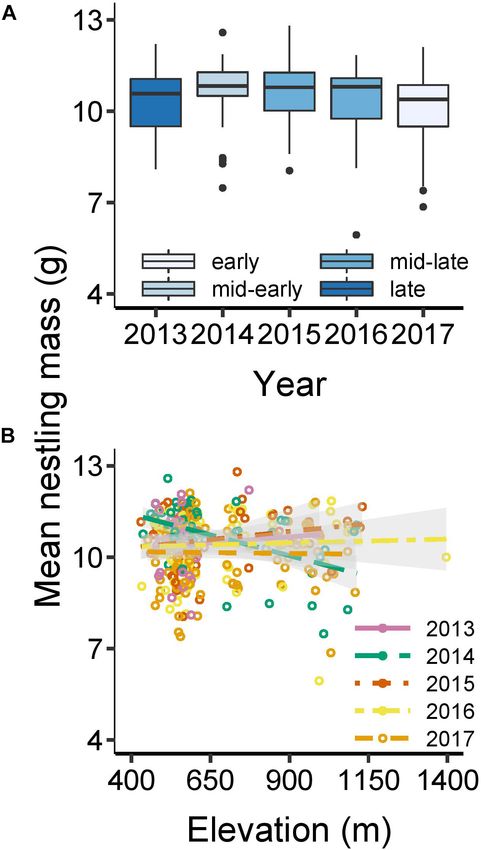
Bründl et al.                                                                                                        Breeding Phenology Across Elevations

2005). Fledging success was investigated as a two-step process:             TABLE 1 | Breeding phenology across 6 years (2012–2017) at 3 elevational
                                                                            categories [low (430–633 m), mid (702–904 m), and high (923–1,530 m)] and
first by investigating the factors associated with the probability of
                                                                            per year.
fledging at least one nestling (excluding nests with no hatchlings;
N = 438), and second, for those that did fledge at least one                Year           N          Mean          ±SD            Min             Max
offspring, the factors influencing the number of nestlings that
                                                                            Low
fledged (N = 369; 16% of the 438 nests failed to fledge young).
                                                                            2012          43         13 April        8.3          04 April        17 May
This two-step process was performed because alternative zero-
                                                                            2013          46         17 April        2.2          11 April        23 April
inflated methods failed to converge when the interactions central
                                                                            2014          54         11 April        7.9         27 March         12 May
to the question were included. Finally, we also investigated factors
                                                                            2015          63         17 April        5.4          04 April        08 May
affecting mean nestling mass per brood in a LM (N = 345 broods
                                                                            2016          65         13 April        6.8         27 March         05 May
with 2,230 nestlings). In addition to the primary predictors of
                                                                            2017          82         08 April        6.2         30 March         17 May
interest (lay date, elevation and year), linear and quadratic effects
                                                                            Mid
of brood age and brood size were added as covariates. We fitted
                                                                            2012           8         13 April        6.9          05 April        26 April
brood age rather than linear predictors, such as tarsus, since age
                                                                            2013          10         29 April        19.1         17 April        07 June
was known with precision, and tarsus length is itself a partly
                                                                            2014          18         17 April        10.6         09 April        13 May
condition-dependent trait (Merilä and Fry, 1998).
                                                                            2015          14         19 April        2.3          16 April        22 April
                                                                            2016          18         22 April        12.0         06 April        02 June
                                                                            2017          24         10 April        7.4          01 April        09 May
RESULTS                                                                     High
                                                                            2012           5         30 April        5.5          23 April        08 May
Elevation and Year Effects on Phenology                                     2013           4         06 May          9.0          28 April        17 May
and Consequences for Temperatures                                           2014          19         25 April        18.7         12 April        11 June

During Incubation and Nestling                                              2015           9         01 May          13.5         18 April        01 June
                                                                            2016          12         02 May          11.8         20 April        29 May
Provisioning                                                                2017          25         12 April        5.2         30 March         23 April
Over the 6 years of study, clutches were initiated between 27
                                                                            Overall       519        16 April        10.3        27 March         11 June
March and 11 June, with a mean of 16 April [±10 days (SD),
N = 519 total breeding attempts; Table 1]. Some late nesting
attempts are likely to be explained by re-clutching following
                                                                            In this case, early breeding at low elevation was associated
rare early abandonment or failure, but blue tits are not double-
                                                                            with twofold greater variation in day time temperatures during
brooded in our population. Both elevation and year had a
                                                                            incubation and fourfold greater variation at high elevation
significant impact on average breeding phenology (elevation:
                                                                            (Figure 2E). During nestling rearing, early breeders experienced
F 1,512 = 184.96, P < 0.001; year: F 5,512 = 32.31, P < 0.001;
                                                                            double the variation in day-time temperatures at low elevation
Supplementary Table 2). More specifically, the mean lay date was
                                                                            and three times the variation at high elevation, compared with
13 April at low elevations (430–633 m) (±7 SD), but averaged
                                                                            late breeders (Figure 2F). These results support the assumption
5 days later at mid elevations (702–904 m) (18 April ±12 SD),
                                                                            of the environmental constraints hypothesis that early breeding
and 11 days later at high elevations (923–1,438 m) (24 April
                                                                            is associated with lower and more variable temperatures.
±15 SD) (Figure 2A). Similarly, for example, lay dates were an
                                                                            The question is, are temperatures early in the season and at
average of 7 days earlier in 2017 and 5 days later in 2013 than the
                                                                            high elevation sufficiently low (on average or through greater
overall mean of the population across all years (Table 1). Finally,
                                                                            variability) to compromise metrics of success, as predicted by the
there was a significant interaction between year and elevation
                                                                            environmental constraints hypothesis?
on lay dates, with lay date being delayed to a greater extent at
high elevation in some years (e.g., 2013) than others (e.g., 2017)
(F 5,507 = 8.46, P < 0.001; Figure 2B).                                     Elevational and Annual Variation in
    Early and high elevation breeding were associated with                  Clutch Size and Hatching Success
reduced and more variable temperatures during incubation                    Average clutch size in our population was 8.2 eggs (±1.4 SD,
and nestling provisioning. For example, at low elevation,                   range: 4–12; Supplementary Table 3). The greatest contributor
early breeders, as opposed to late breeders, experienced                    to variation in clutch size was lay date, with clutch size declining
average day-time temperatures (7 am – 7 pm) that were ∼2◦ C                 by one egg for every 2-week delay in the onset of laying
lower during both incubation (∼12 vs. ∼14◦ C; Figure 2C)                    over the ∼2 months laying period (F 1,453 = 99.11, P < 0.001;
and nestling rearing (∼13 vs. ∼15◦ C; Figure 2D). At high                   Supplementary Table 3). After controlling for effects of lay date,
elevation, early breeders experienced temperatures that were                we found that clutch size increased with elevation (F 1,453 = 14.54,
∼4◦ C lower than late breeders during incubation (∼8 vs.                    P < 0.001; Figure 3A) and varied among years (F 5,453 = 4.41,
∼12◦ C), although temperatures during nestling rearing                      P < 0.001; Figure 3B). For a given lay date, clutches were on
averaged ∼11◦ C irrespective of phenology. In addition, early               average 0.6 eggs (8%) larger at high elevation compared with low
phenology, particularly at high elevation, was associated with              elevation and differed by up to 0.8 eggs (9%) between years (e.g.,
high coefficients of variation in temperatures during breeding.             2013 versus 2015). Elevation failed to predict clutch size in the

Frontiers in Ecology and Evolution | www.frontiersin.org                5                                         October 2020 | Volume 8 | Article 563377
Bründl et al. Breeding Phenology Across Elevations FIGURE 2 | Breeding phenology and temperatures. Figure (A) shows the median, interquartile range, minimum and maximum range, and outliers of lay date at 3 elevational categories [low (430–633 m), mid (702–904 m), high (923–1,438 m); N = 519, see also Table 1]. Figure (B) shows the interaction between elevation and year on lay date (e.g., lay dates were delayed at high elevations especially in 2013, while in 2017 the delay was more modest). (Vertical, dashed lines indicate the cut-offs for the elevational categories). Figures (C–F) show the average (C) and coefficient of variation (D) of daytime temperature experienced during the 10–20 days (mean = 14 days) of incubation for each nest (◦ C) as a function of lay date and elevational category (N = 287 nests); while (E) shows the average and (F) shows the coefficient of variation of daytime temperatures experienced during the 17–26 days (mean = 21 days) of nestling provisioning (◦ C) as a function of lay date and elevational category (N = 248 nests). Daytime temperatures (C–F) were measured every 30 min between 7 am and 7 pm in 2015–2017 at 565, 847, and 1,335 m. All dates are in Julian units: 100 = 10 April in non-leap years/ = 9 April in leap years. All data are based on raw values, with lines representing best fits with 95% confidence intervals. absence of lay date in the model, and the trend was reversed elevations relative to their later lay dates, but in absolute terms (estimate: −0.00046, F 1,454 = 1.82, P = 0.18; Supplementary were of comparable size to those at low elevation despite their Figure 2). In other words, clutch sizes were only larger at higher later phenology. We found no evidence to suggest that clutch size Frontiers in Ecology and Evolution | www.frontiersin.org 6 October 2020 | Volume 8 | Article 563377
Bründl et al.                                                                                                                      Breeding Phenology Across Elevations

  FIGURE 3 | Clutch size and hatching success. Clutch size as a function of: (A) elevation across the 6 years (figure shows raw data with predicted line controlling for
  effects of lay date and year); and (B) year (2012–2017) [boxplots generated from raw data and colored according to average lay dates for each year for illustrative
  purposes (see Table 1)]. Probability that at least 1 egg failed to hatch in a clutch as a function of: (C) elevation (m) [figure shows raw values and predicted line
  controlling for effects of the number of eggs incubated and year]; and (D) lay date [Julian: 100 = 10 April (9 in leap years)] and year (figure shows raw values and
  predicted line controlling for the effects of the number of eggs incubated and elevation). Clutch size analyses were based on GLM with normal error structures;
  N = 461 clutches; while hatching failure analyses were based on GLM with binomial error structure and logit link function; N = 476 clutches. The difference in sample
  size arose because 58 experimental nests were excluded from the clutch size analysis, as we modified egg-laying in these nests, though this did not affect hatching
  (see Supplementary Tables 3, 4 for further details). 95% confidence intervals are presented around lines.

was influenced by interactions between lay date and elevation or                        the other years (χ2 5,466 = −71.49, P < 0.001, Figure 3D). An
lay date and year (Supplementary Table 3).                                              apparently significant interaction between lay date and year was
    After excluding nests with complete hatch failure (see section                      found to be driven by two late nests in 2015, and no other two-
“Materials and Methods”), we found that in 62% of nests at least                        way interactions involving lay date, elevation, year and number
one egg remained unhatched (mode = 0, range = 0-8 unhatched                             of eggs incubated were significant (Figure 3D, Supplementary
eggs), leading to an average of 6.9 hatchlings per nest (±1.8                           Figure 3, and Supplementary Table 4).
SD, range: 1–11). Hatching success was not affected by lay date
(χ2 1,465 = −0.41, P = 0.52), but was influenced by clutch size,
elevation and year (Supplementary Table 4). Larger clutches                             Fledgling Production
were more likely to be associated with at least one egg failing to                      The average percentage of nests fledging at least one nestling
hatch (χ2 1,466 = −8.16, P = 0.0043). The probability of partial                        was 84% (excluding nests with no hatchlings; N = 438,
hatching success also increased with elevation (χ2 1,466 = −6.48,                       Supplementary Table 5). The probability that at least one
P = 0.011), with an average of 7% more clutches failing to hatch                        nestling fledged from such nests was negatively affected by
all eggs at high versus low elevations (Figure 3C). The probability                     elevation, declining by ∼45% across the 1,000 m gradient
that all eggs hatched in clutches varied significantly among years,                     (χ2 1,436 = −12.67, P < 0.001) (Figure 4A). There was no
with almost all clutches in the mid-early year of 2012 and mid-late                     statistically significant main effect of lay date (χ2 1,435 = −2.28,
year of 2015 having at least one egg remaining unhatched, while                         P = 0.13) or year (χ2 5,430 = −7.78, P = 0.17) on fledging success,
significantly fewer nests (50–75% overall) had unhatched eggs in                        although there was a significant interaction between the two

Frontiers in Ecology and Evolution | www.frontiersin.org                            7                                           October 2020 | Volume 8 | Article 563377
Bründl et al. Breeding Phenology Across Elevations
FIGURE 4 | Fledging success. The probability of at least 1 hatchling fledging the nest as a function of: (A) elevation (figure shows raw data with best-fit line); (B) lay
date (Julian, see previous legends) and year (figure shows raw data and predicted lines controlling for the effect of elevation). The number of fledglings per successful
nest (i.e., those with ≥1 fledgling) as a function of: (C) elevation (figure shows raw values with predicted line controlling for lay date and year); and [(D) year (box plots
based on raw values showing median, interquartile range, minimum and maximum range, and outliers)]. The probability of fledging any young was analyzed using
GLM with binomial error structure and logit link function; (N = 438 broods), while the analysis fledgling numbers was based on GLM with normal error structure;
N = 369 broods with ≥1 fledgling (see Supplementary Tables 5, 6 for further details). 95% confidence intervals are presented around lines.
(χ2 1,425 = −12.57, P = 0.028; Figure 4B). This interaction Nestling Mass
between lay date and year arose because the probability of Overall, mean nestling mass in broods between the age of
fledging at least some hatchlings declined with increasing 11–18 days was 10.4 g (±1.0 SD), ranging from 5.9–12.8 g
lay date in the early-mid phenology years of 2014, 2016, and (Supplementary Table 7). Older broods were heavier than
2017 (estimate ± SE for these 3 years = −0.044 ± 0.020; younger broods (linear effect: F 1,337 = 11.63, P < 0.001), although
χ2 1,293 = −5.00, P = 0.025), but showed a non-significant age effects tended to asymptote for old broods (quadratic effect:
tendency for the reverse in the other (mid-late) years F 1,336 = 3.28, P = 0.071). There were no main effects of lay
(0.10 ± 0.060; χ2 1,137 = 1.76, P = 0.078). All other interactions date (F 1,335 = 0.37, P = 0.54) or elevation (F 1,334 = 0.095,
were non-significant (Supplementary Table 5). P = 0.76) on nestling mass. There was significant inter-annual
An average of 6.0 nestlings fledged from nests that did variation in nestling mass (F 4,337 = 3.60, P = 0.0068), ranging
not experience complete brood failure (±1.9 SD, range: 1–11; from an average of 10.2 g in the early year of 2017 to 10.7 g in
Supplementary Table 6). Later-breeding nests fledged fewer the mid-year of 2014 (Figure 5A). Any tendencies for lay date
young than early nests, with 0.08 fewer nestlings fledged per effects on nestling mass to vary among years were driven by
day delay in laying of the first egg (F 1,362 = 34.95, P < 0.001). outlying late nests (Supplementary Table 7 and Supplementary
There was no effect of elevation (F 1,361 = 0.004, P = 0.95; Figure 4). However, there was a more robust year ∗ elevation
Figure 4C) on the number of fledglings produced, although interaction (F 4,332 = 4.083, P = 0.0030; Figure 5B). This
there was significant inter-annual variation in fledging numbers interaction was driven primarily by a strong negative association
(F 5,362 = 6.71, P < 0.001), ranging from an average of five between elevation and nestling mass in 2014, whereas in other
fledglings in the mid-late year of 2015 to almost seven in the years this association was weak or even slightly positive (2015).
late year of 2013 (Figure 4D). There were no significant two- The interactions between lay date and elevation and between
way interactions including lay date, number of eggs incubated, lay date and brood size were not significant, although there was
elevation or year (Supplementary Table 6). a slight (non-significant) trend for a more positive relationship
Frontiers in Ecology and Evolution | www.frontiersin.org 8 October 2020 | Volume 8 | Article 563377Bründl et al. Breeding Phenology Across Elevations
between nestling mass and lay date with increasing elevation
(Supplementary Table 7).
DISCUSSION
By combining a multi-year study with an elevational gradient,
we were able to investigate a population’s capacity for altering
breeding phenology across a broad temperature range and the
downstream reproductive consequences. Breeding phenology
varied markedly among years and especially across the elevational
gradient (Table 2). In accordance with an assumption of
the environmental constraints hypothesis, early phenology,
especially at high elevation, was associated with lower and more
variable temperatures during breeding. Although early breeders
laid larger clutches and fledged more young from successful
nests than later breeders on average, we found some evidence
to suggest that breeding at low temperatures is associated with
reduced success. First, in three of the 6 years the probability of
fledging any young was reduced among early breeders, while the
number of fledglings produced from success nests was highest
in the latest year (2013) and amongst the lowest in the earliest
year of our study (2017). Second, both the probability of fledging
young and hatching success was reduced at high elevation where
temperatures are colder. We have little evidence to suggest that
brood failure arose as a result of nest predation nor through
reduced food availability. For example, years with high breeding
failure did not necessarily have a reduced number of fledglings
per successful nest (e.g., 2012, 2013) nor did nestlings have
reduced mass (e.g., 2015). Similarly, successful nests fledged
the same number of young and at comparable masses across FIGURE 5 | Mean nestling mass (g) as a function of: (A) year; and (B) the
the elevational gradient. Together, our evidence lends support interacting effects of elevation and year. Analyses based on a LM with normal
to the hypothesis that the strength of directional selection on error structure; N = 345 broods (see Supplementary Table 7 for further
advancing phenology can be weakened in small endotherms by an details). Points show raw values, while predicted lines with 95% confidence
intervals control for brood age (B). Boxplots generated from raw data
increased probability of experiencing challenging environmental
(showing median, interquartile range, minimum and maximum range, and
conditions early in the season. This effect could have implications outliers).
for explaining evolutionary lags between endothermic predators
and ectothermic prey.
There is considerable cross-taxonomic support for the
suggestion that the phenology of key life events is changing studies is likely to be a result of evolution (Merilä et al., 2001;
in response to increasing temperatures (Parmesan and Yohe, Charmantier and Gienapp, 2014; Ramakers et al., 2019). Despite
2003; Root et al., 2003; Thackeray et al., 2010). However, what considerable changes in lay date observed over time in such short-
is less clear is the degree to which such changes are caused by lived, temperate, insectivorous passerines, a significant mismatch
plastic versus evolved responses, and the limits to advancing between the phenology of birds and their prey remains, and it
phenology (Thackeray et al., 2010; Visser et al., 2015). Long- is unclear why birds do not advance lay date more to overcome
term studies of tit species breeding in the United Kingdom the detrimental fitness consequences of mismatch (Both et al.,
[1961–2007; (Charmantier et al., 2008) and Sweden (1969– 2009a,b; Visser et al., 2012; Radchuk et al., 2019). A better
2012; Källander et al., 2017)] have shown advancements of lay understanding of when and why birds do not (or cannot) breed
date of ca. 14 and 11 days, respectively, in response to 2–3◦ C earlier might be obtained from observations, as presented in
increases in maximum spring temperatures. While such changes our study, in a population experiencing considerable variation
are doubtlessly caused, in part, by plastic responses to changing in temperature over shorter time periods to avoid ‘confounds’ of
temperatures (e.g., Gienapp et al., 2008; Merilä and Hendry, evolutionary responses.
2014; Phillimore et al., 2016), studies of 40 years on short-lived By combining observations across 6 years and a 1,000 m
species, where individuals breed in their first year of life, will also elevational gradient we were able to document variation in
provide sufficient time for evolutionary responses to selection breeding phenology over a short time period that complements
(Sheldon et al., 2003; Charmantier et al., 2008). As a consequence, what we have learned from long term studies. For example, in
at least part of the changes in phenology documented in these 2017, laying occurred an average of 9, 19, and 24 days earlier
Frontiers in Ecology and Evolution | www.frontiersin.org 9 October 2020 | Volume 8 | Article 563377Bründl et al. Breeding Phenology Across Elevations
TABLE 2 | Summary of significant predictors per response variable: lay date, other in contiguous woodland habitat; well within 1 SD of average
clutch size, probability of hatch failure, fledging success, total number fledging and
dispersal distances estimated for this species [mean = 5 km ± 15
mean nestling mass per brood.
(SD); Paradis et al., 1998]. Indeed, we have recorded several
Response Significant Estimate ±SE Directionality instances of dispersal between our sites. Finally, although lay
variable predictors date was delayed by an average of 14–19 days at high versus low
elevations in five of the years, in 2017 lay date was delayed by
Lay date Elevation 0.025 0.0019 ↑
just 4 days at high elevation and was sufficiently early in that
Year −8.14–4.86
year to be as early as the second earliest year in low elevation
Elevation*year −0.018–0.017
Clutch size Elevation 0.0014 0.00036 ↑
sites (Table 1). Thus, pairs in our population, particularly those
Lay date −0.072 0.0072 ↓
breeding at higher elevations, would appear to have the capacity
Year −0.36–0.74
to breed considerably earlier than they typically do in most years.
Probability of Elevation 0.0015 0.00060 ↑
The obvious question is why do they not start breeding earlier,
hatch failure particularly given the demonstrated mismatched phenology of
No. eggs 0.23 0.082 ↑ such species with peak invertebrate prey during nestling rearing
incubated (e.g., Van Noordwijk et al., 1995; Visser et al., 1998, 2003, 2012)?1
Year −1.92–1.54 The answers to this question are integral to understanding
Fledging Elevation −0.0022 0.00059 ↓ phenological mismatch and are of general importance. While
success many populations are advancing breeding phenology in response
Lay date*year −0.19–0.018 to warming springs (Thackeray et al., 2016), responses are not
Total number Lay date −0.077 0.013 ↓ universal. For example, no systematic change in lay date was
fledging
observed in a Dutch great tit population studied over more
Year −1.75–0.031 ↓
than 20 years (1973–2006), despite spring temperature increasing
Average Brood age 0.30 0.089 ↑
by up to 2◦ C over the same time period (Visser et al., 1998;
nestling mass
per brood Husby et al., 2010). Indeed, data from 24 European great tit
Brood size ˆ2 −1.95 0.98 ↓ and blue tit populations suggests significant variation in the
Year −0.30–0.48 phenological responses to increasing spring temperatures, even
Elevation*year −0.0036–0.000023 among neighboring populations (Visser et al., 2003). Further,
even for those populations that are responding, higher trophic
Normal response variables (lay date, clutch size, total number fledging, mean
nesting mass per brood) were analyzed using LMs with normal error structure and
levels are typically responding with reduced magnitude compared
non-normal response variables (probability of hatch failure, fledging success) using with lower trophic levels. The common explanation is that
GLMs with binomial error structure and logit link function. Significance was set at mismatching is due to evolutionary lags of higher trophic levels
α < 0.05. Estimates and standard errors are provided for continuous terms and with longer generation times (Cushing, 1969; Visser and Both,
ranges of estimates are provided for categorical terms. Directionality of continuous
response variables in relation to continuous predictors is provided. 2005). However, the results of this study (and others, e.g., Visser
et al., 2003; Both et al., 2006; Gienapp et al., 2008; Merilä
and Hendry, 2014) highlight that the answer is likely to be
than in 2013 at low, mid and high elevations, respectively, and nuanced, and influenced in significant part by within- and
females at high elevation began laying 11 days later than those among-year variation in meteorological patterns (Visser et al.,
at low elevation, on average. This variation is dramatic, and on 2015). Understanding why our high elevation populations do not
par with long-term studies spanning decades described above advance breeding despite the ability to do so will provide new
(e.g., Charmantier et al., 2008; Källander et al., 2017). To put insights to phenological mismatch in this and other populations.
this variation in perspective, at the onset of egg-laying in the late If an increasing probability of experiencing more challenging
year of 2013, pairs in 2017 were already beginning to incubate environmental conditions acts as a significant constraint on
their ∼9-egg clutches at low elevation, while, at high elevation, advancing phenology we would expect early breeders to be
they were in the first week of nestling-rearing (because breeding sometimes disadvantaged (Zaja̧c, 1995; Visser et al., 2015). It is
was proportionally earlier at high elevation in that year). That well known that unfavorable meteorological conditions at critical
this variation was observed over just a handful of years suggests times can have significant impacts on organisms, with cascading
that changes in breeding phenology over this study are not a effects on interacting species (Parmesan, 2006; Marrot et al.,
consequence of evolution. However, it is conceivable that later 2017). For example, the phenology of budding in many plants is
breeding across the elevational gradient is a consequence of local highly sensitive to spring temperatures, with plants being killed
adaptation or genetic drift. While evidence for local adaptation by cold snaps (Weiser, 1970). Even though the main prey of
has been observed across short-distances in blue tits across blue tits, caterpillars, are relatively cold tolerant (Nadolski and
contrasting habitat types (evergreen versus deciduous woodland; Bañbura, 2010), insectivorous prey are less active during colder
Porlier et al., 2012), we think genetic differences are unlikely to conditions, and thus harder to find (Taylor, 1963). However, the
offer a valid explanation for the marked phenological variation degree to which early breeding endotherms are disadvantaged
observed in our study. First, all our nest boxes were located in by a return of wintery conditions during breeding is less clear.
deciduous woodland, with overlap in tree species composition Nevertheless, in house sparrows (Passer domesticus), hatching
and prey (Lejeune et al., 2019). Second, our low, medium and success was negatively affected by extremely cold days during
high elevation woodlots were located within 0.6–16 km of each incubation (Pipoly et al., 2013). Likewise, wintery conditions are
Frontiers in Ecology and Evolution | www.frontiersin.org 10 October 2020 | Volume 8 | Article 563377Bründl et al. Breeding Phenology Across Elevations
known to cause delays to the onset of incubation and hatching young showed seasonal declines in early-mid phenology years,
and to be associated with reduced reproductive success in Polish the pattern was reversed in mid-late phenology years. Finally,
great tit and blue tit populations (Kluen et al., 2011; Gla̧dalski fledgling numbers at successful nests were comparable across the
et al., 2018, 2020). That blue tits in our population can suffer elevational gradient, despite marked variation in phenology, and
from challenging meteorological conditions, including early in were not influenced by the average phenology of a given year [e.g.,
the season, comes from at least two sources. First, hatching failure numbers were highest in mid-early (2014) and late (2013) years,
was significantly higher in 2012 and 2015, and the former at least lowest in mid-late 2015 and intermediate in the early year of
had unusually cold weather during egg-laying and incubation 2017]. One explanation for these patterns is that the associations
of early breeders. Furthermore, early breeders tended to have among temperature, timing cues and prey availability co-vary
increased brood failure in 2012, 2013 and 2015 compared with non-linearly, leading to inter-annual variation in the association
the other years. In these 3 years, early breeders experienced between phenology and prey availability. For example, because
the lowest daily maximum temperatures, while 2012 and 2013 the developmental rates of ectothermic invertebrates can be more
were also the coldest 2 years on average during the month than halved in favorable temperatures (Buckley et al., 2012)
from 20 March. As mentioned above, brood failure is difficult yet are more temperature-invariant in endotherms (Buse et al.,
to explain by differences in predation or in prey availability, 1999), it is likely that phenological mismatches are exacerbated
since clutch sizes, fledgling numbers at successful nests and in early compared to later phenology years. Thus, we might
nestling mass were not reduced in these years compared with expect breeding success in species such as blue tits to be
the others. Second, hatching failure and complete loss of broods maximal in years where conditions are suitably cold early to
was more common at high elevation where temperatures were slow the development of their prey, but not so challenging
significantly colder and more variable during both incubation to compromise their own success. In other words, the fitness
and nestling periods. Further, if territory quality were inferior at impacts of phenological mismatch could paradoxically be more
higher elevations per se, we would expect reduced clutch sizes, severe in early years whereas the impact of mismatch might be
fledgling numbers in successful nests, and/or nestling mass at more limited in later phenology years. Either way, the finding that
high elevation nests compared with those at lower elevation, but early phenology years do not associate with increased breeding
none was the case. Together these results are consistent with the success will likely act as a further impediment to the evolution
environmental constraints hypothesis, that challenging weather of advancing phenology in endothermic predators. Thus, even
conditions more often experienced early in the breeding season, in the absence of challenging conditions, inter-annual variation
weakens the strength of selection on phenological advancement in the timing and magnitude of environmental conditions might
(Visser et al., 2015). generate a fluctuating selection pressure on absolute timing;
While environmental constraints on early breeding as outlined further diluting the strength of selection for advancing phenology
above should dilute the strength of directional selection on in iteroparous organisms and compounding the evolutionary lag
advancing phenology, they were insufficiently strong to alter across trophic levels.
the shape of the linear seasonal declines in fecundity and In conclusion, we propose that short-term studies using
fledgling production. Seasonal declines likely exist because early elevational temperature gradients within populations provide a
breeders are often better-quality individuals on better quality valuable complement to long-term studies for understanding
territories (Verhulst and Nilsson, 2008), but they might also population responses to climate variation and change. Most
in part be explained by well-documented reductions in prey importantly, our approach provides a clearer insight into the
availability later in the season (Verhulst and Tinbergen, 1991; capacity for populations of a current genotype to respond to
Winkler and Allen, 1996; Emmenegger et al., 2014). Clarifying meteorological variation, since we are able to introduce such
the strength of selection on advancing phenology, therefore, variation to the same population using an elevational gradient.
requires a better understanding of the associations among We found that despite a clear capacity for earlier breeding
temperature, the cues used to time breeding and the timing of (based on lay dates in 2017), breeding was typically delayed,
prey availability (Visser and Both, 2005). Nevertheless, our results particularly at high elevation. It is not known whether earlier
suggest that such associations might be more complicated than is breeding would have been more beneficial in any of the sites
typically assumed. Most notably, whilst we found no significant or years, and so the degree of any phenological mismatch is
variation in the strength of seasonal declines (i.e., slopes) in unknown. However, it is noteworthy that breeding at high
breeding success among years, there were significant among- elevation and early breeding in some years was associated with
year differences in average breeding success (i.e., intercepts) increased probabilities of brood failure and there was no obvious
which are not obviously driven by phenology. Indeed, many association between average phenology in a given location or
patterns we detected were not consistent with typical patterns year and breeding success. Together, these results suggest that
where early breeders are more successful. Breeding phenology challenging environmental conditions during breeding can act
was advanced at high elevation relative to temperature compared as an evolutionary brake on advancing phenology and that
to low elevations, but these earlier breeders did not yield higher environmental variation among years dilutes the strength of any
fitness than low elevation birds. In addition, we found no directional selection on advancing phenology across evolutionary
evidence for a relationship between breeding phenology and timescales. The obvious next step is to elucidate the association
clutch size across years and clutch size was comparable across between the breeding phenology of tits across years and sites
the elevation gradient, despite later lay dates at higher versus and the patterns of prey availability, as well as to identify the
lower elevations. Furthermore, while the probability of fledging environmental cue that underpins phenology in our population.
Frontiers in Ecology and Evolution | www.frontiersin.org 11 October 2020 | Volume 8 | Article 563377Bründl et al. Breeding Phenology Across Elevations
Multiple cues likely instigate breeding (Gienapp et al., 2010), AUTHOR CONTRIBUTIONS
and identifying such cues are beyond the scope of this study.
Suffice to say that if the cues involve day length and temperature ACB, ASC, and AFR conceived the study and wrote the
(Lack, 1954; Lambrechts et al., 1996; Dawson et al., 2001; manuscript. All authors collected data. ACB compiled the data
Gienapp et al., 2010; Bonamour et al., 2019), it will need to and conducted the statistical analyses. All authors gave final
be an interaction between the two to explain why delayed approval for publication and agreed to be held accountable for
breeding at higher elevations occurs at reduced temperatures the work performed therein.
than at lower elevations since our population has the same
day length on a given date. In order to advance phenology
significantly, it might be that it is selection on and evolution FUNDING
of the cues used to time breeding that need to change (Lyon
et al., 2008). This is especially important in light of the increased This work was funded by grants from the Région Midi-Pyrénées
likelihood of extreme weather events under future climate (ACB, ASC, and AFR), the Centre National de la Recherche
prognosis (Intergovernmental Panel on Climate Change, 2014), Scientifique (ACB and ASC), a Natural Environment Research
and these extreme weather events should particularly impact Council studentship to the University of Exeter, as well as
early breeders (e.g., Gla̧dalski et al., 2014; Moreno et al., 2015). research grants from the Agence National pour la Recherche
Further studies from a combination of longitudinal, experimental (ANR-JCJC “NetSelect”) and the Human Frontiers Science
and environmental cline settings are required to unpack the Partnership (RGP0006/2015 “WildCog”) to ASC. This work is
relative contributions of selection for and against advancing part of the Laboratoire d’Excellence (LABEX) entitled TULIP
breeding phenology under current climate change, with due (ANR-10-LABX-41).
consideration of constraints and cues.
ACKNOWLEDGMENTS
DATA AVAILABILITY STATEMENT We thank the landowners who granted permission to work on
private land, J.-P. Molinier and the Office National des Fôrets for
The raw data supporting the conclusions of this article will be access to public land, the numerous field assistants and students
made available by the authors, without undue reservation, to any who aided in data collection over the years, and P. Heeb, N. Royle,
qualified researcher. and S. Sharp for helpful comments on a previous draft of the
manuscript. Finally, we are very grateful to the two referees, MS,
and JC, and the associative editor AN for constructive criticism
ETHICS STATEMENT and suggestions on a previous manuscript version.
The animal study was reviewed and approved by the state of
Ariége animal experimentation review (Préfecture de l’Ariège, SUPPLEMENTARY MATERIAL
Protection des Populations, no. A09-4) and the Région Midi-
Pyrenées (DIREN, no. 2012-07). Bird capture was carried out The Supplementary Material for this article can be found
under permits to ASC from the French bird ringing office online at: https://www.frontiersin.org/articles/10.3389/fevo.2020.
(CRBPO; no. 13619; PP576). 563377/full#supplementary-material
REFERENCES levels: constraints or adaptations? J. Anim. Ecol. 78, 73–83. doi: 10.1111/j.1365-
2656.2008.01458.x
Barba, E., Gil-Delgado, J. A., and Monros, J. S. (1995). The costs of being late: Boyle, W. A., Sandercock, B. K., and Martin, K. (2016). Patterns and drivers
consequences of delaying great tit Parus major first clutches. J. Anim. Ecol. 64, of intraspecific variation in avian life history along elevational gradients: a
642–651. doi: 10.2307/5806 meta-analysis. Biol. Rev. 91, 469–482. doi: 10.1111/brv.12180
Bonamour, S., Chevin, L.-M., Charmantier, A., and Teplitsky, C. (2019). Bründl, A. C. (2018). Parental Investment Across an Altitudinal Gradient in Blue
Phenotypic plasticity in response to climate change: the importance of cue Tits (Cyanistes caeruleus). PhD thesis, Universities of Exeter and Toulouse,
variation. Philos. Trans. R. Soc. B Biol. Sci. 374:20180178. doi: 10.1098/rstb.2018. Toulouse.
0178 Bründl, A. C., Sorato, E., Sallé, L., Thiney, A. C., Kaulbarsch, S., Chaine, A. S., et al.
Both, C., Bouwhuis, S., Lessells, C. M., and Visser, M. E. (2006). Climate change (2019). Experimentally induced increases in fecundity lead to greater nestling
and population declines in a long-distance migratory bird. Nature 441, 81–83. care in blue tits. Proc. R. Soc. B Biol. Sci. 286:20191013. doi: 10.1098/rspb.2019.
doi: 10.1038/nature04539 1013
Both, C., Turnhout, C. A. M. V., Bijlsma, R. G., Siepel, H., Strien, A. J. V., Buckley, L. B., Hurlbert, A. H., and Jetz, W. (2012). Broad-scale ecological
and Foppen, R. P. B. (2009a). Avian population consequences of climate implications of ectothermy and endothermy in changing environments. Glob.
change are most severe for long-distance migrants in seasonal habitats. Ecol. Biogeogr. 21, 873–885. doi: 10.1111/j.1466-8238.2011.00737.x
Proc. R. Soc. Lond. B Biol. Sci. 277, 1259–1266. doi: 10.1098/rspb.20 Buse, A., Dury, S. J., Woodburn, R. J. W., Perrins, C. M., and Good, J. E. G.
09.1525 (1999). Effects of elevated temperature on multi-species interactions: the case
Both, C., Van Asch, M., Bijlsma, R. G., Van Den Burg, A. B., and Visser, M. E. of pedunculate oak, winter moth and tits. Funct. Ecol. 13, 74–82. doi: 10.1046/j.
(2009b). Climate change and unequal phenological changes across four trophic 1365-2435.1999.00010.x
Frontiers in Ecology and Evolution | www.frontiersin.org 12 October 2020 | Volume 8 | Article 563377You can also read