Cascading impacts of large-carnivore extirpation in an African ecosystem
←
→
Page content transcription
If your browser does not render page correctly, please read the page content below
REPORTS

                                                                                                                                 Cite as: J. L. Atkins et al., Science
                                                                                                                                  10.1126/science.aau3561 (2019).

Cascading impacts of large-carnivore extirpation in an
African ecosystem
Justine L. Atkins1*, Ryan A. Long2, Johan Pansu1,3,4, Joshua H. Daskin5, Arjun B. Potter1, Marc E. Stalmans6,
Corina E. Tarnita1, Robert M. Pringle1*
1
 Department of Ecology and Evolutionary Biology, Princeton University, Princeton, NJ, USA. 2Department of Fish and Wildlife Sciences, University of Idaho, Moscow, ID, USA.
3
  Station Biologique de Roscoff, UMR 7144 CNRS-Sorbonne Université, 29688 Roscoff, France. 4CSIRO Ocean and Atmosphere, Lucas Heights, NSW 2234, Australia.
5
  Department of Ecology and Evolutionary Biology, Yale University, New Haven, CT, USA. 6Department of Scientific Services, Parque Nacional da Gorongosa, Sofala,
Mozambique.
*Corresponding author. Email: jlatkins@princeton.edu (J.L.A.); rpringle@princeton.edu (R.M.P.)

The world’s largest carnivores are declining and now occupy mere fractions of their historical ranges.
Theory predicts that when apex predators disappear, large herbivores should become less fearful, occupy

                                                                                                                                                                              Downloaded from http://science.sciencemag.org/ on March 7, 2019
new habitats, and modify those habitats by eating new food plants. Yet experimental support for this
prediction has been difficult to obtain in large-mammal systems. Following the extirpation of leopards and
African wild dogs from Mozambique’s Gorongosa National Park, forest-dwelling antelopes (bushbuck,
Tragelaphus sylvaticus) expanded into treeless floodplains, where they consumed novel diets and
suppressed a common food plant (waterwort, Bergia mossambicensis). By experimentally simulating
predation risk, we demonstrate that this behavior was reversible. Thus, whereas anthropogenic predator
extinction disrupted a trophic cascade by enabling rapid differentiation of prey behavior, carnivore
restoration may just as rapidly reestablish that cascade.

The worldwide decline of large mammalian carnivores is a                                present valuable opportunities to test predictions of trophic-
major environmental concern (1, 2), in part because apex                                cascade theory (4, 14, 20). In Mozambique’s Gorongosa Na-
predators can exert a defining influence on ecosystems via                              tional Park, large-mammal populations were severely re-
trophic cascades (3). A trophic cascade occurs when                                     duced during the Mozambican Civil War (1977 to 1992), with
predators indirectly affect plants through either of two                                >90% declines across all monitored species (21–23). Large-
mechanisms: by consumptively reducing prey abundance (4),                               herbivore populations have subsequently increased, but leop-
or by imposing ‘landscapes of fear’ in which prey modify their                          ards (Panthera pardus), wild dogs (Lycaon pictus), and hye-
behavior to reduce predation risk. In landscapes of fear, prey                          nas (Crocuta crocuta) were extirpated, while lions (P. leo)
are expected to forego foraging opportunities in resource-rich                          persisted at low abundance (23, 24) (table S1). In this carni-
habitats that are risky, thereby creating spaces where                                  vore-depleted system, we evaluated evidence for a behavior-
palatable food plants can thrive (5, 6). Accordingly,                                   ally mediated trophic cascade using field manipulations of
extirpation of top carnivores should create “landscapes of                              predator cues and herbivory, GPS telemetry of herbivore
fearlessness” where large herbivores seek out the nutritional                           movements, spatially explicit wildlife-count data, DNA-based
benefits of previously risky habitats, suppressing food-plant                           diet analysis, and body-condition measurements.
abundance in the process (5); conversely, re-establishment of                               Gorongosa’s central valley (Fig. 1, A and B) encompasses
real or perceived predation risk should reverse this behavior                           the ~750-km2 Lake Urema floodplain and surrounding sa-
(7). Although behaviorally mediated trophic cascades have                               vanna woodlands (25). During the dry season (May–Novem-
been documented frequently for relatively small consumer                                ber), the floodplain is a flat, largely treeless landscape,
species (8–10), there are few unequivocal examples involving                            dominated by grasses and forbs and dotted with leguminous
large mammalian carnivores and herbivores (11–13). This gap                             subshrubs. Such open habitat is typically avoided by herbi-
reflects the difficulty of experimentally manipulating                                  vores that rely on crypsis, tree cover, and known escape trails
predation risk and quantifying its downstream impacts at                                to avoid detection and capture by predators. One such herbi-
scales relevant to large mammals. Correlative and                                       vore species is bushbuck (Tragelaphus sylvaticus). This mid-
comparative analyses generally cannot rule out potentially                              sized antelope is a closed-habitat specialist that is “dependent
confounding factors, which has fueled debates (14–18) and                               on thick cover” (26) and “concealment to avoid predators”
prompted calls for stronger mechanistic inference in the                                (27), and “is not found on open plains or anywhere without
study of megafaunal trophic cascades (19).                                              sufficient cover to conceal it” (28) from key predators such as
    Ecosystems in which top predators have been extirpated                              leopards and wild dogs (29). Previous studies of African

First release: 7 March 2019                                              www.sciencemag.org                (Page numbers not final at time of first release) 1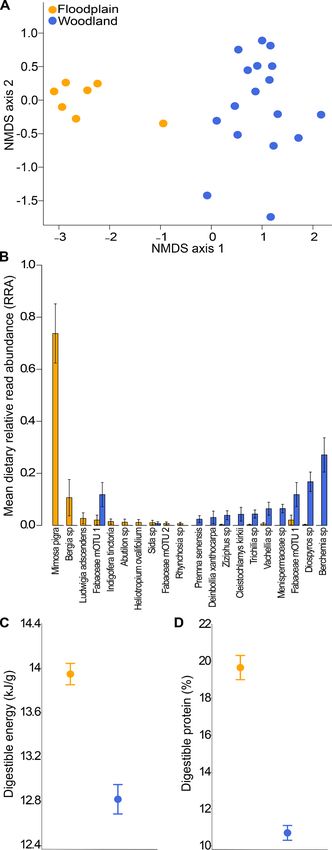
ungulates have emphasized the comparative safety of open multiple predator species. Playbacks of leopard vocalizations,
areas with high visibility (11, 13). For secretive forest browsers artificial lion scat, and generic carnivore urine (32) were used
such as bushbuck, however, treeless areas should be riskier, to mimic predator presence; white noise, locally collected
and relaxation of predation pressure might embolden indi- herbivore dung, and saline solution were used as sham cues
viduals to exploit what would otherwise be prohibitively dan- in procedural-control trials (12, 33). We restricted our anal-
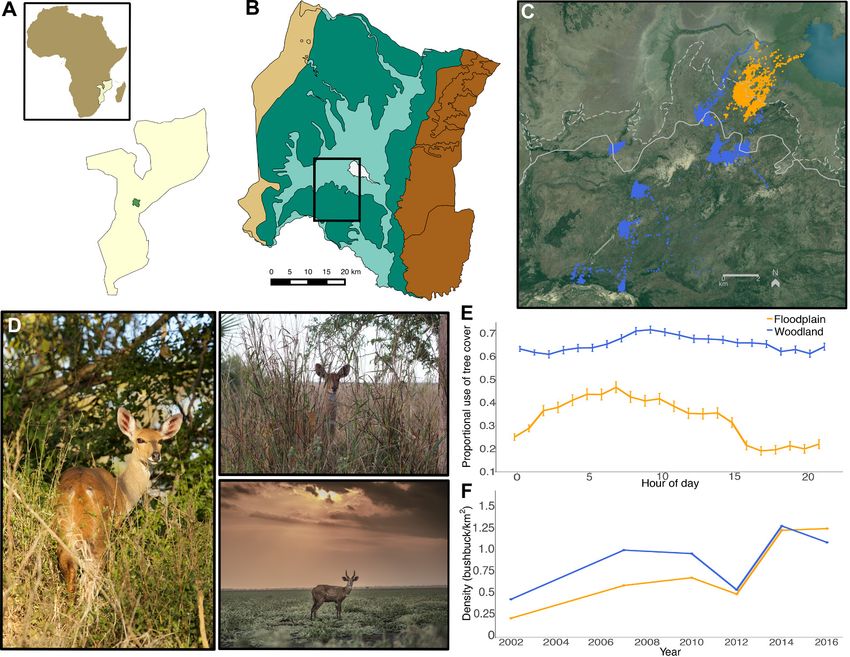
gerous open habitat. Indeed, bushbuck in Gorongosa were yses to data collected between 17:00 and 06:00, the period
historically confined to woodland and thicket habitat (30), encompassing peak bushbuck activity (32). For each individ-
but in the largely predator-free contemporary environment, ual, we quantified two response variables in the 48 hours im-
we have observed them venturing into the Urema floodplain. mediately preceding and following cue deployment. First, we
We quantified these initial observations by fitting GPS col- measured avoidance of predator and control cues by calculat-
lars to 11 bushbuck in 2015 and collecting hourly locations for ing the distance between each bushbuck GPS point and the
up to eight months. The data revealed two broad patterns in sound-cue location. Second, we measured whether simulated
habitat use: one subset of individuals was largely confined to risk caused floodplain individuals to increase their use of tree
densely wooded home ranges; another occupied the sparsely cover (i.e., shift back toward more “typical” bushbuck habi-
wooded floodplain margin and routinely forayed into treeless tat).
Downloaded from http://science.sciencemag.org/ on March 7, 2019
floodplain habitat, both at night and throughout the day (Fig. Bushbuck strongly avoided predator cues in both habitats,
1, C to E)—behavior never documented prior to predator ex- but did not avoid sham cues in either habitat (Fig. 2A and
tirpation (30). All available evidence indicates that this habi- table S2). Moreover, predator cues caused a significant in-
tat shift cannot be explained by competitive interactions. In crease in the use of tree cover by floodplain but not woodland
principle, carnivore extirpation might have increased wood- bushbuck, whereas sham cues did not significantly alter tree-
land bushbuck densities, prompting individuals to move into cover use in either habitat (Fig. 2B and table S2). We evalu-
the floodplain to mitigate intraspecific competition, as pre- ated statistical significance of these responses using mixed-
dicted by ideal-free distribution theory (31). We explored this effects models with random intercepts for individuals (table
possibility using data from six helicopter counts conducted S2). These results were robust to both GPS and habitat-clas-
between 2002 and 2016, when all ungulate populations were sification error (32) (figs. S4 and S5 and table S3). That flood-
recovering from similarly severe war-induced declines (21– plain bushbuck exhibited more cautious behavior in response
23, 30). If competition caused the habitat shift, then we to even a brief exposure to simulated risk suggests that some
would expect floodplain bushbuck densities to be negligible fear of predators has been retained and is primed in more
during the earliest counts, to increase only after woodland risky open habitats (7, 12). Our design does not enable us to
densities reached some threshold, and to remain lower than distinguish the roles of specific predator cues in generating
woodland densities throughout. To the contrary, floodplain these responses, but future studies could test sound and scent
bushbuck density was already ~50% of that in woodland in cues separately.
2002, and by 2016, density was ~15% higher in the floodplain Theory often assumes a nutritional opportunity cost of
(Fig. 1F). Moreover, densities of other ungulates were also risk avoidance (5). We therefore hypothesized that floodplain
highest in the floodplain (21). Thus, the observed habitat shift bushbuck would consume higher-quality diets and exhibit
cannot obviously be explained by either intra- or interspecific greater size and body condition. We analyzed bushbuck diet
competition. composition using DNA metabarcoding of fecal samples (32,
To directly test the hypothesis that predator extirpation 34). We also quantified the digestible-energy and -protein
has promoted utilization of open habitat by bushbuck, we ex- contents of foliage from Gorongosa’s most common browse
perimentally assessed the responses of GPS-collared flood- plants. Of the 51 molecular operational taxonomic units (mO-
plain (n = 7) and woodland (n = 5) bushbuck to simulated TUs) identified in bushbuck diets, 22 matched plant species
predator presence in August-September 2016. Habitat affilia- for which we had nutritional-quality data, and those 22 spe-
tions were determined based on capture location and subse- cies accounted for >83% of total diet [measured as the rela-
quently verified using GPS-collar locations and diet- tive read abundance, RRA, of those mOTUs across all samples
composition data (figs. S1 and S2). We exposed each individ- (32)]. We calculated weighted averages of digestible energy
ual to both predator and procedural-control cues in separate and protein in the diet of each sampled bushbuck, using the
trials (in randomized order), with collars recording locations RRA of each plant species as the weighting factor. We quan-
every 15 min (32). Treatments comprised both auditory and tified body condition of captured individuals by using princi-
scent cues within the home range of each collared individual pal component analysis to reduce multiple measurements of
(fig. S3). Because both felids and canids prey on bushbuck, bushbuck morphology (e.g., body mass, length, fat and mus-
we aimed to create generalized hotspots of perceived preda- cle thickness, and standardized palpation scores) to two indi-
tion risk by deploying several cues that collectively simulated ces of condition: body size and body fat (32) (fig. S6 and
First release: 7 March 2019 www.sciencemag.org (Page numbers not final at time of first release) 2tables S4 and S5). uncaged plants, but did not change in caged plants (Fig. 4B
We found pronounced differences in diet composition be- and table S7). Similarly, mean leaf number increased in caged
tween floodplain and woodland bushbuck (Fig. 3A and fig. plants but decreased in uncaged plants (Fig. 4C). Mean flower
S2). The diets of floodplain bushbuck (21 mOTUs) were dom- number, height, and canopy area at the conclusion of the ex-
inated by the leguminous shrub Mimosa pigra (mean RRA = periment were all significantly greater in caged plants (Fig. 4
74% ± 11) (Fig. 3B and fig. S2), with the forbs Bergia mos- and table S7). Thus, expansion of bushbuck into open habi-
sambicensis (Elatinaceae; syn. B. salaria) and Ludwigia ad- tats was accompanied by strong suppression of growth and
scendens (Onagraceae; syn. L. stolonifera) accounting for an reproduction in Bergia. Although other floodplain herbivores
additional 11% and 3% of RRA, respectively. These plants had may have contributed somewhat to this effect, only bushbuck
relatively high crude-protein and digestible-energy contents consumed substantial quantities of Bergia (Fig. 4A), suggest-
(fig. S2C,D). The diets of woodland bushbuck (36 mOTUs) ing that this plant would otherwise find refuge from large-
had greater evenness: two tree species, Berchemia discolor mammal herbivory in the floodplain.
and Diospyros sp., accounted for 44% of RRA (Fig. 3B), and Altogether, our results provide evidence that the extirpa-
both had lower crude-protein and digestible energy than M. tion of large carnivores following the Mozambican Civil War
pigra and most other floodplain food plants (fig. S2C,D). has disrupted a behaviorally mediated trophic cascade. In the
Downloaded from http://science.sciencemag.org/ on March 7, 2019
Overall, floodplain-bushbuck diets were 8.8% and 83.6% absence of apex predators such as leopards and wild dogs, a
richer in digestible energy and protein, respectively, than common ungulate prey species rapidly expanded into a high-
woodland-bushbuck diets (Fig. 3, C and D). Consistent with risk/high-reward habitat, with concomitant shifts in diet
these differences in diet quality, floodplain bushbuck were in composition and quality, body size and condition, and the
better condition than woodland bushbuck, with significantly performance of a key food plant. Despite the multi-decadal
higher scores for the body-size/PC1 index (table S6). The nu- absence of key apex predators in Gorongosa, we found that
tritional value of the most heavily utilized plant, M. pigra, bushbuck retained fear of these carnivores (7, 12): experi-
may help to promote floodplain use by bushbuck, but this mental imposition of risk cues over just 48 hours shifted hab-
factor alone does not provide a plausible alternative explana- itat use toward patterns that prevailed prior to carnivore loss
tion for the long-term shift in habitat use. Mimosa pigra was (30). The next phase of trophic rewilding in Gorongosa in-
also present on the floodplain prior to predator extirpation volves carnivore reintroductions (23), beginning in 2018 with
(30), with availability similar to that at the time of this study; 14 wild dogs, which should eventually enable tests of our pre-
if this plant drove habitat use independently of predation diction that bushbuck will vacate the floodplain. It is note-
risk, then bushbuck should have been utilizing the floodplain worthy that the relaxation of risk following carnivore
during the pre-war era as well. The relative influences of risk extirpation differentially affected individual behavior within
and resource quality on bushbuck habitat use could in prin- a population, leading to bimodality in habitat use and per-
ciple be quantified by removing M. pigra at large scales; we haps some degree of reproductive separation, which could
hypothesize that this would reduce carrying capacity but not amplify pre-existing individual variation (35). The influence
expel bushbuck from these areas. of carnivores on behavioral variation within ungulate popu-
In a final experiment, we tested whether the expansion of lations, and its potential evolutionary significance, remains
bushbuck into the floodplain has measurable effects on flood- largely unexplored.
plain plants. Plant-community responses to herbivory can be Our study supports the general hypothesis that the loss of
tested using exclosures, but it would be impossible to parse top carnivores can convert landscapes of fear into landscapes
the effects of bushbuck relative to those of other floodplain of fearlessness for large mammalian herbivores, with far-
ungulates with overlapping diets. Thus, to isolate the effects reaching consequences for prey and plant populations (6). It
of bushbuck, we used our diet analysis to identify an indica- further shows that the effects of fear depend on the social,
tor plant species utilized almost exclusively by bushbuck. The foraging, and anti-predator behaviors of the species involved.
waterwort B. mossambicensis was the second-most abundant Whereas recent work has shown that gregarious, flight-de-
taxon in the diets of floodplain bushbuck, but was negligible pendent grazers and mixed feeders utilize open, high-visibil-
(≤1% RRA) in the diets of all other floodplain herbivores (Fig. ity habitat for risk avoidance (11, 13), our study of a solitary,
4A). We constructed wire-mesh herbivore exclosures around crypsis-dependent browser reveals an opposing pattern. This
Bergia plants in a randomized, paired caged-uncaged design distinction was appreciated by early naturalists [(36), pp. 32–
(fig. S7) at two different floodplain sites [15 total pairs (32)]. 33]:
Prior to the experiment, and again after a minimum of 16
days, we measured the dimensions of each plant and counted It is curious to note the different ideas of safety entertained respectively
by the plain and the bush dweller. Let us say a Grant’s gazelle and a
all leaves, flowers, and browsed stems. The percentage of
bushbuck are grazing near each other on the edge of a plain when some-
browsed stems per plant increased during the experiment in thing occurs to alarm them. The bushbuck lopes quickly back into the
First release: 7 March 2019 www.sciencemag.org (Page numbers not final at time of first release) 3bush, sure that in this lies his only chance of safety. The Grant’s turns 17. B. L. Allen, P. J. S. Fleming, L. R. Allen, R. M. Engeman, G. Ballard, L. K.-P. Leung,
and gallops from the bush as if it were some deadly thing . . . . As clear as mud: A critical review of evidence for the ecological roles of Australian
dingoes. Biol. Conserv. 159, 158–174 (2013). doi:10.1016/j.biocon.2012.12.004
Thus, although generalizations about trophic cascades in- 18. J. Winnie Jr., S. Creel, The many effects of carnivores on their prey and their
volving particular species and food chains may be possible implications for trophic cascades, and ecosystem structure and function. Food
Webs 12, 88–94 (2017). doi:10.1016/j.fooweb.2016.09.002
based on characteristics such as herbivore size, behavior (37, 19. A. T. Ford, J. R. Goheen, Trophic cascades by large carnivores: A case for strong
38), and predator hunting mode (39), we suggest that com- inference and mechanism. Trends Ecol. Evol. 30, 725–735 (2015).
munity-wide cascades may be dampened in diverse African doi:10.1016/j.tree.2015.09.012 Medline
large-mammal assemblages due to the orthogonal responses 20. J. Terborgh, L. Lopez, P. Nuñez, M. Rao, G. Shahabuddin, G. Orihuela, M. Riveros,
R. Ascanio, G. H. Adler, T. D. Lambert, L. Balbas, Ecological meltdown in predator-
of different herbivore species to predation risk (40). free forest fragments. Science 294, 1923–1926 (2001).
REFERENCES AND NOTES doi:10.1126/science.1064397 Medline
1. J. A. Estes, J. Terborgh, J. S. Brashares, M. E. Power, J. Berger, W. J. Bond, S. R. 21. M. E. Stalmans, T. J. Massad, M. J. S. Peel, C. E. Tarnita, R. M. Pringle, PLOS ONE
Carpenter, T. E. Essington, R. D. Holt, J. B. C. Jackson, R. J. Marquis, L. Oksanen, 10.1371/journal.pone.0212864 (2019).
T. Oksanen, R. T. Paine, E. K. Pikitch, W. J. Ripple, S. A. Sandin, M. Scheffer, T. W. 22. J. H. Daskin, M. Stalmans, R. M. Pringle, Ecological legacies of civil war: 35-year
Schoener, J. B. Shurin, A. R. E. Sinclair, M. E. Soulé, R. Virtanen, D. A. Wardle, increase in savanna tree cover following wholesale large-mammal declines. J.
Trophic downgrading of planet Earth. Science 333, 301–306 (2011). Ecol. 104, 79–89 (2016). doi:10.1111/1365-2745.12483
23. R. M. Pringle, Upgrading protected areas to conserve wild biodiversity. Nature
Downloaded from http://science.sciencemag.org/ on March 7, 2019
doi:10.1126/science.1205106 Medline
2. W. J. Ripple, J. A. Estes, R. L. Beschta, C. C. Wilmers, E. G. Ritchie, M. Hebblewhite, 546, 91–99 (2017). doi:10.1038/nature22902 Medline
J. Berger, B. Elmhagen, M. Letnic, M. P. Nelson, O. J. Schmitz, D. W. Smith, A. D. 24. P. Bouley, M. Poulos, R. Branco, N. H. Carter, Post-war recovery of the African lion
Wallach, A. J. Wirsing, Status and ecological effects of the world’s largest in response to large-scale ecosystem restoration. Biol. Conserv. 227, 233–242
carnivores. Science 343, 1241484 (2014). doi:10.1126/science.1241484 Medline (2018). doi:10.1016/j.biocon.2018.08.024
3. J. Terborgh, J. A. Estes, Eds., Trophic Cascades: Predators, Prey and the Changing 25. M. Stalmans, R. Beilfuss, “Landscapes of the Gorongosa National Park”
Dynamics of Nature (Island Press, 2010). (Gorongosa National Park, 2008).
4. J. A. Estes, J. F. Palmisano, Sea otters: Their role in structuring nearshore 26. J. Kingdon, The Kingdon Field Guide to African Mammals (Bloomsbury, ed. 2,
communities. Science 185, 1058–1060 (1974). 2015).
doi:10.1126/science.185.4156.1058 Medline 27. R. D. Estes, The Safari Companion: A Guide to Watching African Mammals (Chelsea
5. J. S. Brown, J. W. Laundre, M. Gurung, The ecology of fear: Optimal foraging, game Green, ed. 2, 1999).
theory, and trophic interactions. J. Mammal. 80, 385–399 (1999). 28. R. D. Estes, The Behavior Guide to African Mammals (Univ. of California Press,
doi:10.2307/1383287 1991).
6. J. W. Laundré, L. Hernandez, W. J. Ripple, The landscape of fear: Ecological 29. F. G. T. Radloff, J. T. Du Toit, Large predators and their prey in a southern African
implications of being afraid. Open Ecol. J. 3, 1–7 (2010). savanna: A predator’s size determines its prey size range. J. Anim. Ecol. 73, 410–
doi:10.2174/1874213001003030001 423 (2004). doi:10.1111/j.0021-8790.2004.00817.x
7. J. Berger, J. E. Swenson, I. L. Persson, Recolonizing carnivores and naïve prey: 30. K. L. Tinley, thesis, University of Pretoria, Pretoria, South Africa (1977).
Conservation lessons from Pleistocene extinctions. Science 291, 1036–1039 31. S. D. Fretwell, H. L. J. Lucas Jr., On territorial behavior and other factors influencing
(2001). doi:10.1126/science.1056466 Medline habitat distribution in birds. Acta Biotheor. 19, 16–36 (1969).
8. B. L. Peckarsky, P. A. Abrams, D. I. Bolnick, L. M. Dill, J. H. Grabowski, B. Luttbeg, J. doi:10.1007/BF01601953
L. Orrock, S. D. Peacor, E. L. Preisser, O. J. Schmitz, G. C. Trussell, Revisiting the 32. Materials and methods are available as supplementary materials.
classics: Considering nonconsumptive effects in textbook examples of predator- 33. A. T. Ford, J. R. Goheen, An experimental study on risk effects in a dwarf antelope,
prey interactions. Ecology 89, 2416–2425 (2008). doi:10.1890/07-1131.1 Medline Madoqua guentheri. J. Mammal. 96, 918–926 (2015).
9. G. C. Trussell, P. J. Ewanchuk, C. M. Matassa, The fear of being eaten reduces doi:10.1093/jmammal/gyv090
energy transfer in a simple food chain. Ecology 87, 2979–2984 (2006). 34. J. Pansu, J. A. Guyton, A. B. Potter, J. L. Atkins, J. H. Daskin, B. Wursten, T. R.
doi:10.1890/0012-9658(2006)87[2979:TFOBER]2.0.CO;2 Medline Kartzinel, R. M. Pringle, Trophic ecology of large herbivores in a reassembling
10. O. J. Schmitz, V. Krivan, O. Ovadia, Trophic cascades: The primacy of trait- African ecosystem. J. Ecol. 10.1111/1365-2745.13113 (2018). doi:10.1111/1365-
mediated indirect interactions. Ecol. Lett. 7, 153–163 (2004). doi:10.1111/j.1461- 2745.13113
0248.2003.00560.x 35. D. I. Bolnick, R. Svanbäck, J. A. Fordyce, L. H. Yang, J. M. Davis, C. D. Hulsey, M. L.
11. A. T. Ford, J. R. Goheen, T. O. Otieno, L. Bidner, L. A. Isbell, T. M. Palmer, D. Ward, Forister, The ecology of individuals: Incidence and implications of individual
R. Woodroffe, R. M. Pringle, Large carnivores make savanna tree communities specialization. Am. Nat. 161, 1–28 (2003). doi:10.1086/343878 Medline
less thorny. Science 346, 346–349 (2014). doi:10.1126/science.1252753 Medline 36. C. H. Stigand, The Game of British East Africa (Horace Cox, 1909).
12. J. P. Suraci, M. Clinchy, L. M. Dill, D. Roberts, L. Y. Zanette, Fear of large carnivores 37. P. J. Jarman, The social organisation of antelope in relation to their ecology.
causes a trophic cascade. Nat. Commun. 7, 10698 (2016). Behaviour 48, 215–267 (1974). doi:10.1163/156853974X00345
doi:10.1038/ncomms10698 Medline 38. K. P. Dial, E. Greene, D. J. Irschick, Allometry of behavior. Trends Ecol. Evol. 23,
13. E. le Roux, G. I. H. Kerley, J. P. G. M. Cromsigt, Megaherbivores modify trophic 394–401 (2008). doi:10.1016/j.tree.2008.03.005 Medline
cascades triggered by fear of predation in an african savanna ecosystem. Curr. 39. O. J. Schmitz, Effects of predator hunting mode on grassland ecosystem function.
Biol. 28, 2493–2499.e3 (2018). doi:10.1016/j.cub.2018.05.088 Medline Science 319, 952–954 (2008). doi:10.1126/science.1152355 Medline
14. W. J. Ripple, E. J. Larsen, R. A. Renkin, D. W. Smith, Trophic cascades among 40. N. Owen-Smith, Mechanisms of coexistence in diverse herbivore-carnivore
wolves, elk and aspen on Yellowstone National Park’s northern range. Biol. assemblages: Demographic, temporal and spatial heterogeneities affecting prey
Conserv. 102, 227–234 (2001). doi:10.1016/S0006-3207(01)00107-0 vulnerability. Oikos 124, 1417–1426 (2015). doi:10.1111/oik.02218
15. D. Fortin, H. L. Beyer, M. S. Boyce, D. W. Smith, T. Duchesne, J. S. Mao, Wolves 41. J. L. Atkins, R. A. Long, J. Pansu, J. H. Daskin, A. B. Potter, M. E. Stalmans, C. E.
influence elk movements: Behavior shapes a trophic cascade in Yellowstone Tarnita, R. M. Pringle, Data for “Cascading impacts of large-carnivore extirpation
National Park. Ecology 86, 1320–1330 (2005). doi:10.1890/04-0953 in an African ecosystem,” Dryad (2018).
16. M. J. Kauffman, J. F. Brodie, E. S. Jules, Are wolves saving Yellowstone’s aspen? A 42. F. Steinbruch, S. M. Weise, Analysis of water stable isotopes fingerprinting to
landscape-level test of a behaviorally mediated trophic cascade. Ecology 91, inform conservation management: Lake Urema Wetland System, Mozambique.
2742–2755 (2010). doi:10.1890/09-1949.1 Medline Phys. Chem. Earth 72–75, 13–23 (2014). doi:10.1016/j.pce.2014.09.007
First release: 7 March 2019 www.sciencemag.org (Page numbers not final at time of first release) 443. T. Wronski, A. Apio, M. Plath, C. Averbeck, Do ecotypes of bushbuck differ in doi:10.1111/j.1365-294X.2011.05317.x Medline
grouping patterns? Acta Ethol. 12, 71–78 (2009). doi:10.1007/s10211-009-0058- 67. N. G. Yoccoz, K. A. Bråthen, L. Gielly, J. Haile, M. E. Edwards, T. Goslar, H. Von
5 Stedingk, A. K. Brysting, E. Coissac, F. Pompanon, J. H. Sønstebø, C. Miquel, A.
44. P. Waser, Diurnal and nocturnal strategies of the bushbuck Tragelaphus scriptus Valentini, F. De Bello, J. Chave, W. Thuiller, P. Wincker, C. Cruaud, F. Gavory, M.
(Pallas). Afr. J. Ecol. 13, 49–63 (1975). doi:10.1111/j.1365-2028.1975.tb00123.x Rasmussen, M. T. P. Gilbert, L. Orlando, C. Brochmann, E. Willerslev, P. Taberlet,
45. R. Allsopp, Social biology of bushbuck (Tragelaphus scriptus Pallas 1776) in the DNA from soil mirrors plant taxonomic and growth form diversity. Mol. Ecol. 21,
Nairobi National Park, Kenya. Afr. J. Ecol. 16, 153–165 (1978). doi:10.1111/j.1365- 3647–3655 (2012). doi:10.1111/j.1365-294X.2012.05545.x Medline
2028.1978.tb00436.x 68. J. Pansu, C. Giguet-Covex, G. F. Ficetola, L. Gielly, F. Boyer, L. Zinger, F. Arnaud, J.
46. T. Wronski, A. Apio, M. Plath, Activity patterns of bushbuck (Tragelaphus scriptus) Poulenard, P. Taberlet, P. Choler, Reconstructing long-term human impacts on
in Queen Elizabeth National Park. Behav. Processes 73, 333–341 (2006). plant communities: An ecological approach based on lake sediment DNA. Mol.
doi:10.1016/j.beproc.2006.08.003 Medline Ecol. 24, 1485–1498 (2015). doi:10.1111/mec.13136 Medline
47. G. Vasse, Three Years’ Sport in Mozambique (Sir Isaac Pitman and Sons, 1909). 69. J. Binladen, M. T. P. Gilbert, J. P. Bollback, F. Panitz, C. Bendixen, R. Nielsen, E.
48. M. W. Hayward, G. I. H. Kerley, Prey preferences of the lion (Panthera leo). J. Zool. Willerslev, The use of coded PCR primers enables high-throughput sequencing of
267, 309–322 (2005). doi:10.1017/S0952836905007508 multiple homolog amplification products by 454 parallel sequencing. PLOS ONE
49. M. W. Hayward, G. Kerley, Prey preferences and dietary overlap amongst Africa’s 2, e197 (2007). doi:10.1371/journal.pone.0000197 Medline
large predators. S. Afr. J. Wildl. Res 38, 93–108 (2008). doi:10.3957/0379-4369- 70. G. F. Ficetola, J. Pansu, A. Bonin, E. Coissac, C. Giguet-Covex, M. De Barba, L.
38.2.93 Gielly, C. M. Lopes, F. Boyer, F. Pompanon, G. Rayé, P. Taberlet, Replication levels,
50. R. S. Sikes, W. L. Gannon; The Animal Care and Use Committee of the American false presences and the estimation of the presence/absence from eDNA
Society of Mammalogists, Guidelines of the American Society of Mammalogists metabarcoding data. Mol. Ecol. Resour. 15, 543–556 (2015). doi:10.1111/1755-
Downloaded from http://science.sciencemag.org/ on March 7, 2019
for the use of wild mammals in research. J. Mammal. 92, 235–253 (2011). 0998.12338 Medline
doi:10.1644/10-MAMM-F-355.1 71. F. Boyer, C. Mercier, A. Bonin, Y. Le Bras, P. Taberlet, E. Coissac, obitools: A unix-
51. K. Bjørneraas, B. Van Moorter, C. M. Rolandsen, I. Herfindal, Screening Global inspired software package for DNA metabarcoding. Mol. Ecol. Resour. 16, 176–182
Positioning System location data for errors using animal movement (2016). doi:10.1111/1755-0998.12428 Medline
characteristics. J. Wildl. Manage. 74, 1361–1366 (2010). doi:10.1111/j.1937- 72. G. F. Ficetola, E. Coissac, S. Zundel, T. Riaz, W. Shehzad, J. Bessière, P. Taberlet,
2817.2010.tb01258.x F. Pompanon, An in silico approach for the evaluation of DNA barcodes. BMC
52. Z. Burns, thesis, Princeton University (2010). Genomics 11, 434 (2010). doi:10.1186/1471-2164-11-434 Medline
53. D. M. Ferrero, J. K. Lemon, D. Fluegge, S. L. Pashkovski, W. J. Korzan, S. R. Datta, 73. G. Csárdi, T. Nepusz, The igraph software package for complex network research.
M. Spehr, M. Fendt, S. D. Liberles, Detection and avoidance of a carnivore odor by InterJournal 2006, 1695 (2006).
prey. Proc. Natl. Acad. Sci. U.S.A. 108, 11235–11240 (2011). 74. L. Zinger, J. Chave, E. Coissac, A. Iribar, E. Louisanna, S. Manzi, V. Schilling, H.
doi:10.1073/pnas.1103317108 Medline Schimann, G. Sommeria-Klein, P. Taberlet, Extracellular DNA extraction is a fast,
54. A. M. Hettena, N. Munoz, D. T. Blumstein, Prey responses to predator’s sounds: A cheap and reliable alternative for multi-taxa surveys based on soil DNA. Soil Biol.
review and empirical study. Ethology 120, 427–452 (2014). doi:10.1111/eth.12219 Biochem. 96, 16–19 (2016). doi:10.1016/j.soilbio.2016.01.008
55. K. McComb, C. Packer, A. E. Pusey, Roaring and numerical assessment in contests 75. E. Willerslev, J. Davison, M. Moora, M. Zobel, E. Coissac, M. E. Edwards, E. D.
between groups of female lions, Panthera leo. Anim. Behav. 47, 379–387 (1994). Lorenzen, M. Vestergård, G. Gussarova, J. Haile, J. Craine, L. Gielly, S.
doi:10.1006/anbe.1994.1052 Boessenkool, L. S. Epp, P. B. Pearman, R. Cheddadi, D. Murray, K. A. Bråthen, N.
56. C. A. Kardous, P. B. Shaw, Evaluation of smartphone sound measurement Yoccoz, H. Binney, C. Cruaud, P. Wincker, T. Goslar, I. G. Alsos, E. Bellemain, A. K.
applications. J. Acoust. Soc. Am. 135, EL186–EL192 (2014). Brysting, R. Elven, J. H. Sønstebø, J. Murton, A. Sher, M. Rasmussen, R. Rønn, T.
doi:10.1121/1.4865269 Medline Mourier, A. Cooper, J. Austin, P. Möller, D. Froese, G. Zazula, F. Pompanon, D.
57. J. Grinnell, K. McComb, Roaring and social communication in African lions: The Rioux, V. Niderkorn, A. Tikhonov, G. Savvinov, R. G. Roberts, R. D. E. MacPhee, M.
limitations imposed by listeners. Anim. Behav. 62, 93–98 (2001). T. P. Gilbert, K. H. Kjær, L. Orlando, C. Brochmann, P. Taberlet, Fifty thousand
doi:10.1006/anbe.2001.1735 years of Arctic vegetation and megafaunal diet. Nature 506, 47–51 (2014).
58. A. F. Zuur, E. N. Ieno, N. J. Walker, A. A. Saveliev, G. M. Smith, Mixed Effects Models doi:10.1038/nature12921 Medline
and Extensions in Ecology with R (Springer, 2009). 76. J. M. Craine, E. G. Towne, M. Miller, N. Fierer, Climatic warming and the future of
59. J. Pinheiro, D. Bates, S. DebRoy, D. Sarkar, R Core Team, nlme: Linear and bison as grazers. Sci. Rep. 5, 16738 (2015). doi:10.1038/srep16738
nonlinear mixed effects models (2017). 77. B. E. Deagle, A. C. Thomas, J. C. McInnes, L. J. Clarke, E. J. Vesterinen, E. L. Clare,
60. B. Kranstauber, M. Smolla, Move: Visualizing and analyzing animal track data. R T. R. Kartzinel, J. P. Eveson, Counting with DNA in metabarcoding studies: How
package version 2.1.0 (2016). should we convert sequence reads to dietary data? Mol. Ecol. 28, 391–406 (2019).
61. R. J. Hijmans, J. van Etten, raster: Geographic analysis and modeling with raster doi:10.1111/mec.14734
data (2012). 78. T. Carlsen, A. B. Aas, D. Lindner, T. Vrålstad, T. Schumacher, H. Kauserud, Don’t
62. E. J. Pebesma, R. S. Bivand, Classes and methods for spatial data in R. R News 5 make a mista(g)ke: Is tag switching an overlooked source of error in amplicon
(2), 9–13 (2005); https://cran.r-project.org/doc/Rnews/. pyrosequencing studies? Fungal Ecol. 5, 747–749 (2012).
63. R. S. Bivand, E. Pebesma, V. Gomez-Rubio, Applied Spatial Data Analysis with R doi:10.1016/j.funeco.2012.06.003
(Springer, ed. 2, 2013). 79. I. B. Schnell, K. Bohmann, M. T. P. Gilbert, Tag jumps illuminated—Reducing
64. P. Taberlet, E. Coissac, F. Pompanon, L. Gielly, C. Miquel, A. Valentini, T. Vermat, sequence-to-sample misidentifications in metabarcoding studies. Mol. Ecol.
G. Corthier, C. Brochmann, E. Willerslev, Power and limitations of the chloroplast Resour. 15, 1289–1303 (2015). doi:10.1111/1755-0998.12402 Medline
trnL (UAA) intron for plant DNA barcoding. Nucleic Acids Res. 35, e14 (2007). 80. D. Borcard, F. Gillet, P. Legendre, Numerical Ecology with R (Springer, 2011).
doi:10.1093/nar/gkl938 Medline 81. C. T. Robbins, S. Mole, A. E. Hagerman, T. A. Hanley, Role of tannins in defending
65. T. R. Kartzinel, P. A. Chen, T. C. Coverdale, D. L. Erickson, W. J. Kress, M. L. plants against ruminants: Reduction in dry matter digestion? Ecology 68, 1606–
Kuzmina, D. I. Rubenstein, W. Wang, R. M. Pringle, DNA metabarcoding illuminates 1615 (1987). doi:10.2307/1939852 Medline
dietary niche partitioning by African large herbivores. Proc. Natl. Acad. Sci. U.S.A. 82. C. T. Robbins, T. A. Hanley, A. E. Hagerman, O. Hjeljord, D. L. Baker, C. C. Schwartz,
112, 8019–8024 (2015). doi:10.1073/pnas.1503283112 Medline W. W. Mautz, Role of tannins in defending plants against ruminants: Reduction in
66. P. Taberlet, S. M. Prud’Homme, E. Campione, J. Roy, C. Miquel, W. Shehzad, L. protein availability. Ecology 68, 98–107 (1987). doi:10.2307/1938809
Gielly, D. Rioux, P. Choler, J.-C. Clément, C. Melodelima, F. Pompanon, E. Coissac, 83. R Core Team, R: A language and environment for statistical computing (2013);
Soil sampling and isolation of extracellular DNA from large amount of starting http://www.r-project.org/.
material suitable for metabarcoding studies. Mol. Ecol. 21, 1816–1820 (2012). 84. R. C. Cook, J. G. Cook, T. R. Stephenson, W. L. Myers, S. M. Mccorquodale, D. J.
First release: 7 March 2019 www.sciencemag.org (Page numbers not final at time of first release) 5Vales, L. L. Irwin, P. B. Hall, R. D. Spencer, S. L. Murphie, K. A. Schoenecker, P. J.
Miller, Revisions of rump fat and body scoring indices for deer, elk, and moose. J.
Wildl. Manage. 74, 880–896 (2010). doi:10.2193/2009-031
85. R. A. Long, R. T. Bowyer, W. P. Porter, P. Mathewson, K. L. Monteith, J. G. Kie,
Behavior and nutritional condition buffer a large-bodied endotherm against direct
and indirect effects of climate. Ecol. Monogr. 84, 513–532 (2014). doi:10.1890/13-
1273.1
86. M. Stalmans, M. Peel, “Aerial wildlife count of the Parque Nacional da Gorongosa,
Mozambique, October 2016” (Gorongosa National Park, 2016).
87. D. Bates, M. Mächler, B. Bolker, S. Walker, Fitting linear mixed-effects models
using lme4. J. Stat. Softw. 67, 1–48 (2015). doi:10.18637/jss.v067.i01
88. R. M. Pringle, 2017 (2017).
ACKNOWLEDGMENTS
We thank J. Guyton, G. Gibbons, M. Demmel, A. Becker, P. Bouley, R. Branco, L. Van
Wyk, C. Lencastro, the Gorongosa park staff, the Republic of Mozambique, and
five anonymous reviewers. Funding: We acknowledge support from the U.S.
National Science Foundation (IOS-1656527 and IOS-1656642), Cameron Schrier
Downloaded from http://science.sciencemag.org/ on March 7, 2019
Foundation, Carr Foundation, Parque Nacional da Gorongosa, and Princeton
University. Author contributions: J.L.A., R.A.L., C.E.T., and R.M.P. conceived
and designed the study; J.L.A., R.A.L., J.P., A.B.P., M.E.S, and R.M.P. collected
data; J.L.A. performed and analyzed the field experiments; J.P. analyzed diet
data; J.H.D. performed satellite image classification; and J.L.A., R.A.L., C.E.T.,
and R.M.P. wrote the manuscript with input from all authors. Competing
interests: R.M.P. serves as an unpaid member of the Board of Directors of the
Gorongosa Project, a U.S. 501c3 nonprofit organization that oversees
conservation and restoration activities in Gorongosa National Park. Data and
materials availability: Data are archived in Dryad (41).
SUPPLEMENTARY MATERIALS
www.sciencemag.org/cgi/content/full/science.aau3561/DC1
Materials and Methods
Figs. S1 to S7
Tables S1 to S8
References (42–88)
2 June 2018; accepted 22 February 2019
Published online 7 March 2019
10.1126/science.aau3561
First release: 7 March 2019 www.sciencemag.org (Page numbers not final at time of first release) 6Downloaded from http://science.sciencemag.org/ on March 7, 2019
Fig. 1. Differential habitat use by bushbuck. (A) Map of Africa and Mozambique, showing the location of
Gorongosa National Park (B) with its major habitat zones (25), from left: western escarpment; savanna-
woodland (dark green); floodplain (light green); Lake Urema (white); eastern escarpment. (C) GPS-collar
locations from 11 individuals, three in floodplain (orange) and eight in woodland (blue), from June 2015 to March
2016. Solid line distinguishes boundary between floodplain and dense woodland; dashed line distinguishes
boundary between sparsely wooded floodplain-margin and treeless floodplain-grassland (25). (D) Bushbuck in
woodland (left), floodplain-margin (top right), and open floodplain-grassland (bottom right, courtesy B.
Kuxhausen). (E) Use of woody cover by the bushbuck in (C), measured as the proportion of locations falling
within a pixel classified as having tree cover (32). (F) Bushbuck densities in floodplain and woodland, 2002 to
2016, determined via six aerial helicopter counts (32); here, floodplain refers conservatively to the treeless area
surrounding Lake Urema [dashed line in (C)].
First release: 7 March 2019 www.sciencemag.org (Page numbers not final at time of first release) 7Downloaded from http://science.sciencemag.org/ on March 7, 2019
Fig. 2. Responses of floodplain and woodland bushbuck to simulated-predator and procedural-control
cues. Average change in (A) distance from cues (avoidance), and (B) proportional use of tree cover, for
bushbuck in woodland (n = 5) and floodplain (n = 7) habitats at night. Each bar (colored by habitat affiliation)
represents the average difference between the 48-hour pre-cue period and the 48-hour post-cue period across
all collared individuals in each category; error bars show ± 1 SE. Shading indicates experimental treatment, with
darker bars for the predator cues and lighter bars for the sham cues (see x-axis labels). P values from
generalized linear mixed models are shown above each bar, indicating whether each response differed
significantly from zero (see full model results in table S2).
First release: 7 March 2019 www.sciencemag.org (Page numbers not final at time of first release) 8Fig. 3. Differences in composition and
nutritional quality of bushbuck diets
across habitats. (A) Non-metric
multidimensional scaling ordination,
based on Bray-Curtis dissimilarities from
DNA-metabarcoding data, showing that
bushbuck diets clustered within each
habitat and diverged between them.
Distance between points (fecal samples;
n = 7 floodplain, 17 woodland) reflects
compositional dissimilarity. (B) The 10
most abundant food-plant taxa for
bushbuck in floodplain (orange bars) and
woodland (blue bars). (C) Mean
digestible energy and (D) protein content
of bushbuck diets, revealing higher diet
quality in floodplain individuals (Wilcoxon
Downloaded from http://science.sciencemag.org/ on March 7, 2019
rank-sum tests, energy: W = 76, n = 18, P
= 0.0001, protein: W = 77, n = 18, P <
0.0001). Error bars show ± 1 SE.
First release: 7 March 2019 www.sciencemag.org (Page numbers not final at time of first release) 9Downloaded from http://science.sciencemag.org/ on March 7, 2019
Fig. 4. Large herbivores suppress Bergia mossambicensis, a common floodplain plant. (A) Among all
floodplain herbivore species in Gorongosa, only bushbuck consumed substantial quantities of Bergia. Mean
change in (B) percent of stems browsed and (C) number of leaves per plant on caged versus uncaged Bergia
over a minimum of 16 days (maximum of 18 days). Herbivores also reduced (D) mean number of flowers per
plant, (E) mean height, and (F) mean canopy area at the conclusion of the experiment. For (D) to (F), there was
no significant difference in the initial values between caged and uncaged treatment groups. Model results of the
effects of herbivore exclusion on each response variable are presented in table S7. Error bars show ± 1 SE.
First release: 7 March 2019 www.sciencemag.org (Page numbers not final at time of first release) 10Cascading impacts of large-carnivore extirpation in an African ecosystem
Justine L. Atkins, Ryan A. Long, Johan Pansu, Joshua H. Daskin, Arjun B. Potter, Marc E. Stalmans, Corina E. Tarnita and Robert
M. Pringle
published online March 7, 2019
Downloaded from http://science.sciencemag.org/ on March 7, 2019
ARTICLE TOOLS http://science.sciencemag.org/content/early/2019/03/06/science.aau3561
SUPPLEMENTARY http://science.sciencemag.org/content/suppl/2019/03/06/science.aau3561.DC1
MATERIALS
REFERENCES This article cites 77 articles, 9 of which you can access for free
http://science.sciencemag.org/content/early/2019/03/06/science.aau3561#BIBL
PERMISSIONS http://www.sciencemag.org/help/reprints-and-permissions
Use of this article is subject to the Terms of Service
Science (print ISSN 0036-8075; online ISSN 1095-9203) is published by the American Association for the Advancement of
Science, 1200 New York Avenue NW, Washington, DC 20005. 2017 © The Authors, some rights reserved; exclusive licensee
American Association for the Advancement of Science. No claim to original U.S. Government Works. The title Science is a
registered trademark of AAAS.You can also read