Landscape and Urban Planning - Dexter Locke
←
→
Page content transcription
If your browser does not render page correctly, please read the page content below
Landscape and Urban Planning 185 (2019) 141–157

                                                                      Contents lists available at ScienceDirect

                                                            Landscape and Urban Planning
                                                    journal homepage: www.elsevier.com/locate/landurbplan

Research Paper

Greening in style: Urban form, architecture and the structure of front and                                                                                            T
backyard vegetation
                                 ⁎
Alessandro Ossolaa, , Dexter Lockeb, Brenda Linc, Emily Minord
a
  Centre for Smart Green Cities, Department of Biological Sciences, Macquarie University, North Ryde, Sydney, NSW 2109, Australia
b
  National Socio-Environmental Synthesis Center (SESYNC), 1 Park Pl., Annapolis, MD 21401, USA
c
  CSIRO Land and Water Flagship, Aspendale, VIC, Australia
d
  Department of Biological Sciences, Institute for Environmental Science and Policy, University of Illinois Chicago, 845 W. Taylor St., Chicago, IL 60607-7060, USA

A B S T R A C T

Residential yards comprise most land and green space across cities. Despite yards being ubiquitous, little comprehensive information exists on how vegetation varies
between front and backyards. This hinders our ability to optimize greening interventions on private urban land.
   We devised an accurate GIS algorithm to locate and classify front and backyards within residential landscapes. By applying this method to the greater Boston area,
we measured vegetation structure (i.e., canopy cover, height and volume) of front and backyards with LiDAR and multispectral imagery. We further investigated
relationships between urban form, architectural style, socio-economics, and the structure of front and backyard vegetation across Boston’s residential landscapes.
   Among the 85,732 residential parcels that were not corner lots and had cadastral and architectural data available, backyards were twice as large as front yards on
average and had significantly greater canopy cover, vegetation volume and taller trees. Parcel-level characteristics, including vegetation in the corresponding front or
backyard, as well as morphological characteristics of parcels, were the best predictors of vegetation structure. House architectural style was related to vegetation
structure. The neighborhood socio-economic characteristics were the least important factors in predicting yard vegetation structure.
   Our study highlights that urban greening in yards depends on urban form and morphology at the parcel scale, and as such, it could be enhanced through urban to
provide opportunities for additional vegetation. Architectural style might represent a further filter by which residents manage vegetation in their home environment,
making it possible to devise strategies to green our cities – in style.

1. Introduction                                                                                   affecting individual design preferences and attitudes toward residential
                                                                                                  landscaping (Locke, Roy Chowdhury, et al., 2018; Martin, Peterson, &
    Residential yards, the outdoor areas within residential parcels                               Stabler, 2003; Nassauer, Wang, & Dayrell, 2009). This is particularly
(Larson, Hoffman, & Ripplinger, 2017), often contain most of the green                             evident in front yards, the “more public” private spaces, where residents
space, vegetation, and trees in cities (Haase, Jänicke, & Wellmann,                               may feel more compelled to conform their landscaping to maintain an
2019; Lin, Meyers, & Barnett, 2015; Loram, Tratalos, Warren, & Gaston,                            appropriate public image and care for the local community (Nassauer,
2007). Yards have become important refuges for people, plants, and                                2011; Zmyslony & Gagnon, 1998). Often, front yard preferences align
wildlife within dense built landscapes and significant areas for the                               with the socio-cultural background of a community and change pre-
provision of ecosystem services (Cameron et al., 2012; Haaland &                                  dictably across neighborhoods based on their socio-economic char-
Konijnendijk, 2015; Lin et al., 2017).                                                            acteristics (Larsen & Harlan, 2006). Design and landscaping preferences
    Urban planning delineates urban form and morphology – the phy-                                of front and backyards are enacted though different management
sical layout of built-up areas – by allocating physical space between                             practices of these two urban spaces (Larsen & Harlan, 2006; Larson,
front and backyards based on the relative position of a house within a                            Casagrande, Harlan, & Yabiku, 2009; Nassauer et al., 2014). Yard
parcel and its street access. Discriminating between front and backyards                          management mostly affects vegetation. It is perhaps not surprising that
is not trivial, as residents’ yard use and aesthetic preferences often differ                      previous field studies found significant differences in vegetation char-
between these two spaces (Hess, 2008); the front yard represents a                                acteristics in front and backyards within the same parcel (Dorney,
“visible symbol of self”, whereas the backyard a “personal pleasure                               Guntenspergen, Keough, & Stearns, 1984; Richards, Mallette, Simpson,
ground” (Larsen & Harlan, 2006). Despite the individual dimension of                              & Macie, 1984; van Heezik, Freeman, Porter, & Dickinson, 2013).
residential yards, the social and cultural norms of a community, and                                  To further complicate this picture, architectural style and housing
even its regulations and informal rules, play an important role in                                type also define the character of a residential landscape, delineating

    ⁎
        Corresponding author.
        E-mail addresses: alessandro.ossola@mq.edu.au (A. Ossola), dexter.locke@gmail.com (D. Locke), Brenda.Lin@csiro.au (B. Lin), eminor@uic.edu (E. Minor).

https://doi.org/10.1016/j.landurbplan.2019.02.014
Received 3 November 2018; Received in revised form 4 February 2019; Accepted 10 February 2019
0169-2046/ Crown Copyright © 2019 Published by Elsevier B.V. All rights reserved.
A. Ossola, et al.                                                                                                 Landscape and Urban Planning 185 (2019) 141–157

neighborhood boundaries and the physical geography of the city (Fusch              expansion from an annexation of towns. In the early 20th century,
& Ford, 1983). The architectural style of a house primarily engenders              professionals asserted the ideals of city planning in the urban landscape
the symbol of a resident’s social and economic status, and its desir-              of Boston (Kennedy, 1992). High levels of immigration in the early 20th
ability for others (Cherulnik & Wilderman, 1986; Nasar, 1989). Lawns,              century led to an increased urban densification in the city center, with
gardens, and trees are often an integral part of house design and style,           many native Bostonians leaving for the suburbs. The modern era of
and as such, residents landscape their yard to highlight value and                 Boston’s planning and development history since the early 1980 s has
prestige of buildings and even discourage vandalism (Foster, Giles-                been characterized by revitalization to deal with changes in population
Corti, & Knuiman, 2011; Harris & Brown, 1996). Yard vegetation de-                 growth, economic prosperity, and social problems. To bring back order
fines the architectural space, and it has been linked to the ability of             and growth to the ailing city from the massive suburbanization, a vision
individuals to recall a building among many others through cognitive               for a “New Boston” was developed (O' Connor, 2001). As a result, Boston
mapping (Evans, Smith, & Pezdek, 1982; Smardon, 1988). Thus, while                 has one of greatest variety of architectural styles in the US. Compared to
it is reasonable to expect the house architectural style to be related to          many other US cities, the greater Boston area has higher residential
yard vegetation, limited support for this theory has been found to date            cover (47.33% of land) and urban vegetation cover (35.38%) (Ossola &
(Nassauer et al., 2009).                                                           Hopton, 2018a). However, attempts to further increase Boston’s vege-
     Overall, most of the current empirical evidence about yard vegeta-            tation cover, particularly in underserved areas downtown, had little
tion structural characteristics comes from a small number of field stu-             success due to poor governance and limited funding (Foo, McCarthy, &
dies, performed in a limited number of parcels and neighborhoods.                  Bebbington, 2018). Boston has a humid continental climate with cold
Furthermore, most vegetation studies of residential yards have been                winters, and hot and wet summers (mean annual temperature = 9.6 °C;
limited to front yards because of the restricted access to the back of the         mean annual precipitation = 1233 mm) (PRISM Climate Group, 2015).
house (Threlfall et al., 2016; Zmyslony & Gagnon, 1998). Current
limitations have made it difficult to quantify the full extent of urban              2.2. Open data sources
greening (especially the design, management, and structure of front and
backyards), the multi-scalar factors that underpin urban greening, and                 We obtained residential parcel polygons and cadastral data,
how these translate into ecological functions and services (Cook, Hall, &          building footprints, and road centerlines from the open data portal of
Larson, 2012; Lin et al., 2017; Locke, Avolio, et al., 2018). Ultimately,          the Commonwealth of Massachusetts (2017) for 41 municipalities and
there is a clear need to study residential yards at a resolution that              from data portal of the City of Boston (2017). Residential parcels con-
matches individual management and design choices, which means                      taining 4 or more residential buildings, multiple units, flats, deckers,
differentiating between front and backyards and clarifying factors af-              apartment blocks, condominiums and mixed-use parcels were excluded
fecting vegetation at the parcel and yard scale (Locke, Avolio, et al.,            from analyses as they lack defined front and backyards and may have
2018; Locke, Roy Chowdhury, et al., 2018). This will allow urban                   multiple land managers. We obtained LiDAR data for the year 2014
planners to design urban space functional for people and biodiversity              from the US Geological Survey (“MA Post-Sandy CMPG 2013–14” point
(Belaire, Westphal, & Minor, 2016; Beninde, Veith, & Hochkirch, 2015).             cloud dataset, nominal point spacing 0.7 m, vertical accuracy 0.05 m,
     A better understanding of how urban vegetation structure changes              horizontal accuracy 0.35 m). High-resolution imagery (1 m) in the
across urban landscapes is needed, as this structure dictates ecological           visible and near-infrared spectra for the year 2014 was obtained from
functioning (Ossola, Hahs, & Livesley, 2015; Ossola, Hahs, Nash, &                 the National Agriculture Imagery Program (NAIP) led by the US De-
Livesley, 2016), and benefits for people and biodiversity (Goddard,                 partment of Agriculture (USDA). We obtained socio-economic variables
Dougill, & Benton, 2013; Ossola, Nash, Christie, Hahs, & Livesley, 2015;           (n = 37) for 193 census tracts in the study area from the Census Bureau
Smith, Warren, Thompson, & Gaston, 2006). In this study, we address                (2010). These variables are routinely used in studies on urban canopy
this need by devising a new method to locate and classify front and                cover and structure (Bigsby, McHale, & Hess, 2014; Locke, Landry,
backyards across residential neighborhoods within the greater Boston               Grove, & Roy Chowdhury, 2016; Ossola & Hopton, 2018a, 2018b) and
area. We further measure how vegetation structure varies across non-               relate to neighborhood demographics, urban historical development
corner residential yards (n = 85,732 parcels, n = 171,464 yards) by                (e.g., number of buildings developed per decade), housing, income,
addressing the following questions and hypotheses:                                 education, employment and social inequality (Appendix A).

1- Are there differences in vegetation structure between front and                  2.3. Geospatial analyses
   backyards? We first hypothesize backyards to have greater vegeta-
   tion structure than front yards (i.e., higher canopy cover, height and              Front and backyards, or corner yards, for each residential parcel
   volume), as residents may prefer front yards with extensive lawns               were geolocated and classified by using the following algorithm in
   and simple vegetation.                                                          ArcGIS Desktop 10.5 (ESRI, Redlands, CA). The centroid of the largest
2- How do differences in front and backyard vegetation relate to urban              building in each residential parcel was identified. We assumed the
   form, architectural style and neighborhood socio-economic char-                 largest structure was the main residential building, as opposed to other
   acteristics? Here we test a second hypothesis that the house archi-             non-residential structures (e.g., garage, garden shed). For each of those
   tectural style is related to the structure of yard vegetation, as it            centroids, a line perpendicular to the street centerline was drawn. Then
   might affect residents’ planting and landscaping decisions.                      a second perpendicular line to the newly created line was drawn, pas-
                                                                                   sing through the building centroid, and extending to the parcel’s lateral
   We then discuss the implications of our results for urban planning              boundaries. The second line was used to split each parcel polygon into
and greening interventions.                                                        front and backyards. All building footprints within a parcel were further
                                                                                   subtracted to define the geometry of yards. The yard strips between the
2. Methods                                                                         lateral sides of the main residential building and the parcel lateral sides
                                                                                   were split evenly between paired front and backyard. Residential par-
2.1. Study area                                                                    cels located within 15 m from road intersections were classified as
                                                                                   corner parcels. As these parcels lay at the intersection between two or
    The study area comprises the city of Boston and 41 adjacent mu-                more streets, a clear distinction between front and backyards in these
nicipalities in the greater Boston area (land area: 501 km2; population:           parcels is not possible (Fig. 1). Thus, corner parcels and yards therein
1,569,000 inhabitants). Founded in 1630, Boston is one of the oldest US            (n = 44,336) were excluded from the study (Fig. 1, Appendix E).
cities. From 1880 to 1920, Boston experienced significant growth and                    Accuracy of the yard classification algorithm was calculated by

                                                                             142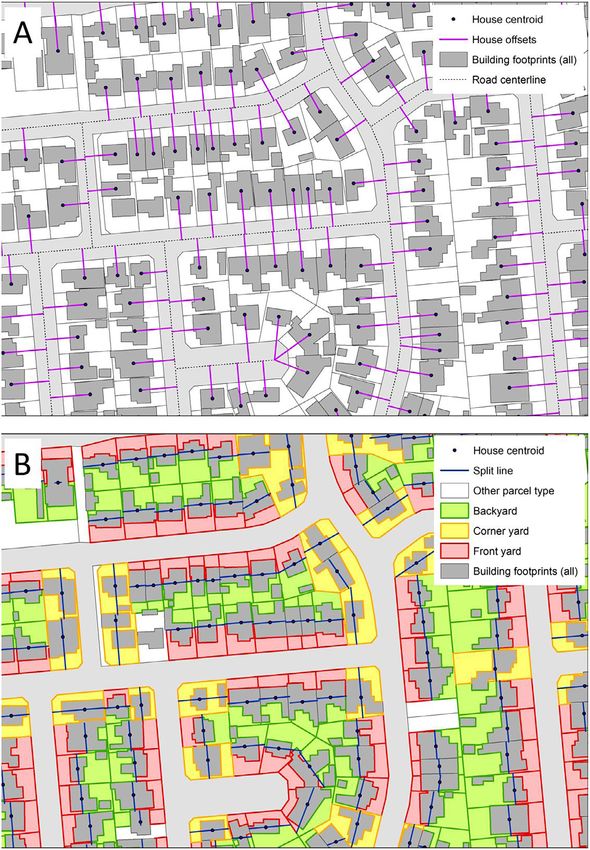
A. Ossola, et al.                                                                                                 Landscape and Urban Planning 185 (2019) 141–157

                                                                                                                     Fig. 1. Algorithm workflow used to geo-
                                                                                                                     locate and classify yards in residential
                                                                                                                     neighborhoods as back, front, and corner
                                                                                                                     yards (green, red, and yellow, respec-
                                                                                                                     tively). First the centroid for the largest
                                                                                                                     building foot print for each parcel (called
                                                                                                                     “House centroid”, in purple) was calcu-
                                                                                                                     lated. Then a house offset line was created
                                                                                                                     perpendicular to closest road centerline
                                                                                                                     (A). Next, a parcel split line (in blue) was
                                                                                                                     created perpendicular to the house offset
                                                                                                                     line and passing through the house cen-
                                                                                                                     troid, which divides the parcel in to two
                                                                                                                     pieces (B). Front yards (in red) and back-
                                                                                                                     yards (in green) were assigned as being
                                                                                                                     the closest and furthest yards from the
                                                                                                                     respective road centerline, respectively.
                                                                                                                     Corner parcels (in yellow) were reas-
                                                                                                                     signed as being located less than 15 m
                                                                                                                     from each road intersection and were ex-
                                                                                                                     cluded from statistical analyses as they
                                                                                                                     generally lack defined front and back-
                                                                                                                     yards. (For interpretation of the refer-
                                                                                                                     ences to colour in this figure legend, the
                                                                                                                     reader is referred to the web version of
                                                                                                                     this article.)

visually interpreting randomly-selected yards (n = 2000) and calcu-                cadaster, were considered in the study (Fig. 2). Complete cadastral data
lating the percentage of yards correctly geolocated and classified as               were not available for all residential buildings in the study area. After
front and backyards. For each parcel, total building area, parcel area,            constraining our analyses to 1-, 2-, and 3-family homes not located on
front and backyard area, building-street offset, distance from down-                corner lots, 171,464 yards in 85,732 parcels were statistically analyzed
town, and geographic coordinates were calculated in ArcGIS Desktop                 (Appendix B).
10.5 (ESRI, Redlands, CA).                                                             We calculated four vegetation structure metrics for each front and
    Parcel-level data on the household type (i.e., 1, 2 or 3 families),            back yard: (i) canopy cover (% yard cover), (ii) average canopy height
architectural style, real estate value, and year of construction of the            (m), (iii) maximum canopy height (m), and (iv) projected volume of
main residential building were extracted from cadastral datasets for               residential forest (m3 vegetation/m2 yard area). Methods used are de-
each municipality in the study area (City of Boston, 2017;                         scribed and validated in previous studies (Ossola & Hopton, 2018a,
Commonwealth of Massachusetts, 2017). The 12 most common archi-                    2018b). Vegetation height was interpolated from the LiDAR point cloud
tectural style classes found across the Boston area, as classified from the         at 1.5 m horizontal resolution in ArcGIS Desktop 10.5 (ESRI, Redlands,

                                                                             143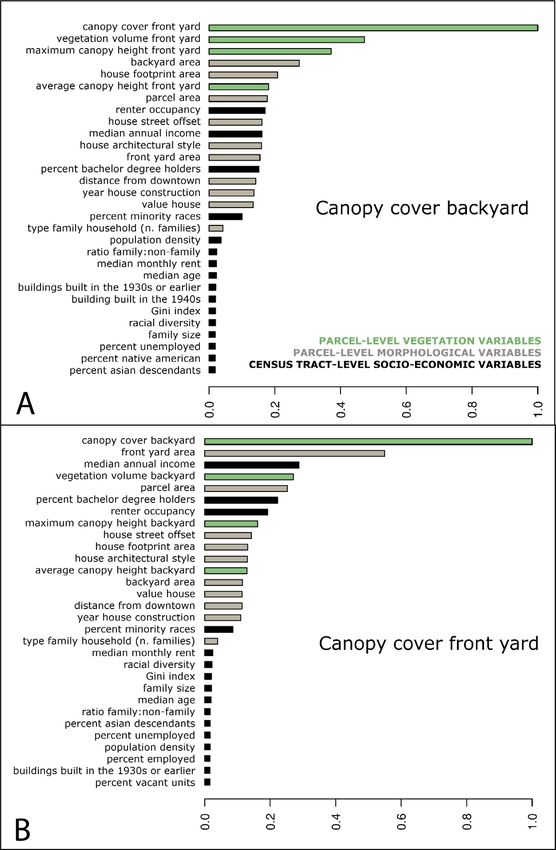
A. Ossola, et al. Landscape and Urban Planning 185 (2019) 141–157
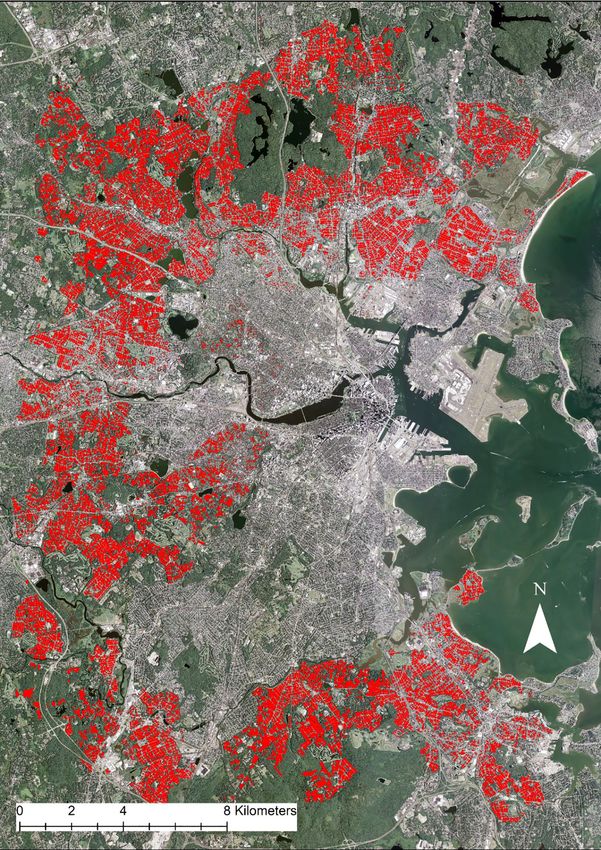
Fig. 2. Classification of residential buildings in the 12 most common architectural styles across the greater Boston area. Multiple units, flats, deckers, apartment
blocks, condominiums and mixed-use buildings were excluded from analyses as they generally lack defined front and backyards. Images are publicly available for
reprint from Wikimedia Commons.
CA). Canopy cover was modelled at 1.5 m resolution by using a su- and back) and categorical independent predictors (e.g., number of fa-
pervised classification approach based on data fusion of the vegetation milies) were performed by using pairwise Wilcoxon rank sum tests in R
height map, the visible and near-infrared imagery and Normalized 3.4.1 (R Core Team, 2017). Average values are expressed with their
Difference Vegetation Index (NDVI) map calculated from the same standard error of the mean (SEM).
imagery. A minimum of 100,000 pixels for each of three cover classes In the second phase, Distributed Random Forest models (DRFs) were
(i.e, woody vegetation, herbaceous vegetation, non-vegetated) were used to predict front and backyard vegetation metrics. DRFs is a re-
manually classified to calculate a signature file used by the maximum gression technique whereby multiple regression trees are built on sub-
likelihood supervised classifier that produced the canopy cover map sets of observations and predictors to allow a final prediction based on
(Singh, Vogler, Shoemaker, & Meentemeyer, 2012). The volume of re- all regression trees generated (i.e., random forest). The random selec-
sidential forest was calculated by multiplying canopy cover and height, tion of predictors in random forest modelling reduces bias and data
assuming this volume to be entirely occupied by vegetation. This overfit, and it has been widely used in ecological prediction (Prasad,
modelling approach has been used to measure residential vegetation Iverson, & Liaw, 2006). This modelling approach has the following
structure across entire urban landscapes and multiple cities (Ossola & attributes: (i) it handles multicollinear variables, (ii) it handles pre-
Hopton, 2018a, 2018b), though it does not fully discriminate the dictor variables regardless of their distribution, (iii) it is suitable for
ownership of vegetation and trees along property lines (e.g., trees modeling large and high dimensional datasets, and (iv) it handles
overhanging from nearby parcels, rights-of-ways and easements). variables with high number of categories (e.g., 12 architectural styles).
However, as Massachusetts law recognizes the right of residents to cut DRF modelling was performed in H2O, as this artificial intelligence
vegetation overhanging from nearby properties (e.g., Macero v. Busconi analytical platform can efficiently run complex cloud-based machine
Corp., Civil law case N. 99-03577E (Middlesex Super.Ct.), 12 Mass. L. learning DRF algorithms (H2O.ai, 2018, version 3.20.0.2) and be in-
Rep. 521 (2000)), we assumed the management of vegetation at the terfaced through R 3.4.1 (R Core Team, 2017). The yard vegetation
property line to be independent from vegetation ownership. dataset was randomly split into training, validation, and test datasets
containing, 80%, 10% and 10% of observations, respectively, as these
sample sizes are routinely used in DRF models (H2O.ai). DRF models
2.4. Statistical analyses were created by fitting a maximum of 200 statistical trees (max
depth = 30) for each of 5-fold cross validations and by calculating a
For each of the four vegetation structure metrics described above, final DRF model for each vegetation metric in both front and backyards.
analyses were carried out in two phases. In the first phase, comparisons The predictor variables for each DRF model fit into one of three
of vegetation structural metrics in relation to yard position (i.e., front
144
A. Ossola, et al.                                                                                                   Landscape and Urban Planning 185 (2019) 141–157

categories: (i) parcel-level vegetation metrics for the opposite yard               (Fig. 4A). On average, the proportional allocation between front and
within each parcel (i.e., back and front), (ii) parcel-level morphological          backyards was similar among households with different number of fa-
variables related to building and urban form (e.g., yard area, house                milies and ranged between 63.32 and 63.97% for backyards, and 36.02
footprint area, house-street offset, parcel area, year construction of               and 36.67% for front yards (Fig. 3B). Similarly, the average propor-
house, house value, distance from downtown and number of families),                 tional allocation between yards in relation to building architectural
and (iii) socio-economic variables at census tract level (e.g., income.,            styles was limited to a 7.75% variation range (Fig. 4B). Of the 85,732
education, employment, household characteristics, Appendix A). Model                properties considered, the average distance between the residential
fit was assessed by using standard machine learning metrics as Mean                  building and the street centerline was 19.06 ± 0.02 m. Bungalows had
Squared Error (MSE), Root Mean Squared Logarithmic Error (RMSLE)                    the lowest average house to street centerline distance
and residual deviance in relation to number of DRF trees and leaves                 (17.98 ± 0.08 m) and estate/mansion properties had the highest
fitted (H2O.ai, 2018).                                                               (28.67 ± 0.75 m).
                                                                                        Across the study area, backyards had significantly greater canopy
3. Results                                                                          cover than front yards (64.03 ± 0.09% of yard area and
                                                                                    43.37 ± 0.11%, respectively), as well as significantly greater average
3.1. Vegetation structure in front and backyards                                    canopy height (6.66 ± 0.02 m; 4.07 ± 0.01 m), maximum canopy
                                                                                    height (15.98 ± 0.02 m; 10.28 ± 0.03 m) and vegetation volume
    The accuracy of the GIS algorithm devised to geolocate and identify             (4.95 ± 0.01 m3/m2; 2.51 ± 0.01 m3/m2). Vegetation metrics in front
front and backyards exceeded 98.35%. Overall, backyards were almost                 and backyards were significantly related to the number of families
twice as large as front yards (423.27 ± 0.006 m2 and                                (Fig. 3C–G), as well as building architectural style (Fig. 5, Appendix C).
232.02 ± 0.003 m2, respectively). Single family homes had sig-
nificantly larger yards (256.06 ± 1.01 m2 and 465.77 ± 1.97 m2 for                   3.2. Urban form, style and social effects on yard vegetation
front and backyards, respectively) compared to two-family
(140.78 ± 0.84 m2 and 261.70 ± 1.76 m2) and three-family homes                          Distributed Random Forest models (DRFs) predicting front and
(125.28 ± 2.24 m2 and 236.04 ± 4.07 m2) (Fig. 3A). Estates and                      backyard vegetation variables were able to explain about half of the
mansions had yards seven times larger than conventional houses                      initial deviance, on average (Table 1). Canopy cover, average

Fig. 3. Relationship between household type and average yard area (A), percent yard area (B), percent canopy cover (C), average canopy height (D), maximum
canopy height (E), and average vegetation volume (F) in front and backyards. Lower case letters above each boxplot represents statistically equal mean values for
front yards (x, y, z) and backyards (a, b, c) based on pairwise Wilcoxon tests.

                                                                              145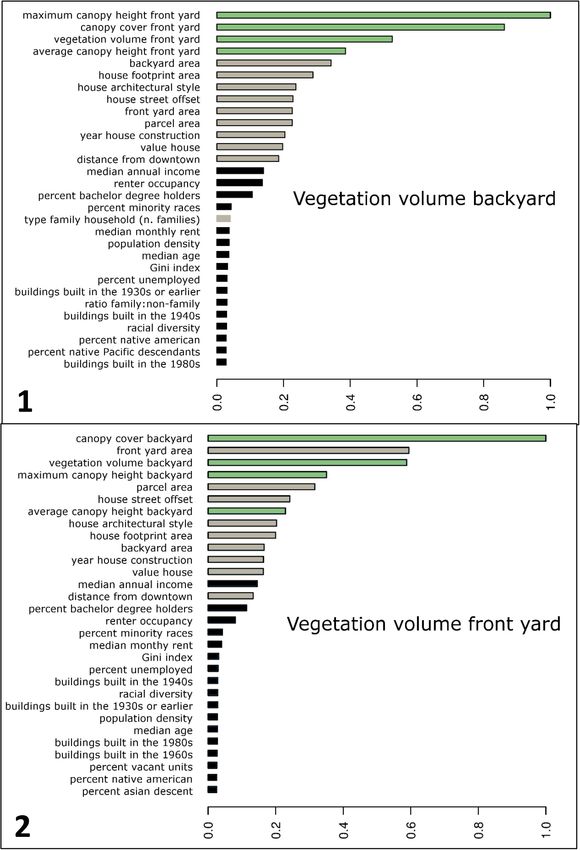
A. Ossola, et al.                                                                                                         Landscape and Urban Planning 185 (2019) 141–157

Fig. 4. Average area (A) and percent cover (B) of front and backyards in relation to the house architectural style. Errors bars represent the standard error of the mean.

vegetation height, and vegetation volume were better explained by                       facilitate property upkeep, tidiness, order and conformity, demon-
vegetation characteristics of the opposite yard within each parcel                      strating so called “cues to care” (Nassauer, 1988, 1995) that residents
(Fig. 6, Appendix D), whereas maximum canopy height was better ex-                      place toward their community (Foster et al., 2011; Hess, 2008;
plained by parcel and yard size (Fig. 6). Overall, vegetation metrics of                Nassauer, 2011). More complex front yard vegetation might have been
the opposite yard within each parcel and parcel-level variables related                 preferred by residents valuing privacy and protection from noise or
to urban form and architecture were more important in predicting yard                   pollution (Smardon, 1988; Zagorski, Kirkpatrick, & Stratford, 2004). On
vegetation structure compared to socio-economic variables (Fig. 6,                      the other hand, landscaping preference in backyards is “more likely to
Appendix D).                                                                            follow individual fantasy” (Larsen & Harlan, 2006), thus allowing the
                                                                                        creation of more complex vegetation structure in backyards (Belaire
                                                                                        et al., 2016).
4. Discussion                                                                               Boston’s backyard trees were taller than those in front yards.
                                                                                        Maximum tree canopy height in both front and backyards was better
4.1. Vegetation structure in front and backyards                                        predicted by the yard size, rather than the vegetation characteristics of
                                                                                        the opposite yard within each parcel (i.e., back and front). A study of
    In our analysis of over 85,000 parcels in the Boston metropolitan                   107 yards in 10 suburbs in Hobart, Australia found no differences in
area, we observed significant differences in the vegetation in front and                  tree canopy height between front and backyards, but also no differences
backyards. As hypothesized, backyards had significantly greater hor-                     in yard size (Daniels & Kirkpatrick, 2006). This suggests that residents
izontal and vertical vegetation structure than front yards. This result                 of the Boston area may prefer planting and managing taller trees in
held true for single and multi-family houses, as well as for houses with                larger yard spaces and further away from perceived risks (e.g., tree
different architectural styles. These results appear consistent with pre-                falling on the house or street) (Dilley & Wolf, 2013).
vious evidence suggesting that residents prefer manicured front lawns
over more complex woody vegetation, shrubs and large trees (Belaire
et al., 2016; Feagan & Ripmeester, 2001).                                               4.2. Urban form, style and social effects on yard vegetation
    In Boston, the lower percent canopy cover in front yards, as com-
pared to backyards, might be partially explained by the lower absolute                      Except for maximum tree canopy height, vegetation characteristics
area available for planting woody vegetation with greater cover, like                   of the opposite yard within a parcel were the best predictors for the
broad canopy trees. Tree cover, in fact, appears to increase with yard                  vegetation metrics investigated. In other words, parcels vary in their
size, particularly in enclosed backyards, as noticed in exurban Michigan                canopy cover, even though there are differences between yards. This
(Nassauer et al., 2014). Further, front yards are often “staged” as open                suggests that, at a city scale, resident landscaping preference and ve-
landscapes with the house in the background representing a symbol of                    getation management are best predicted at the level of the individual
wealth, social status and power (Cherulnik & Wilderman, 1986; Nasar,                    parcel. Residents with a relatively high (or low) amount of vegetation in
1989). In this context, lawns in the front of the house are often designed              their front yard are more likely to have a relatively high (or low)
and landscaped to highlight, and not hide, the building, its architecture               amount of vegetation in their backyard. This contrasts with what found
and value (Evans et al., 1982). Front yards engender personal pride,                    in smaller and more localized vegetation surveys of landscaping pre-
social relatedness, and connection to the neighboring community                         ferences in Phoenix, AZ (Larsen and Harlan (2006) and garden styles
(Harris & Brown, 1996; Quayle & van der Lieck, 1997). In this way,                      between front and backyards in Hobart, Australia (Daniels and
landscaping manicured lawns and simple vegetation in front yards can                    Kirkpatrick (2006), where significant differences in vegetation

                                                                                  146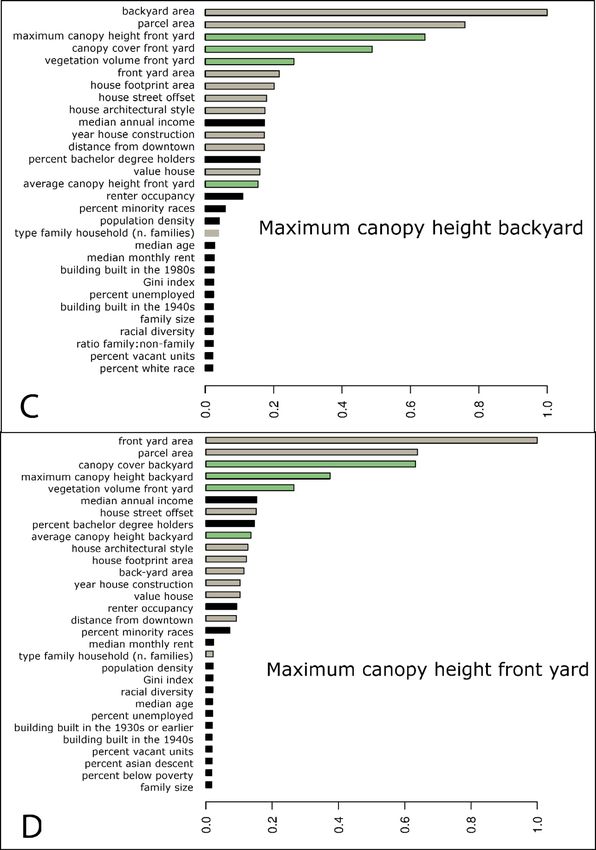
A. Ossola, et al.                                                                                                    Landscape and Urban Planning 185 (2019) 141–157

Fig. 5. Percent canopy cover (A) and maximum canopy height (B) in Boston’s front and backyards in relation to the house architectural style. Additional graphs are
reported in Appendix C. Errors bars represent the standard error of the mean.

characteristics were observed in about half of the yards investigated                vegetation structure than the number of buildings built within each
(232 and 107 parcels, respectively). In this way, the effects of resident             decade in the neighborhood. Similarly, the type of household (i.e., 1, 2,
landscaping preference and vegetation management of front and                        3 families) recorded at parcel-level was a better predictor than house-
backyards could well vary from property to property at the parcel scale,             hold variables recorded at neighborhood level. Overall, this suggests
to be then increasingly homogenized at larger landscape and city scales              that more accurate accounts of urban vegetation and trees would
(Cook et al., 2012).                                                                 benefit from detailed assessments at the yard level, thus allowing a
    Parcel-level metrics related to urban form and architectural style               better evaluation of the multiscalar effects and interactions occurring
ranked as the second most important class of predictors of the overall               across residential landscapes (Cook et al., 2012; Harris et al., 2012). It
yard vegetation structure. This is not surprising as urban form and                  also suggests that even with some neighborhood influences, there is a
physical space availability are significant predictors of vegetation cover            clear need to measure urban vegetation at the scale of management,
at landscape, city and urban macro-scales (Bigsby et al., 2014; Nassauer             which is the parcel or sub-parcel area. Although prior researchers have
et al., 2014; Ossola & Hopton, 2018a, 2018b; Troy, Grove, O’Neil-                    conceptualized residential land management as multi-scalar, with
Dunne, Pickett, & Cadenasso, 2007). The shape and size of yards have                 homes nested in neighborhoods, and neighborhoods within munici-
been found to be inextricably linked to the history and types of urban               palities (Chowdhury et al., 2011), our approach was able to quantify
development, which could in turn affect the availability of space for                 the relative importance of each scale across our study area.
vegetation (Conway & Hackworth, 2007; Gill et al., 2008; Lin et al.,                     Our second hypothesis, that the house architectural style is related
2017; Smith et al., 2006). In this way, urban form and available space               to the structure of yard vegetation, was confirmed. While different
could well be limiting our ability to achieve higher canopy cover and                Boston neighborhoods have different building style compositions, as
taller vegetation and trees, particularly as human perception of vege-               observed in other US cities (Bastian, 1980), vegetation structure varied
tation is highly related to density, space and field of view of a landscape           significantly across both front and backyards and by architectural style.
scene (Smardon, 1988; Ulrich, 1986).                                                 Mansions and estates hosted the tallest and most prominent trees as
    The year of house construction was a better predictor of yard                    these are likely preferred in prestigious residential scenes (Ulrich,

                                                                               147
A. Ossola, et al. Landscape and Urban Planning 185 (2019) 141–157
1986). In a survey of residents’ preferences of front yard design in
Mean residual deviance (testing)
exurban Michigan, Nassauer et al. (2009) found no relationship with
building style, possibly due to the smaller sample size of the study and
lower architectural diversity in the area. However, our findings suggest
that architectural style is an important predictor of yard vegetation
structure, which was likely mediated by both the (i) physical avail-
ability of yards space for each architectural style, and (ii) actual land-
scaping and planting preferences related to building styles. The effects
22.482
25.092
11.185
0.043
0.047
9.052
9.154
5.525 of architectural style on residential greening requires more empirical
evidence and field-based vegetation surveys from other cities; future
Mean residual deviance (training)
studies could integrate other social factors operating at small scales,
such as tenancy/ownership, length of residency and neighborhood
turnover (Chowdhury et al., 2011; Cook et al., 2012; Larson et al.,
2017; Ossola et al., 2018). For instance, home ownership can affect the
level of control over yard design and management, as renters often have
less control over management choices and are willing to invest fewer
economic resources to support such activities (Ossola et al., 2018;
Perkins, Heynen, & Wilson, 2004).
22.683
25.482
11.332
0.044
0.048
9.132
9.278
5.680
Future efforts could further test whether architectural style can be
used as a robust proxy to downscale census socio-economic data from
RMSLE (testing)
neighborhood-level to parcel- and yard-level. In this regard, neighbor-
hood-level socio-economic characteristics were the least important
variables in predicting front and backyard vegetation structure. This
0.139
0.215
0.540
5.009
0.574
0.691
0.624
0.623
finding adds new evidence to the debate about the importance of socio-
economic characteristics to yard vegetation. On one hand, studies in
several cities have found characteristics such as age, income, or race to
RMSLE (training)
Summary statistics for the training and testing of the Distributed Random Forest (DRF) models predicting yard vegetation metrics.
be important predictors of yard vegetation in general (Belaire et al.,
2016; Minor, Belaire, Davis, Franco, & Lin, 2016) and the diversity of
flowering plants in particular (Lowenstein & Minor, 2016). On the other
0.139
0.154
0.537
5.048
0.577
0.691
0.629
0.631
hand, income and socio-demographic composition was not related to
urban and residential tree cover (Duncan et al., 2014; Ossola & Hopton,
MSE (testing)
2018a, 2018b; Pham, Apparicio, Landry, Séguin, & Gagnon, 2013) or
yard landscaping preference (Larsen & Harlan, 2006) in other cities.
22.483
25.092
11.185
0.044
0.047
9.052
9.154
5.525
Similarly, in our study, median household income from the census was
not a strong predictor for most measures of vegetation structure, and
was similar in importance to real estate value at parcel level.
MSE (training)
4.3. Where are all the yards?
22.683
25.482
11.332
0.043
0.048
9.132
9.278
5.680
The algorithm devised to locate and classify yards achieved very
high accuracy. Yard classification was consistent across diverse neigh-
Mean number DRF leaves
borhoods characterized by heterogeneous urban form, planning
schemes and street networks (e.g., regular vs sinuous) (Fig. 1). The few
misclassifications of yards were plausibly attributable to imprecisions
in the original street geospatial layer or to complex parcel morphologies
(Fig. 1, Appendix E). A previous attempt to locate private gardens
39,697
38,438
42,105
39,636
42,804
40,087
42,692
39,576
across Dunedin, New Zealand, based on vegetation classification of
satellite imagery, achieved lower accuracy (90.7%) than our algorithm
Number DRF trees
(Mathieu, Freeman, & Aryal, 2007). In a recent study, Haase et al.
(2019) managed to quantify vegetation cover across residential yards in
Leipzig, Germany, from satellite imagery but with no distinction be-
tween front and backyards. By making use of freely available cadastral
109
100
110
102
102
and urban form data (i.e., parcel, building and street geometry), our
87
90
92
algorithm allows researchers to more precisely locate and classify all
Front yard
Front yard
Front yard
Front yard
Yard type
yards across entire urban landscapes, regardless of vegetation compo-
Backyard
Backyard
Backyard
Backyard
sition or other yard attributes not related to urban morphology and
planning. Since the advent of high-resolution, high-accuracy tree ca-
nopy mapping in urban areas, parcel-scale studies have become more
Vegetation metric predicted
popular (Ossola & Hopton, 2018a). Thus, the GIS algorithm presented
Maximum canopy height
Maximum canopy height
Average canopy height
Average canopy height
here offers a new tool to inform greening efforts on private residential
land. Further, this tool allows the scale of research on urban greening to
better match the scale of decision-making and management: the parcel
Forest volume
Forest volume
Canopy cover
Canopy cover
and its yards. Ultimately, this methodological approach allows re-
searchers to (i) expand beyond the limitations of physical access to
Table 1
properties and small to moderate field-based studies of yards, (ii) ex-
amine variable importance across scales, and (iii) investigate how yard
148
A. Ossola, et al.                                                                                                       Landscape and Urban Planning 185 (2019) 141–157

Fig. 6. Importance of variables predicting yard canopy cover (A, B) and maximum canopy height (C, D) calculated from DRF modelling. Parcel-level vegetation
variables are highlighted in green, parcel-level morphological variables related to urban form in grey and census tract-level variables in black. Only the 30 most
important predictors are plotted. Graphs for other vegetation metrics are reported in Appendix D. (For interpretation of the references to colour in this figure legend,
the reader is referred to the web version of this article.)

                                                                                 149
A. Ossola, et al. Landscape and Urban Planning 185 (2019) 141–157
Fig. 6. (continued)
and sub-parcel level characteristics may moderate the front/back dif- unnecessarily remove trees (Ossola & Hopton, 2018b), and even com-
ferences in vegetation structure. pletely pave their yards (Perry & Nawaz, 2008). We argue that future
urban planning could devise better urban forms, parcel and yard
morphologies able to influence residents’ landscaping behaviors, thus
4.4. Implications for urban planning and greening
enhancing vegetation structure and its numerous ecosystem services
(e.g., biodiversity, urban heat mitigation, human health and wellbeing).
Our study highlights that urban greening in private yards is related
Planning residential parcels with larger front and backyards would be
to urban form and architecture, and as such, it could be enhanced
the most logical way to increase vegetation structure, but this could
through urban planning. This is important as modern residents express
exacerbate urban sprawl and its negative impacts on urban
the will to plant less trees in the future (Dilley & Wolf, 2013),
150A. Ossola, et al. Landscape and Urban Planning 185 (2019) 141–157
sustainability. Additional evidence is however needed to clarify whe- 2016; Ossola et al., 2018; Steenberg, Duinker, & Charles, 2013). Despite
ther the surrounding land use (e.g., residential parcels facing a peri- being uncommon throughout Boston (Harris et al., 2012), residents’
urban forest vs parcels in a dense urban environment) and the climate associations could also be leveraged to increment yard vegetation
in which a city is located might affect the patterns observed in our structure through more structurally elaborate gardening styles and
study. Finally, greening increments related to parcel size will not be landscaping rules (Harris et al., 2012). Urban planning could further
unlimited, as suggested by a study of 1.4 million residential parcels in increase urban greening by incorporating marketing strategies to in-
1503 neighborhoods spread across nine US cities, whereby increases in fluence human behavior, the human need for style, and individual
residential vegetation cover would only be substantial for parcel areas preferences towards more complex yard vegetation and landscaping
up to 1000 m2 (Ossola & Hopton, 2018b). types (Grove et al., 2006).
Where planning schemes do not allow larger residential parcels, In a study on the geography of architectural styles in San Diego, CA
significant gains in vegetation structure could be obtained by reducing and Columbus, OH, Fusch and Ford (1983) stated: “By mapping and
building-street offsets and designing smaller front yards and larger monitoring, [sic] urban house types we can gain a better understanding of
backyards. Interestingly, regardless of parcel size, household occu- the role of the three-dimensional landscape in shaping the morphology and
pancy, or architectural style, the proportional allocation between front socio-economic structure of cities”. Thirty-five years later, our study not
and backyards was similar across Boston. A different yard proportional only confirms this vision, but it sets a novel way to holistically under-
allocation could increase residential greening during urban renewal and stand how people interact with the vegetation and trees in their home
land redevelopment and protect vegetation and trees during urban environment and the larger residential landscape.
densification (Cheng, Ryan, Warren, & Nicolson, 2017; Lin & Fuller,
2013). Striking a balance between optimal urban form and private
greening would also need to carefully consider trade-offs related to Acknowledgements
visual and physical access to green spaces and resource inequality
(Danford et al., 2014). Innovative urban planning schemes could foster Authors kindly acknowledge USDA, USGS, MASS-GIS and the City of
the individual and social creation of urban greening from residential Boston for providing geospatial datasets. This work was supported by
land through neighborhood approaches geared toward shared yard the National Socio-Environmental Synthesis Center (SESYNC) under
governance and management (Dewaelheyns, Kerselaers, & Rogge, funding received from the National Science Foundation DBI-1639145.
Appendix A:. Socio-economic variables at census tract level (US Census Bureau, 2010)
Description Socio-economic variable
Median age (both sexes) DP0020001
White alone or in combination with one or more other races DP0090001
Black or African American alone or in combination with one or more other races DP0090002
American Indian and Alaska Native alone or in combination with one or more other races DP0090003
Asian alone or in combination with one or more other races DP0090004
Native Hawaiian and Other Pacific Islander alone or in combination with one or more other races DP0090005
Some Other Race alone or in combination with one or more other races DP0090006
Population in households DP0120002
Population in group quarters DP0120014
Family households DP0130002
Nonfamily households DP0130010
Average household size DP0160001
Average family size DP0170001
Occupied housing units DP0180002
Vacant housing units DP0180003
Owner-occupied housing units DP0210002
Renter-occupied housing units DP0210003
Percent high school graduate or higher (table S1501) HC01_EST_VC16
Percent bachelor's degree or higher (table S1501) HC01_EST_VC17
All families (table S1702) HC01_EST_VC01
Percent families below poverty level (table S1702) HC02_EST_VC01
Gini Index (table B19083) HD01_VD01
Median income (dollars) per household (table S1903) HC02_EST_VC02
Working-age population 20–64 years (table S2301) HC01_EST_VC24
In labor population 20–64 years (table S2301) HC02_EST_VC24
Employed population 20–64 years (table S2301) HC03_EST_VC24
Unemployment rate 20–64 years (table S2301) HC04_EST_VC24
Median contract rent (table B25058) HD01_VD01
Buildings built in 2005 or later (table B25034) HD01_VD02
Buildings built 2000–2004 HD01_VD03
Buildings built 1990–1999 HD01_VD04
Buildings built 1980–1989 HD01_VD05
Buildings built 1970–1979 HD01_VD06
Buildings built 1960–1969 HD01_VD07
Buildings built 1950–1959 HD01_VD08
Buildings built 1940–1949 HD01_VD09
Buildings built 1939 or earlier HD01_VD10
151A. Ossola, et al. Landscape and Urban Planning 185 (2019) 141–157
Appendix B:. Map of the 85,732 parcels (in red) in the greater Boston area investigated in this study for which complete cadaster data for
residential buildings is available (i.e., architecture style, real estate value, year of construction)
152A. Ossola, et al. Landscape and Urban Planning 185 (2019) 141–157
Appendix C:. Average canopy height (1) and forest volume (2) in Boston’s front and backyards in relation to the house architectural style
153A. Ossola, et al. Landscape and Urban Planning 185 (2019) 141–157
Appendix D:. Variable importance predicting yard canopy volume (1, 2) and average canopy height (3, 4) calculated from the distributed
random forest modelling. Parcel-level vegetation variables are highlighted in green, parcel-level morphological variables related to urban
form in grey and census tract-level variables in black. Only the 30 most important predictors are plotted
154A. Ossola, et al. Landscape and Urban Planning 185 (2019) 141–157
Appendix E. Supplementary material
Supplementary data to this article can be found online at https://doi.org/10.1016/j.landurbplan.2019.02.014. These data include Google maps
of the most important areas described in this article.
155A. Ossola, et al. Landscape and Urban Planning 185 (2019) 141–157
References 006-0116-z.
Haaland, C., & Konijnendijk, C. (2015). Challenges and strategies for urban green-space
planning in cities undergoing densification: A review. Urban Forestry & Urban
Bastian, R. W. (1980). Urban house types as a research focus in historical geography. Greening, 14(4), 760–771. https://doi.org/10.1016/j.ufug.2015.07.009.
Environmental Review, 4(2), 27–34. https://doi.org/10.2307/3984475. Haase, D., Jänicke, C., & Wellmann, T. (2019). Front and back yard green analysis with
Belaire, J. A., Westphal, L. M., & Minor, E. S. (2016). Different social drivers, including subpixel vegetation fractions from earth observation data in a city. Landscape and
perceptions of urban wildlife, explain the ecological resources in residential land- Urban Planning, 182, 44–54. https://doi.org/10.1016/j.landurbplan.2018.10.010.
scapes. Landscape Ecology, 31(2), 401–413. https://doi.org/10.1007/s10980-015- Harris, P. B., & Brown, B. B. (1996). The home and identity display: Interpreting resident
0256-7. territoriality from home exteriors. Journal of Environmental Psychology, 16(3),
Beninde, J., Veith, M., & Hochkirch, A. (2015). Biodiversity in cities needs space: A meta- 187–203. https://doi.org/10.1006/jevp.1996.0016.
analysis of factors determining intra-urban biodiversity variation. Ecology Letters, Harris, E. M., Polsky, C., Larson, K. L., Garvoille, R., Martin, D. G., Brumand, J., & Ogden,
18(6), 581–592. https://doi.org/10.1111/ele.12427. L. (2012). Heterogeneity in residential yard care: Evidence from Boston, Miami, and
Bigsby, K. M., McHale, M. R., & Hess, G. R. (2014). Urban morphology drives the Phoenix. Human Ecology, 40(5), 735–749. https://doi.org/10.1007/s10745-012-
homogenization of tree cover in Baltimore, MD, and Raleigh, NC. Ecosystems, 17(2), 9514-3.
212–227. https://doi.org/10.1007/s10021-013-9718-4. Hess, P. M. (2008). Fronts and backs: The use of streets, yards, and alleys in Toronto-area
Cameron, R. W. F., Blanuša, T., Taylor, J. E., Salisbury, A., Halstead, A. J., Henricot, B., & new urbanist neighborhoods. Journal of Planning Education and Research, 28(2),
Thompson, K. (2012). The domestic garden – Its contribution to urban green infra- 196–212. https://doi.org/10.1177/0739456X08321799.
structure. Urban Forestry & Urban Greening, 11(2), 129–137. https://doi.org/10. Kennedy, L. W. (1992). Planning the city upon a hill: Boston since 1630. Amherst: University
1016/j.ufug.2012.01.002. of Massachusetts Press.
Cheng, C., Ryan, R. L., Warren, P. S., & Nicolson, C. (2017). Exploring stakeholders’ Larsen, L., & Harlan, S. L. (2006). Desert dreamscapes: Residential landscape preference
perceptions of urban growth scenarios for metropolitan Boston (USA): The relation- and behavior. Landscape and Urban Planning, 78(1), 85–100. https://doi.org/10.
ship between urban trees and perceived density. Art. 7 Cities and the Environment, 1016/j.landurbplan.2005.06.002.
10(1)http://digitalcommons.lmu.edu/cate/vol10/iss1/7. Larson, K. L., Casagrande, D., Harlan, S. L., & Yabiku, S. T. (2009). Residents’ yard choices
Cherulnik, P. D., & Wilderman, S. K. (1986). Symbols of status in urban neighborhoods: and rationales in a desert city: Social priorities, ecological impacts, and decision
Contemporary perceptions of nineteenth-century Boston. Environment and Behavior, tradeoffs. Environmental Management, 44(5), 921. https://doi.org/10.1007/s00267-
18(5), 604–622. https://doi.org/10.1177/0013916586185002. 009-9353-1.
Chowdhury, R. R., Larson, K., Grove, J. M., Polsky, C., Cook, E., Onsted, J., & Ogden, L. Larson, K. L., Hoffman, J., & Ripplinger, J. (2017). Legacy effects and landscape choices in
(2011). A multi-scalar approach to theorizing socio-ecological dynamics of urban a desert city. Landscape and Urban Planning, 165, 22–29. https://doi.org/10.1016/j.
residential landscapes. Available at: Cities and the Environment, 4(1), 6. http:// landurbplan.2017.04.014.
digitalcommons.lmu.edu/cate/vol4/iss1/6. Lin, B. B., & Fuller, R. A. (2013). FORUM: Sharing or sparing? How should we grow the
City of Boston (2017). Analyze Boston portal. Accessed on September 2017 https://data. world's cities? Journal of Applied Ecology, 50(5), 1161–1168. https://doi.org/10.
boston.gov/. 1111/1365-2664.12118.
Commonwealth of Massachusetts (2017). MASSgis. Accessed on September 2017 https:// Lin, B., Gaston, K., Fuller, R., Wu, D., Bush, R., & Shanahan, D. (2017). How green is your
www.mass.gov/service-details/massgis-data-layers. garden?: Urban form and socio-demographic factors influence yard vegetation, visi-
Conway, T., & Hackworth, J. (2007). Urban pattern and land cover variation in the tation, and ecosystem service benefits. Landscape and Urban Planning, 157, 239–246.
greater Toronto area. The Canadian Geographer/Le Géographe canadien, 51(1), 43–57. https://doi.org/10.1016/j.landurbplan.2016.07.007.
https://doi.org/10.1111/j.1541-0064.2007.00164.x. Lin, B., Meyers, J., & Barnett, G. (2015). Understanding the potential loss and inequities
Cook, E. M., Hall, S. J., & Larson, K. L. (2012). Residential landscapes as social-ecological of green space distribution with urban densification. Urban Forestry & Urban Greening,
systems: A synthesis of multi-scalar interactions between people and their home 14(4), 952–958. https://doi.org/10.1016/j.ufug.2015.09.003.
environment. Urban Ecosystems, 15(1), 19–52. https://doi.org/10.1007/s11252-011- Locke, D. H., Avolio, M., Trammel, T., Chowdhury, R. R., Grove, J. M., Rogan, J., ...
0197-0. Groffman, P. M. (2018). A multi-city comparison of front and backyard differences in
Danford, R. S., Cheng, C., Strohbach, M. W., Ryan, R., Nicolson, C., & Warren, P. S. plant species diversity and nitrogen cycling in residential landscapes. Landscape and
(2014). What does it take to achieve equitable urban tree canopy distribution? A Urban Planning, 178, 102–111. https://doi.org/10.1016/j.landurbplan.2018.05.030.
Boston case study. Art. 2 Cities and the Environment, 7(1)http://digitalcommons.lmu. Locke, D. H., Landry, S. M., Grove, J. M., & Roy Chowdhury, R. (2016). What’s scale got to
edu/cate/vol7/iss1/2. do with it? Models for urban tree canopy. Journal of Urban Ecology, 2(1), https://doi.
Daniels, G. D., & Kirkpatrick, J. B. (2006). Comparing the characteristics of front and back org/10.1093/jue/juw006 juw006.
domestic gardens in Hobart, Tasmania. Australia. Landscape and Urban Planning, 78, Locke, D. H., Roy Chowdhury, R., Grove, J. M., Martin, D. G., Goldman, E., Rogan, J., &
344–352. https://doi.org/10.1016/j.landurbplan.2005.11.004. Groffman, P. (2018). Social norms, yard care, and the difference between front and
Dewaelheyns, V., Kerselaers, E., & Rogge, E. (2016). A toolbox for garden governance. back yard management: Examining the landscape mullets concept on urban re-
Land Use Policy, 51, 191–205. https://doi.org/10.1016/j.landusepol.2015.11.016. sidential lands. Society & Natural Resources, 31(10), 1–20. https://doi.org/10.1080/
Dilley, J., & Wolf, K. L. (2013). Homeowner interactions with residential trees in urban 08941920.2018.1481549.
areas. Arboriculture & Urban Forestry, 39(6), 267–277. Loram, A., Tratalos, J., Warren, P. H., & Gaston, K. J. (2007). Urban domestic gardens (X):
Dorney, J. R., Guntenspergen, G. R., Keough, J. R., & Stearns, F. (1984). Composition and The extent & structure of the resource in five major cities. Landscape Ecology, 22(4),
structure of an urban woody plant community. Urban Ecology, 8(1–2), 69–90. https:// 601–615. https://doi.org/10.1007/s10980-006-9051-9.
doi.org/10.1016/0304-4009(84)90007-X. Lowenstein, D. M., & Minor, E. S. (2016). Diversity in flowering plants and their char-
Duncan, D. T., Kawachi, I., Kum, S., Aldstadt, J., Piras, G., Matthews, S. A., ... Williams, D. acteristics: Integrating humans as a driver of urban floral resources. Urban Ecosystems,
R. (2014). A spatially explicit approach to the study of socio-demographic inequality 19(4), 1735–1748. https://doi.org/10.1007/s11252-016-0563-z.
in the spatial distribution of trees across Boston neighborhoods. Spatial Demography, Martin, C. A., Peterson, K. A., & Stabler, L. B. (2003). Residential landscaping in Phoenix,
2(1), 1–29. Arizona, U.S.: Practices and preferences relative to covenants, codes, and restrictions.
Evans, G. W., Smith, C., & Pezdek, K. (1982). Cognitive maps and urban form. Journal of Journal of Arboriculture, 29, 9–17.
the American Planning Association, 48(2), 232–244. https://doi.org/10.1080/ Mathieu, R., Freeman, C., & Aryal, J. (2007). Mapping private gardens in urban areas
01944368208976543. using object-oriented techniques and very high-resolution satellite imagery.
Feagan, R., & Ripmeester, M. (2001). Reading private green space: Competing geographic Landscape and Urban Planning, 81(3), 179–192. https://doi.org/10.1016/j.
identities at the level of the lawn. Philosophy & Geography, 4(1), 79–95. https://doi. landurbplan.2006.11.009.
org/10.1080/10903770124446. Minor, E., Belaire, J. A., Davis, A., Franco, M., & Lin, M. (2016). Socioeconomics and
Foo, K., McCarthy, J., & Bebbington, A. (2018). Activating landscape ecology: A gov- neighbor mimicry drive yard and neighborhood vegetation patterns. In R. A. Francis,
ernance framework for design-in-science. Landscape Ecology, 33(5), 675–689. https:// J. Millington, & M. A. Chadwick (Eds.). Urban landscape ecology: Science, policy and
doi.org/10.1007/s10980-018-0630-3. practice (pp. 56–74). New York: Routledge ISBN: 978-1-13-888851-7.
Foster, S., Giles-Corti, B., & Knuiman, M. (2011). Creating safe walkable streetscapes: Nasar, J. L. (1989). Symbolic meanings of house styles. Environment and Behavior, 21(3),
Does house design and upkeep discourage incivilities in suburban neighbourhoods? 235–257. https://doi.org/10.1177/0013916589213001.
Journal of Environmental Psychology, 31(1), 79–88. https://doi.org/10.1016/j.jenvp. Nassauer, J. I. (1988). The aesthetics of horticulture: Neatness as a form of care.
2010.03.005. HortScience, 23(6), 973–977.
Fusch, R., & Ford, L. R. (1983). Architecture and the geography of the American city. Nassauer, J. I. (1995). Messy ecosystems, orderly frames. Landscape Journal, 14(2),
Geographical Review, 73(3), 324–340. https://doi.org/10.2307/214838. 161–170.
Gill, S. E., Handley, J. F., Ennos, A. R., Pauleit, S., Theuray, N., & Lindley, S. J. (2008). Nassauer, J. I. (2011). Care and stewardship: From home to planet. Landscape and Urban
Characterising the urban environment of UK cities and towns: A template for land- Planning, 100(4), 321–323. https://doi.org/10.1016/j.landurbplan.2011.02.022.
scape planning. Landscape and Urban Planning, 87(3), 210–222. https://doi.org/10. Nassauer, J. I., Cooper, D. A., Marshall, L. L., Currie, W. S., Hutchins, M., & Brown, D. G.
1016/j.landurbplan.2008.06.008. (2014). Parcel size related to household behaviors affecting carbon storage in
Goddard, M. A., Dougill, A. J., & Benton, T. G. (2013). Why garden for wildlife? Social exurban residential landscapes. Landscape and Urban Planning, 129, 55–64. https://
and ecological drivers, motivations and barriers for biodiversity management in re- doi.org/10.1016/j.landurbplan.2014.05.007.
sidential landscapes. Ecological Economics, 86, 258–273. https://doi.org/10.1016/j. Nassauer, J. I., Wang, Z., & Dayrell, E. (2009). What will the neighbors think? Cultural
ecolecon.2012.07.016. norms and ecological design. Landscape and Urban Planning, 92(3–4), 282–292.
Grove, J. M., Troy, A. R., O'Neil-Dunne, J. P. M., Burch, W. R., Cadenasso, M. L., & Pickett, https://doi.org/10.1016/j.landurbplan.2009.05.010.
S. T. A. (2006). Characterization of households and its implications for the vegetation O' Connor, T. H. (2001). The Hub: Boston past and present. Boston: Northeastern University
of urban ecosystems. Ecosystems, 9(4), 578–597. https://doi.org/10.1007/s10021- Press.
156You can also read