RUHR - Do Wages Rise when Corporate Taxes Fall? Evidence from Germany's Tax Reform 2000 - RWI Essen
←
→
Page content transcription
If your browser does not render page correctly, please read the page content below
RUHR
                                             ECONOMIC PAPERS

Nils aus dem Moore
Tanja Kasten
Christoph M. Schmidt

                       Do Wages Rise when Corporate
                       Taxes Fall?
                       Evidence from Germany’s Tax Reform 2000

                                               #532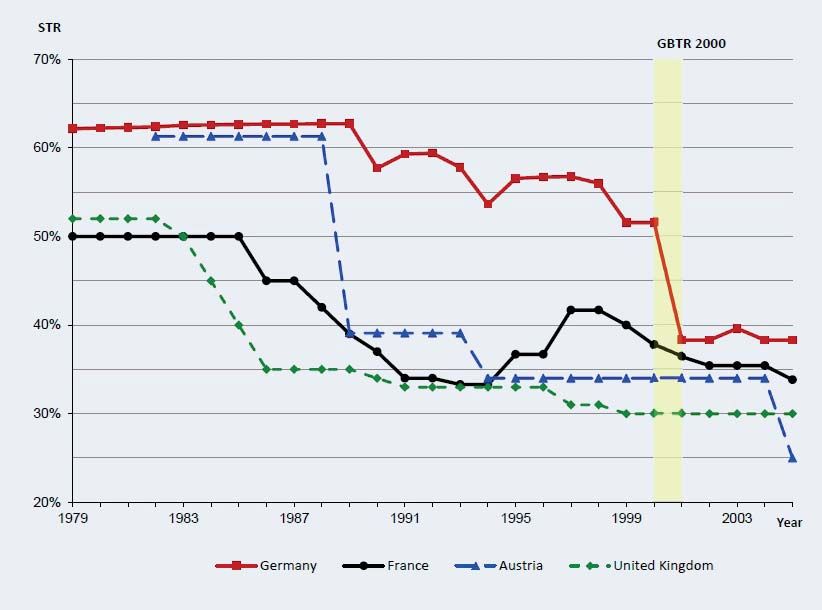
Imprint

Ruhr Economic Papers

Published by
Ruhr-Universität Bochum (RUB), Department of Economics
Universitätsstr. 150, 44801 Bochum, Germany
Technische Universität Dortmund, Department of Economic and Social Sciences
Vogelpothsweg 87, 44227 Dortmund, Germany
Universität Duisburg-Essen, Department of Economics
Universitätsstr. 12, 45117 Essen, Germany
Rheinisch-Westfälisches Institut für Wirtschaftsforschung (RWI)
Hohenzollernstr. 1-3, 45128 Essen, Germany

Editors

Prof. Dr. Thomas K. Bauer
RUB, Department of Economics, Empirical Economics
Phone: +49 (0) 234/3 22 83 41, e-mail: thomas.bauer@rub.de
Prof. Dr. Wolfgang Leininger
Technische Universität Dortmund, Department of Economic and Social Sciences
Economics – Microeconomics
Phone: +49 (0) 231/7 55-3297, e-mail: W.Leininger@wiso.uni-dortmund.de
Prof. Dr. Volker Clausen
University of Duisburg-Essen, Department of Economics
International Economics
Phone: +49 (0) 201/1 83-3655, e-mail: vclausen@vwl.uni-due.de
Prof. Dr. Roland Döhrn, Prof. Dr. Manuel Frondel, Prof. Dr. Jochen Kluve
RWI, Phone: +49 (0) 201/81 49 -213, e-mail: presse@rwi-essen.de

Editorial Office

Sabine Weiler
RWI, Phone: +49 (0) 201/81 49 -213, e-mail: sabine.weiler@rwi-essen.de

Ruhr Economic Papers #532

Responsible Editor: Roland Döhrn
All rights reserved. Bochum, Dortmund, Duisburg, Essen, Germany, 2014
ISSN 1864-4872 (online) – ISBN 978-3-86788-609-3
The working papers published in the Series constitute work in progress circulated to
stimulate discussion and critical comments. Views expressed represent exclusively the
authors’ own opinions and do not necessarily reflect those of the editors.
Ruhr Economic Papers #532

Nils aus dem Moore, Tanja Kasten, and Christoph M. Schmidt

            Do Wages Rise when Corporate
                              Taxes Fall?
      Evidence from Germany’s Tax Reform 2000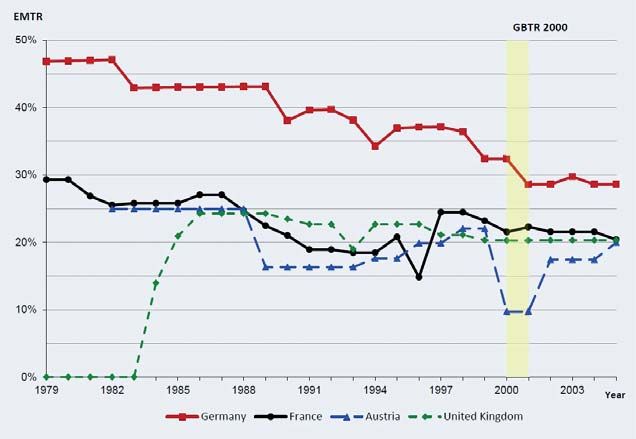
Bibliografische Informationen
der Deutschen Nationalbibliothek

Die Deutsche Bibliothek verzeichnet diese Publikation in der deutschen National-
bibliografie; detaillierte bibliografische Daten sind im Internet über:
http://dnb.d-nb.de abrufbar.

http://dx.doi.org/10.4419/86788609
ISSN 1864-4872 (online)
ISBN 978-3-86788-609-3
Nils aus dem Moore, Tanja Kasten, and Christoph M. Schmidt1

Do Wages Rise when Corporate
Taxes Fall?
Evidence from Germany’s Tax Reform 2000

Abstract
We contribute to the empirical literature on the effective incidence of corporate income
taxation by using the German Business Tax Reform of the year 2000 (GBTR 2000) as
a natural experiment. Its effect on wages in the manufacturing sector is identified by
means of a difference-in-differences analysis that uses French firms as comparison
group. We provide evidence that GBTR 2000 led to a significant and sizeable wage
effect. For 2001, the first year after GBTR 2000 took effect, we estimate a short-run
effect that implies a wage increase of 7.9 percent. Due to the dynamic nature of the
empirical model used, the incidence effect grows gradually over time during the
evaluation period.

JEL Classification: H22, H25, J31, J38

Keywords: Corporate income taxation; tax reform; tax incidence; profit taxation; wages;
difference-in-differences

December 2014

1 Nils aus dem Moore and Tanja Kasten, RWI - Berlin Office; Christoph M. Schmidt, RWI and Ruhr University Bochum – The
authors are grateful to Thomas K. Bauer, Robert S. Chirinko, Nadja Dwenger, Wolfgang Eggert, Frank Fossen, Clemens Fuest,
Michael Kvasnicka, Li Liu and Jack Mintz for helpful comments and suggestions. We also gratefully acknowledge the comments
and suggestions of discussants and participants at the 65th Congress of the International Institute of Public Finance (IIPF) in
Cape Town and at the 2011 AEA Annual Meeting in Denver. The usual disclaimer applies. – This paper corresponds to chapter 2
of the dissertation „Myths and Measurement – Firm-level Effects of Corporate Income Taxation“ at the Faculty of Management
and Economics at Ruhr-Universität Bochum, available online at http://www-brs.ub.ruhr-uni-bochum.de/netahtml/HSS/Diss/
MooreNilsausdem/.– All correspondence to Nils aus dem Moore, RWI - Berlin Office, Invalidenstr. 112, 10115 Berlin, Germany,
e-mail: Nils.ausdemMoore@rwi-essen.de
1 Introduction
The last three decades saw considerable reforms to corporate income taxes in industrial-
ized countries. A downward trend was most pronounced between the early 1980s and the
end of the 1990s. In this period, statutory corporate income taxes in OECD countries
fell from an average of 48 percent to 35 percent (Devereux, Gri
th and Klemm, 2002). 1
Germany was one of the last countries to jump on the corporate-tax-cut bandwagon. Not
until 2001, it abandoned its split-rate system of 40 percent for retained and 30 percent
for distributed pro
ts in favor of a single uniform corporate tax rate of 25 percent.
We use this German Business Tax Reform 2000 (in the following: GBTR 2000) as a
quasi-experiment to shed light on the empirical question of the eective incidence of the
corporate income tax on wages. We use a wage bargaining model as the basis for a coun-
terfactual design that enables us to answer our research question Do wages rise when
corporate taxes fall? Concretely, we identify the direct incidence of the GBTR 2000 on
wages in the German manufacturing industry through a dierence-in-dierences approach
(DiD) that uses manufacturing companies in France as the control group. We
nd evi-
dence that GBTR 2000 led to a positive, signi
cant and sizeable wage eect. Hence, our
results suggest that GBTR 2000 did not only bene
t aected corporations but also their
employees.
The question of how the presumptive bene
ts from a trend of ever declining corporate
income tax rates are shared among the share- and stakeholders of corporations is of high
importance for policy makers. This holds true especially for the question of the eective
incidence of the corporate income tax on the factor labor, since many theoretical models
and empirical studies suggest that the immobile workforce may ultimately be the victim
of tax competition (Sinn, 2003, 21). 2
1 A downwoard trend, albeit less pronounced, is also observed for eective tax rates that account for
modi
cations in the provisions related to the corporate tax base, at least with respect to projects that
earn positive economic pro
ts, see Devereux et al. (2002, 460-468).
2 The underlying assumption for this claim is the conjecture that labour taxes might be needed to
ll
the gap that is caused by the erosion of corporate taxes and the corresponding loss of revenue, see Sinn
(2003, 20). However, as is documented inter alia by Becker and Elsayyad (2009, 108-109), the commonly
supposed shift from corporate tax reliance to taxes on less mobile personal income, i.e. mainly labour,
did not materialize, obviously because there was not gap that had to be
lled: Despite reduced corporate
4Our paper links the vast literature on corporate tax competition to the small but growing
literature on the eective incidence of corporate income taxation. The theoretical part
of the latter is characterized by two starkly contradicting views that depend on whether
one assumes a closed economy or an open economy setting. The
rst view dates back to
Arnold C. Harberger (1962) who came to the conclusion that the tax is borne entirely by
owners of capital. The second strand of the literature gives up the crucial assumption of
a closed economy. It assumes instead that capital is perfectly mobile between countries,
but labor is not. In this setting, a (higher) tax on corporate income tends to shift capital
to the rest of the world. This out
ow of capital reduces the return to labor and the home
country labor force eectively bears the entire burden of the tax (cf. Bradford 1978,
Gordon 1986, Kotliko and Summers 1987).
A number of more recent contributions have developed general equilibrium models of the
long-run incidence of taxes on corporate income in an open economy (see Randolph 2006,
Gravelle and Smetters 2006, Gravelle 2010, and Harberger 1995, 2006). Incorporating
more detailed assumptions about the economy, such as the extent of factor mobility, sup-
ply elasticities, the relative capital intensities of the dierent sectors and dierentiating
between perfect versus imperfect competition scenarios, these models arrive at intermedi-
ate predictions concerning the distribution of the corporate tax burden among the factors
of production.
Against this backdrop of con
icting theoretical results that depend heavily on the as-
sumptions made, a nascent empirical literature uses international data on corporate taxes
and wages to estimate the burden of the corporate income tax (see aus dem Moore 2014
for a comprehensive overview and Clausing 2012 for a thorough review). Instead of trying
to measure how corporate taxes aect rates of return on investment, which was the usual
approach of the early empirical endeavours on the subject (cf. Krzyzaniak and Mus-
grave 1963, and Cragg, Harberger and Mieszkowski 1967), these papers concentrate on
whether the imposition of corporate taxes reduces wages. 3 Despite many methodological
tax rates, corporate tax revenue in OECD countries remained high or has even been increased. Possible
solutions to this corporate tax rate revenue puzzle are oered by Auerbach (2007) and de Mooij and
Nicodème (2008).
3 For our evaluation of GBTR 2000, the following contributions possess the greatest relevance (here
5dierences across the studies, most of them come to the conclusion that labor bears a
substantial burden of the corporate tax.
We extend the literature by using the wage bargaining approach of Arulampalam et al.
(2012) in a regression formulation of the dierence-in-dierences (DiD) model. We
nd
evidence that GBTR 2000 led to a signi
cant and sizeable wage eect. In 2001, the
rst
year after GBTR 2000 took eect, we observe a signi
cant short-run eect that implies
a wage increase of 7.9 percent. Due to the dynamic nature of our empirical model, the
incidence eect grows gradually over time in the subsequent years. At the end of the
evaluation period in the year 2005, the cumulative eect reaches a value of 13.3 percent.
The remainder proceeds as follows: Section 2 presents an outline of the GBTR 2000,
section 3 discusses the research design, section 4 presents our empirical analysis and
section 5 concludes.
2 The German Business Tax Reform 2000
GBTR 2000 was motivated by concerns about the international competitiveness of corpo-
rate income taxation in Germany. One of its goals was to make Germany a more attractive
location for international investment. 4 At the same time, GBTR 2000 was part of a wider
overhaul of the German tax system. The overarching Tax Relief Act comprised sev-
eral modi
cations and reforms concerning dierent types of taxes, implemented stepwise
between the years 1998 and 2001. With respect to corporations, all de
ning dimensions
of the previous tax system were modi
ed with eect from January 1, 2001, namely the
(i) corporate tax system, (ii) the corporation tax rate, and (iii) the corporate tax base. 5
in alphabetical order): Arulampalam et al. (2012), Bauer, Kasten and Siemers (2012), Desai, Foley and
Hines (2007), Dwenger, Rattenhuber and Steiner (2011), Felix (2007), Felix and Hines Jr. (2009b,a),
Fuest, Peichl and Siegloch (2013), Hassett and Mathur (2010), and Liu and Altshuler (2013).
4 As the German Finance minister at the time, Hans Eichel, stated in a press conference in December
2009 on the announcement of the tax reform package: An overall good place for business also needs to
be a good place for business with respect to tax laws. (see Herz, 2005, our translation).
5 The brief description of GBTR 2000 and the surrounding Tax Relief Act in the following paragraphs
is based on European Commission (2003b, 102) and Sörensen (2007, 358-359).
6First, concerning the corporate tax system, the full imputation method that had been in
force since 1977 was abolished. Instead, a shareholder relief system has been introduced.
Under the new system, only one half of the dividends received by a private shareholder
are subject to personal income tax. At the same time, all deductions connected with
dividend income from the income tax base are halved. However, other elements of private
capital income, such as interest receipts, continue to be taxed at the full rate.
Second, the changes in the corporation tax rate covered both the structure and the level.
The split-rate that distinguished between retained (40 percent) and distributed pro
ts
(30 percent) was abolished and a single uniform tax rate of 25 percent was introduced.
Third, the base of the corporate income tax was broadened through cut-backs in the
depreciation allowances both for tangible
xed assets and for buildings. The maximum
declining balance rate for tangible
xed assets was reduced from 30 percent to 20 percent.
For buildings, the straight-line depreciation rate was reduced from 4 percent to 3 percent.
With respect to the question of corporate tax incidence, the most important element of
the GBTR 2000 is the harmonization and considerable reduction of the split corporation
tax rate to a uniform rate of 25 percent. This motivates the question whether this tax
rate cut led to a signi
cant wage eect.
Finally, in parallel to the GBTR 2000, the Tax Relief Act has reduced the personal income
tax rates that also apply to all non-corporate businesses in Germany in a substantial
way, albeit with a phase-in period of several years. The top marginal personal income
tax rate was lowered from 53 percent (55.92 percent including the so-called solidarity
surcharge of 5.5 percent) in three successive steps, leading to a rate of 42 percent in 2005
(44.31 percent including the solidarity levy). The top marginal tax rate begins to bite at
a taxable income of 52,152 Euro. During the phase-in period, the top marginal rate had
been set at 48.5 percent for the years 2001 to 2002, and at 47 percent for the years 2003
and 2004.
73 Research Design
Our analysis is based on the wage bargaining channel for the direct incidence of the
corporate income tax as proposed by Arulampalam et al. (2012). We identify the direct
wage eect of the GBTR 2000 corporate tax rate cut by using a modi
ed bargaining model
in a regression formulation of the dierence-in-dierences approach (henceforth: regression
DiD). In subsection 3.1 we give a brief outline of the underlying theoretical framework. 6
Subsection 3.2 delineates our procedure for the choice of an adequate comparison country
to model the necessary counterfactual within the regression DiD. Subsection 3.3 describes
the data used.
3.1 Theoretical Framework
Historically, the theoretical literature has established two channels of indirect incidence of
the corporate income tax on wages: while the capital stock channel is caused by responses
of investment to the tax-induced alteration of factor returns, the other is induced by the
alteration of output prices. These channels both aect the level of pre-tax pro
t. The
capital stock channel is also responsible for the inevitable deadweight loss of the corporate
income tax that results from tax-induced changes in the behavior of the aected
rms (cf.
Kotliko and Summers 1987, Fullerton and Metcalf 2002).
The model of a direct incidence of the corporate income tax on wages, derived by Aru-
lampalam et al. (2012) and generalized by Fuest et al. (2013), establishes an additional
mechanism by which corporate taxes may be passed on in the form of lower wages. This
new wage bargaining channel arises from rent-sharing between workers and
rms in a
context of imperfect competition: For a given pre-tax pro
t of a
rm, a higher (lower)
tax liability will directly reduce (enlarge) the quasi-rent over which workers and
rms can
bargain.
6 See the accompanying paper aus dem Moore (2014) for a more comprehensive exposition of the wage
bargaining approach to the eective incidence of corporate income taxation.
8This conceptual framework leads Arulampalam et al. (2012) to an empirical wage speci-
cation of the form
(1) w = w(f, μ, w̄, φ̄)
where f is the value added per employee, μ represents the relative union bargaining power,
w̄ the outside option for workers, and φ̄ contains variables to capture the tax liability of
the
rm.
Including the value added captures the eects of capital adjustments and output price
changes. In so doing, these indirect incidence eects of corporate income taxation are
separated from the direct eect that results from the wage bargaining channel. The
possibility to empirically detect the direct wage eect by estimating it on the basis of
rm-level accounting data provides us with the opportunity to use this framework as
the basis for our regression DID approach. However, this approach would not be very
meaningful for our purpose if we had to assume that the entirety of the corporate tax
incidence is dominated by sizeable indirect eects and that the direct incidence accounts
only for a minor part of the overall incidence. But recent empirical studies convincingly
point to the fact that the opposite seems to be true: in the contribution of Fuest et al.
(2013), which identi
es separately the direct wage eect through the wage bargain and
the conventional indirect wage eect through reduced investment, the bulk of the overall
incidence results undoubtedly from the direct eect that arises through the wage-bargain.
Against this backdrop, we are con
dent that our DiD approach which is based on the
wage bargaining channel captures the better part of the incidence eect that was caused
by the GBTR 2000.
3.2 Selection of a Comparison Country
Due to the temporal parallelity between GBTR 2000 and the personal income tax reforms
of the Tax Relief Act, the corporate sector and the non-corporate sector were concurrently
aected by substantial income tax reforms. This fact precludes the implementation of a
9DiD design based on a comparison within Germany, i.e. between incorporated companies
on the one side which are liable to corporate income taxation and non-incorporated
rms
on the other side which are not directly aected by changes of corporate tax rates. Hence,
to identify the wage incidence eects of the German business tax reform, we need to
nd
a suitable comparison country.
The ideal comparison country on economic grounds would possess a corporate tax system
without any relevant changes during our period of observation, should be quite similar to
Germany in key aspects of the economic structure and the macroeconomic situation, and
should display a steady evolution of wages in manufacturing devoid of signi
cant jumps
(that might result from economic policy measures like a labor market reform). Moreover,
from a pragmatic perspecitve, it would allow for a disaggregated
rm-level analysis on
the basis of high quality data, ideally in the form of a balanced dataset that contains long
spells without gaps for all relevant variables. Given that it is possible, to some degree at
least, to control for structural and business cycle dierences between dierent countries
by means of adequate control variables, the required stability of the respective corporate
tax system served as the preeminent economic selection criterion. Hence, we started our
selection procedure of a suitable comparison country with an analysis of the evolution of
corporate tax rates in potential comparison countries within Europe during a reasonable
time span around the eective date of GBTR 2000.
For our purpose, two tax rate measures are relevant that capture dierent aspects of the
respective corporate tax system: The statutory tax rate (STR) is the benchmark rate from
tax law that applies to pre-tax pro
ts and dominates political debates about corporate
tax reform. However, with respect to business decisions in already established
rms its
economic importance is limited since it abstracts from tax base eects. In contrast, the
eective marginal tax rate (EMTR) integrates relevant features of the tax base, notably it
accounts for depreciation allowances. Therefore, the EMTR is the relevant measure with
regard to investment decisions at the intensive margin, i.e. decisions about investments
in already existing production facilities. 7
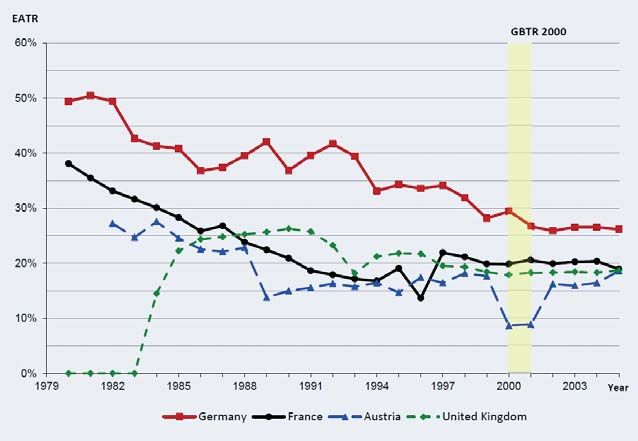
7 In contrast, the eective average tax rate (EATR) displays the tax burden that is relevant for corpo-
rate decisions at the extensive margin, i.e. concerning the location choice for a new production facility.
10Figures 1 and 2 show the evolution of the statutory tax rate and the eective marginal tax
rate of the corporate income tax in Germany, France, Austria and the United Kingdom
in the time period from 1979 to 2005. The yellow shaded bar highlights the eective date
of GBTR 2000 in January 2001.
Figure 1: Statutory Tax Rates, 1979-2005,
for Germany, France, Austria and the United Kingdom
Source : Devereux et al. (2002) for the data (Update 2005), own illustration.
The case of Austria shows why it is not su
cient to consider only the statutory tax rate
when choosing a comparison country: while in Figure 1 Austria looks like a near-to-
perfect comparison country in the relevant time span from 1996 until 2005 except for the
drop in the last year, this picture changes if one considers the eective marginal tax rates
instead. This can be seen in Figure 2. Simultaneously to the introduction of GBTR 2000
in Germany, the Austrian EMTR exhibits a decline (caused by legal alterations of the tax
Since the present analysis is focused on incidence eects in
rms that were established already several
years before the GBTR 2000 took place, the EATR was not relevant for the choice of our comparison
country. We report its evolution only for the sake of completeness in Figure 4 of the appendix.
11base) which is even larger than the fall of the EMTR in Germany due to GBTR 2000.
Hence, Austria is obviously no reasonable choice for providing the required comparison
sample of corporations. In contrast, France and the UK both exhibit a fairly constant
evolution of the respective statutory and eective marginal rates of the corporate income
tax with a smooth decline in France, mostly before the year 2001, and an almost
at
evolution in the UK.
Figure 2: Eective Marginal Tax Rates, 1979-2005,
for Germany, France, Austria and the United Kingdom
Source : Devereux et al. (2002) for the data (Update 2005), own illustration.
Table 1 contains variables with respect to size (population, nominal GDP), economic
structure (nominal GDP per capita, output share of manufacturing, GDP share of trade),
features of the labor market (wage bargaining system, union density, collective bargaining
coverage, labor compensation per hour, hours worked) and the macroeconomic situation
(unemployment rate, growth in nominal GDP) in Germany and the three possible com-
parison countries.
12Table 1: Country pro
les for Germany, France, Austria and the United Kingdom (1996-2005)
a
Germany France United Kingdom Austria
1996 2005 Δ 1996 2005 Δ 1996 2005 Δ 1996 2005 Δ
Population (millions) 81.92 82.47 0,7% 58.03 61.00 5,1% 58.16 60.24 3,6% 18.31 20.40 11,4%
GDP (nominal, billion USD) 1,892 2,588 36,8% 1,243 1,869 50,4% 1,220 1,969 61,4% 412 697 69,0%
GDP per capita (nominal, USD) 23,098 31,380 35,9% 20,845 29,759 42,8% 20,977 32,695 55,9% 21,600 32,586 50,9%
Output share of manufacturing b 32.5% 35.2% 2.7pp 28.4% 25.6% 2,8pp 27.9% 19.1% 8.8pp 28.0% 28.9% 0.9pp
GDP share of trade 24.4% 38.4% 14.0pp 22.4% 26.5% 4,1pp 29.3% 28.1% 1.2pp 19.3% 21.0% 1.7pp
Unemployment rate 8.7% 10.6% 1.9pp 11.5% 9.3% 2,2pp 7.9% 4.8% 3.1pp 8.2% 5.1% 3.1pp
Hourly compensation in
13
manufacturingb (nom., EUR) 24.60 30.00 22.0% 20.50 27.29 33.1% 16.96 26.81 36.7% 17.52 23.76 35.6%
Average hours worked,
all sectors 1518 1435 5.5% 1655 1559 5.8% 1742 1676 3.8% 1799 1732 3.7%
Dominant level(s) of
wage bargainingc Sector Sector and Company Company Sector
d
Union density 27.8% 22.6% (2003) 5.2pp 8.3% 8.3% (2003) − 31.7% 29,3% 2,4pp 40,1% 35,4% (2002) 4,7pp
Collective bargaining coverage d 70% (West) / 54% (East) 90%Table 1 shows that there is no clear winner who comes close to the ideal of being an
economic twin of Germany. Every candidate looks quite good in some dimensions and
rather bad in others. However, as said before, not all dimensions have the same critical
importance in the given context: in our regression DiD approach, we should be able to
control for deviations in the macroeconomic evolution over time through country-speci
c
and time-varying controls like GDP or the unemployment rate.
If we focus on the more structural attributes and their change over time (displayed in
the respective Δ columns either as a percentage change for base values in levels or as a
change in percentage points, if base values are already percentages), France and Austria
seem to be better suited as a comparison country than the United Kingdom.
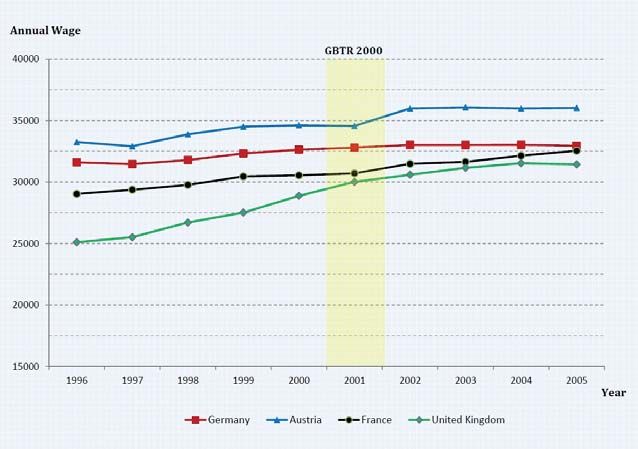
Figure 3: Average Wages in Manufacturing, 1996-2005,
for Germany, France, Austria and the United Kingdom
Source : OECD.Stat for the data, own illustration.
Note : Average wages are in national currencies and 2011 constant prices.
In the third step of our selection procedure, we took a closer look at the evolution of
average manufacturing sector wages in Austria, France and the UK to gauge their respec-
14tive suitability as comparison country. Figure 3 shows a noticeable increase in Austria
from the year 2001 to 2002, i.e. in parallel to the coming into eect of GBTR 2000,
thereby rendering the country less suitable as a possible source for the required counter-
factual company sample. France and the UK both display a virtually constant upward
trend. Since the gradient is much greater in the UK, France appears to be a more suitable
comparison country in this respect.
Synthesizing the insights from the
rst three steps of our selection procedure, we choose
France as our comparison country:
rst, the important features of its corporate tax system
remain fairly constant during the period of study; second, it is similar to Germany in many
relevant aspects; and third, the evolution of the average wage in the manufacturing sector
seems to be steady enough, with a constant trend before and after the coming into eect
of GBTR 2000. Overall, the country should ful
ll the necessary conditions to serve as an
adequate source for the required counterfactual
rm sample. Last but not least, the data
quality for France is among the best in the Amadeus accounting data base. Nevertheless,
as part of our robustness checks, we also performed a DiD analysis with companies from
the UK serving as the comparison group.
3.3 Data
Our empirical analysis is based on the pan-European database AMADEUS compiled
by the Bureau van Dijk (BvD). The dataset contains detailed accounting information on
more than 10 million companies from 41 countries, including the EU countries and Eastern
Europe. A standard company report includes 24 balance sheet items, 26 ratios, 25 pro
t
and loss items and descriptive information including trade descriptions and activity codes.
Our empirical approach requires a large number of observations for at least four subsequent
years in both periods, i.e., before and after the implementation of GBTR 2000. Trying
to
ll existing gaps in individual updates of the Amadeus database as far as possible, we
merged the updates #136 (January 2006) and #168 (January 2008) to cover consistently
the time span from 1996 to 2005. We limit our sample to the manufacturing industry
to improve the comparability between the
rms from Germany and France.Furthermore,
15we only consider quoted companies since they exhibit more comprehensive and complete
information than non-quoted
rms, especially in the case of Germany. 8
Following Arulampalam et al. (2012), we only selected companies that are not de
ned as
micro by European Commission (2003a), that is companies with at least two subsequent
years of recorded total assets bigger than two million Euros and at least one employee.
As usual, observations with obvious errors (like negative values for
xed assets, turnover
or total costs of employees) were dropped. Finally, all observations in the
rst and 99th
percentile of the distribution for the main variables have been removed. The resulting
sample contains information on 208
rms in Germany and 201
rms in France. Table 2
displays the observations per year in the manufacturing sectors of Germany and France.
Table 2: Observations per Year
Year Germany France Total
1996 208 199 407
1997 207 200 407
1998 206 199 405
1999 205 199 404
2000 206 200 406
2001 205 200 405
2002 206 201 407
2003 203 201 404
2004 203 199 402
2005 204 200 404
Total 2,053 1,998 4,041
Note : Data from Amadeus (BvD),
Updates #136 and #168.
8 In France, publication requirements in the form of a yearly balance sheet submission at a public
registry also apply to unlisted companies of moderate size, whereas in Germany, comparable mandatory
reporting requirements only apply to quoted corporations.
16Turning to the variables used in our regression framework, we proxy the annual wage wit
by the annual average company wage, calculated by dividing the Amadeus variable costs
of employees by the number of employees. A potential distortion of using this very
rough proxy measure for the wages actually paid is that a layo of workers might, given
unchanged overhead costs in the short-run, lead to an arti
cial rise of our wage rate. 9
In addition, the base variable Total costs of employees for the wage rate also in-
cludes social security contributions that could be aected by legal changes indepen-
dent of GBTR2000 and thereby invalidate our identi
cation strategy. Unfortunately,
the Amadeus database does not provide a wage measure that is disaggregated further
into its single components. To interpret our later regression results in a strict sense as
a pure wage eect, we thus have to assume that social security contributions in both
countries remained fairly constant over time. 10
The value added per employee is calculated by dividing the Amadeus variable Value
added by the total number of employees. The macroeconomic variables national rate
of unemployment and national rate of GDP growth are taken from the OECD
database, likewise the harmonised consumer price index that was used to de
ate all mon-
etary variables with 2005 being the base year.
Table 3 provides an overview of the summary statistics of our
nal dataset for Germany
and France, including additional information on the tax liability per employee , calcu-
lated by dividing the tax item recorded in the pro
t and loss statement by the number of
employees, as well as on the operating pro
t per employee and operating turnover
per employee that are constructed in the same way.
9 To control at least in a rudimentary way for the possibility of such an employment eect, we included
the annual number of employees in a later robustness check of our benchmark speci
cation, but its
estimated coe
cient was very small and not signi
cant.
10 In fact, data from the OECD tax database suggests that this assumption is not too farfetched for
the time period under consideration, see OECD (2013).
17Table 3: Descriptive Statistics for Germany and France, Manufacturing Sector
Germany France
Mean Median S.D. Mean Median S.D.
Wage Rate 48.82 48.71 15.70 42.54 40.01 16.31
Number of Employees 13,704 1,020 52,984 3,278 311 13,588
Value added per Employee 73.82 67.29 61.19 67.43 55.93 62.81
Tax Liability per Employee 5.17 2.77 10.92 5.17 2.21 11.21
Operating Pro
t per Employee 12.44 8.99 51.65 14.95 9.01 34.95
Operating Turnover per Employee 237.73 181.78 279.61 208.39 162.85 176.27
National Rate of Unemployment 8.87 8.70 0.92 9.77 9.20 1.13
National Rate of GDP Growth 1.29 1.40 1.02 2.22 1.90 1.02
Notes: Data from Amadeus (BvD), Updates #136 and #168. All monetary values in EUR,
de
ated to year 2005.
184 Empirical Analysis
The following subsections introduce the econometric model (4.1), present the results of
our baseline DiD regression (4.2) and discuss issues of robustness (4.3).
4.1 Econometric Model
Since we want to evaluate the direct incidence eect of GBTR 2000 as a policy intervention
by means of a regression DiD approach , the annual tax liability φ̄ (see equation 1) from
the original framework drops out of this reduced form policy evaluation. 11 Building upon
the basic speci
cation from aus dem Moore (2014), our preferred speci
cation for the
implementation of our regression DID approach reads as follows:
ln wit = β10 ln wi,t−1 + β11 ln wi,t−2
+ β20 ln avi,t + β21 ln avi,t−1 + β22 ln avi,t−2
(2) + σ01 unemplj,t + σ02 gdpj,t
+ γ01 treatj + γ02 periodt + δ DiDj,t
+ λ01 yeart + λ02 μi + i,t
where i, j and t index companies, countries and years respectively and ln wit is the log
wage rate. By including the per capita level of value added in logs ( avi,t ) in equation 2,
we not only control for changes in the business situation of the
rm, but also for possible
indirect incidence eects of coporate income taxation that would materialize in the value
added.
Under the assumption that
rms earn economic rents over which employers and employ-
ees may bargain, the extent of the tax eect on the wage rate essentially depends on the
bargaining power of both negotiating partners. By adding a country-speci
c and time-
11 Concretely, our aim here is not to estimate the corporate tax elasticity of wages in the manufacturing
sector as it was done in aus dem Moore (2014) by regressing annual wages on annual tax liabilities at
the
rm-level, but to analyze whether GBTR 2000 as an important corporate tax policy reform had a
seizable eect on wages in the manufacturing sector. Obviously, the identi
cation of a presumptive wage
eect of GBTR 2000 requires that annual tax liabilities are not explicitly modelled in the DiD regression.
19varying unemployment rate ( unemplj,t ) as well as the country-speci
c and time-varying
rate of GDP growth ( gdpj,t ) in our estimation model, we try to capture important fac-
tors for the bargaining power of employers and employees at least to some extent. In
the context of the bargaining model, we assume that higher GDP growth provides for
more leeway for wage gains, but that the assertiveness of the union declines with higher
unemployment rates.
The DiD approach is implemented in the fourth row of equation 2: Germanyj is a dummy
variable that indicates the treatment group in our quasi-experimental setting. Thus,
Germanyj equals 1 if the
rm is located in Germany and 0 for French companies.
The time period dummy Af ter2000t is an auxiliary variable that is 1 if the respective
observation falls in the post reform period (2001-2005) and 0 if it is located in the time
span before GBTR 2000 (1996-2000). We follow the standard DiD approach by de
ning
DiDj,t as the product of Germany and Af ter2000: DiDj,t = Germanyj × Af ter2000t .
Therefore, DiDj,t is 1 for German companies in the post reform period and 0 otherwise.
By using year dummies yeart we account for general time eects. 12 Additionally, we
include the vector μi to capture the company-speci
c time-invariant eects. The overall
error term is represented by i,t . In order to adjust for in
ation, all monetary variables
in equation 2 are de
ated to year 2005 prices by using the harmonised country- and
year-speci
c consumer price indices provided by the OECD.
In our research design, the correct interpretation of δ , the tax reform evaluation para-
menter of interest, is not trivial due to the integration of the DiD technique into a dynamic
panel model. When considered individually, the estimate of the coe
cient δ states the
direct incidence eect on wages of GBTR 2000 only with respect to the
rst year after
the reform, i.e. in 2001, but not for the entire evaluation period from 2001 to 2005. Table
4 shows the evolution of the cumulative eect over time. The formulae for the respective
cumulative incidence eects in the years from 2001 to 2005, displayed in the notation of
equation 2, result as the dierence of the predicted values for Germany and France in the
respective years (See the appendix for the explicit derivation of these formulae).
12 Due to the inclusion of year dummies, the Af ter2000 dummy will drop out of the later estimations
for reasons of multicollinearity. The interaction term DiDj,t is unimpaired from this technical eect.
20Table 4: Formulae for Dynamic DiD Eects from 2001 to 2005
Year Eect Formula
2001 δ
2002 δ (1 + β10 )
2003 δ (1 + β10 + β 2 10 + β11 )
2004 δ (1 + β10 + β 2 10 + β 3 10 + β11 + β11
2
)
2005 δ (1 + β10 + β 2 10 + β 3 10 + β 4 10 + β11 + β11
2 3
+ β11 + β11 )
4.2 Estimation Results
We estimate our preferred dynamic speci
cation (2) by means of four dierent estimation
techniques: We run pooled Ordinary Least Squares (OLS) and Fixed Eects (FE) as well
as the Dierence and System versions of the Generalized Methods of Moments (GMM)
estimator. As commonly known, OLS and FE estimates are inconsistent in a dynamic
context with a lagged dependent variable, 13 but they enable us to check the validity of
the GMM estimations and the plausibility of our results: Where OLS overestimates the
coe
cients of the lagged dependent variable ln wi,t−1, FE leads to underestimation. This
implies that credible GMM results should fall between these bounds (cf. Bond 2002, 3-5).
Table 5 summarizes the results of our benchmark estimations.
The results in table 5 show that only the System GMM estimation leads to an estimate
of the coe
cient of the lagged dependent variable ln wi,t−1 of 0.39 that lies between the
upward-biased OLS estimate (0.52) and the downward-biased FE estimate (0.11). The
diagnostic test results for this estimation are also satisfying: The AR(1)-test for
rst
order serial correlation is rejected, but the AR(2)-test for second order serial correlation
is not. This means that a crucial condition for the applicability of the GMM estimator,
namely the absence of serial correlation in the errors of the levels equation, is ful
lled.
Likewise, Hansen's χ2-test for over-identi
cation is clearly not rejected. We can therefore
concentrate our interpretation on the System GMM results.
13 See the discussion in aus dem Moore (2014) and the references given therein.
21Table 5: DiD Analysis of GBTR 2000, Benchmark Results
Dependent Variable: OLS FE GMM GMM
Wage (in logs) (Dierence) (System)
Wage (
rst lag) 0.524*** 0.106** 0.101 0.388***
(0.0430) (0.0510) (0.0705) (0.0530)
(second lag) 0.212*** -0.168*** -0.102* 0.0604
(0.0345) (0.0537) (0.0589) (0.0418)
Value added 0.428*** 0.411*** 0.268*** 0.428***
(0.0606) (0.0551) (0.0876) (0.0922)
(
rst lag) -0.199*** -0.0567 -0.0791 -0.158***
(0.0503) (0.0476) (0.0519) (0.0554)
(second lag) -0.0767*** 0.0643* 0.0439 -0.00978
(0.0248) (0.0345) (0.0326) (0.0232)
treat (Dummy) -0.0719 -0.0441
(0.0498) (0.0351)
DiD 0.0555 0.0666* 0.0553* 0.0790***
(0.0427) (0.0389) (0.0327) (0.0305)
Unemployment Rate -0.0276* -0.0291** -0.0378** -0.0340***
(0.0151) (0.0145) (0.0163) (0.0117)
GDP Growth Rate -0.0397* -0.0289 -0.00907 -0.0250
(0.0216) (0.0211) (0.0210) (0.0172)
R2 0.766 0.403
Observations 1,468 1,468 1,147 1,468
Groups 285 262 285
Instruments 80 124
AR(1)-test p-value 0.000 0.000
AR(2)-test p-value 0.407 0.173
Hansen χ2 -test - p-value 0.557 0.382
Notes : (i) Year dummies and a constant term are included in all estimates. (ii)
The standard errors are reported in parentheses. (iii) * Signi
cant at 10%, ** at
5%, *** at 1%. (vi) Columns (3) and (4) show results of two-step estimators with
nite sample correction.
As expected, the coe
cients for the lagged wage rate and for value added per worker
are highly signi
cant at the one percent level, and of considerable but not implausible
size (0.39 and 0.44 respectively). Although it is only measured at the country-level, the
unemployment rate has a signi
cant and, as expected, negative eect on the wage rate
(-0.03). In contrast, the GDP growth rate is not signi
cant (p-value of 0.148). Given
that the business cycle situation should be captured to a certain degree by the inclusion
of year eects and, even more important, be re
ected in the
rm-speci
c value added,
22the non-signi
cance of GDP is not surprising. Overall, our parsimonious model seems to
capture quite well the most important factors that in
uence wages at the
rm-level.
Turning to our DiD framework, we note the non-signi
cance of the country dummy
Germany (p-value of 0.21). Hence, after the inclusion of the present covariates and con-
trol variables at
rm- and country-level, there were obviously no discernible dierences
left between German and French companies that showed up in a statistically signi
cant
manner over the time-span from 1996 to 2005.
Finally, the coe
cient value of 0.079 for the interaction term DiDj,t is highly signi
cant
at the 1 percent level. Following the formulae depicted in table 4, the results for the
cumulative eects in the years 2002 to 2005 were calculated as a nonlinear combination
of estimates according to the delta method. 14 The summarized results in table 6 show
how the size of the respective cumulative eect gradually builds up over time, with larger
increments in the
rst three years (2001 to 2003) and considerably smaller increments
in the years four and
ve (2004 and 2005). In economic terms, our DiD evaluation of
GBTR 2000 implies a short-run eect, i.e., in year one after the reform, of increasing
wages by 7.9 percent and a long-run eect, i.e. in year
ve after the reform, of increasing
wages by 13.3 percent.
Table 6: Cumulative DiD-Eects, estimates over time from 2001 to 2005
Cumulative DiD Eect Coe
cient Std. Err. z P>|z| [95% Conf. Interval]
Dependent Variable:
Wage
Eect 2001 .0789599 .0304766 2.59 0.010 .019227 .1386929
Cum. Eect 2002 .1095838 .0427296 2.56 0.010 .0258354 .1933322
Cum. Eect 2003 .1262273 .0488513 2.58 0.010 .0304806 .221974
Cum. Eect 2004 .1311215 .0510607 2.57 0.010 .0310443 .2311986
Cum. Eect 2005 .1329254 .0519837 2.56 0.011 .0310392 .2348117
14 We used the Stata command nlcom to implement the delta method.
234.3 Robustness
To check the sensitivity of our baseline result, we
rst experimented with alternatives to
the dynamic structure and set of control variables of our empirical model. Secondly, we
tested dierent instrument sets in the implementation of the System GMM technique.
Finally, we also applied the simple aggregation and averaging procedure proposed by
Bertrand, Du
o and Mullainathan (2004).
First, we inspected the robustness of our baseline results by implementing a more parsi-
monious speci
cation, i.e., with only one lagged value of wage rate and value added. The
ensuing results for the System GMM estimation are displayed in column (1) of table
7.15 The central variables still display signi
cant coe
cients that are in most cases of
the expected sign, with the notable exception of, as before in our baseline estimation,
the
rst lag of value added. The policy evaluation parameter of interest, DiD, has now a
coe
cient size that corresponds to an immediate wage eect of 5.5 percent. However, its
signi
cance dropped from the one percent to the ten percent level.
The second column of table 7 shows the results from a speci
cation without any lags for
the value added that we estimated for two reasons: First, we do not need the respective
coe
cients of the lags of value added for the calculation of the direct incidence eect over
time (see above). Second, the dubious negative sign of the
rst lag in our baseline results
and in column one of table 7 suggests that a closer inspection of the way in which the
value added is included in the estimation is warranted. The results in column (2) con
rm,
especially when compared to column (1), that the lags of value added are not the decisive
driver of our results for the parameter DiD. Its coe
cient size now implies a rise of the
wage rate of 6.1 percent. The signi
cance is unchanged at the ten percent level.
Finally, in column three of table 7, we document the result of a speci
cation that diers
from the baseline model only by the absence of the GDP growth rate that turned out
to be insigni
cant in table 5. As expected, the impact of dropping the GDP growth
rate is quite small, but nevertheless visible: The coe
cient size of DiD is reduced from
7.9 percent in the benchmark speci
cation to 7.0 percent, its level of signi
cance drops
15 The full results including OLS, FE and Dierence GMM are available upon request.
24from the one to the
ve percent level. We also carried out estimations that included
further control variables which one might assume to have an impact on the tax liability of
a
rm, like its debt ratio (as a proxy for the tax-shield eect from deductible costs of debt
nancing) or its capital intensity (as a proxy for likely tax savings due to allowances for
16
capital investments), but none of them was found to be signi
cant. Overall, the three
robustness checks that are incorporated in table 7 suggest that the existence of a positive
wage eect of GBTR 2000 via the bargaining channel is qualitatively quite robust, but
quantitatively rather sensitive to alternative speci
cations.
One explanation for the dierences in the coe
cient size and signi
cance of DiD seems to
be that alternatives in the dynamic structure lead to visible dierences in the number of
rms and observations that are included in the respective estimation. As a speci
cation
choice gets more demanding with respect to the number of spells without gaps, the sample
of
rms that ful
ll this standard becomes ever smaller.Our benchmark estimation is based
on 1,468 observations from 285 dierent
rms, whereas the speci
cation with only one
lagged value of wage rate and value added in column (1) of table 7 uses 1,874 observations
from 326
rms. Obviously, we face a trade-o between quantity and quality of the data
included in the DiD estimations. If sample size is reduced as a side eect of a more
demanding speci
cation, the coe
cient size and the precision of its estimation grow. An
economic explanation for this observation might be that in our dataset, companies with
fewer or no gaps in their spells are at the same time more pro
table, and hence provide
the basis for a larger tax incidence eect via the wage bargaining channel.
A potential caveat in our study (as in almost every implementation of the System GMM
technique) is the choice of the instrumental variables, especially the risk of obtaining
signi
cant results as a consequence of instrument proliferation (see Roodman 2009b).
However, in the case of our benchmark speci
cation the imperative to reduce the size or
the composition of the instrument set seems not to be present: given a favorable ratio of
124 instruments used in an estimation with 285 groups (
rms), our results should not be
driven by instrument in
ation. Nevertheless, we checked the respective robustness of our
16 Results are available upon request.
25Table 7: Alternative DiD Speci
cations
(1) (2) (3)
Dependent Variable: One lag No lags of value added No GDP
Wage (in logs)
GMM GMM GMM
(System) (System) (System)
Wage (
rst lag) 0.339*** 0.276*** 0.388***
(0.0567) (0.0609) (0.0535)
(second lag) 0.0622** 0.0590
(0.0306) (0.0414)
Value added 0.292*** 0.248*** 0.433***
(0.0917) (0.0662) (0.0910)
(
rst lag) -0.0812* -0.159***
(0.0463) (0.0545)
(second lag) -0.00906
(0.0236)
treat (Dummy) 0.0211 -0.0321 -0.00676
(0.0369) (0.0391) (0.0308)
period (Dummy) -0.0246 -0.0242
(0.0345) (0.0198)
DiD 0.0554* 0.0606* 0.0698**
(0.0294) (0.0314) (0.0320)
Unemployment Rate -0.0210* -0.0302** -0.0311**
(0.0115) (0.0122) (0.0122)
GDP Growth Rate -0.00573 -0.0307
(0.00941) (0.0188)
Observations 1874 1571 1468
Groups 326 302 285
Instruments 85 124 123
AR(1)-test p-value 0.000 0.001 0.000
AR(2)-test p-value 0.450 0.198 0.174
Hansen χ2 -test - p-value 0.287 0.322 0.390
Notes : (i) Year dummies and a constant term are included in all estimates. (ii)
The standard errors are reported in parentheses. (iii) * Signi
cant at 10%, ** at
5%, *** at 1%. (vi) Columns (3) and (4) show results of two-step estimators with
nite sample correction.
baseline results through a stepwise reduction in the number of instruments used. Table 8
documents the results obtained.
For ease of comparability, column (1) repeats our benchmark speci
cation that contained
the second and all available higher lags of the wage rate and value added as GMM instru-
26ments.17 In column (2), the instrument count is reduced to 104 by the restriction to use
only the second and third lags as GMM instruments (2 3). With respect to the results,
two changes are noteworthy: First, the size of the DiD coe
cient is reduced to 6.6 per-
cent and its signi
cance drops to the 5 percent level. Second, the previously insigni
cant
coe
cient of the GDP growth rate is now signi
cant at the 10 percent level, but with the
wrong sign: there is no economic reasoning that provides an explanation why the wage
rate should decline in times of higher GDP growth rates.
The speci
cation reported in column (3) pushes the reduction of the instrument set one
step further by restricting it only to the second lag (2 2). The number of instruments drops
slightly from 104 to 94, but the estimation results stay virtually unchanged in comparison
to column (2). Finally, we enforce the use of a drastically reduced number of instruments
by collapsing the instrument matrix. While the numerical size of the DiD coe
cient in
column (4) remains virtually unchanged compared to column (3), its signi
cance now
vanishes completely. At the same time, the wrongly signed
rst lag of value added looses
its signi
cance in contrast to all previous estimations. On the other hand, the absolute
size of the negatively signed GDP coe
cient grows considerably from -0.027 to -0.046.
To sum up, we note that our benchmark estimation is quantitatively and qualitatively
very robust to a considerable reduction of the number of instruments from 124 to 94, but
that collapsing the instrument matrix leads not only to a very small instrument count of
24 in an estimation with 285 groups, but also to the disappearance of the signi
cance of
the coe
cient estimate for the policy evaluation variable DiD. However, we believe that
the collapse option replaces one evil with another, i.e., while lowering the risk of using
too many instruments, it enforces the use of too few.
If we ignore the time-series information completely by splitting and averaging the data in
two periods, before and after the coming into eect of GBTR 2000, and then run a static
OLS regression on the resulting panel of length two as advocated by Bertrand et al. (2004,
267), all coe
cients except the one for value added turn insigni
cant. This result does of
17 Abbreviated here with the respective notation from the Stata command xtabond2 as (2 .) in the row
Instrument lag structure: The leading (2) denotes that the second lag is used as the
rst instrument, the
following (.) implies that all higher lags are, if available in the data, used to generate further instruments,
see Roodman 2009a for details.
27Table 8: Alternative Speci
cations of GMM Instruments
(1) (2) (3) (4)
Instrument lag structure GMM Lags (2 .) GMM Lags (2 3) GMM-Lags (2 2) Collapse
Dependent Variable: GMM GMM GMM GMM
Wage (System) (System) (System) (System)
Wage (
rst Lag) 0.388*** 0.381*** 0.387*** 0.241***
(0.0530) (0.0550) (0.0554) (0.0921)
(second Lag) 0.0604 0.0665 0.0661 -0.0199
(0.0418) (0.0420) (0.0427) (0.0655)
Value added 0.428*** 0.418*** 0.422*** 0.480**
(0.0922) (0.0884) (0.0953) (0.211)
(
rst Lag) -0.158*** -0.148*** -0.150*** -0.131
(0.0554) (0.0549) (0.0579) (0.0932)
(second Lag) -0.00978 -0.00822 -0.00633 0.0247
(0.0232) (0.0241) (0.0240) (0.0396)
treat (Dummy) -0.0441 -0.0380 -0.0358 -0.0471
(0.0351) (0.0353) (0.0354) (0.0500)
DiD 0.0790*** 0.0658** 0.0650** 0.0652
(0.0305) (0.0293) (0.0281) (0.0435)
Unemployment Rate -0.0340*** -0.0266** -0.0254** -0.0368**
(0.0117) (0.0116) (0.0113) (0.0165)
GDP Growth Rate -0.0250 -0.0308* -0.0274* -0.0460**
(0.0172) (0.0157) (0.0150) (0.0214)
Observations 1468 1468 1468 1468
Groups 285 285 285 285
Instruments 124 104 94 34
AR(1)-test p-value 0.000 0.000 0.000 0.000
AR(2)-test p-value 0.173 0.152 0.154 0.255
Hansen χ2 -test - p-value 0.382 0.325 0.383 0.662
Notes : (i) Year dummies and a constant term are included in all estimates. (ii) The standard errors
are reported in parentheses. (iii) * Signi
cant at 10%, ** at 5%, *** at 1%. (vi) Columns (3) and
(4) show results of two-step estimators with
nite sample correction.
course not support the claim of a signi
cant wage eect of GBTR 2000, but it does not
preclude it either since the time-series information is obviously an important information
in the dynamic context of a wage bargaining model. Moreover, the fact that simple
aggregate means of the central variables in the two periods before and after GBTR 2000
do not reveal by themselves a signi
cant DiD eect, as already shown by
gure 3, was
the reason to set up a regression DiD framework in the
rst place.
285 Conclusion
We use the bargaining model for the direct incidence of the corporate income tax proposed
by Arulampalam et al. (2012) as the basis for a dierence-in-dierences regression model
to identify the wage eect of the German Business Tax Reform 2000 (GBTR 2000) for
workers in the German manufacturing sector. We use manufacturing companies in France
as the comparison group to construct the required counterfactual and estimate a dynamic
model to account for adjustment lags with OLS, Fixed Eects and GMM techniques.
Our preferred System GMM speci
cation suggests that GBTR 2000 led to a signi
cant
and sizeable wage eect. In 2001, the
rst year with GBTR 2000 in eect, we observe a
signi
cant short-run eect that implies a wage increase of 7.9 percent. Due to the dynamic
nature of our model, the incidence eect grows gradually over time. At the end of the
evaluation period in the year 2005, the cumulative eect reaches a value of 13.3 percent.
Our
ndings prove to be quite robust with respect to changes in the dynamic structure of
the empirical model and to the instrument set used in the System GMM estimation. The
eect size of our result seems quite plausible against the backdrop of recent contributions
to the empirical literature on corporate tax incidence, notably Fuest et al. (2013), that
underline the dominance of the direct incidence through the wage bargain over indirect
eects via capital stock adjustments.
However, we are aware of the fact that to obtain these results, we had to invoke several
rather strong assumptions with the respect to the
rm-level data we use and the choice
of France as the comparison country that would threaten the validity of our identi
cation
strategy if refuted. In the following, we brie
y explore these issues.
Firstly, we had to use consolidated accounts of quoted companies to ensure the necessary
density of observations for the German companies that is needed for the estimation of
a dynamic model, especially if one has to employ the data consuming GMM estimation
techniques. As a result, the information contained in these accounts does not only result
from business activities in Germany but in case of the multinational groups in our dataset
also from their international subsidiaries. However, the resulting composition eect does
29not invalidate the use of the bargaining model from Arulampalam et al. (2012) as our
conceptual framework, since the empirical studies of Budd and Slaughter (2004) and
Budd, Konings and Slaughter (2005) provide convincing evidence that the domestic labor
forces of multinational enterprises bargain over the aggregate pro
ts at group level, not
only over the domestic share of these pro
ts. Nonetheless, it would have been a desirable
re
nement of our analysis to distinguish purely national from multinational companies, if
the accounting data quality for Germany had allowed for an analysis on a broader basis,
i.e., including also unlisted
rms. 18
With respect to the validity of the comparison between manufacturing companies from
Germany and France, the ideal ceteris paribus condition of no relevant policy changes
over time except for GBTR 2000 was of course not completely ful
lled in the real world.
There were a number of reforms and policy changes in both countries that possibly had
an impact on the evolution of wages in the manufacturing sector. Most noteworthy are, in
France, the stepwise introduction of the 35h-workweek in February 2000 (for large
rms)
and January 2001 (for smaller companies) 19 , and in Germany, the enacting of the so called
Hartz reforms of the labor market in December 2002 and December 2003 that, amongst
other measures, consolidated the previously separated institutions of unemployment aid
and social welfare in a single system. 20
However, both reforms should principally reduce the size of the incidence eect that we
obtain in our DiD regression, since the introduction of the 35h workweek tends to increase
the wage sum at the level of the individual
rm level in France ceteris paribus (due to
increased overtime pay or the remuneration of additional workers), whereas the Hartz
reforms supposedly depressed wages, at least in the low-pay sector, in Germany. 21
18 However, in their multi-country analysis, Arulampalam et al. explicitly distinguish
rms operating
only in one country from those that are part of a multinational enterprise, but
nd no signi
cant dierence
between the two groups with respect to the direct corporate tax incidence via the wage bargaining channel,
cf. Arulampalam et al. (2012, 1050-1052).
19 See Estevao and S. (2008) for details.
20 See Fertig and Kluve (2004) and Jacobi and Kluve (April 2006) for details.
21 Moreover, the most profound part of the comprehensive Hartz reform package, called Hartz IV,
came not into eect untill January 2005, i.e. only shortly before the end of our evaluation period and
four years after the eective date of the GBTR 2000.
30You can also read