Evasion Publicity Campaign - Post-Campaign Tracking 2013/2014: Report on findings among Small and Medium Enterprises
←
→
Page content transcription
If your browser does not render page correctly, please read the page content below
Evasion Publicity Campaign

Post-Campaign Tracking 2013/2014:
Report on findings among Small
and Medium Enterprises

Her Majesty’s Revenue and Customs Research Report 346

     Controlled document - Issue 4

          TNS BMRB
                              JN 260121209

Disclaimer
© Crown Copyright 2014 Published by Her Majesty’s Revenue and Customs.
Disclaimer: The views in this report are the authors’ own and do not necessarily
reflect those of HM Revenue & Customs.

i             Evasion Publicity Campaign 2014 – Report on findings among SMEs

Contents

1. Glossary and notes .......................................................................... 1
    1.1      Glossary of terms ............................................................. 1
    1.2      Reporting notes ................................................................ 3
2. Executive summary.......................................................................... 4
    2.1      Introduction ..................................................................... 4
    2.2      Methodology .................................................................... 5
    2.3      Campaign awareness and recognition ................................. 6
    2.4      Reactions to campaign ...................................................... 6
    2.5      Attitudes to tax evasion and the detection of tax evasion ...... 7
    2.6      Conclusions ..................................................................... 8
3. Introduction .................................................................................... 9
    3.1      Background ..................................................................... 9
    3.2      Research aims and objectives .......................................... 11
4. Method and sample ........................................................................ 12
    4.1      Survey and sample design ............................................... 12
    4.2      Weighting ...................................................................... 13
5. Campaign awareness and recognition............................................ 15
    5.1      Campaign awareness ...................................................... 15
    5.2      Campaign recognition ..................................................... 17
    5.3      Offshore Accounts Campaign ........................................... 19
6. Reactions to the campaign ............................................................. 21
    6.1      Take out of main message ...............................................             21
    6.2      Impressions of the campaign ...........................................              23
    6.3      Awareness and usage of sortmytax webpage .....................                       27
    6.4      Campaign performance and reaction by segment ...............                         27
7. Claimed behaviours ....................................................................... 30
    7.1      Actions taken since seeing the campaign ........................... 30
    7.2      Actions taken in last four months ..................................... 30
8. Attitudinal data .............................................................................. 33
9. Conclusions.................................................................................... 38
    9.1      Campaign awareness and recognition ...............................                   38
    9.2      Reactions to the campaign ...............................................            38
    9.3      Claimed behaviours ........................................................          38
    9.4      Attitudes .......................................................................    39
10. Appendix A: Additional Data ......................................................... 40
    10.1 Spontaneous advertising measures ................................... 40
    10.2 Impressions of the advertising campaign ........................... 42
    10.3 Measuring advertising effectiveness with AdEvalTM .............. 43

Evasion Publicity Campaign 2014 – Report on Findings among SMEs                                          ii
10.4 Attitudes towards tax evasion and the detection of tax evasion45
11. Appendix B: Campaign Materials .................................................. 50
      11.1   Radio- Evasion Publicity ..................................................              50
      11.2   Posters / billboards- Evasion Publicity ...............................                  51
      11.3   Ambient- Evasion Publicity...............................................                52
      11.4   Print – Offshore Accounts ................................................               53
12. Appendix C: Letter sent in advance .............................................. 54
13. Appendix D: Response rates and significance testing ................... 56
      13.1 Response rates .............................................................. 56
      13.2 Significance Testing ........................................................ 57
14. Appendix E: Questionnaire ........................................................... 58
15. Appendix F: Sample information and weighted and unweighted
profiles............................................................................................... 77
      15.1 Sample Information ........................................................ 77
      15.2 Weighting ...................................................................... 78
      15.3 Sample profiles (weighted) .............................................. 80

iii                Evasion Publicity Campaign 2014 – Report on findings among SMEs
1. Glossary and notes
1.1 Glossary of terms
For the purpose of this research report the definitions below have been used.

Table 1.1: Glossary

Campaign           These are the terms used to differentiate between those
recognisers/non    who claimed to have seen at least one element of the
-recognisers       campaign in question when prompted with campaign
                   stimulus and those who said they had not seen any element
                   of the campaign in question when prompted with campaign
                   stimulus.
Compliance         This is a survey which has been commissioned by HMRC
Perceptions        since 2008. The Compliance Perceptions Survey (CPS)
Survey             measures perceptions of tax compliance among Small and
                   Medium Sized Enterprises (SMEs) and individuals. The 2012
                   report can be found at:
                   http://www.hmrc.gov.uk/research/report290.pdf
Coverage           This is the proportion of the target audience who are
                   estimated to see or hear a campaign through a particular
                   medium.
Cut through        This term is used here to refer to the extent to which a
                   campaign ‘cuts through’ or is seen or heard above the other
                   activity that is taking place in relation to a specific topic.
Decay              This word is used to describe the decline in campaign
                   awareness or recognition over time after the campaign (or
                   one element of it) comes off air.
Frequency (of      The number of times the audience will potentially see or
media contact)     hear a campaign message across all, or specific, media
                   channels.
GOR                This stands for Government Office Region. In England, the
                   region is the highest tier of sub-national division used by
                   central government. GORs are: North East, North West,
                   Yorkshire and The Humber, East Midlands, West Midlands,
                   East of England, London, South East and South West.

                   For the purposes of this research, GOR plus Scotland, Wales
                   and Northern Ireland have been used as regions for
                   sampling and analysis purposes.
Opportunities to   This is the number of times someone has the opportunity to
hear (OTH)         hear a radio advert.
Opportunities to   This is the number of times someone potentially has the
see (OTS)          opportunity to see an advert.
Prompted           This refers to instances where respondents report an
advertising        awareness of advertising after being shown or played
recognition        campaign media such as a television advert
SIC (2007)         SIC stands for Standard Industrial Classification – a system
                   that is intended to help classify businesses according to the

1             Evasion Publicity Campaign 2014 – Report on findings among SMEs
type of their economic activity. The latest version used in
the UK is the 2007 SIC system. The main sections used are
the following:
A) Agriculture, Forestry and Fishing
B) Mining and quarrying
C) Manufacturing
D) Electricity, Gas, Steam and air conditioning
E) Water supply, sewerage, waste management and
remediation activities
F) Construction
G) Wholesale and retail trade; repair of motor vehicles and
motorcycles
H) Transport and storage
I) Accommodation and food service activities
J) Information and communication
K) Financial and insurance activities
L) Real estate activities
M) Professional, scientific and technical activities
N) Administrative and support service activities
O) Public administration and defence; compulsory social
security
P) Education
Q) Human health and social work activities
R) Arts, entertainment and recreation
S) Other service activities
T) Activities of households as employers, undifferentiated
goods and service producing activities of households for own
use
U) Activities of extraterritorial organisations and bodies
Self-employed This refers to any individual who runs their own business
and takes responsibility for its success or failure. Self-
employed individuals are responsible for their own tax and
National Insurance contributions.
Small and According to EU legislation, this is a business with fewer
medium sized than 250 employees, and a turnover of €50 million or less or
businesses a balance sheet total of €43 million or less.
(SMEs)
For the purposes of this research, businesses qualified as
SMEs provided that they had no more than 249 employees
and a claimed annual sales turnover under £42 million.
Spontaneous This is where respondents report an awareness of
recall advertising without being prompted with a list of possible
responses or campaign material.
Take out The messages that are being understood from a particular
advert or campaign.
Tax avoidance Tax avoidance is bending the rules of the tax system to gain
a tax advantage that Parliament never intended. It often
involves contrived, artificial transactions that serve little or
no commercial purpose other than to produce a tax
advantage. It involves operating within the letter but not the
spirit of the law.
Evasion Publicity Campaign 2014 – Report on Findings among SMEs 2Tax evasion Tax evasion is illegal activity, where registered individuals or
businesses deliberately omit, conceal or misrepresent
information in order to reduce their tax liabilities. Evasion is
the deliberate understatement of a declared source of
income whereas the hidden economy is the non-declaration
of an entire source of hidden income.
Verified This is where respondents indicate whether they had seen
advertising any advertising or publicity on tax evasion and after then
recall being shown examples of the actual campaign material
used, they confirmed this was the campaign they were
referring to.
1.2 Reporting notes
To ensure that the profile of the survey sample accurately matched the target
audience profile, weighting was used at the analysis stage to address both
design effect (over / under representation by business size) and variable levels
of non-response among companies from different size and turnover bands,
regions and industry sectors. Figures within this report are weighted unless
otherwise stated. Base sizes are unweighted.
Where percentages shown in bar charts do not sum to exactly 100 per cent (or
where they do not exactly sum to a summary figure given, such as total
agreement), this will be due to rounding to the nearest whole number.
Within the charts and the report text, ‘-‘ denotes a percentage of 0, while ‘*’
denotes a percentage greater than 0 but less than 0.5.
Only significant differences of at least a 95 per cent confidence level from wave
to wave or between sub-groups have been reported.
The HMRC SME attitudinal segmentation has been used for analysis purposes.
Respondents were allocated to the HMRC segments via an algorithm using
answers given to a series of segmentation questions on the pre- and post-wave
questionnaires.
The attitudinal segments used in this report are described in more detail in: HM
Revenue and Customs (2012) SME Usage and Attitudes - SME Customer
Segmentation. Report no. 205. Available at:
http://www.hmrc.gov.uk/research/report205.pdf
3 Evasion Publicity Campaign 2014 – Report on findings among SMEs2. Executive summary
2.1 Introduction
There are a number of strands to HMRC’s strategy to tackle tax evasion and
avoidance. To complement HMRC Campaigns and Taskforces1 that have run over
the last few years, an Evasion Publicity campaign was launched by HMRC in
November 2012. The aims of this campaign are to help reduce tax evasion,
reassure the compliant that HMRC is acting against the non-compliant and
ultimately to increase voluntary compliance among the non-compliant.
The campaign targets tax evaders and ran nationally apart from in a control
area, which was retained for the purposes of evaluation. The control area
consisted of the Granada, Tyne Tees and Yorkshire TV regions, giving around 72
per cent coverage of the UK in the test area. There have been several bursts of
activity since the launch in November 2012: the most recent activity ended in
February 2014. The latest campaign media channels included radio, outdoor
posters / billboards / phone kiosks and a variety of ambient media (ATMs,
washroom mirrors, and train cards). A webpage, gov.uk/sortmytax, was also set
up when the campaign launched to provide further information / reassurance for
the compliant and an option for voluntary disclosure for the non-compliant.
Survey research was commissioned to evaluate the Evasion Publicity campaign
among small to medium sized enterprises (SMEs) at key stages in the campaign.
Its over-arching objective was to assess changes in attitudes and self–reported
behaviour over time, particularly among the attitudinally non-compliant (Rule
Breaker and Potential Rule Breaker) HMRC segments. Further specific evaluation
objectives included:
determining awareness of the campaign and the campaign messaging;
measuring the effects of the different campaign media; and
understanding the extent to which the campaign is currently considered
credible.
The campaign was initially evaluated using pre-campaign survey research in
October 2012 and a post-campaign survey in mid February – mid April 20132. A
third wave of research was commissioned to evaluate the campaign activity that
subsequently took place in September 2013 and January/February 2014. This
report focuses on the findings from that third wave of tracking research.
1
For further details, including HMRC’s strategy, see:
https://www.gov.uk/government/policies/reducing-tax-evasion-and-avoidance
2
This report is available to download at:
http://www.hmrc.gov.uk/research/report277.pdf
Evasion Publicity Campaign 2014 – Report on Findings among SMEs 4A separate report of the findings from the third wave of tracking is also available
on the research that was carried out in parallel with this survey among
individuals.3
2.2 Methodology
The figure below outlines the broad survey fieldwork and campaign timeline,
from the pre-wave fieldwork in 2012 to the end of the latest wave of fieldwork in
2014.
Figure 2.1: Timeline for fieldwork and activity dates for Evasion Publicity
4
Campaign
2012 2013 2014
Oct Nov Dec Jan Feb Mar Apr Sep Oct Nov Dec Jan Feb Mar Apr May
Pre - wave
fieldwork
Campaign
Post - wave
2013
fieldwork
Campaign
Post - wave
2014
fieldwork
The surveys were conducted using CATI (Computer Assisted Telephone
Interviewing) with a random probability sample of SMEs. The sample included
the self-employed, but excluded financial agents5. Interviews were conducted
with the key financial decision maker in the business6.
The latest sample, as in previous waves, was drawn geographically from two
broad areas: the test area covering those regions across the UK where the
campaign ran, and the control area, covering all other regions. There were 984
interviews carried out in the test area and 1024 in the control area amongst
SMEs.
This design allows comparison of views between bursts of campaign activity as
well as between test and control areas. It therefore provides an assessment of
3
https://www.gov.uk/government/publications/evasion-publicity-post-campaign-
tracking-2014-individuals
4
Exact dates of campaign activity are provided in chapter 3, and specific fieldwork dates
are given in chapter 4.
5
Financial agents were not considered a primary audience of the campaign.
6
See screener section in questionnaire, Appendix E, for further information.
5 Evasion Publicity Campaign 2014 – Report on findings among SMEsthe campaign’s possible impact over time on views and attitudes relating to tax
evasion.
Further details on the survey methodology can be found in chapter four.
2.3 Campaign awareness and recognition
After the initial bursts of campaign activity completed in early 2013,
spontaneous awareness of any advertising or publicity on tax evasion
rose significantly in both the test and control areas, with the greatest
increase to 50 per cent seen in the test area (from 24% at the pre-wave)
compared to an increase to 36 per cent in the control area (from 29% at the
pre-wave). The post-wave survey in 2014 shows a slight fall-off in these
proportions: to 47 per cent in the test area and 34 per cent in the control
area.
Focussing specifically on messages that can possibly be linked to the
campaign, there is a significant difference in spontaneous recall in the test
area (26%) compared to post 2013 (18%). This is more than twice the level
in the control area (10%), which was broadly similar to its level in post 2013.
Verified recall has significantly increased in the test area from 21 per cent to
33 per cent (post 2013 to 2014). In the control area it was 12 per cent post
2014.
When prompted with examples of adverts from the campaign, campaign
recognition in the test area reached 60 per cent (up from 46% post 2013).
This compares to 31 per cent in the control area (also significantly increased,
from 26 per cent post 2013).
The increases in prompted recognition are largely driven by radio (up from
37% to 53% in the test area, and 19% to 27% in the control area) with both
executions heard by similar proportions of the sample. Outdoor executions
(poster and billboard and phone boxes) also made a significant contribution
(up from 14% post 2013 to 18% post 2014 in test).
Prompted recognition in the test area rose significantly amongst Rule Breakers
(from 36% to 55%) and Potential Rule Breakers (from 49% to 65%) as well
as among the other segments combined7 (45% to 56%) post 2014.
2.4 Reactions to campaign
The messages of the campaign came through clearly with the main
spontaneous references from SMEs focusing on ‘watching you’ / ‘you will be
caught’ / ‘coming to get you’. After being shown campaign material, over half
stated this as the main message of the advertising (58% control area, 55%
7
Combined segments include Unaware, Need Help, Willing & Able, Potential Payment
deferrers and Payment Deferrers.
Evasion Publicity Campaign 2014 – Report on Findings among SMEs 6test area). This percentage has significantly increased in the test area only,
up from 47 per cent.
Around six in ten in both the control (60%) and test (57%) areas agreed that
the advertising was threatening. Furthermore, 18 per cent and 19 per cent in
the control and test areas respectively strongly agreed (point 9) with this
statement. There is little variation in these proportions compared to post
2013.
It was also important to check the campaign was not causing unnecessary
worry and in fact, for the attitudinally compliant majority there was low
agreement that the campaign caused worry about taxes (only 13% agreed
overall in the test area and 10% overall in the control area). Levels of worry
have decreased since post 2013, particularly among recognisers of the
campaign.
There has been a significant increase in the proportion of Rule Breakers in the
test area agreeing that the advertising has made them worry about their
taxes (from 4% post 2013 to 18% post 2014), with a significantly higher
proportion agreeing strongly (from 3% post 2013 to 11% post 2014).
The proportions claiming to have responded to the advertising were fairly low
in both the test and control area, with 6% and 3% respectively claiming to
have taken any action. However, among the Rule Breakers in the test area
the proportion was significantly higher, at 11 per cent, compared to potential
rule breakers and other segments (6% and 5% respectively).
Good levels of awareness of the gov.uk/sortmytax website were recorded,
with slightly higher awareness evident in the test area than in the control
area (38% and 28% respectively) but not significantly different from the
2013 post-wave (33% and 26% respectively). Awareness was significantly
higher though among campaign recognisers than non-recognisers (48%
versus 23% in the test area, and at 41% and 22% respectively in the control
area).
Post 2013, Rule Breakers were significantly less likely to be aware of the
webpage than other segments, but post 2014, Rule Breakers are almost
twice as likely to be aware of the site than they were before - and almost as
likely to be aware as any other segment.
2.5 Attitudes to tax evasion and the detection of tax
evasion
There have been small movements in a positive direction on:
Perceptions that HMRC wants people who have undeclared income to come
forward before they are caught: disagreement has significantly dropped in
the test area (from 11% in 2013 to 7%) and amongst recognisers in the test
area (from 12% 2013 post-wave to 6% 2014 post-wave).
7 Evasion Publicity Campaign 2014 – Report on findings among SMEsPerceptions of the acceptability of tax evasion: there are significant downward
shifts in acceptability in both areas (from 8% to 4% in test, and 7% to 4% in
control, driven largely by changes among recognisers.
There is also evidence that the campaign is supporting positive attitudes, even if
it is not yet shifting them: perceptions around HMRC detecting tax evasion are
all significantly higher among recognisers than non-recognisers in the test area.
2.6 Conclusions
The campaign is continuing to perform well in terms of claimed awareness and
prompted recognition.
Radio remains the dominant channel by some margin, and there is relatively low
multi-media integration. The tone and content of the campaign appear to be
working, with high levels of understanding of the campaign messages and
widespread perceptions of credibility and threat recorded in 2014. The amount of
worry generated by the campaign remains limited among the overall audience of
SMEs but it has increased significantly among the Rule Breaker segment.
There is consistent evidence of the campaign driving awareness of the website.
Although this has not increased over time for the entire SME sample, there has
been a significant increase in awareness among Rule Breakers. Similarly,
claimed behaviours and actions as a result of the campaign remain at a low
level, although some of the results are also higher for Rule Breakers.
The more positive perceptions among those recognising the campaign suggest
that the advertising is supporting many of the attitudes being monitored by the
tracking research. Significant shifts in the right direction between 2013 and
2014, particularly among campaign recognisers, have also been recorded for two
aspects, namely, the perception that HMRC wants people who have undeclared
income to come forward and the amount of effort put in by HMRC on reducing
tax evasion among SMEs.
Evasion Publicity Campaign 2014 – Report on Findings among SMEs 83. Introduction 3.1 Background HM Revenue and Customs (HMRC) plays a pivotal role in UK society as the tax administration and collection body. The Department safeguards the collection of revenue for the Exchequer to help reduce the deficit, to fund public services and to help families and individuals with targeted financial support. HMRC’s goal is to reduce the tax gap and to ensure that its customers feel that they are provided with a professional and efficient service8. A key strand of the 2012-15 HMRC business plan is to use its understanding of customers to target resources to the areas of greatest risk, investing £917m up to 2014-15 to tackle avoidance and evasion attacks by organised criminals and to improve debt collection capacity. By tailoring its approach to target the highest risks, HMRC aims to bring in an additional £24.5 billion revenue in 2014 to 2015, rising to £26.3 billion in 2015 to 2016. HMRC estimated the tax gap for 2011-12 at £35bn9. This represents 7.0 per cent of tax liabilities. Nearly half of the 2011-12 tax gap can be attributed to small and medium-sized businesses, with around one quarter from large businesses. Evasion accounts for around 15 per cent of the tax gap. There are a number of strands to HMRC’s strategy to tackle tax evasion including Campaigns and Taskforces1, which involve bursts of activity targeted at specific sectors and/ or locations where there is evidence of high risk of tax evasion. In November 2012 HMRC launched an Evasion Publicity advertising campaign, primarily aimed at tax evaders. Further bursts of activity ran in January / February 2013, September 2013 and January / February 2014. The aims of the campaign are to tackle tax evasion, reassure the compliant that HMRC is acting against the non-compliant and ultimately to increase tax yield among the non- compliant. The latest wave of campaign tracking research among SMEs is discussed in this report. Findings from previous tracking research, based on an initial pre-wave 8 https://www.gov.uk/government/uploads/system/uploads/attachment_data/file/89201/b usiness-plan-2012.pdf https://www.gov.uk/government/publications/hmrcs-business-plan-2014-to-2016 9 https://www.gov.uk/government/uploads/system/uploads/attachment_data/file/249537/ 131010_Measuring_Tax_Gaps_ACCESS_2013.pdf 9 Evasion Publicity Campaign 2014 – Report on findings among SMEs
prior to the launch of the campaign and a post-wave undertaken following the
activity in February 2013, were published in December 201310

The campaign has run nationally, apart from in a control area set up for the
purposes of evaluation, which consisted of Granada, Tyne Tees and Yorkshire TV
regions. Taking into account the campaign control area, this equates to around
72 per cent potential coverage of the UK. The campaign media mix from
September 2013 and January / February 2014 included the following:
     two radio executions;
     five versions of outdoor posters, and advertising on kiosks / phone boxes;
     a variety of ambient media;
          o ATMs
          o train cards
          o stickers on washrooms/mirrors.

Examples of the campaign publicity materials used in the activity during
September 2013 activity and early 2014 are provided in Appendix B. The media
schedule is shown in Figure 3.1.

Figure 3.1: Media schedule 2013/2014
Channel                       Quantity           Sep        Oct   Nov   Dec      Jan        Feb        Mar        April
                                         2   9   16 23 30                     6 13 20 27 3 10 17 24 3 10 17 24 31 7 14 21
Outdoor
 Roadside - 48 sheets          1,488
 Roadside - 6 sheets           3,594
 Kiosks - phones               3,905
Ambient
 ATMs                          2,173
 Washrooms/mirrors             4,873
 Train cards                   8,000

Radio                           n/a
Digital, Search                 n/a
TNS fieldwork (SMEs)
TNS fieldwork (Individuals)

Train cards were used in London and South East only; other than that all media
were used across the whole test area. Radio was bought against people aged 15
or over, with 62 per cent coverage at 13 opportunities to hear (OTH) in 2012 /
2013 compared to 65 per cent coverage at 9 OTH for 2013 / 2014. The
equivalent figures for out of home in 2012 / 2013 was coverage of 58 per cent
approximately, with an opportunity to see (OTS) of 18, (but weighted
considerably to London) compared to 61 per cent coverage and an opportunity
to see of 15 (again weighted to London) in 2013 / 201411.

10
     http://www.hmrc.gov.uk/research/report277.pdf
11
     Definitions of these terms have been provided in the glossary.

Evasion Publicity Campaign 2014 – Report on Findings among SMEs                                                             10
3.2 Research aims and objectives
In 2012 TNS BMRB was commissioned to conduct a series of surveys to evaluate
the Evasion Publicity campaign among SMEs over time, with the over-arching
objective of measuring changes in attitudes and self–reported behaviour over
time.
More specifically there was a requirement to:
determine awareness of the campaign and the campaign messaging;
measure the effects of the different campaign media;
assess the influence of the campaign on perceived likelihood of being
caught and the acceptability of non-compliance;
understand the extent to which the campaign is currently considered
credible, worrying, threatening, and how this should be developed going
forward to optimise effects over the longer term; and
to provide reassurance that the campaign has not created concern among
the compliant majority.
Additionally, the research sought to evaluate the campaign according to HMRC
attitudinal segments in order to establish its impact on those in the attitudinally
non-compliant groups which are the target audience for the campaign: Rule
Breakers and Potential Rule Breakers.
This report focuses on the findings from the third wave of research, post-activity
2014, among SMEs. Separate research has evaluated this activity among
individuals12.
12
https://www.gov.uk/government/publications/evasion-publicity-post-campaign-
tracking-2014-individuals
11 Evasion Publicity Campaign 2014 – Report on findings among SMEs4. Method and sample 4.1 Survey and sample design The survey sample and design used for the 2013 post-wave was replicated for the post-wave in 2014. The survey was conducted using CATI (Computer Assisted Telephone Interviewing) with a random probability sample of SMEs. Interviews were conducted with the key financial decision maker in the business. A sample of SMEs, selected at enterprise level, was purchased from Experian for this research. The sample included the self-employed, and all industry sectors were included apart from financial agents: Standard Industrial Classification (SIC) 2007 - code 7412 – Accounting, Book-keeping and auditing activities, and Tax Consultancy. The sample was drawn in two lots – one for the control area (Granada, Tyne Tees and Yorkshire TV regions) and one for the test area (the rest of the UK). At the pre-wave in 2012 the sample for each area was initially stratified by number of employees, and within this by turnover. To ensure a better spread across the size bands than would have been the case had each band been sampled in its correct proportions, sole trader / one employee businesses were under-sampled and medium-sized SMEs (those with 50-249 employees) and to a lesser extent, smaller businesses (those with 2-9 and 10-49 employees), were over-sampled. As with the post-wave in 2013, the 2014 post-wave sample for both the test and control areas was stratified by number of employees, and within business size, by GOR (Government Office Region) and SIC 2007 code (4 broad categories). The post-wave sample was drawn to reflect the profile of the target population by region and SIC code in each of the test and control areas, with the same over-sampling of medium and small businesses used at the pre-wave. Evasion Publicity Campaign 2014 – Report on Findings among SMEs 12
Appendix F shows the proportions in which the sample was selected, to reflect
the profile of the target population and to over-represent the larger businesses.

Fieldwork dates, sample sizes and response rates are summarised in table 4.1.

Table 4.1: Summary of fieldwork
                Pre-wave                             Post-wave 2013             Post-wave 2014
Fieldwork dates 15 October – 9                       18 February – 11           25 February – 17
                November 2012                        April 2013                 April 2014
Sample size
 - Control              615                          1,003                      1024
 - Test                 894                          963                        984
Response rate           24%                          38%                        38%

As shown in the table 4.1, the response rate achieved for the survey was 38 per
cent. A detailed response analysis can be found in Appendix D.

Figure 4.1 shows the structure of the questionnaire used and Appendix E
contains a copy of the questionnaire used.

Figure 4.1: Structure of questionnaire

                                                                                                  20 minutes

     Introduction    CPS questions;     Pre / Post         Ad awareness        Ad            Ad response
     and screener    perceptions of     exposure               and         recognition       (post waves)
                      tax evasion;       attitudes          recognition   (post waves)
  Introduction to    segmentation                                                              Diagnostics
      survey,          questions       Investigating         Series of      Respondents       and feedback
    recruitment                          attitudes         spontaneous     prompted with          on the
    questions to      Understanding     specifically       questions on      radio and        campaign as a
     ensure we           attitudes       linked to          advertising        poster             whole,
   speak to right    towards tax and     campaign            about tax     executions to     understanding
   audience, key       tax evasion;     messaging             evasion     test recognition    message take
   classification      questions to                                                                out,
  questions (split     segment the                                                           impressions of
    across front         sample*                                                             advertising and
    and back of                                                                              claimed actions
  questionnaire)

* Done using an algorithm supplied by HMRC to produce standard HMRC SME segmentation

4.2 Weighting
Weighting on employee size, turnover, SIC and GOR was used at the analysis
stage to address both design effect (over / under representation by business
size) and non-response.

The unweighted and weighted profiles for the test and control areas are
contained in Appendix F, as are details of the weighting applied, which was
calculated from information provided by HMRC.

13                   Evasion Publicity Campaign 2014 – Report on findings among SMEs
Appendix F also contains the weighed profiles of the samples for the pre-wave, 2013 post-wave and 2014 post-wave, according to number of employees, turnover, whether or not VAT registered and broad SIC classification. Evasion Publicity Campaign 2014 – Report on Findings among SMEs 14
5. Campaign awareness and
   recognition
This chapter examines awareness and recognition of the Evasion Publicity
campaign among SMEs.

5.1 Campaign awareness
At the start of the section on advertising awareness and recognition,
respondents were asked whether they had seen or heard any advertising or
publicity from HMRC aimed at particular trade sectors or occupations, and if so,
at which trade sectors or occupations it was aimed. Doing this would then help
respondents to focus on the Evasion Publicity campaign at the subsequent
questions. The results are available in Appendix A, Figure 10.1.

The questions that followed asked respondents whether they had seen or heard
any advertising or publicity on tax evasion apart from that aimed at certain
trades or occupations, and if so, where they had seen it and what they recalled
about it. These results are summarised in Figure 5.1.

Figure 5.1: Spontaneous and verified recall of advertising on tax evasion
Base: All respondents - Control: Pre 2013 (615); Post 2013 (1003); Post 2014 (1024) /
Test: Pre 2013 (894); Post 2013 (963); Post 2014 (984)

                             Control                     Test

 Spontaneous recall          %                           %
                                              24                      29             Pre 2013
     Advertising/publicity
                                                   36                           50
      about tax evasion
                                                   34                          47    Post 2013
                               4                          5
       Campaign sources
                                 6                              17                   Post 2014
        (spontaneous)
                                   8                                 24

                             n/a                         n/a
       Possible campaign
            mentions               8                            18
         (spontaneous)
                                     10                              26

                             n/a                         n/a

                                     9                           21
       Verified recall
                                         12                               33

15                    Evasion Publicity Campaign 2014 – Report on findings among SMEs
Prior to the launch of the Evasion Publicity campaign, around one in four claimed to be aware of any advertising or publicity about tax evasion13 – with 24 per cent spontaneous awareness in the control area and 29 per cent in the test area. After the first two bursts of campaign activity completed in early 2013, spontaneous awareness rose significantly in both the test and control areas, with the greatest increase to 50 per cent seen in the test area, compared to an increase to 36 per cent in the control area. In 2014 the post-wave shows a slight fall-off in these proportions: to 47 per cent in the test area and 34 per cent in the control area. By examining in more detail where respondents claimed to have seen the tax evasion advertising, it is possible to identify which media sources are responsible for the increased awareness in the test and control areas. It must be noted that reference to these sources does not mean that the campaign has definitely been seen, simply that respondents believe they have seen or heard advertising or publicity about tax evasion through one of these sources. In the control area, the proportion of SMEs spontaneously mentioning campaign specific sources14 remained steady, with no significant change between post- wave 2013 and post-wave 2014 (6% and 8% respectively). However, the same measure rose significantly in the test area: from 17 per cent at the post-wave 2013 to 24 per cent at the post-wave 2014. This increase was mainly driven by mentions of radio advertising, with spontaneous awareness of this almost doubling (rising significantly to 19% at the 2014 post-wave from 13% at the 2013 post-wave15). Mentions of newspaper / magazine articles were at a similar level in test and control areas in 2014 (5% and 6% respectively). This suggests that the apparent control area campaign contamination has not been caused by PR / press coverage – which did take place at a national level. By examining spontaneous recall of what the SMEs remembered about the advertising or publicity they had seen or heard it is possible to identify mentions that are likely to be linked to the campaign. After grouping all descriptions that could possibly be linked to the campaign together there was a significant increase in recall of the campaign details among all SMEs in the test area (26%) compared to post 2013 (18%) indicating that the campaign continues to cut- through all the other activity around tax evasion. This was accounted for by both 13 Awareness of HMRC advertising targeting specific trades and occupations was asked in a separate question. The findings are shown in Figure 10.1 in Appendix A. 14 These included radio, posters / billboards, phone boxes or ambient sources i.e. posters on trains, cash machine screens and washrooms. 15 These figures, re-based on those who had seen / heard advertising/publicity about tax evasion, are shown in Figure 10.2 in Appendix A. Evasion Publicity Campaign 2014 – Report on Findings among SMEs 16
specific campaign messages (up from 6% to 9%) and more general campaign-
attributable messages (‘clamping down on tax evasion’ up from 5% to 10% and
‘you will be caught’ up from 6% to 9%)16.

Although some of these trends for campaign recall were apparent in the control
area, there were no statistically significant differences between the post 2013
and post 2014 waves. Grouping all descriptions that could possibly be linked to
the campaign in the control area, 8 per cent may have been referring to the
Evasion Publicity campaign post 2013 and 10 per cent post 2014. So although
there is possible contamination, both recall and increased recall post 2014
activity are much lower than in the test area and the increase was not
statistically significant.

After SMEs had described the advertising or publicity on tax evasion they
remembered from HMRC, and after being prompted specifically with stimulus
from the Evasion Publicity campaign at a later point in the questionnaire, they
were asked to verify whether what they had previously described was the
Evasion Publicity campaign.

In the control area, verified recall remained steady at 12 per cent at the post-
wave 2014 compared to 9 per cent at the 2013 post-wave, whereas there was a
significant increase in the test area, from 21 per cent to 33 per cent at the 2014
post-wave. Within the test area, there were also some significant differences on
this measure within subgroups. For example, verified recall was significantly
higher (at 40%) among businesses with 10 - 49 employees compared to those
with 50 - 249 employees (18%) and also significantly higher in London (41%)
compared to East Midlands and South West (19% in each). Those in West
Midlands (38%) and South East (33%) also recorded significantly higher verified
recall than in the South West.

5.2 Campaign recognition
This section examines prompted recognition of the Evasion Publicity campaign.
Stimulus was shown / played where possible, and a list of ambient sources was
read out. For the radio ad, all respondents were played one of the two radio
executions (“Footsteps” or “Are you paying”) in full and asked if they had heard
this or a similar ad to this. For the posters / billboards they were directed to a
website which allowed them to see three of the six executions. If the respondent

16
  Full results for all these measures, based on those claiming to have seen advertising
or publicity on tax evasion, are shown in Appendix A, Figures 10.2, 10.3 and 10.4

17              Evasion Publicity Campaign 2014 – Report on findings among SMEs
could not access the website for any reason (technology or preference),
descriptions were read out instead.

Recognition of the ambient advertising was measured by interviewers reading
out a list of possible options and asking respondents whether they had seen the
images shown / described previously on any of these sources.

Figure 5.2: Prompted campaign recognition
Base: All respondents – Control: Post 2013 (1003); Post 2014 (1024) / Test: Post 2013
(963); Post 2014 (984)

                    Control                                       Test
                  %                                              %

                                     26                                                  46
              Any
                                          31                                                       60

                                19                                                 37
            Radio
                                     27                                                       53

                            8                                            14
         Outdoor
                         7                                                    18
                                                                                        Post 2013
                                                                         12
                        6                                                               Post 2014
       Ambient*                                                      9
                        5

    *Ambient includes: Washrooms, posters on trains and cash point
    screens in 2014 and posters on trains, cash point screens, beer mats,
    vans and other mentions in 2013

The 2014 post-wave results show that campaign recognition in the test area has
reached 60 per cent (up from 46% post 2013). This compares to 31 per cent in
the control area (also significantly increased, from 26 per cent post 2013). This
increase is largely driven by radio (up from 37% to 53% in the test area) with
both executions heard by similar proportions of the sample. Outdoor executions
(poster and billboard and phone) also made a significant contribution (up from
14% post 2013 to 18% post 2014 in the test area).

As seen in 2013, there were considerable regional differences with significantly
higher total recognition in London (68%) compared to East Midlands (46%) and
South West (47%) – this pattern is observed across all media.

Recognition levels among those viewing images online compared to those who
were read a description were higher at the post-wave 2014 for outdoor
advertising but there was no difference for total recognition.

Evasion Publicity Campaign 2014 – Report on Findings among SMEs                                         18
As well as considering overall awareness of the campaign, it is important to
consider the extent to which recognition of different media channels overlapped.
In the test area, 73 per cent of SMEs who recognised the Evasion Publicity
campaign had seen or heard only one campaign medium, predominantly radio
advertising, compared to 27 per cent seeing / hearing two or three media (17%
of campaign recognisers in the control area at the post 2014 wave claimed they
saw / heard two or three media). (Data not shown).
The figures in the diagram (Figure 5.3) below show how the different campaign
media overlapped among the total sample in the test area. As this
demonstrates, there was relatively low cross media synergy, with just four per
cent claiming to have heard the radio advert and seen outdoor as well as any
ambient advertising.
Figure 5.3: Multi- media recognition
Base: All respondents at post 2014 wave – test (984)
Test – Post 2014
Radio = 53%
Outdoor = 18%
38%
9%
2% 4%
1% 2% 4%
Ambient = 9%
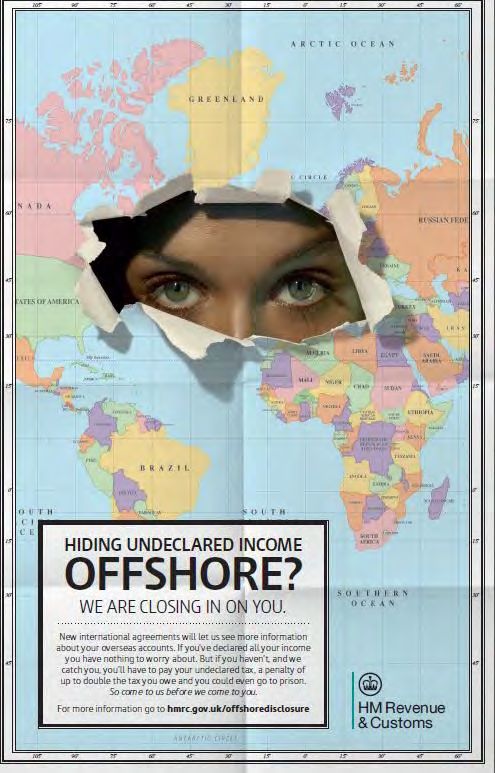
5.3 Offshore Accounts Campaign
Additional questions were placed in the 2014 post-wave questionnaire about the
HMRC Offshore Accounts campaign. This campaign ran in the national press
(daily newspapers, weekend papers and magazines) during the period 24
February to 30 March 2014 supported by digital advertising and text messaging
and used very similar creative material to the Evasion Publicity campaign (see
Appendix B, 11.4). Therefore HMRC wanted to check people were not mistaking
this campaign for the Evasion Publicity campaign.
Prior to being asked whether or not they had seen the Evasion Publicity
campaign, SMEs were asked if they had seen any advertising or publicity from
19 Evasion Publicity Campaign 2014 – Report on findings among SMEsHMRC recently about offshore accounts. Prompted recognition of the Offshore Accounts advertising was also obtained towards the end of the questionnaire, after the Evasion Publicity campaign related measures. Those who had been able to access the website for viewing the Evasion Publicity advertising were shown the Offshore Accounts advertising using this approach. Those who could not access the website were read a description. SMEs were informed that the advertising had been running in newspapers and magazines, on the internet and via text message. There is little evidence to suggest that the visual similarities between the Evasion Publicity and Offshore Accounts campaigns caused confusion among SMEs. Spontaneous awareness of the Offshore Accounts campaign, at 15 per cent, reached the same level among those who recognised the Evasion Publicity campaign and those who did not in the test area. Moreover only a very tiny proportion of SMEs indicated that they had mistakenly claimed to be aware of the Evasion Publicity campaign when asked whether or not they had seen any advertising or publicity about this. Specifically, four per cent in the test area claimed to have seen the Evasion Publicity campaign before prompting and recognised the Offshore Accounts campaign. When these SMEs were subsequently asked whether they were referring to the Offshore Accounts campaign when they had originally claimed to have seen the Evasion Publicity campaign, half of them agreed that was the case. Additionally when shown/read a description for the Offshore Accounts campaign the vast majority were able to confirm either that they had seen this campaign or that they had not; only 1 per cent (in the test area) said they did not know. Evasion Publicity Campaign 2014 – Report on Findings among SMEs 20
6. Reactions to the campaign
This section examines the message take out and reactions to the Evasion
Publicity campaign. Essentially it assesses whether the key messages have been
understood, whether the campaign is making a positive impact and to what
extent it is perceived as credible and threatening.

Having just been exposed to the campaign during the survey interview through
stimulus material, all respondents were asked detailed questions about it. This
was done regardless of whether they were in the test or control area and
regardless of whether they had seen or heard the campaign before the interview
or not. Showing the campaign material to everyone in the sample enables
comparisons to be made in terms of levels of understanding and reaction
between those who are seeing it for the first time, and those who have seen it
previously.

6.1 Take out of main message
After being prompted with the campaign materials as described in the previous
section, respondents were then asked to say what they thought the main
message of the advertising was. They were probed for full descriptions, so often
more than one answer was given. The responses were grouped together into
common themes and the main themes to emerge are shown in Figure 6.1.

Figure 6.1: Main message of advertising
Base: All respondents at Post -wave- Control: Post 2013 (1003); Post 2014 (1024) /
Test: Post 2013 (963); Post 2014 (984)

                                             Control                                   Test

                                                                 45                                          47
     Any mention watching you/you will be
          caught/coming to get you                                                                                55
                                                                      58

                                                            39                                          36
                             Pay your tax                                  Any
                                                            37                                          35             Any
                                                                           mention
                                                                           of these                                    mention
                                                       26                                          27                  of these
          Declare tax/income/sort tax out                                   Post
                                                       26                  2013 =                  26                  Post 2013
                                                                           88%                                         = 87%
                                                       26                  Post 2014               26                  Post 2014
       Any mention don't cheat/evade tax
                                                            38             = 93%                        35             = 92%

                                                13                                            13
             Threatening you/scare tactics
                                                 14                                       11             Post 2013
                                                                                                         Post 2014

21                   Evasion Publicity Campaign 2014 – Report on findings among SMEs
Messages that are consistent with the aims of the campaign have been grouped together (shown by brackets in Figure 6.1). Over nine out of ten SMEs mentioned at least one of these messages in their response (93% in the control area and 92% in the test area), indicating that the majority of respondents understood the campaign. Both these figures are slightly higher, but not significantly so, compared to the 2013 post-wave (88% and 87% respectively). In terms of specific campaign messages, the majority of mentions in both the test area and control area were around ‘watching you’ / ‘you will be caught’ / ‘coming to get you’, with over half stating this as the main message of the advertising (58% control area, 55% test area). These percentages have significantly increased in both areas compared to the 2013 post-wave. There were also fairly high mentions of ‘pay your taxes’ with 35 per cent in the test area and 37 per cent in the control area taking this message out of the advertising. These levels are similar to post 2013. In both control and test areas, there is a significant increase in the proportion mentioning ‘don’t cheat / evade tax compared to post 2013 (up from a quarter to over a third in both areas). On the specific issue of whether the advertising was regarded as threatening, 14 per cent in the control area and 11 per cent in the test area mentioned ‘threatening you / scare tactics’ spontaneously as a main message of the advertising – both very similar to the previous post-wave figures (13% for both test and control). Additionally, as shown in Table 6.1, there was no difference in the responses of those who had previously seen the campaign and those who had not, suggesting that the main messages are communicated as clearly the first time as after repeated exposure. Evasion Publicity Campaign 2014 – Report on Findings among SMEs 22
Table 6.1: Main message of advertising post-wave 2014 by recognisers and
non-recognisers
     2014                                              Control                          Test

                                               Non -        Recognisers     Non -          Recognisers
                                             Recognisers                  Recognisers

     Base                                      (719)             (305)      (392)              (592)
                                                 %               %           %                   %
     Any mention watching you/ you will be       59              55          55                 55
     caught/ coming to get you
     Pay your tax                                36               38          31                38

     Declare tax/income/                         26               27          27                26
     sort tax out
     Any mention don’t cheat/ evade tax          36               44          35                36

     Threatening you/ scare tactics              16               10          13                11

6.2 Impressions of the campaign
Reactions to the campaign were gauged by asking respondents to agree or
disagree with three statements relating to different aspects of the campaign.
Each statement was rated using a nine-point response scale, ranging from point
nine (agree strongly) to point one (disagree strongly)17.

The post-wave results in 2013 and 2014 are shown for the test and control
areas, as well as among campaign recognisers and non-recognisers in the test
area in the figures that follow. Mean scores have also been calculated by
assigning a value of 1-9 to the answer given in line with the scale used. A higher
score therefore represents greater agreement.

17
  Figures 10.5 to 10.7 in Appendix A show the full set of results across all waves for
these three measures.

23                   Evasion Publicity Campaign 2014 – Report on findings among SMEs
Figure 6.2: Agreement/disagreement that the advertising was threatening
Base: Control: Post 2013 (1,003); Post 2014 (1024) / Test: Post 2013 (963); Post 2014
(984); All Recognisers in Test area: Post 2013 (428); Post 2014 (592) / Non-
recognisers: Post 2013 (535); Post 2014 (392)
% agreeing
Post 2013 19 57
Control
Post 2014 18 60
Post 2013 23 61
Test
Post 2014 19 57
Post 2013 24 59
Test recognisers
Post 2014 18 58
Post 2013 22 62
Test non-
recognisers Post 2014 20 56
Agree strongly (9) Agree (6-8)
The evidence suggests that the campaign continues to be perceived as
threatening by the majority, with around six in ten agreeing (giving a rating of
six to nine) in both the control (60%) and test (57%) areas. Furthermore, 18
per cent and 19 per cent in the control and test areas respectively strongly
agreed (point 9) with this statement. There is little variation in these proportions
compared to the 2013 post-wave.
Looking specifically at the results for the test area, there were no significant
differences in the responses between those who had previously seen the
campaign (campaign recognisers) and those who had not (non-recognisers): 58
per cent of recognisers agreed compared to 56 per cent of non-recognisers.
Evasion Publicity Campaign 2014 – Report on Findings among SMEs 24Figure 6.3: Agreement/disagreement that the advertising was credible
Base: Control: Post 2013 (1,003); Post 2014 (1024) / Test: Post 2013 (963); Post 2014
(984); All Recognisers in Test area: Post 2013 (428); Post 2014 (592) / Non-
recognisers: Post 2013 (535); Post 2014 (392)
% agreeing
Post 2013 24 67
Control
Post 2014 26 73
Post 2013 23 69
Test
Post 2014 26 70
Post 2013 27 76
Test recognisers
Post 2014 28 76
Post 2013 19 62
Test non-
recognisers Post 2014 23 61
Agree strongly (9) Agree (6-8)
In the test area there is little change in perceptions of credibility, and levels of
agreement remain significantly higher among campaign recognisers than non-
recognisers (76% and 61% respectively). In the control area agreement that the
advertising is credible has increased significantly (from 67% at the 2013 post-
wave to 73% at the 2014 post-wave). This shift has largely been driven by the
views of recognisers, among whom 84 per cent agreed the advertising was
credible compared to 74 per cent at the post-wave in 2013.
At the 2013 post-wave strength of agreement declined as SME turnover
increased. The highest level of strong agreement was among SMEs with a
turnover of less than £15K and lowest among those with a turnover of between
£250K and £40m. A similar pattern occurred in 2014 in the control area where
businesses with a turnover of up to £40,000 were significantly more likely to
agree (77%) than those with a turnover of over £250,000 (61% agreed). In the
test area post-wave 2014 however, there were no significant differences across
these subgroups.
25 Evasion Publicity Campaign 2014 – Report on findings among SMEsFigure 6.4: Agreement/disagreement that the advertising made you worry
about your taxes
Base: Control: Post 2013 (1,003); Post 2014 (1024) / Test: Post 2013 (963); Post 2014
(984); All Recognisers in Test area: Post 2013 (428); Post 2014 (592) / Non-
recognisers: Post 2013 (535); Post 2014 (392)
% disagree
% agreeing
Post 2013 4 13 78
Control
Post 2014 4 10 84
Post 2013 5 17 76
Test
Post 2014 5 13 78
Post 2013 5 23 72
Test recognisers
Post 2014 5 17 75
Test non- Post 2013 5 11 80
recognisers Post 2014 4 8 82
Test Rule Post 2013 3 4 94
Breakers Post 2014 11 18 69
Test Potential Post 2013 6 21 70
Rule Breakers Post 2014 6 16 75
Test Other Post 2013 5 14 78
segments Post 2014 3 10 82
Agree strongly (9) Agree (6-8)
The final impression to be measured was whether ‘the advertising made you
worry about your taxes’, with the results shown in Figure 6.4. It was clearly not
an aim of the campaign to increase worry around taxes among the compliant, so
widespread agreement among this group would show that the campaign was
having an unintended effect. On the whole, agreement with this statement was
low, with just 10 per cent agreeing in the control area and 13 per cent in the
test area – down from 17 per cent at the post-wave in 2013. The fall in
agreement in the test area is driven by a significant drop among campaign
recognisers, from 23 per cent in post-wave 2013 to 17 per cent at post-wave
2014.
The evidence also suggests that the campaign was less likely to cause worry in
the control area at the post-wave 2014, with disagreement that the advertising
made me worry about taxes increasing from 78 per cent to 84 per cent. This
shift was also driven by campaign recognisers among whom disagreement
increased from 70 per cent in 2013 to 81 per cent in 2014.
The breakdown by attitudinal segment, shown in Figure 6.4, also highlights the
significant increase in ‘made you worry’ among Rule Breakers between post-
waves 2013 and 2014 (4% versus 18% in the test area) compared to little
movement for Potential Rule Breakers and other segments.
Evasion Publicity Campaign 2014 – Report on Findings among SMEs 266.3 Awareness and usage of sortmytax webpage
After prompting with the campaign material, awareness of the sortmytax
webpage was measured for all SMEs in the sample. Awareness was significantly
higher at 48 per cent among campaign recognisers versus 23 per cent among
non-recognisers in the test area, and at 41 per cent and 22 per cent respectively
in the control area, highlighting the role of the campaign in promoting
awareness.
Usage of the website in the test area (at 6% at the latest wave) was also
significantly higher among recognisers (7% versus 3% among non-recognisers).
6.4 Campaign performance and reaction by segment
There is evidence that the campaign has had varying impacts across different
HMRC segments within the test area. Table 6.2 below highlights differences in
awareness and recognition among Rule Breakers, Potential Rule Breakers and
‘Other’ segments. The latter includes Unaware, Need Help, Willing & Able,
Potential Payment Deferrers and Payment Deferrers. Significant differences
between post-waves 2013 and 2014 are highlighted with a red box.
Table 6.2: Campaign awareness and recognition and website awareness and
usage by segment
Test area Potential
Rule Breakers Rule Breakers Others*
2013 2014 2013 2014 2013 2014
Post Post Post Post Post Post
(83) (79) (478) (451) (402) (454)
% % % % % %
Spont aware (yes at CAM2) 40 46 50 49 52 46
Verified recall 14 26 25 35 19 31
Campaign recognition 36 55 49 65 45 56
Aware of webpage 18 34 33 39 36 37
Visited webpage 4 6 4 5 7 6
* Others includes the following segments: Unaware, Need Help, Willing & Able, Potential Payment
Deferrers and Payment Deferrers
The spontaneously aware proportion of Rule Breakers has increased slightly from
40 per cent (post 2013) to 46 per cent (post 2014) compared to a slight decline
among other ‘compliant’ segments (Unaware, Need Help, Willing & Able,
27 Evasion Publicity Campaign 2014 – Report on findings among SMEsYou can also read