LOCUS COERULEUS MRI CONTRAST IS ASSOCIATED WITH CORTICAL THICKNESS IN OLDER ADULTS - MPG.PURE
←
→
Page content transcription
If your browser does not render page correctly, please read the page content below
bioRxiv preprint doi: https://doi.org/10.1101/2020.03.14.991596. The copyright holder for this preprint (which was not peer-reviewed) is the
                              author/funder. It is made available under a CC-BY-NC-ND 4.0 International license.

   Locus coeruleus MRI contrast is associated with cortical thickness in older adults

   Shelby L. Bachman1,2*, Martin J. Dahl3, Markus Werkle-Bergner3, Sandra Düzel3, Caroline Garcia
   Forlim4, Ulman Lindenberger3,5, Simone Kühn4,6, & Mara Mather1*

   1
     Davis School of Gerontology, University of Southern California, Los Angeles, CA, USA
   2
     Berlin School of Mind and Brain, Humboldt Universität zu Berlin, Berlin, Germany
   3
     Center for Lifespan Psychology, Max Planck Institute for Human Development, Berlin, Germany
   4
     Department of Psychiatry and Psychotherapy, University Clinic Hamburg-Eppendorf, Hamburg,
   Germany
   5
     Max Planck UCL Centre for Computational Psychiatry and Ageing Research, London, UK & Berlin,
   Germany
   6
     Lise Meitner Group for Environmental Neuroscience, Max Planck Institute for Human Development,
   Berlin, Germany

   *Correspondence should be addressed to SLB (sbachman@usc.edu) and MM (mara.mather@usc.edu)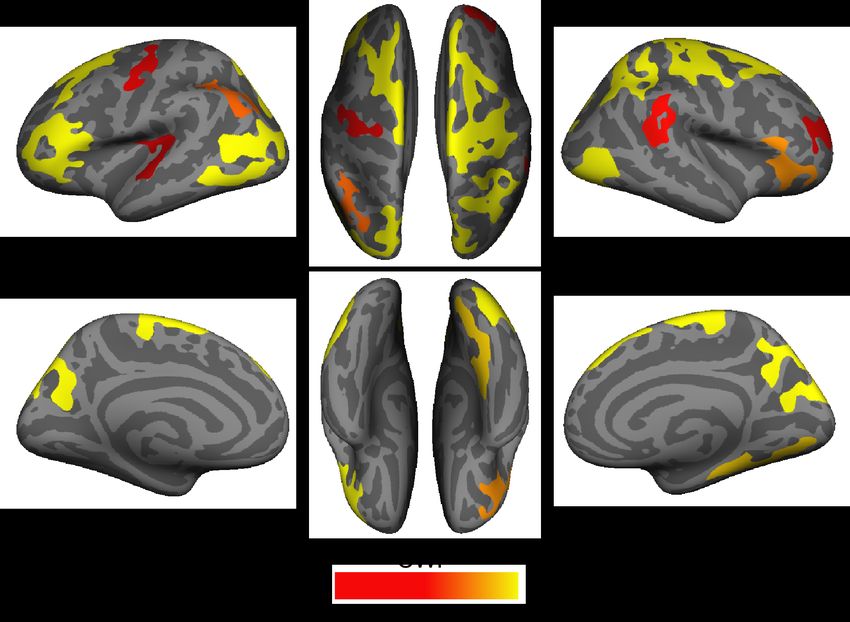
bioRxiv preprint doi: https://doi.org/10.1101/2020.03.14.991596. The copyright holder for this preprint (which was not peer-reviewed) is the
                              author/funder. It is made available under a CC-BY-NC-ND 4.0 International license.

                                                                                                                                        1

   Abstract

   There is growing evidence that integrity of the locus coeruleus - norepinephrine (LC-NE) system is

   important for later-life cognition. Less understood is how LC-NE system integrity relates to brain

   correlates of cognition, such as brain structure. Here, we assessed the relationship between cortical

   thickness and a measure of LC neuronal integrity in older (n = 229) and younger adults (n = 67). Using

   neuromelanin-sensitive MRI, we assessed LC integrity as a contrast between signal intensity of the LC

   and that of neighboring pontine reference tissue. The Freesurfer software suite was used to quantify

   cortical thickness. We found that LC contrast was positively related to cortical thickness in older but not

   younger adults, and this association was prominent in parietal, frontal, and occipital regions. Brain

   regions where LC contrast was related to cortical thickness include portions of the frontoparietal network

   and have been implicated in cognitive functions which are subject to strong noradrenergic modulation.

   These findings provide novel evidence for a link between LC integrity and brain structure in later

   adulthood.

   Keywords:

   Aging, brain structure, cortical thickness, frontoparietal network, locus coeruleus, norepinephine

   Abbreviations: BASE-II = Berlin Aging Study-II, LC = locus coeruleus, DPT = dorsal pontine
   tegmentum, FPN = frontoparietal network, MMSE = Mini Mental State Examination, MRI = magnetic
   resonance imaging, NE = norepinephrine, NM = neuromelanin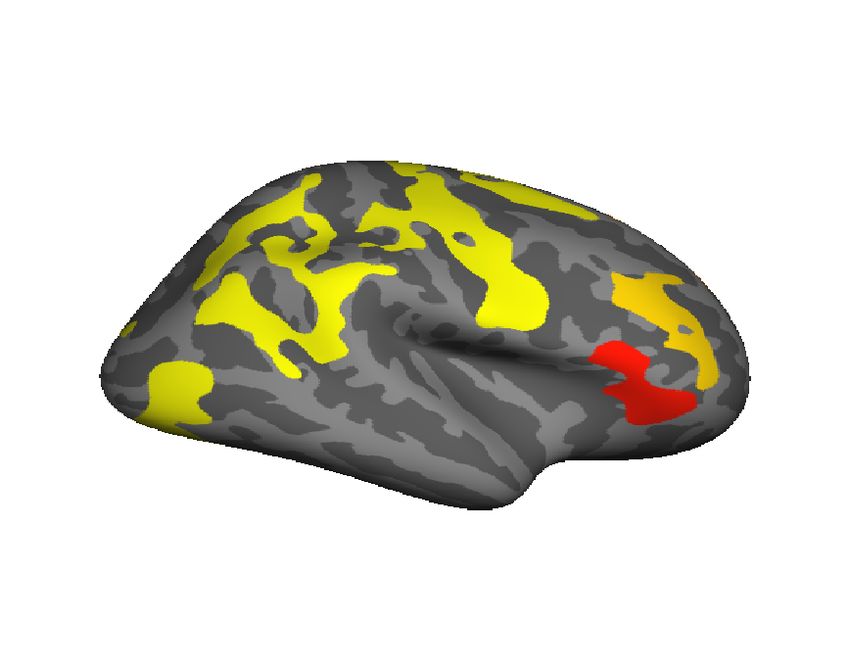
bioRxiv preprint doi: https://doi.org/10.1101/2020.03.14.991596. The copyright holder for this preprint (which was not peer-reviewed) is the
                              author/funder. It is made available under a CC-BY-NC-ND 4.0 International license.

                                                                                                                                        2

   1. Introduction

             A central goal of aging research is to identify factors that protect against aspects of age-related

   decline. Recently, the locus coeruleus-norepinephrine (LC-NE) system has been postulated as one such

   factor shaping later-life cognition (Mather & Harley, 2016; Robertson, 2013; Weinshenker, 2018). NE, a

   neurotransmitter released during arousal, facilitates neural and cognitive processes involved in vigilance,

   attention and memory (Sara, 2009). The brain’s primary source of NE is the LC, a brainstem nucleus

   located adjacent to the lateral floor of the fourth ventricle (Sara & Bouret, 2012). The LC is densely

   packed with neurons that release NE throughout the brain (Schwarz & Luo, 2015); through these

   distributed projections, the LC stimulates neural responses that promote processing of relevant or salient

   information (Berridge & Waterhouse, 2003; Mather et al., 2016).

             A longitudinal study of 165 older adults provided initial evidence that integrity of the LC relates

   to cognitive performance in aging (Wilson et al., 2013). Post mortem brain autopsies revealed that LC

   neuronal density was higher in individuals who had exhibited slower cognitive decline over a 6-year

   period before death, even after controlling for the presence of neurofibrillary tangles and Lewy bodies in

   the brainstem and neocortical regions.

             Studying the LC in vivo in humans has historically been challenging due to the small size of this

   nucleus. In recent years, however, the human LC has been imaged using magnetic resonance imaging

   (MRI) sequences that are sensitive to neuromelanin (NM) (Betts et al., 2019b; Liu et al., 2017; Sasaki et

   al., 2006). NM is a pigment byproduct of catecholamine metabolism and accumulates in aminergic nuclei

   including the LC (Fedorow et al., 2005; Mann & Yates, 1974). Due to NM’s paramagnetic (T1-

   shortening) properties, these “NM-sensitive” MRI sequences permit NM-containing nuclei – such as the

   LC – to be identified as hyperintense regions distinguishable from surrounding tissue (Keren et al., 2009;

   Shibata et al., 2006; Trujillo et al., 2017). Although the contrast mechanisms in NM-sensitive sequences

   remain to be fully understood (Watanabe et al., 2019a; Watanabe et al., 2019b), signal intensity contrast

   between the LC and surrounding pontine tissue in NM-sensitive scans (henceforth referred to as LC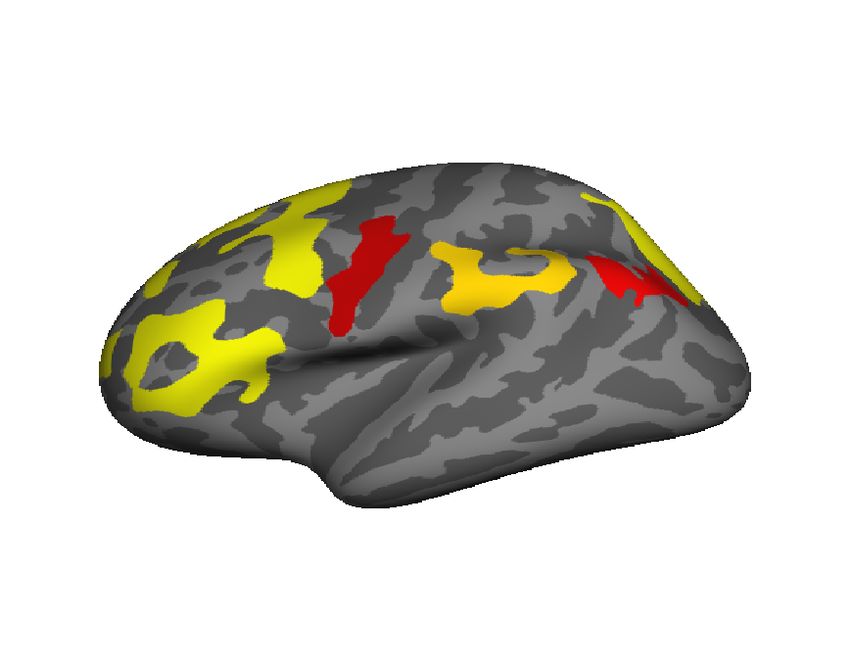
bioRxiv preprint doi: https://doi.org/10.1101/2020.03.14.991596. The copyright holder for this preprint (which was not peer-reviewed) is the
                              author/funder. It is made available under a CC-BY-NC-ND 4.0 International license.

                                                                                                                                        3

   contrast) has been validated through histological analysis, with locations of high LC contrast

   corresponding to the locations of NM-containing cells within the LC (Keren et al., 2015).

             Studies using LC contrast derived from NM-sensitive MRI have pointed to the importance of the

   LC-NE system in cognitive aging: in one study, LC contrast was positively related to cognitive reserve

   (Clewett et al., 2016), one indicator of the brain’s resilience against age-related pathology (Stern, 2009).

   LC contrast has also been linked to memory ability, with older adults with greater LC contrast having

   better episodic memory performance (Dahl et al., 2019; Hämmerer et al., 2018). Additionally, individuals

   with Alzheimer’s disease (Betts et al., 2019a) and Parkinson’s disease (Liu et al., 2017) exhibited reduced

   LC contrast compared to healthy older adults. Together, these studies suggest a potentially protective role

   of LC neuronal integrity, as indexed by LC contrast, in older adulthood.

             Of relevance to later-life cognition, NE released from the LC may protect against age-related

   neuropathology. For example, NE protects against neuroinflammation (Feinstein et al., 2016), regulates

   microglial functions that facilitate the clearance of amyloid beta (Heneka et al., 2010), contributes to

   increased expression of neurotrophic factors (Braun et al., 2014), reduces damage from neurotoxicity

   (Madrigal et al., 2007), and alleviates oxidative stress (Troadec et al., 2001). In addition, NE modulates a

   host of cognitive processes that typically decline with age, including selective attention (Mather et al.,

   2016; Sara, 2009), working memory (Berridge & Waterhouse, 2003), memory for emotional events

   (Strange & Dolan, 2004), and cognitive flexibility (Lapiz & Morilak, 2006). As such, having preserved

   integrity of the LC-NE system in older adulthood could enhance cognitive outcomes by protecting against

   brain pathology and by modulating cognitive processes (Mather & Harley, 2016; Robertson, 2013).

             If the LC-NE system has a protective role in older adulthood, one prediction is that LC integrity

   should be associated with cortical integrity. Older adults with relatively well-preserved thickness and

   volume of the cerebral cortex exhibit better cognitive performance (Nyberg et al., 2012), and reductions

   in these measures have been shown to explain a large amount of the variance in age-related cognitive

   decline (Fjell & Walhovd, 2010). For instance, greater frontal and parietal gray matter volumes in older

   adulthood have been associated with higher cognitive reserve (Bartrés-Faz et al., 2009), and greater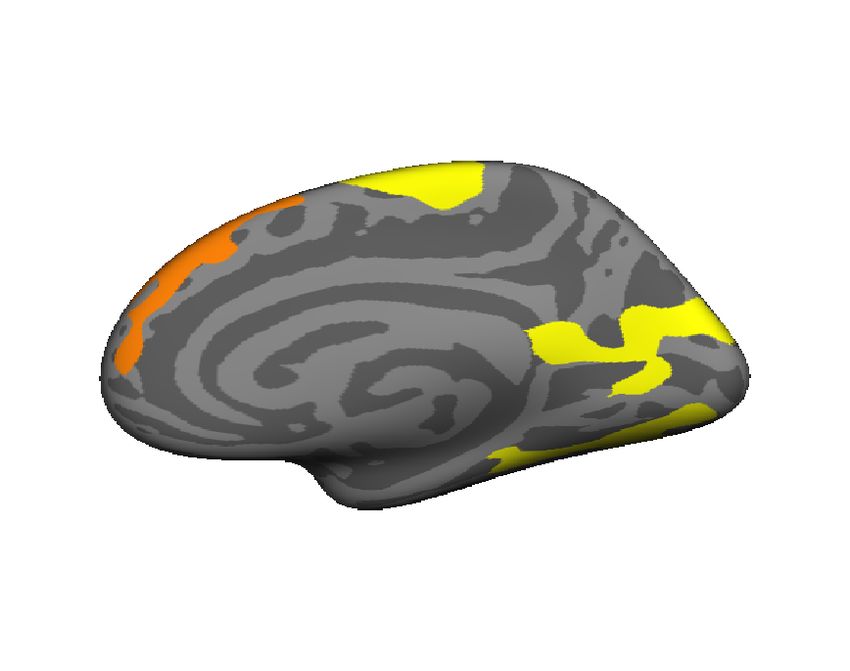
bioRxiv preprint doi: https://doi.org/10.1101/2020.03.14.991596. The copyright holder for this preprint (which was not peer-reviewed) is the
                              author/funder. It is made available under a CC-BY-NC-ND 4.0 International license.

                                                                                                                                        4

   cortical thickness has been linked to better fluid cognitive ability (Fjell et al., 2006). If the LC-NE system

   protects against age-related neurodegeneration, integrity of this system should be related to brain

   structure.

             To test this possibility, we examined the relationship between an in vivo measure of LC integrity

   and cortical thickness in older and younger adults. We quantified LC contrast using NM-sensitive MRI

   and used Freesurfer to assess thickness of the cortical surface. Based on previous evidence supporting a

   role of the LC in cognitive aging (Dahl et al., 2019; Hämmerer et al., 2018; Wilson et al., 2013), we

   hypothesized that individuals with higher LC contrast would have greater cortical thickness. Further, we

   predicted that this association would be strongest in brain regions that are recruited by NE modulated

   cognitive functions such as attention, cognitive flexibility, and memory (Corbetta et al., 2008; Robertson,

   2014; Sara & Bouret, 2012).

   2. Methods

   2.1. Participants

             Data were collected as part of the Berlin Aging Study II (BASE-II), a longitudinal study which

   aimed to characterize cognitive, neurobiological, social, and physiological factors that contribute to

   successful aging (Bertram et al., 2014; https://www.base2.mpg.de). NM-sensitive imaging was only

   performed during the study’s second MR measurement-timepoint on a MR-eligible subsample of the

   BASE-II cohort. Accordingly, those participants who underwent neuroimaging at the second timepoint

   were selected for this study (n = 323). These individuals were older and younger adults with no history of

   neurological disorder, psychiatric disorder, or head injury. All participants were right-handed with normal

   or corrected-to-normal vision. Data for eligible participants were acquired between December 2015 and

   June 2016 at the Max Planck Institute for Human Development in Berlin, Germany. The Ethics

   Committees of the German Psychological Society and of the Max Planck Institute for Human

   Development approved the MRI procedure. All participants provided written, informed consent prior to

   participation.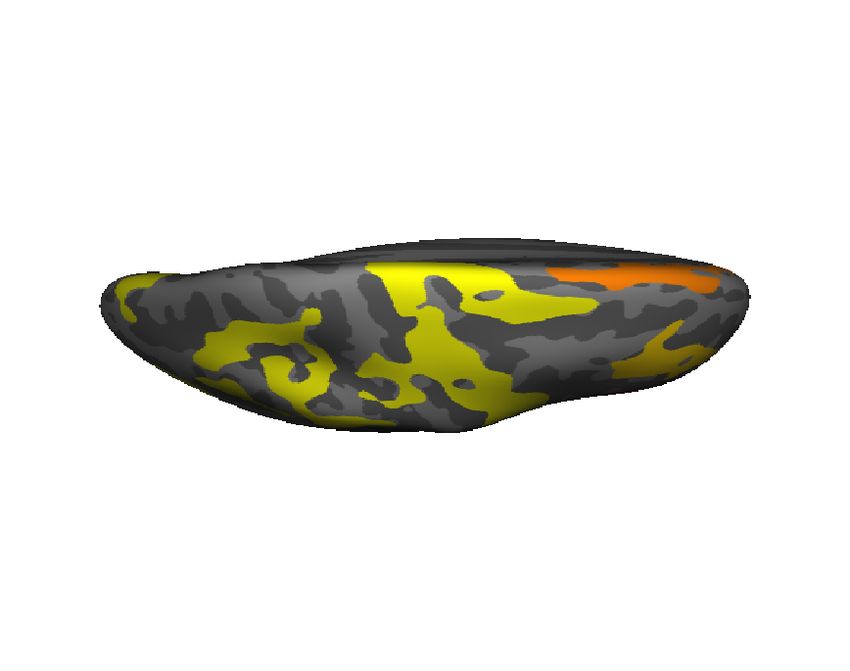
bioRxiv preprint doi: https://doi.org/10.1101/2020.03.14.991596. The copyright holder for this preprint (which was not peer-reviewed) is the
                              author/funder. It is made available under a CC-BY-NC-ND 4.0 International license.

                                                                                                                                        5

             Participants were excluded if they did not have complete neural (n = 19) or demographic (n = 1)

   data. Following visual inspection of NM-sensitive MR scans, additional participants were excluded due to

   incorrect scan positioning (n = 3), motion artefact (n = 2), or incorrect placement of the LC search space

   (n = 1; see Section 2.3). One additional participant was excluded for having an inadequate cortical

   reconstruction. The final sample, which is described in Table 1, consisted of 229 older adults (82 females)

   with a mean age of 72.3 years (SD = 4.10, range = 63-83) and 67 younger adults (22 females) with a

   mean age of 32.6 years (SD = 3.62, range = 25-40). Older and younger adults did not differ significantly

   in terms of gender distribution, χ2(1, 296) = 0.0917, p = 0.762, or mean years of education, t(104.4) = -

   0.347, p = 0.729. The older adult cohort had a significantly higher mean body mass index than did the

   younger adults, t(82.3) = 6.83, p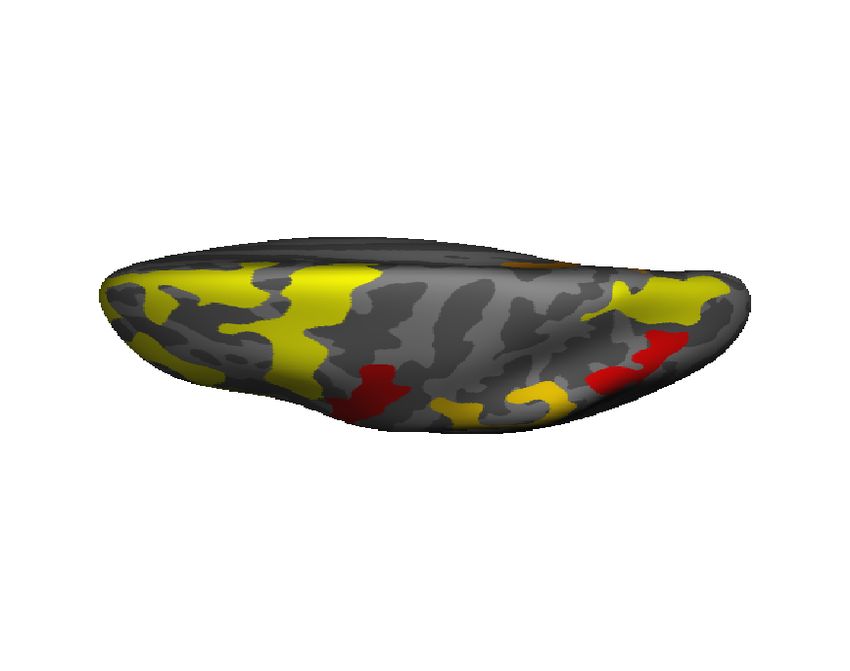
bioRxiv preprint doi: https://doi.org/10.1101/2020.03.14.991596. The copyright holder for this preprint (which was not peer-reviewed) is the
                              author/funder. It is made available under a CC-BY-NC-ND 4.0 International license.

                                                                                                                                        6

   2.2. MRI Data Acquisition

             MRI data were acquired using a 3-Tesla Siemens Magnetom Trio scanner with a 12-channel head

   coil. Only sequences used for the present analyses are described in this section.

             A three-dimensional, T1-weighted magnetization prepared rapid acquisition gradient-echo

   (MPRAGE) MRI sequence was applied in the sagittal plane (TR = 2500 ms, TE = 4.77 ms, TI = 1100 ms,

   scan flip angle = 7º; bandwidth = 140 Hz/pixel, field of view = 256 mm, number of slices = 192,

   isometric voxel size = 1 mm3, echo spacing = 10.9 ms; duration = 9:20 min).

             Based on the MPRAGE sequence, a NM-sensitive, high-resolution T1-weighted turbo spin echo

   sequence was applied by aligning the field of view orthogonally with respect to the anatomic axis of the

   respective participant’s brainstem (TR = 600 ms; TE = 11 ms; flip angle = 120º; bandwidth = 287

   Hz/pixel; field of view = 256 mm; voxel size = 0.5 x 0.5 x 2.5 mm3; echo spacing = 10.9 ms; duration = 2

   x 5:54 min). This two-dimensional sequence included ten axial slices and a 20% gap between slices in the

   z-dimension, thereby encompassing the entire pons. For some participants, fewer slices were acquired due

   to specific absorption rate limits being exceeded (for details, see Dahl et al., 2019; for a discussion, see

   Betts et al., 2019b). Four online averages during the sequence were performed, yielding two NM-sensitive

   scans per participant.

   2.3. LC Neuromelanin Signal Intensity Assessment

             We obtained LC contrast estimates using a semi-automated method of extracting LC signal

   intensity values, as described by Dahl et al. (2019). This approach yielded a LC location probability map

   that corresponded to published LC masks (Betts et al., 2017; Keren et al., 2009; Liu et al., 2019) as well

   as intensity estimates that corresponded to those determined through manual LC delineation. Using this

   approach, NM-sensitive scans were aligned and pooled across participants to generate a template

   brainstem volume (Figure 1A-C). The brainstem template was thresholded based on the signal intensity of

   a reference region in the neighboring dorsal pontine tegmentum (DPT), yielding a binarized LC search

   space (Figure 1D, 1E). After verifying that this search space encompassed the LC on a group level, this

   search space was applied as a mask on individual, template-coregistered brainstem volumes. The intensity
bioRxiv preprint doi: https://doi.org/10.1101/2020.03.14.991596. The copyright holder for this preprint (which was not peer-reviewed) is the
author/funder. It is made available under a CC-BY-NC-ND 4.0 International license.
7
and location of the maximum-intensity voxel within the masked region was extracted for each slice in the
z- (rostrocaudal) direction of each masked volume. Likewise, a binarized mask of the DPT reference
region was applied to template-coregistered brainstem volumes, and the intensity and location of the
maximum-intensity DPT voxel was extracted for each slice. LC contrast values were calculated for each
slice as a ratio (Betts et al., 2019b; Sasaki et al., 2006), according to the following formula:
(intensity of peak LC voxel – intensity of peak DPT voxel) / intensity of peak DPT voxel
LC contrast values for each hemisphere were assessed in each participant’s two brainstem
volumes separately and values were subsequently averaged across volumes. A structural equation model
was used to estimate an overall value of LC contrast for each participant by identifying the peak LC
contrast value across all MRI dimensions (Dahl et al., 2019); these estimates will henceforth be referred
to as overall LC contrast values. In addition, for analyses of contrast along the LC’s rostrocaudal axis, we
averaged LC contrast values across hemispheres within each slice to obtain slice-wise values of LC
contrast for each participant.bioRxiv preprint doi: https://doi.org/10.1101/2020.03.14.991596. The copyright holder for this preprint (which was not peer-reviewed) is the
author/funder. It is made available under a CC-BY-NC-ND 4.0 International license.
8
Figure 1. (A) Sagittal, (B) coronal, and (C) axial views of brainstem template volume (in red; generated
from all participants’ neuromelanin-sensitive scans) overlaid onto whole-brain template (generated from
all participants’ structural scans), with locus coeruleus (LC) probability map in common template space
(Dahl et al., 2019) displayed in yellow. Pontine reference region in common template space is displayed
in light gray. (D) Axial and (E) sagittal views of brainstem template volume. LC probability map (dark
yellow) is overlaid onto LC search space (light yellow), both of which are shown in common template
space. Pontine reference region in common template space is displayed in light gray. In (E), rostral and
caudal clusters within LC probability map are depicted in red and blue, respectively. (F) Boxplots
depicting LC contrast values along the LC’s rostrocaudal extent are displayed for older adults (OA; red)
and younger adults (YA; blue). The y-axis is arranged from most caudal (100) to most rostral (0) LC
segment. For visual clarity, outliers – defined as data points falling at least 1.5 times the interquartile
range below the 25% quantile or above the 75% quantile – are omitted here. A cluster-wise permutation
test was performed to identify clusters of slices where contrast differed significantly by age group. Circles
indicate a caudal cluster of slices where older adults had significantly greater contrast than younger
adults, and triangles indicate a rostral cluster of slices where there was a trend towards older adults having
lower contrast than younger adults.bioRxiv preprint doi: https://doi.org/10.1101/2020.03.14.991596. The copyright holder for this preprint (which was not peer-reviewed) is the
author/funder. It is made available under a CC-BY-NC-ND 4.0 International license.
9
2.4. Cortical Thickness Assessment
Cortical reconstruction for all T1-weighted anatomical images was performed with the Freesurfer
software suite (Version 5.3.0; https://surfer.nmr.mgh.harvard.edu). Freesurfer’s automated processing
pipeline has been described previously and entails motion correction, brain extraction, registration to
Talairach coordinates, bias field estimation and correction, and intensity normalization (Dale et al., 1999;
Fischl et al., 1999). These operations were applied, and pial and white matter surfaces were generated
based on intensity gradients across tissue classes. One researcher (SB) blinded to participants’ age
reviewed all resulting surfaces overlaid onto their respective anatomical images to identify segmentation
inaccuracies that could bias subsequent thickness estimates (McCarthy et al., 2015). Only segmentation
errors that did not resolve within 5 slices in any direction were manually corrected. A total of 122 (95
older adult, 27 younger adult) reconstructions contained inaccuracies on the pial surface and required that
voxels be manually erased or included. This corresponded to 41.5% of older adult and 40.3% of younger
adult participants’ reconstructions being manually edited. The proportion of edited reconstructions did not
differ by age group, χ2(1, N = 296) = 0.001, p = .974. For group analysis, all surfaces were tessellated and
registered to a spherical atlas. Neuroanatomical labels corresponding to sulcal and gyral regions were
automatically assigned to each vertex (Desikan et al., 2006; Fischl et al., 2004). At each vertex, cortical
thickness was calculated as the shortest distance between the pial and white matter surfaces (Fischl &
Dale, 2000). To probe relations between LC contrast and thickness of the entire cortical surface, a single,
global thickness value was computed for each participant by averaging thickness over the left and right
hemispheres and using the surface area of each hemisphere as a weighting factor.
2.5. Statistical Analysis
Sample characteristics of younger and older adults were compared using independent samples t-
tests with equal variances not assumed and chi-square independence tests. Previous studies have reported
age-related differences in LC contrast along the LC’s rostrocaudal extent (Betts et al., 2017; Dahl et al.,
2019; Liu et al., 2019; Manaye et al., 1995). To confirm that the slight sample difference in this study did
not change the topographic results reported in Dahl et al. (2019), we recomputed the nonparametric,bioRxiv preprint doi: https://doi.org/10.1101/2020.03.14.991596. The copyright holder for this preprint (which was not peer-reviewed) is the
author/funder. It is made available under a CC-BY-NC-ND 4.0 International license.
10
cluster-wise permutation test using the FieldTrip toolbox (Oostenveld et al., 2011;
http://www.fieldtriptoolbox.org) to identify clusters of slices where LC contrast differed significantly in
younger and older adults (Maris & Oostenveld, 2007). This entailed first performing an independent
samples t-test comparing LC contrast of older and younger adults for each slice where all subjects
exhibited reliable LC signal intensity (n=16 slices). Next, clusters were formed by grouping adjacent
slices where p < 0.05, and a cluster mass statistic for each cluster was calculated by summing the t-
statistic values of all slices comprising each cluster. A Monte Carlo method was used to generate a
permutation distribution of mass statistics for the summed t-statistics in each cluster under the assumption
of no effect of age group on LC contrast; specifically, in each of 100,000 permutations, age group labels
were shuffled, slice-wise independent samples t-tests were performed, and cluster mass statistic(s) were
computed. To implement a two-tailed test, we considered a cluster significant, if its cluster mass statistic
fell in the lowest or highest 2.5% of the respective permutation distribution. For each resulting cluster(s)
where LC contrast differed significantly between older and younger adults, we averaged LC contrast
values over the slices comprising each cluster to obtain cluster-specific LC contrast estimates for each
participant.
We used multiple linear regression to determine whether LC contrast was associated with global
cortical thickness and whether this association depended on age. Specifically, we constructed a regression
model with overall LC contrast and chronological age as predictors of global thickness. In addition, to
determine whether the effect of LC contrast on global thickness differed between older and younger
adults, we included the interaction effect of overall LC contrast and age group (coded as 1=older adults, -
1=younger adults) on global thickness as a predictor. Multiple linear regression analyses were
subsequently conducted to examine the effects of overall LC contrast and age on global thickness in each
age group separately. For ease of interpretation of results and comparison of regression coefficients across
age groups, each predictor was standardized by mean centering and dividing by its standard deviation;
thus, results of these analyses are reported as standardized regression coefficients and standard error
values. To determine whether associations between LC contrast and thickness differed based on LCbioRxiv preprint doi: https://doi.org/10.1101/2020.03.14.991596. The copyright holder for this preprint (which was not peer-reviewed) is the
author/funder. It is made available under a CC-BY-NC-ND 4.0 International license.
11
topography, we repeated these analyses for each set of cluster-specific LC contrast values. Since we did
not observe that intracranial volume scaled with global thickness in either age group, intracranial volume
was not included as a predictor in the regression models.2 In addition, exploratory analyses indicated
significant sex differences in overall LC contrast and global cortical thickness, so we performed
regression analyses accounting for sex and its interaction effects with other predictors on thickness
(Supplementary Methods, Section 1.1). All descriptive statistics and regression analyses were performed
in R (Version 3.6.2; R Core Team, 2019).
To examine locations on the cortical surface where LC contrast was associated with thickness, we
fit a series of vertex-wise general linear models using Freesurfer’s group analysis stream. For each age
group separately, we modeled cortical thickness at each vertex as a function of overall LC contrast while
regressing out the effect of chronological age. Resulting cortical maps were smoothed with a circularly
symmetric Gaussian kernel of 10 mm at full width half maximum, which was chosen to balance the
increase in signal-to-noise afforded by smoothing with the risk of false alarms that comes along with
larger smoothing kernels. Smoothed maps were thresholded to include only vertices where p < 0.05. We
then performed a cluster-wise correction for multiple comparisons using a Monte Carlo Null-Z simulation
with 10000 iterations (Hagler et al., 2006). In each iteration, a z-map was generated, smoothed, and
thresholded (p < .05), clusters were formed, and the size of the largest cluster was recorded. This resulted
in a distribution of the maximum cluster size under the null hypothesis, which was then used for cluster-
wise correction of the thresholded cortical maps. After clusters were identified in these maps, cluster-wise
p-values were computed which, for each cluster, reflected the probability of a cluster with its size or
larger occurring under the null hypothesis. A cluster-wise threshold of p < 0.05 was applied to include
only those clusters unlikely to appear by chance. Results were presented as statistical maps of clusters that
survived multiple comparison correction. To determine whether regionally-specific associations between
2
We repeated all analyses of global thickness accounting for effects of intracranial volume on thickness and found
only two changes to significant effects. First, the interaction effect between rostral LC contrast and age group on
global thickness became significant (β = 0.117, p = .045). Second, the negative association between caudal LC and
global thickness across the full sample became significant (β = -0.162, p = .020).bioRxiv preprint doi: https://doi.org/10.1101/2020.03.14.991596. The copyright holder for this preprint (which was not peer-reviewed) is the
author/funder. It is made available under a CC-BY-NC-ND 4.0 International license.
12
cortical thickness and LC contrast differed based on LC topography, we performed these vertex-wise
analyses again using each set of cluster-specific LC contrast values. In line with analyses of global
thickness, we conducted additional vertex-wise analyses accounting for sex (Supplementary Methods,
Section 1.2).
3. Results
3.1. LC contrast & global cortical thickness in the sample
Overall LC contrast was comparable in younger and older adults, t(88.6) = -1.24, p = .218, and
was not correlated with chronological age in either age group (Figure S1). As anticipated, global cortical
thickness was significantly lower in older than in younger adults, t(108.9) = -9.61, p < .001, and was
negatively correlated with age in both age groups (Figure S2). Exploratory analyses indicated significant
sex differences in both overall LC contrast and global cortical thickness (Figure S3). Consistent with the
findings of Dahl et al., 2019, we detected age group differences in LC contrast along the LC’s
rostrocaudal extent (Figure 1F). Specifically, we detected a cluster of 6 caudal slices where older adults
had greater LC contrast than younger adults, p = .002, as well as a cluster of 3 rostral slices where there
was a trend towards older adults having lower LC contrast than younger adults, p = .083.
3.2. Analysis of the association between LC contrast and global cortical thickness
Figure 2 depicts associations between LC contrast and cortical thickness in older and younger
adults. Multiple linear regression analysis indicated that overall LC contrast and chronological age
predicted 28.1% of the variance in global cortical thickness (Table 2A). In this analysis, we observed a
significant interaction effect between overall LC contrast and age group on global thickness, β = 0.138, p
= .009, indicating that the association between overall LC contrast and global thickness differed
significantly in older and younger adults. We then performed multiple linear regression analyses to
examine the association between overall LC contrast and global thickness for each age group separately,
after regressing out effects of age on thickness. This analysis in older adults indicated that overall LC
contrast and age together predicted 7.5% of the variance in global thickness (Table 2B), with higher
overall LC contrast, β = 0.216, p < .001, and lower age, β = -0.153, p = .018, being significant predictorsbioRxiv preprint doi: https://doi.org/10.1101/2020.03.14.991596. The copyright holder for this preprint (which was not peer-reviewed) is the
author/funder. It is made available under a CC-BY-NC-ND 4.0 International license.
13
of greater global thickness. In younger adults, neither overall LC contrast nor age was significantly
associated with global thickness (Table 2C).
To examine effects of LC topography on the association between LC contrast and thickness, we
performed analogous regression analyses using rostral and caudal values of LC contrast, respectively, as
predictors instead of overall LC contrast. An analysis of the full sample indicated that rostral LC contrast,
age, and the interaction between rostral LC contrast and age group predicted 28.6% of the variance in
global thickness (Table 3A). We observed a trend towards an interaction effect between rostral LC
contrast and age group, β = 0.103, p = .082. Although this result did not indicate a significant difference
in the rostral LC contrast-global thickness association by age group, for consistency with analyses of
overall LC contrast, we performed subsequent regression analyses in each age group separately. These
analyses demonstrated that the rostral LC-thickness association was driven by older adults, with rostral
LC contrast demonstrating a significantly positive association with global thickness in older adults, β =
0.214, p < .001 (Table 3B), but not in younger adults, β = 0.002, p = .990 (Table 3C).
A regression analysis examining the association between caudal LC contrast and global cortical
thickness indicated that, across the sample, caudal LC contrast, age, and the interaction effect between
caudal LC contrast and age group predicted 26.9% of the variance in global thickness (Table 4A). Across
the sample, there was a trend towards caudal LC contrast being negatively associated with global
thickness, β = -0.128, p = .071, and we also observed a marginally significant interaction effect between
caudal LC contrast and age group on global thickness, β = 0.135, p = .057. Post-hoc regression analyses
demonstrated that in older adults, caudal LC contrast was not significantly associated with global cortical
thickness after accounting for effects of age, β = 0.006, p = .922 (Table 4B). However, in younger adults,
higher caudal LC contrast significantly predicted lower global cortical thickness, β = -0.241, p = .046
(Table 4C). Results of supplementary analyses examining associations between LC contrast and global
thickness accounting for sex are included in the Supplementary Results, Section 2.4.1.bioRxiv preprint doi: https://doi.org/10.1101/2020.03.14.991596. The copyright holder for this preprint (which was not peer-reviewed) is the
author/funder. It is made available under a CC-BY-NC-ND 4.0 International license.
14
Age Group OA YA
A. Peak LC B. Rostral LC cluster C. Caudal LC cluster
Global cortical thickness (mm)
Global cortical thickness (mm)
Global cortical thickness (mm)
2.50 2.50 2.50
2.25 2.25 2.25
2.00 2.00 2.00
5 10 15 -0.1 0.0 0.1 0.2 0.3 -0.1 0.0 0.1 0.2 0.3
LC contrast LC contrast LC contrast
Figure 2. Associations between locus coeruleus (LC) contrast and global cortical thickness. Associations
with global cortical thickness are displayed separately for older adults (OA) and younger adults (YA) for
(A) overall LC contrast (reflecting contrast of peak LC voxels across x-, y-, and z-directions), (B) contrast
of the rostral LC, and (C) contrast of the caudal LC. Points indicate raw data. Model fit lines reflect the
association between LC contrast and global cortical thickness after regressing out the effect of
chronological age on thickness. Fit lines were calculated using the mean value of chronological age
within each age group.
Table 2
Results of multiple linear regression analyses examining the relationship between overall locus coeruleus
contrast and global cortical thickness
Predictor β SE 95% CI t p
A. Full sample, F(3, 292)=39.38, pbioRxiv preprint doi: https://doi.org/10.1101/2020.03.14.991596. The copyright holder for this preprint (which was not peer-reviewed) is the
author/funder. It is made available under a CC-BY-NC-ND 4.0 International license.
15
Table 3
Results of multiple linear regression analyses examining the relationship between rostral locus coeruleus
contrast and global cortical thickness
Predictor β SE 95% CI t p
2 2
A. Full sample, F(3, 292)=38.98, pbioRxiv preprint doi: https://doi.org/10.1101/2020.03.14.991596. The copyright holder for this preprint (which was not peer-reviewed) is the
author/funder. It is made available under a CC-BY-NC-ND 4.0 International license.
16
3.3. Analysis of the association between LC contrast and regional cortical thickness
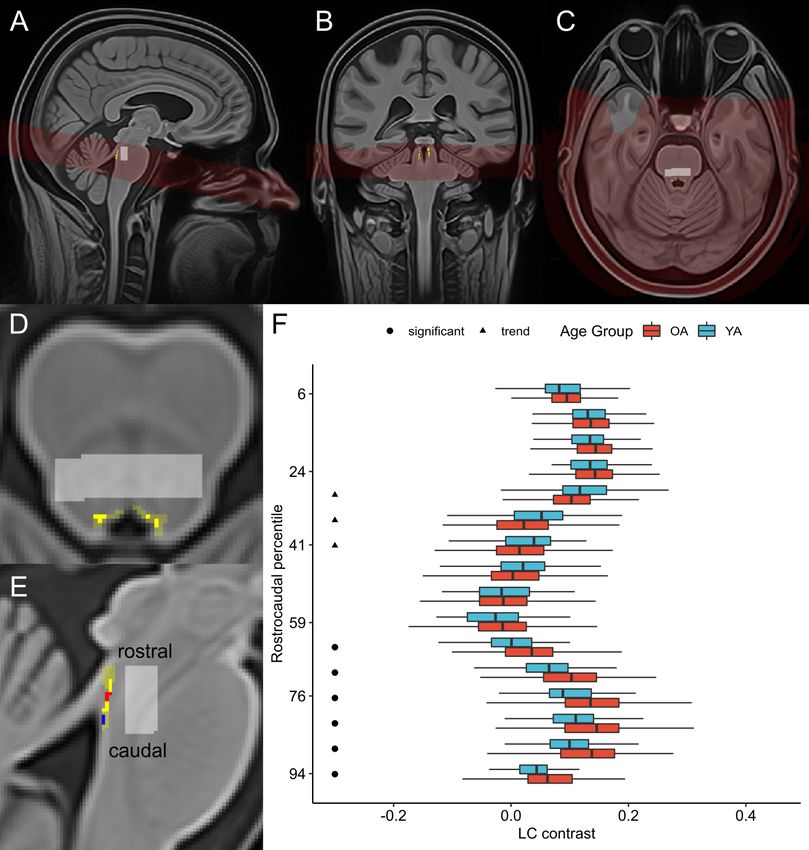
Using vertex-wise general linear model analyses, we detected a significant association between
overall LC contrast and cortical thickness in older adults in fourteen clusters on the cortical surface after
regressing out the effects of chronological age on thickness. Details of the size and location of these
clusters are presented in Table 5. As shown in Figure 3, these clusters included regions in frontal,
parietal, occipital, and temporal cortices. In each cluster, higher overall LC contrast predicted greater
cortical thickness in older adults. In younger adults, there were no clusters surviving multiple comparison
correction in which overall LC contrast was associated with cortical thickness. Uncorrected maps of
cortical vertices where, before multiple comparison correction, the overall LC contrast-cortical thickness
relationship was significant (vertex-wise p < 0.05) in older and younger adults are shown in Figure S4.
Table 5
Clusters on the cortical surface where overall locus coeruleus contrast was positively associated with
cortical thickness in older adults
Hemi- Size Peak vertex*
Region CWP**
sphere (mm2) X Y Z
Inferior parietal Left 5334.79 -44.4 -70.2 9.4 0.0001
Pars triangularis Left 2829.49 -47.9 34.8 -8.5 0.0001
Superior frontal Left 2590.56 -8.9 2.1 67.1 0.0001
Inferior parietal Left 1350.49 -43.3 -63.9 38.9 0.0013
Precentral Left 1039.94 -34.7 -21 49.8 0.0102
Superior temporal Left 910.53 -59.4 -12 -3.3 0.0244
Precentral Right 5682.29 40.8 -10.3 58.2 0.0001
Precuneus Right 2556.13 6.7 -57.4 32.3 0.0001
Inferior parietal Right 2260.05 37 -53.9 38.1 0.0001
Lateral occipital Right 1783.1 40.8 -85.3 -13 0.0001
Lingual Right 1602.38 20.4 -74.2 -8.8 0.0002
Pars orbitalis Right 1389.28 45.8 30.2 -12.3 0.0006
Banks of superior
temporal sulcus Right 1154.07 48.8 -40.6 12.5 0.0056
Rostral middle frontal Right 1007.6 31 41.6 20.2 0.0138
*Talairach coordinates of vertex with peak CWP value.
**Cluster-wise probability (CWP) resulting from cluster-wise Monte Carlo correction for multiple
comparisons, reflecting the probability of the cluster appearing by chance. Only clusters with CWPbioRxiv preprint doi: https://doi.org/10.1101/2020.03.14.991596. The copyright holder for this preprint (which was not peer-reviewed) is the
author/funder. It is made available under a CC-BY-NC-ND 4.0 International license.
17
Figure 3. Cortical regions exhibiting an association between overall locus coeruleus contrast and
thickness in older adults. Only clusters that survived cluster-wise correction for multiple comparisons
(cluster-wise probability (CWP) < .05) are shown.
Analogous vertex-wise analyses indicated that, after correction for multiple comparisons, rostral
LC contrast was positively associated with thickness in fifteen clusters on the cortical surface in older
adults (Table 6A). These clusters, displayed in Figure 4A, included portions of parietal, frontal, and
occipital cortices, and many overlapped with clusters where overall LC contrast was associated with
thickness in older adults. In younger adults, there were no cortical clusters in which rostral LC contrast
was significantly associated with thickness. In contrast, we found that caudal LC contrast was only
associated with thickness in one cluster on the cortical surface in older adults (Table 6B), and in this
cluster, caudal LC contrast was negatively associated with thickness. Furthermore, in younger adults,
caudal LC contrast was negatively associated with thickness in three clusters on the cortical surface; these
clusters included regions in parietal and occipital cortices and are described in Table S1. Figures S5 and
S6 depict maps of cortical vertices where there were significant (vertex-wise p < .05) associations
between rostral and caudal LC contrast, respectively, before cluster-wise correction for multiple
comparisons. Results of supplementary, vertex-wise analyses examining associations between LC
contrast and thickness accounting for sex are included in the Supplementary Results (Section 2.4.2).bioRxiv preprint doi: https://doi.org/10.1101/2020.03.14.991596. The copyright holder for this preprint (which was not peer-reviewed) is the
author/funder. It is made available under a CC-BY-NC-ND 4.0 International license.
18
Table 6
Clusters on the cortical surface where rostral (A) and caudal (B) locus coeruleus contrast were
associated with cortical thickness in older adults.
Hemi- Association Size Peak vertex*
2
Region sphere with thickness (mm ) X Y Z CWP**
A. Rostral LC contrast associated with thickness
Pars triangularis Left Positive 2633.77 -48.1 35.4 -6.3 0.0001
Caudal middle frontal Left Positive 2288.88 -39.6 11.4 51.4 0.0001
Superior frontal Left Positive 1958.83 -10.1 39.7 47.9 0.0001
Superior parietal Left Positive 1811.48 -10.2 -87.1 29.1 0.0001
Postcentral Left Positive 1472.1 -47 -25.4 33.9 0.0002
Precuneus Left Positive 1391.17 -8.2 -45.3 44.3 0.0005
Inferior parietal Left Positive 1091.19 -43.3 -64.6 40.3 0.007
Precentral Left Positive 974.53 -45.2 -10.9 39.7 0.0166
Precentral Right Positive 4717.72 -39.6 11.4 51.4 0.0001
Supramarginal Right Positive 3809.56 -48.1 35.4 -6.3 0.0001
Lateral occipital Right Positive 2799.21 -8.2 -45.3 44.3 0.0001
Isthmus cingulate Right Positive 2070.17 -43.3 -64.6 40.3 0.0001
Rostral middle frontal Right Positive 1424.36 -45.2 -10.9 39.7 0.0002
Superior frontal Right Positive 1338.58 -47 -25.4 33.9 0.0008
Pars triangularis Right Positive 1096.91 -10.2 -87.1 29.1 0.0047
B. Caudal LC contrast associated with thickness
Rostral middle frontal Left Negative 857.23 -19.1 57.7 -11.9 0.0351
Note. CWP = cluster-wise probability; LC = locus coeruleus.
*Talairach coordinates of vertex with peak CWP value.
**Cluster-wise probability (CWP) resulting from cluster-wise Monte Carlo correction for multiple
comparisons, reflecting the probability of the cluster appearing by chance. Only clusters with CWPbioRxiv preprint doi: https://doi.org/10.1101/2020.03.14.991596. The copyright holder for this preprint (which was not peer-reviewed) is the
author/funder. It is made available under a CC-BY-NC-ND 4.0 International license.
19
A
- CWP +
0.0001 0.05 0.05 0.0001
B
Figure 4. Cortical regions demonstrating an association between rostral (A) and caudal (B) locus
coeruleus (LC) contrast and thickness in older adults. Warmer colors indicate clusters with a positive
association between LC contrast and cortical thickness, and cooler colors indicate clusters with a negative
association. Only clusters that survived cluster-wise correction for multiple comparisons (cluster-wise
probability (CWP)bioRxiv preprint doi: https://doi.org/10.1101/2020.03.14.991596. The copyright holder for this preprint (which was not peer-reviewed) is the
author/funder. It is made available under a CC-BY-NC-ND 4.0 International license.
20
thickness, one aspect of brain structure and a documented brain indicator of cognitive ability in older
adulthood (Fjell et al., 2006; Lee et al., 2016). Using NM-sensitive MRI to estimate LC neuronal integrity
in vivo as a contrast ratio, we found that in older but not in younger adults, having higher contrast of the
LC was associated with greater average thickness of the cortical surface, even after regressing out effects
of age on thickness. When we examined where on the cortical surface this association was most evident in
older adults, we found widespread regions in parietal, frontal, and occipital cortices in which higher LC
contrast was associated with greater thickness. Together, these findings constitute novel evidence for a
link between LC neuronal integrity and brain structure.
What biological processes might the relationship between LC contrast and cortical thickness
reflect? NE can have either protective or deleterious effects upon the whole brain. Many of its protective
effects, particularly against causes of age-related neurodegeneration and neuropathology, are mediated by
b-adrenergic receptors, which require higher levels of NE for activation than a-adrenergic receptors
(Salgado et al., 2012). For instance, both NE and the β-adrenoreceptor agonist isoproterenol facilitate
clearance of beta-amyloid – one marker of cognitive aging – by promoting microglial migration and
phagocytosis (Heneka et al., 2010). NE also promotes anti-inflammatory responses (Feinstein et al., 2016)
and the release of neurotrophic factors (Braun et al., 2014), mainly via b-adrenergic receptor activation.
Finally, NE administration activates hippocampal neurogenic precursors in the process of hippocampal
neurogenesis (Jhaveri et al., 2010), and this depends on b-adrenergic receptor activation (Jhaveri et al.,
2014). Thus, having greater LC neuronal integrity could lead to greater levels of NE release, allowing
these beneficial downstream effects of b-adrenergic receptor activation to be realized. Furthermore,
Mather et al. (2016) proposed that the high levels of NE required for b-adrenergic activity can be
supported by cortical ‘hot spot’ regions, where high glutamatergic activity stimulates even greater NE
release when the LC is activated. Having greater LC integrity could help maintain the ability to stimulate
these hot spots (for instance, during engaged cognitive processing), leading to further b-adrenergically-
mediated protective effects. Through these processes, having relatively preserved LC integrity in olderbioRxiv preprint doi: https://doi.org/10.1101/2020.03.14.991596. The copyright holder for this preprint (which was not peer-reviewed) is the
author/funder. It is made available under a CC-BY-NC-ND 4.0 International license.
21
adulthood could lead to greater protection against neuropathology and neurodegeneration to ultimately
preserve brain structure.
Another clue to potentially underlying processes comes from the associations we found between
LC contrast and thickness of regions in frontal, parietal, and occipital cortices. Many of the identified
regions belong to sensory, association, and prefrontal cortices, all of which are innervated by the LC
(Bouret & Sara, 2002; Hirschberg et al., 2017). Critically, a number of regions where thickness was
associated with LC contrast are contained within the brain’s frontoparietal network (FPN). The FPN
constructs a modality-independent priority map of the environment (Ptak, 2012) and maintains flexible
representations of internally- and externally-guided goals (Dumontheil et al., 2011; Zanto & Gazzeley,
2013). A recent study demonstrated that, in humans, frontoparietal regions show strong resting-state
functional connectivity with the LC (Jacobs et al., 2018), and during arousal and attention, phasic LC
activity can promote neural gain, modulating signal-to-noise ratio of neuronal activity within the FPN to
direct processing toward salient and/or task-relevant stimuli (Aston-Jones & Cohen, 2005; Bouret & Sara,
2005; Corbetta et al., 2008). The FPN also provides top-down influences on visual cortex during the
control of spatial attention (Hopfinger et al., 2000; Macaluso, 2010), and this link may explain why we
observed associations between LC contrast and thickness in occipital brain regions.
One possibility is thus that reduced or impaired LC-NE activity later in life, resulting from
reduced LC neuronal integrity, constrains cortical activity, manifesting as impairments in selective
attention, memory performance, and other cognitive processes (Corbetta et al., 2008). Reduced
noradrenergic signaling within brain regions implicated in NE-mediated functions, such as the FPN but
also including occipital and temporal regions, could reduce NE’s protective effects in these brain regions,
eventually promoting gray matter atrophy. On the other hand, preserved LC integrity could maintain the
NE available to act on the FPN and other brain regions and, concurrently, more of NE’s protective effects
being realized throughout the cortex.
In particular, a connection between LC integrity and structural integrity of the FPN offers testable
hypotheses about the LC-NE system’s neuroprotective role in aging. One question is whether age-relatedbioRxiv preprint doi: https://doi.org/10.1101/2020.03.14.991596. The copyright holder for this preprint (which was not peer-reviewed) is the
author/funder. It is made available under a CC-BY-NC-ND 4.0 International license.
22
changes in LC structure and activity relate to changes in the capacity for selective attention. One recent
study demonstrated that LC activity during arousal was effective in both older and younger adults at
increasing task-relevant representations; however, in the same study, arousal also increased functional
connectivity between the LC and FPN less in older than in younger adults (Lee et al., 2018). In contrast, a
recent study demonstrated that during rest, functional connectivity between the LC and frontoparietal
brain regions was greater in older than in younger adults (Jacobs et al., 2018), raising the question of how
the LC and FPN interact to dictate selective processing. Understanding the LC-FPN relationship will be
an important aim for future research, as noradrenergic modulation of the FPN may have consequences for
processes such as sensory perception, working memory, and episodic memory.
Our findings also point to a potentially important role of LC topography, as contrast of the rostral
LC – but not the caudal LC – demonstrated associations with thickness in older adulthood. Previous work
has demonstrated that cortical and thalamic projections from the LC – particularly those to frontal,
sensory, and occipital cortices – tend to arise in its more rostral portion (Waterhouse et al., 1983;
Waterhouse et al., 1993). Likewise, projections from the LC to the basal forebrain tend to originate more
from rostral than from caudal LC (Espana & Berridge, 2006). Thus, greater rostral LC integrity could lead
to more of NE’s neuroprotective effects being realized in cortical regions. Supporting this idea, Dahl et
al., (2019) found that rostral, but not caudal, LC contrast was associated with memory performance in
older adults in a largely overlapping sample from BASE-II. Furthermore, consistent with findings of Liu
et al., 2019, we found that rostral but not caudal LC exhibited age-related decline in contrast, suggesting
that rostral LC may be the portion of the LC most critical for brain outcomes in older adulthood.
On the other hand, contrast of the caudal LC demonstrated markedly different associations with
thickness compared to contrast of the rostral LC. Whereas in older adults caudal LC contrast was largely
unrelated to thickness, it was negatively associated with thickness of the cortical surface in younger
adults, particularly in parietal and occipital brain regions. As previous studies have not reported
associations between cognition and integrity of the more caudal portion of the LC, we take caution in
interpreting these associations. Further, NM-based MRI may be less sensitive in younger adults due tobioRxiv preprint doi: https://doi.org/10.1101/2020.03.14.991596. The copyright holder for this preprint (which was not peer-reviewed) is the
author/funder. It is made available under a CC-BY-NC-ND 4.0 International license.
23
less LC neuromelanin accumulation compared to older adults (Hämmerer et al., 2018; Mann & Yates,
1974). Nevertheless, we believe the topographical differences we observed in LC contrast – and their
differential age-specific associations with cortical thickness – warrant further investigation, as over-
activation of the LC in stressed younger adults may be associated with negative effects on cortical health,
perhaps due to suppression of parasympathetic activity (Mather et al., 2017).
The present study has several limitations. Due to the smaller size of the younger adult cohort
relative to that of the older adult cohort, results of analyses performed across the entire sample are likely
driven by older adults. It is also possible that additional effects of LC contrast on thickness in younger
adults would emerge with a larger younger adult sample. In addition, recent studies have identified
external factors such as time of day a that may explain some portion of variability in measurements of
brain structure (Karch et al., 2019), and we cannot rule out the potential influence of such factors on
cortical thickness estimates in the present study. Finally, in terms of characteristics of the sample, both the
younger and older adults who participated in BASE-II constituted a highly educated convenience sample
(Bertram et al., 2014), meaning that results may not generalize to the general population.
We have offered hypotheses about processes underlying a relationship between LC neuronal
integrity and cortical thickness, but these possibilities remain to be tested. In addition, it remains to be
understood precisely what is reflected by these MRI-based measures of LC contrast. Measures of LC
contrast are commonly interpreted as indices of LC neuronal integrity based on findings of Keren et al.
(2015) demonstrating that locations of high NM-sensitive MRI contrast correspond to locations of NM-
containing cells in the LC. One open question is whether and why having more NM is neuroprotective in
older adults. One additional possibility is that the LC contrast measure reflects other features of
noradrenergic neurons which also yield T1-shortening effects (e.g., water content), rather than
neuromelanin (Watanabe et al., 2019a; Watanabe et al., 2019b). Furthermore, there has not yet been much
work demonstrating how MRI-based LC contrast measures relate to LC function. One recent study
demonstrated that LC contrast was associated with LC activity during goal-relevant processing (Clewett
et al., 2018). Another recent study found that functional connectivity between LC and FPN brain regionsbioRxiv preprint doi: https://doi.org/10.1101/2020.03.14.991596. The copyright holder for this preprint (which was not peer-reviewed) is the
author/funder. It is made available under a CC-BY-NC-ND 4.0 International license.
24
during an auditory oddball task was associated with LC contrast (Mather et al., 2020). However, more
work is needed to understand the LC contrast-LC function relationship.
To conclude, we found that LC MRI contrast, particularly that of the rostral LC, was associated
with thickness of widespread cortical regions in older but not in younger adults. These findings constitute
novel evidence for a link between LC contrast and brain structure in older adulthood and are consistent
with previous reports of LC contrast predicting cognition in older adulthood. Furthermore, our results
provide strong motivation for studying the relationship between the LC and FPN in older adulthood, as
these brain regions are implicated in attention and memory functions that undergo regular age-related
decline. We believe that these findings will inform future studies of the mechanisms by which the LC-NE
system protects against neuropathology and cognitive decline in aging.
Acknowledgements
Support for BASE-II was provided by the German Federal Ministry of Education and Research
(Bundesministerium für Bildung and Forschung, BMBF) under grants #16SV5536 K, #16SV5537,
#16SV5538, and #16SV5837, #01UW070 and #01UW0808. Additional support was provided by all six
participating institutions in Germany: Max Planck Institute for Human Development, Humboldt-
Universität zu Berlin, Charité-Universitätsmedizin Berlin, Max Planck Institute for Molecular Genetics,
Socio-Economic Panel at the German Institute for Economic Research, Universität zu Lübeck, and
Universität Tübingen. BASE-II is also part of the BMBF funded EnergI consortium (01GQ1421B).
This material is based on work supported by the National Science Foundation Graduate Research
Fellowship Program under Grant No. DGE-1842487. Any opinions, findings, and conclusions or
recommendations expressed in this material are those of the author(s) and do not necessarily reflect the
views of the National Science Foundation. SLB’s work was also supported by a Graduate Study
Scholarship from the German Academic Exchange Service (DAAD). MJD was a fellow of the Max
Planck Research School on the Life Course and received support from the Sonnenfeld-Foundation.
MWB’s work was supported by the German Research Foundation (DFG, WE 4269/5-1) and an Early
Career Research Fellowship from the Jacobs Foundation. MM’s work was supported by an AlexanderbioRxiv preprint doi: https://doi.org/10.1101/2020.03.14.991596. The copyright holder for this preprint (which was not peer-reviewed) is the
author/funder. It is made available under a CC-BY-NC-ND 4.0 International license.
25
von Humboldt fellowship and by National Institutes of Health grant R01AG025340. We thank Michael
Krause and Yana Fandakova for assistance with cluster computing, as well as Carsten Finke and Andrei
Irimia for useful discussions.
Disclosure Statement
The authors have no conflicts of interest to disclose.
Data Statement
Data will be shared upon approved request to the BASE-II Steering Committee
(https://www.base2.mpg.de/en/project-information/team).bioRxiv preprint doi: https://doi.org/10.1101/2020.03.14.991596. The copyright holder for this preprint (which was not peer-reviewed) is the
author/funder. It is made available under a CC-BY-NC-ND 4.0 International license.
26
References
Aston-Jones, G., Cohen, J.D., 2005. An Integrative Theory of Locus Coeruleus-Norepinephrine Function:
Adaptive Gain and Optimal Performance. Annu. Rev. Neurosci. 28, 403–450.
https://doi.org/10.1146/annurev.neuro.28.061604.135709
Bartrés-Faz, D., Solé-Padullés, C., Junqué, C., Rami, L., Bosch, B., Bargalló, N., Falcón, C., Sánchez-
Valle, R., Molinuevo, J.L., 2009. Interactions of cognitive reserve with regional brain anatomy and
brain function during a working memory task in healthy elders. Biol. Psychol. 80, 256–259.
https://doi.org/10.1016/j.biopsycho.2008.10.005
Berridge, C.W., Waterhouse, B.D., 2003. The locus coeruleus-noradrenergic system: modulation of
behavioral state and state-dependent cognitive processes. Brain Res. Rev. 42, 33–84.
https://doi.org/https://doi.org/10.1016/S0165-0173(03)00143-7
Bertram, L., Boeckenhoff, A., Demuth, I., Duezel, S., Eckardt, R., Li, S., Lindenberger, U., Pawelec, G.,
Siedler, T., Wagner, G.G., Steinhagen-Thiessen, E., 2014. Cohort Profile: The Berlin Aging Study II
(BASE-II). Int. J. Epidemiol. 43, 703–712. https://doi.org/10.1093/ije/dyt018
Betts, M.J., Cardenas-Blanco, A., Kanowski, M., Jessen, F., Düzel, E., 2017. In vivo MRI assessment of
the human locus coeruleus along its rostrocaudal extent in young and older adults. Neuroimage 163,
150–159. https://doi.org/10.1016/j.neuroimage.2017.09.042
Betts, M.J., Cardenas-blanco, A., Kanowski, M., Spottke, A., Teipel, S.J., Kilimann, I., Jessen, F., Düzel,
E., 2019a. Locus coeruleus MRI contrast is reduced in Alzheimer’s disease dementia and correlates
with CSF Amyloid-beta levels. Alzheimer’s Dement. 11, 281–285.
https://doi.org/10.1016/j.dadm.2019.02.001
Betts, M.J., Kirilina, E., Otaduy, M.C.G., Ivanov, D., Acosta-Cabronero, J., Callaghan, M.F., Lambert,
C., Cardenas-Blanco, A., Pine, K., Passamonti, L., Loane, C., Keuken, M.C., Trujillo, P., Lüsebrink,
F., Mattern, H., Liu, K.Y., Priovoulos, N., Fliessbach, K., Dahl, M.J., Maaß, A., Madelung, C.F.,
Meder, D., Ehrenberg, A.J., Speck, O., Weiskopf, N., Dolan, R., Inglis, B., Tosun, D., Morawski,
M., Zucca, F.A., Siebner, H.R., Mather, M., Uludag, K., Heinsen, H., Poser, B.A., Howard, R.,
Zecca, L., Rowe, J.B., Grinberg, L.T., Jacobs, H.I.L., Düzel, E., Hämmerer, D., 2019b. Locus
coeruleus imaging as a biomarker for noradrenergic dysfunction in neurodegenerative diseases.
Brain 142, 2558–2571. https://doi.org/10.1093/brain/awz193
Bouret, S., Sara, S.J., 2002. Locus coeruleus activation modulates firing rate and temporal organization of
odour-induced single-cell responses in rat piriform cortex. Eur. J. Neurosci. 16, 2371–2382.
https://doi.org/10.1046/j.1460-9568.2002.02413.x
Bouret, S., Sara, S.J., 2005. Network reset: A simplified overarching theory of locus coeruleus
noradrenaline function. Trends Neurosci. 28, 574–582. https://doi.org/10.1016/j.tins.2005.09.002
Braun, D., Madrigal, J.L.M., Feinstein, D.L., 2014. Noradrenergic regulation of glial activation:
molecular mechanisms and therapeutic implications. Curr. Neuropharmacol. 12, 342–52.
https://doi.org/10.2174/1570159X12666140828220938
Clewett, D. V, Lee, T., Greening, S., Ponzio, A., Margalit, E., Mather, M., 2016. Neuromelanin marks the
spot: identifying a locus coeruleus biomarker of cognitive reserve in healthy aging. Neurobiol.
Aging 37, 117–26. https://doi.org/10.1016/j.neurobiolaging.2015.09.019
Clewett, D., Huang, R., Velasco, R., Lee, T.-H., Mather, M., 2018. Locus coeruleus activity strengthens
prioritized memories under arousal. J. Neurosci. 38, 2097–17.
https://doi.org/10.1523/JNEUROSCI.2097-17.2017
Corbetta, M., Patel, G., Shulman, G.L., 2008. The reorienting system of the human brain: From
environment to theory of mind. Neuron 58, 306–324.
https://doi.org/https://doi.org/10.1016/j.neuron.2008.04.017
Dahl, M.J., Mather, M., Düzel, S., Bodammer, N.C., Lindenberger, U., Kühn, S., Werkle-Bergner, M.,
2019. Rostral locus coeruleus integrity is associated with better memory performance in older
adults. Nat. Hum. Behav. 3, 1203–1214. https://doi.org/10.1038/s41562-019-0715-2You can also read